

Abstract
IMPORTANCE
The neural systems that confer risk or vulnerability for developing familial depression, and those that protect against or confer resilience to becoming ill, can be disentangled from the effects of prior illness by comparing brain imaging measures in previously ill and never ill persons who have either a high or low familial risk for depression.
OBJECTIVE
To distinguish risk and resilience endophenotypes for major depression from the effects of prior lifetime illness.
DESIGN, SETTING, AND PARTICIPANTS
We used functional magnetic resonance imaging to measure and compare brain function during performance of an attentional, self-regulatory task across a large sample of multigenerational families ascertained specifically to be at either high or low risk for developing major depression. Study procedures were performed in a university setting. A total of 143 community participants were followed up prospectively for more than 20 years in a university setting. The sample was enriched with persons who were at higher or lower familial risk for developing depression based on being biological offspring of either a clinical sample of persons with major depression or a community control sample of persons with no discernible lifetime illness.
MAIN OUTCOMES AND MEASURES
Task-related change in blood oxygen level–dependent functional magnetic resonance imaging signal.
RESULTS
A risk endophenotype included greater activation of cortical attention circuits. A resilience endophenotype included greater activation of the dorsal anterior cingulate cortex. The effects of prior lifetime illness were common to both risk groups and included greater deactivation of default-mode circuits.
CONCLUSIONS AND RELEVANCE
These findings identify neural systems that increase risk for depression, those that protect from illness, and those that endure following illness onset, and they suggest circuits to target for developing novel preventive and therapeutic interventions.
Major depressive disorder(MDD), one of the most prevalent and debilitating illnesses in the world,1–3 is frequently transmitted across family generations.4–6 Off-spring of persons with MDD have a 3- to 5-fold increased lifetime risk for developing MDD, yielding heritability estimates that range from 40% to 70%.7,8 Familial MDD is more severe, more recurrent, and more resistant to treatment than nonfamilial MDD,9–13 and it tends to have an earlier age at onset that usually begins between 15 and 25 years. On average, it presents earlier in female than male family members, and it is often heralded by an anxiety disorder in childhood.14–16
An endophenotype is a measurable entity, unseen by the naked eye, lying along the causal chain that leads from vulnerability genes and epigenetic determinants to their overt physical and behavioral manifestations. Brain-based endophenotypes that confer risk of developing MDD or that protect against it are important to identify because they would help in developing new and more individualized treatment and prevention programs for MDD.17 One set of operational criteria previously proposed to identify risk endophenotypes have included showing that the putative endophenotype is (1) associated with an illness in the general population, (2) familial, (3) state-independent, and (4) found in unaffected family members of ill persons at a higher rate than in the general population.18 These criteria require that endophenotypes be sought and demonstrated in multigeneration populations at high or low familial risk for illness, including individuals who have a lifetime history of illness and those who have never been ill.
In a large, multigenerational family study of persons ascertained specifically to be either at high risk (HR) or low risk (LR) for developing MDD, we have adapted these same general criteria to identify functional brain endophenotypes that conferred either risk or resilience for MDD and that were distinct from the state effects of illness. (1) Risk endophenotypes have been defined as brain activations present significantly more in the HR group, in both those who did and those who did not have a lifetime history of illness (with illness including either prior MDD or anxiety disorder), compared with the LR group. (2) Resilience endophenotypes conceptually should be present significantly more often in HR individuals who have escaped illness19 and should be distinguishable from simple health competence that characterizes LR individuals who have never been ill.20 We therefore have defined resilience endophenotypes to be brain activations that are more prominent in HR individuals who have never been ill than in LR individuals who have never been ill and that do not contain portions of the risk endophenotype of the HR group. (3) Effects of lifetime illness have been defined as brain activations manifesting significantly more in persons with a lifetime history of MDD or anxiety than in persons without a lifetime history of illness, regardless of familial risk status.
We previously identified, in 131 participants from our current sample, a morphological risk endophenotype for MDD that comprised thinning of the cortex of the lateral aspect of the right hemisphere and the mesial wall of the left hemisphere.21 Its endophenotype status was supported by its presence in HR participants regardless of whether they had ever been ill with MDD or anxiety disorder. Individuals who had the endophenotype, but who had never been ill, experienced inattention in proportion to the magnitude of cortical thinning, and further analyses suggested that inattention mediated the relationship of the endophenotype with the risk for developing MDD. Accordingly, in the present study, we used a functional magnetic resonance imaging (fMRI) task that activated networks subserving attention in particular22 and self-regulatory capacities more generally (eAppendix 1 in the Supplement),23 given the importance that impaired regulatory control of emotion and cognition is thought to have in the genesis of MDD,24–26 and given evidence that shared neural resources likely regulate both cognition and emotion.23
We hypothesized that greater activation in the dorsal and pregenual anterior cingulate cortex during the resolution of cognitive interference and deployment of self-regulatory capacities27,28 would confer resilience to developing MDD in HR persons, whereas reduced activation of these regions would produce more illness in those at risk29 and would be identified as a lifetime illness effect. Because the cortical thinning endophenotype has been shown to reduce cortical attentional reserve,21 we also hypothesized that the functional MRI risk endophenotype for MDD would include greater activation of frontal, parietal, and temporal cortices to compensate for attentional problems and would maintain normal behavioral performance on this attentional task. We also assessed the risk, resilience, and illness effects in error-related activity. This activity, which is usually greater in the anterior cingulate cortex when responding in-correctly than when responding correctly to stimuli that generate cognitive interference, supports heightened performance monitoring and stronger biasing of lower-order processing following errors, thereby improving subsequent task performance.30,31 We hypothesized that error-related activity would be associated with risk, resilience, and prior illness in ways similar to interference-related activity.
Methods
Further details on the ascertainment and characterization of the sample of participants, the theoretical underpinnings of the fMRI task, the pulse sequences, the image processing techniques, and statistical the analyses are provided in eAppendix 1 in the Supplement.
All study procedures were approved by the institutional review boards of Yale University in New Haven, Connecticut, and the New York State Psychiatric Institute in New York. Participants provided written, informed consent to participate; for minors, parents provided informed consent, and participants provided written assent to participate.
Participants
We obtained usable fMRI scans from 143 individuals 7 to 54 years age who belonged to the second or third generation of a 3-generation cohort followed through 5 waves of clinical assessments over more than 20 years, thereby ensuring an excellent, prospectively acquired knowledge of the psychiatric history of all participants (Table 1).4 The first generation (“G1”) comprised 2 groups of adults: one group of adults who were clinically ascertained during treatment of moderate to severe, recurrent, and functionally debilitating MDD and another group of matched control adults from the same community who had no discernible lifetime history of depression or other psychiatric illness. The second generation (“G2”) comprised the biological offspring of G1, and the third generation (“G3”) comprised the offspring of G2. The HR group, defined as those in G2 or G3 who were biological descendants of the patient group in G1, contained 83 individuals (14 children, defined as younger than 18 years of age, and 69 adults). The LR group, defined as those in G2 or G3 who were biological descendants of the control sample in G1, contained 60 individuals (26 children and 34 adults). None of the participants had a lifetime history of bipolar disorder.
Table 1.
Demographic and Clinical Characteristics
| Characteristic | All LR Participants(n = 60) | All HR Participants(n = 83) | Statistic | P Value | No MDD or Anxiety Disorder
|
Statistic | P Value | Lifetime MDD or Anxiety Disorder
|
Statistic | P Value | |||||
|---|---|---|---|---|---|---|---|---|---|---|---|---|---|---|---|
| LR Participants(n = 37) | HR Participants(n = 22) | LR Participants(n = 23) | HR Participants(n = 61) | ||||||||||||
| Age, mean (SD), y | 25.7 (13.2) | 33.1 (12.7) | t141 = 3.4 | .001 | 23.5 (13.2) | 26.9 (15.7) | t57 = 0.88 | .38 | 29.3 (12.6) | 35.4 (10.7) | t82 = 2.22 | .03 | |||
|
| |||||||||||||||
| z Score,a mean (SD) | |||||||||||||||
|
| |||||||||||||||
| Depression severity | −0.11 (0.76) (n = 54) | 0.08 (1.14) (n = 72) | t124 = 1.04 | .30 | −0.32 (0.47) (n = 32) | −0.41 (0.92) (n = 17) | t47 = −0.50 | .62 | 0.20 (0.98) (n = 22) | 0.23 (1.16) (n = 55) | t75 = 0.11 | .92 | |||
|
| |||||||||||||||
| Anxiety severity | −0.10 (1.12) (n = 53) | 0.07 (0.89) (n = 72) | t123 = 0.96 | .34 | −0.39 (0.76) (n = 31) | −0.13 (0.84) (n = 17) | t46 = 1.06 | .30 | 0.30 (1.42) (n = 22) | 0.14 (0.91) (n = 55) | t75 = −0.61 | .54 | |||
|
| |||||||||||||||
| ADHD severity score,b mean (SD) | 6.4 (5.8) (n = 53) | 11.1 (7.7) (n = 74) | t125 = 3.7 | .003 | 6.5 (5.5) (n = 32) | 9.35 (7.89) (n = 20) | t50 = 1.55 | .07 | 6.4(6.3) (n = 21) | 11.1 (7.7) (n = 54) | t73 = 2.83 | .006 | |||
|
| |||||||||||||||
| GAS score, mean (SD) | 80.4 (7.8) (n = 60) | 76.4 (9.6) (n = 79) | t137 = −2.59 | .01 | 81.9 (6.8) (n = 37) | 85.7 (4.3) (n = 20) | t55 = 2.28 | .03 | 77.9 (8.8) (n = 23) | 73.2 (8.8) (n = 59) | t80 = 2.13 | .04 | |||
|
| |||||||||||||||
| Sex, No. | |||||||||||||||
|
| |||||||||||||||
| Female | 34 | 46 |
|
.88 | 17 | 6 |
|
.16 | 17 | 40 |
|
.47 | |||
|
|
|
|
|||||||||||||
| Male | 26 | 37 | 20 | 16 | 6 | 21 | |||||||||
|
| |||||||||||||||
| Generation, No. | |||||||||||||||
|
| |||||||||||||||
| Second | 26 | 58 |
|
.002 | 14 | 11 |
|
.36 | 12 | 47 |
|
.03 | |||
|
|
|
|
|||||||||||||
| Third | 34 | 25 | 23 | 11 | 11 | 14 | |||||||||
|
| |||||||||||||||
| Age >18 y, No. | 34 | 69 |
|
<.001 | 15 | 13 |
|
.17 | 19 | 56 |
|
.22 | |||
|
| |||||||||||||||
| Lifetime MDD, No. | 12 | 47 |
|
<.001 | 0 | 0 | NA | NA | 12 | 47 |
|
.03 | |||
|
| |||||||||||||||
| Current MDD, No. | 0 | 1 |
|
.39 | 0 | 0 | NA | NA | 0 | 1 |
|
.53 | |||
|
| |||||||||||||||
| Lifetime anxiety disorder, No. | 18 | 44 |
|
.006 | 0 | 0 | NA | NA | 18 | 44 |
|
.57 | |||
|
| |||||||||||||||
| Current anxiety disorder, No. | 4 | 6 |
|
.90 | 0 | 0 | NA | NA | 4 | 6 |
|
.34 | |||
|
| |||||||||||||||
| Lifetime ADHD, No. | 3 (n = 52) | 14 (n = 75) |
|
.04 | 2 (n = 31) | 4 (n = 20) |
|
.14 | 1 (n = 21) | 10 (n = 55) |
|
.14 | |||
Abbreviations: ADHD, attention-deficit/hyperactivity disorder; GAS, Global Adjustment Scale; HR, high-risk; LR, low-risk; MDD, major depressive disorder; NA, not available.
We constructed an index of the severity of either depressive or anxiety symptoms across children and adults for use in correlation analyses by converting the respective measure in each age group into a z score for each participant and then combining those z scores across age groups into a single variable for each symptom domain. Thus, the z score for depression severity was constructed using z scores from the Children’s Depression Rating Scale–Revised and the Hamilton Scale for Depression, and the z score for anxiety severity was constructed using z scores from the Revised Children’s Manifest Anxiety Scale and the Hamilton Scale for Anxiety.
Total score on the DuPaul-Barkley Rating Scale.
Diagnoses
The diagnostic interviews across all waves4 were conducted using a semistructured diagnostic instrument (the Schedule for Affective Disorders and Schizophrenia–Lifetime Version for adults, and the child version of the instrument that was modified for DSM-IV for participants 6–17 years of age). In waves 4 and 5, the Schedule for Affective Disorders and Schizophrenia–Present and Lifetime Version for Children was used initially and updated for revisions of diagnostic classification.
fMRI Task
Visual stimuli were presented through MRI-compatible goggles (Resonance Technologies, Inc). Participants who were near-sighted were fitted with corrective lenses so that they could view the screen clearly. A series of white arrows pointing either left or right and subtending 1° vertical and 4° horizontal of the visual field were displayed against a black background either to the left or to the right of white gaze fixation crosshairs positioned at midline. The majority of stimuli were “congruent” arrows pointing in the same direction as their position on the screen (eg, a right-pointing arrow presented to the right of mid-line). A smaller percentage (~7%) of stimuli were “incongruent” arrows pointing in a direction opposite their position on the screen (eg, a left-pointing arrow presented to the right of mid-line), spaced pseudorandomly every 13 to 16 congruent stimuli. We have previously shown that activations in this task format are attributable to interference and not to oddball effects.32
Participants were instructed to respond as quickly as possible to the direction of the arrow by pressing a button on a response box, using the index finger of their right hand for a left-pointing arrow and the middle finger of that hand for a right-pointing arrow. The button press recorded participant responses and reaction times for each trial. Stimulus duration was 1300 milliseconds, with an interstimulus interval of 350 milliseconds. Each run contained 102 stimuli (2 minutes, 48 seconds total duration), and each participant performed 10 runs.
Statistical Analysis
We constructed first-level maps to isolate (1) interference-related activity during correct trials (incongruent correct vs congruent correct trials) and (2) error-related activity (incongruent incorrect vs incongruent correct trials). Then, in all second-level analyses, we first covaried for age, sex, generation (G2 or G3), genealogical index of familiality, and average interference scores (the difference in mean reaction times between incongruent correct and congruent correct events). The genealogical index of familiality is an average pairwise kinship coefficient that has been used extensively in family studies to measure genetic relatedness between participants.33 We use it to control for the nonindependence of data.
We then modeled the fMRI data as linear combinations of the various participant subgroups based on our operational definitions of the 2 endophenotypes and illness effects. We used Bayesian inference to detect random effects by assessing the posterior probability of detecting a within- or between-group difference, β, given the activation map that we attained in a particular contrast. We used a posterior probability of greater than 98.75% as the threshold for statistical significance in each of the contrast maps and, in addition, required a spatial extent of at least 8 contiguous voxels to further strengthen the biological validity of our findings. Unlike a more conventional second-level analysis that uses classical parametric inference to detect a group effect in a statistical parametric map by disproving the null hypothesis (β = 0) at each voxel of the image, a group effect using the Bayesian method infers the posterior probability of detecting the observed group effects (β ≠ 0) given the data in a posterior probability map.34 Whereas the voxelwise tests in a statistical parametric map require correction for the number of statistical comparisons performed, the Bayesian method, because it infers posterior probability, by definition, does not generate false positives and does not require adjustment of its P values based on stringent P value thresholding (a feature of these analyses that has been confirmed in numerous simulations and empirical studies).35,36 In second-level Bayesian analyses, we isolated the risk and resilience endophenotypes and lifetime illness effects, as follows:
We isolated the effects of lifetime illness common to both risk groups by contrasting activation maps for all persons who had a prior lifetime illness (“HRIll” and “LRIll” combined) with activation maps for all persons without a prior lifetime illness (“HRHealthy” and “LRHealthy” combined) while covarying for risk group. To ensure that we isolated in this map only the effects of prior illness that were common to both risk groups, and not illness effects that may have disproportionately affected one risk group or the other, we then masked out of the preliminary contrast map voxels where we detected a significant risk group × illness interaction (which we define next). To isolate the effects of illness specific to each risk group, we first constructed maps for lifetime illness effects separately in each risk group: in HR participants, we contrasted activation maps between the HRIll and HRHealthy groups; in LR participants, we contrasted activation maps between the LRIll and LRHealthy groups. We then contrasted these maps for lifetime illness effects across risk groups, in effect mapping the interaction of lifetime illness with risk group.
To isolate the risk endophenotype, we contrasted activation maps for all HR participants with activation maps for all LR participants while covarying for lifetime illness, age, sex, and interference scores. This map clearly defined activations that were distinct from the effects of lifetime illness. Nevertheless, to ensure that we isolated only brain features for risk and excluded any effects of prior illness that may have disproportionately affected one risk group or the other, we masked out of this map voxels that were detected as a significant risk group × illness interaction (which has already been operationally defined). We defined lifetime illness as having had either lifetime MDD or anxiety disorder because prior studies of this same cohort have shown both illnesses to occur at elevated rates in the HR group compared with the LR group and because the onset of MDD in adolescence or young adulthood is often heralded by the presence of anxiety disorder in childhood.15 Findings were similar when defining lifetime illness as either one of these disorders alone and controlling for the presence of the other.
To isolate the resilience endophenotype, we contrasted the activation map for HR participants who had never been ill (“HRHealthy”) with the activation map for LR participants who had never been ill (“LRHealthy”). We then masked out of this contrast map the voxels where we detected a significant main effect of risk (as already defined), leaving only resilience (or protective) effects.
Results
Behavioral Findings
A repeated-measures analysis of covariance showed a trend (P = .07) toward lower interference scores (better resolution of cognitive interference) in the HR group compared with the LR group, while covarying for age and sex (Table 2; Figure 1). Post hoc analyses showed that this effect derived from the lower scores (P = .01) in the HR group members who had never been ill (ie, those who were “resilient” by our definition). A secondary analysis showed that, compared with LR group, the HR group was more accurate when responding to incongruent stimuli (P < .001), an effect that derived primarily from members of the HR group who had a lifetime history of illness (P < .001), which suggests that the HR participants with prior illness may be more cautious in their response styles, tending to sacrifice speed for greater accuracy.
Table 2.
Group Differences on Task Performance Measuresa
| Measure | All Participants, Mean (SD)
|
t Value (df = 141) | P Value | No MDD or Anxiety Disorder, Mean (SD)
|
t Value (df = 57) | P Value | Lifetime MDD or Anxiety Disorder, Mean (SD)
|
t Value (df = 82) | P Value | |||
|---|---|---|---|---|---|---|---|---|---|---|---|---|
| LR (n = 60) | HR (n = 83) | LR Participants (n = 37) | HR Participants (n = 22) | LR Participants (n = 23) | HR Participants (n = 61) | |||||||
| RT, ms | ||||||||||||
|
| ||||||||||||
| Incongruent | 674.5 (6.4) | 664.8 (5.1) | −1.2 | .24 | 672.5 (9.1) | 640.8 (11.8) | −2.13 | .04 | 669.0 (9.3) | 668.5 (5.6) | −0.04 | .96 |
|
| ||||||||||||
| Congruent | 494.8 (6.4) | 492.0 (5.1) | −0.88 | .38 | 498.5 (9.1) | 482.4 (11.8) | −1.09 | .28 | 480.5 (9.3) | 490.7 (5.6) | 0.96 | .34 |
|
| ||||||||||||
| Interference RT effectb | 179.7 (3.0) | 172.8 (2.4) | NA | .07 | 174.0 (3.7) | 158.4 (4.5) | NA | .01 | 188.5 (4.8) | 177.8 (2.9) | NA | .23 |
|
| ||||||||||||
| Accuracy, % | ||||||||||||
|
| ||||||||||||
| Incongruent | 85.9 (0.48) | 88.6 (0.4) | 4.45 | <.001 | 85.6 (0.6) | 86.5 (0.8) | 0.9 | .36 | 85.2 (0.74) | 89.4 (0.45) | 4.9 | <.001 |
|
| ||||||||||||
| Congruent | 100.0 (0.48) | 99.2 (0.4) | −1.36 | .18 | 99.3 (0.6) | 98.5 (0.8) | −0.9 | .37 | 99.9 (0.74) | 99.4 (0.45) | −0.56 | .58 |
|
| ||||||||||||
| Interference accuracy effectc | 14.1 (0.65) | 10.5 (0.5) | NA | <.001 | 13.7 (0.89) | 12.0 (1.0) | NA | .80 | 14.7 (1.0) | 10.0 (0.6) | NA | .08 |
Abbreviations: HR, high-risk; LR, low-risk; MDD, major depressive disorder; NA, not available; RT, reaction time.
Values are calculated using the least squares mean values of the mixed model: RT (or accuracy) = age + diagnosis + sex + congruence + run + run × congruence + diagnosis × congruence + diagnosis × run × congruence over 10 runs. The reduced RT interference effects were derived from those in the HR group with no lifetime illness (ie, those who were resilient), whereas the improved accuracy in responding within the HR group were derived from those HR participants who had a lifetime history of illness. Some t values are not available because, in the mixed model, we used the least squares mean values for the diagnosis × congruence term to obtain the t value when congruence was fixed. The P values for interference RT or accuracy effects are simply the P values for the diagnosis × congruence term, and no t values are available.
The mean RT for incongruent trials minus the mean RT for congruent trials.
The accuracy during incongruent trials minus the accuracy during congruent trials, where accuracy is defined as percentage correct trial responses.
Figure 1. Behavioral Performance on the Simon Task.
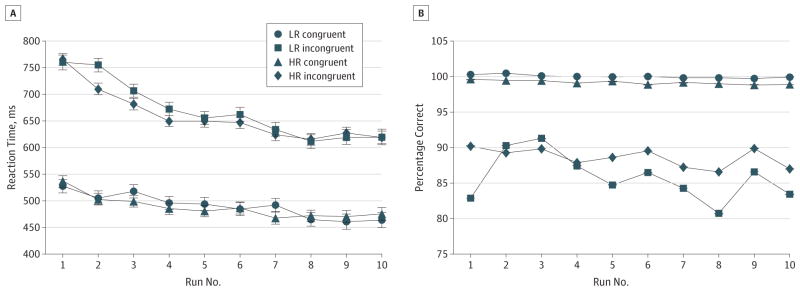
Reaction times (A) and accuracy scores (B) from each trial across all 10 runs of the Simon task were entered as dependent variables in separate repeated-measures, linear mixed models in SAS (SAS Institute Inc), with risk group (high risk [HR] or low risk [LR]), stimulus congruence (incongruent or congruent), age, sex, and run number (0–10) included as independent variables. The error bars represent standard errors. A, The HR group responded significantly faster, on average, on the incongruent but not congruent trials than did the LR group, but this faster performance when resolving the cognitive interference was driven by members of the HR group who had never had lifetime major depressive disorder or anxiety disorder (Table 2), which suggests that better performance was a resilience effect. B, The HR group, on average, was more accurate than the LR group on incongruent trials, but these group differences were driven by HR participants who had a lifetime history of illness (Table 2).
Imaging Findings
The risk and resilience endophenotypes and lifetime illness effects in brain activation are shown in representative slices in Figures 2 and 3; activations in all slices acquired are shown in eFigures 1 and 2 in eAppendix 2 in the Supplement. The locations of activation for each effect are summarized in Table 3 and detailed in eTable 1 in eAppendix 2 in the Supplement. Table 3 shows that some of the activations in the maps for all participants (leftmost column) are derived from the specific effects of trait vulnerabilities, resilience, or lifetime illness, whereas the other effects for vulnerability, resilience, and lifetime illness are not evident in the maps for all participants because the effects are diluted by the presence of other groups. These specific effects are provided for both interference contrasts and error-related activity (see Figure 2, Figure 3, and Figure 4 for corresponding activation maps and eTable 1 in the Supplement for activation coordinates).
Figure 2. Hypothesis Testing for Interference-Related Activity.

A, Representative 2-dimensional axial slices are shown that demonstrate the effects of interest. The risk effects map identifying brain features for risk was constructed by comparing interference maps for all high-risk (HR) participants with interference maps for all low-risk (LR) participants, while covarying for age, sex, interference effects, prior illness, generation (second or third generation), and genealogical index of familiality and then masking out of this map all voxels where we detected a significant risk group × illness interaction. The resilience effects map was constructed by comparing the interference map for the HRHealthy group with the map for the LRHealthy group. We then masked out of this map the voxels where we detected a significant main effect of risk, leaving only resilience (or protective) effects. Maps constructed when including persons with major depressive disorder alone or anxiety disorder alone were very similar (eAppendix 3 and eFigure 3 in the Supplement). The lifetime illness effects map for the main effect of illness was constructed by comparing the interference maps (while covarying for age, sex, interference scores, and risk group) for all persons who had lifetime illness (the HRIll and LRIll groups combined) with the interference maps for all persons without lifetime illness (the HRHealthy and LRHealthy groups combined) and then masking out of this map the voxels where we detected a significant risk group × illness interaction (eFigures 1 and 2, eTable 1, and eAppendix 2 in the Supplement), leaving illness effects that were common to both risk groups. B, Surface renderings of the lateral and medial surfaces of the brain generated using Caret 5.62 are shown, with the locations of each of the risk effects (yellow), resilience effects (green), and illness effects (red) color-coded. ACC indicates anterior cingulate cortex; dACC, dorsal anterior cingulate cortex; DLPFC, dorsolateral prefrontal cortex; Ins, insula; IPL, inferior parietal lobe; LPFC, lateral prefrontal cortex; MFG, middle frontal gyrus; MTG, middle temporal gyrus; PCC, posterior cingulate cortex; PCu, precuneus; pgACC, pregenual anterior cingulate cortex; PH, parahippocampus; SFG, superior frontal gyrus; SPL, superior parietal lobe; STG, superior temporal gyrus; and vACC, ventral anterior cingulate cortex.
Figure 3. Hypothesis Testing for Error-Related Activity.
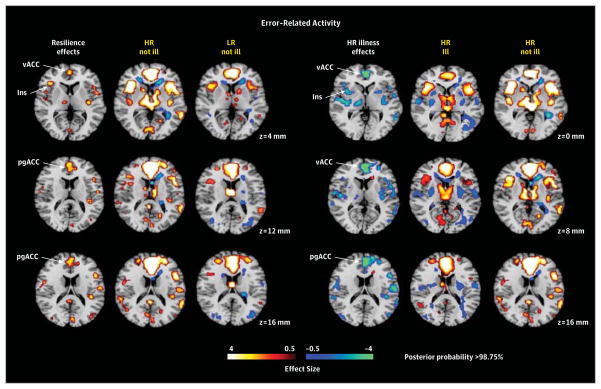
Maps were constructed as described in Figure 2 for interference-related activity, except the contrast maps on which they were based were those for error-related activity (incongruent incorrect vs incongruent correct trials). All maps were covaried for age, sex, interference scores, generation (second or third generation), and genealogical index of familiality. We did not detect significant risk effects or illness effects in the low-risk (LR) group for error-related activity, and therefore we do not show those maps. Resilience was associated with greater activation (yellow) of ventral and pregenual anterior cingulate cortex and insular cortex in the “HR not ill” group compared with the “LR not ill” group. Lifetime illness effects included reduced activation (blue) of ventral and pregenual portions of the anterior cingulate cortex in the “HR ill” group compared with the “HR not ill” group. HR indicates high risk; Ins, insula; pgACC, pregenual anterior cingulate cortex; and vACC, ventral anterior cingulate cortex.
Table 3.
Qualitative Summary of Regional Activations for Risk and Resilience Effects, and the Effects of Lifetime Illness
| Interference (HR Participants vs LR Participants) | Risk Effects
|
Resilience Effects
|
Lifetime Illness Effects
|
|||||
|---|---|---|---|---|---|---|---|---|
| Interference | Error Related | Interference | Error Related | Interference
|
Error Related | |||
| Main Effect | HR Specific | LR Specific | ||||||
| ↑ Insula | ↑ Insula | ↑ Insula | ↓ Insula | ↓ Insula | ||||
|
| ||||||||
| ↑ MTG | ↑ MTG | |||||||
|
| ||||||||
| ↑ STG | ↑ STG | ↓ STG | ||||||
|
| ||||||||
| ↑ LPFC | ↑ LPFC | ↓ LPFC | ||||||
|
| ||||||||
| ↑ DLPFC | ↓ DLPFC | ↓ DLPFC | ||||||
|
| ||||||||
| ↑ SPL | ↑ SPL | |||||||
|
| ||||||||
| ↑ PCu | ↑ PCu | |||||||
|
| ||||||||
| ↓ PCC deactivation | ↑ PCC deactivation | ↑ PCC deactivation | ||||||
|
| ||||||||
| ↑ vACC | ↑ vACC | ↓ vACC | ||||||
|
| ||||||||
| ↑ pgACC | ↑ pgACC | ↑ pgACC | ↓ pgACC | |||||
|
| ||||||||
| ↑ dACC | ↑ dACC | ↓ dACC | ||||||
|
| ||||||||
| ↓ SFG deactivation | ||||||||
|
| ||||||||
| ↑ MFG deactivation | ||||||||
|
| ||||||||
| ↑ IPL deactivation | ↑ IPL deactivation | |||||||
|
| ||||||||
| ↑ PH deactivation | ↑ PH deactivation | ↑ PH deactivation | ||||||
|
| ||||||||
| ↑ CerV deactivation | ||||||||
|
| ||||||||
| ↓ Caudate | ↑ Caudate | |||||||
|
| ||||||||
| ↓ Thalamus | ||||||||
Abbreviations: CerV, cerebellar vermis; dACC, dorsal anterior cingulate cortex; DLPFC, dorsolateral prefrontal cortex; HR, high-risk; IPL, inferior parietal lobe; LPFC, lateral prefrontal cortex; LR, low-risk; MFG, middle frontal gyrus; MTG, middle temporal gyrus; pgACC, pregenual anterior cingulate cortex; PCC, posterior cingulate cortex; PCu, precuneus; PH, parahippocampus; SFG, superior frontal gyrus; SPL, superior parietal lobe; STG, superior temporal gyrus; vACC, ventral anterior cingulate cortex; the downward-pointing arrow indicates a decrease in activation or deactivation; the upward-pointing arrow indicates an increase in activation or deactivation.
Figure 4. Interference Effects for Participants Older Than 25 Years.

Effects were defined as in Figure 2. Findings are unchanged from those identified in the entire cohort. ACC indicates anterior cingulate cortex; dACC, dorsal anterior cingulate cortex; DLPFC, dorsolateral prefrontal cortex; Ins, insula; IPL, inferior parietal lobe; LPFC, lateral prefrontal cortex; MFG, middle frontal gyrus; MTG, middle temporal gyrus; PCC, posterior cingulate cortex; PCu, precuneus; pgACC, pregenual anterior cingulate cortex; PH, parahippocampus; SFG, superior frontal gyrus; SPL, superior parietal lobe; STG, superior temporal gyrus; and vACC, ventral anterior cingulate cortex.
Interference-Related Activity
The risk endophenotype for MDD included greater activation of insular, lateral prefrontal, superior temporal, superior parietal, and precuneate cortices bilaterally (Figure 2). The resilience endophenotype included greater activation of the pregenual and dorsal anterior cingulate and dorsolateral prefrontal cortices, as well as reduced deactivation of the superior frontal gyrus (Figure 2). Illness-related effects common to both risk groups included exaggerated deactivation of default-mode circuits, especially in posterior brain regions (Figure 2).
Error-Related Activity
We detected no risk endophenotype for MDD in error-related activity. Resilience was associated with greater activation of ventral and pregenual anterior cingulate cortex, insular cortex, and other scattered foci of cortical activations (Figure 3). Lifetime illness effects included reduced activation of ventral and pregenual portions of the anterior cingulate cortex (Figure 3).
Potential Confounders
Findings were similar to the original (1) when identifying the endophenotypes for either MDD alone, while covarying for lifetime anxiety disorder, or anxiety disorder alone, while covarying for lifetime MDD (eAppendix 3 and eFigure 3 in the Supplement); (2) when covarying for generation (G2 or G3) (eAppendix 4 and eFigures 4 and 5 in the Supplement); (3) when excluding the 25 participants (20 HR participants and 5 LR participants) who were taking a psychotropic medication at the time of the scan (although lifetime illness effects were weakened by removing 25 people who had been recently ill) (eAppendix 5, eTable 1, and eFigure 6 in the Supplement); (4) when excluding the 34 participants (21 HR participants and 13 LR participants) with a lifetime history of abuse or dependence on either drugs (n = 23; 17 HR participants and 6 LR participants) or alcohol (n = 24; 16 HR participants and 8 LR participants) (eAppendix 6 and eFigure 7 in the Supplement); (5) when excluding female participants from the analyses and using bootstrap resampling to assess the effects of unequal sex distributions across illness groups (eAppendix 7 and eFigure 8 in the Supplement); (6) when including only participants older than age 25 years, and who therefore are past the age of maximum risk for onset of new illness (Figure 4; eAppendix 8, eFigures 9 and 10, and eTables 3 and 4 in the Supplement), indicating that group differences in age and developmental stage in the overall sample did not confound our findings; (7) when not covarying for generation or the genealogical index of familiality (eAppendix 9 and eFigure 11 in the Supplement); and (8) while covarying for mean reaction times (data not shown).
Correlation Analyses
The magnitudes of fMRI activation did not correlate significantly with measures of task performance or with symptom severity for depression or anxiety in either the HR group or the LR group. However, in the 134 participants (78 HR participants and 56 LR participants) who had both anatomical and fMRI measures, activation in regions identified as the risk endophenotype, particularly the lateral prefrontal (r = −0.26, P < .02) and insular cortices (r = −0.30, P < .008), correlated significantly in the HR group with the degree of right hemisphere cortical thinning (eAppendix 10 and eFigures 12 and 13 in the Supplement).
Conjunction Analyses
Findings were replicated using conjunction analyses on the second-level Bayesian maps (eAppendix 11 and eFigures 14 and 15 in the Supplement).
Association With Importance of Religion
Given the previously reported association of the importance of religion in protecting against depression and its association with increasing cortical thickness in this sample,37 we also assessed the association of the importance of religion with our fMRI-based risk and resilience endophenotypes and lifetime illness effects. We asked adult participants at the time of the MRI scan the following question: “How important to you is religion or spirituality?” Their responses ranged from a score of 1 (not important at all) to a score of 4 (highly important). We dichotomized responses as either “high” (≥3) or “low” (<3) importance and compared fMRI measures for interference effects between those for whom religion was of high importance (n = 23; 12 HR participants and 11 LR participants; 15 women) and those for whom it was of low importance (n = 74; 51 HR participants and 23 LR participants; 45 women), while covarying for age, sex, interference effects, and risk group. We found that, in participants for whom religion was of low importance, interference-related activation was significantly stronger throughout most of the cortical regions that this task activates (Figure 5). We created a conjunction for the maps of each of those effects with the map of significant activation comparing high vs low importance, demonstrating that nearly all activations that were stronger in participants for whom religion was of low importance were regions identified as being more active in the risk endophenotype for MDD. Activation in only 1 region in 2 adjacent slices was located within a region identified as being a component of the resilience endophenotype, and none of the activations were components of the regions identified as lifetime illness effects (Figure 5).
Figure 5. Association of Activations With Importance of Religion.
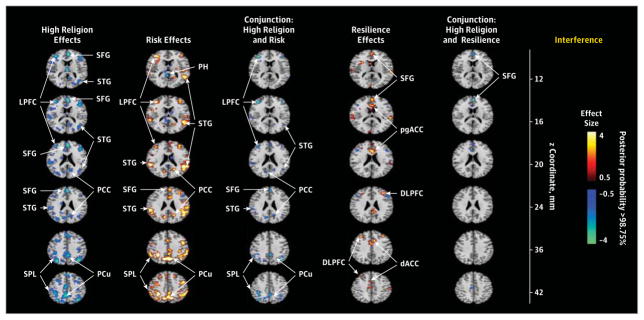
The first column shown the comparison of interference-related activations in participants for whom religion was of high importance (n = 23) vs participants for whom religion was of low importance (n = 74), while controlling for age, sex, interference scores, and risk group. The second column shows the risk endophenotype in the selected slices, whereas the third column shows the conjunction of activations in the first and second columns, in effect identifying activations associated with the importance of religion that are located within the risk endophenotype. The fourth column shows the resilience endophenotype in the selected slices, and the fifth column shows the conjunction of the first and fourth columns, identifying activations associated with the importance of religion that are located within the resilience endophenotype (high importance of religion was associated with a more prominent deactivation of the superior frontal gyrus in 2 adjacent slices). A similar conjunction of the first column with the effects of lifetime illness was empty and therefore is not shown. The high importance of religion is associated primarily with reduced activation within regions that constitute the risk endophenotype. dACC, indicates dorsal anterior cingulate cortex; DLPFC, dorsolateral prefrontal cortex; LPFC, lateral prefrontal cortex; PCC, posterior cingulate cortex; PCu, precuneus; pgACC, pregenual anterior cingulate cortex; PH, parahippocampus; SFG, superior frontal gyrus; SPL, superior parietal lobe; and STG, superior temporal gyrus.
Discussion
We identified the patterns of brain activation for risk endophenotypes that were distinct from the patterns associated with resilience to illness and the patterns associated with a lifetime history of MDD or anxiety disorder (Table 3). Risk-, resilience-, and illness-specific effects either remained or strengthened when including in the analyses only participants older than 25 years of age who were past the age of maximum risk for onset of new illness (eAppendix 8, eFigures 9 and 10, and eTables 3 and 4 in the Supplement), probably because the effects were not diluted by those youngest participants who had yet to become ill.
Interference-related activity was similar across the HR group and the LR group and included activation of numerous cortical areas (anterior cingulate, inferior and dorsolateral prefrontal, insula, parietal, and superior temporal regions) and subcortical nuclei (basal ganglia and thalamus), as well as deactivation of so-called default-mode regions (mesial prefrontal, inferior parietal/posterior temporal, and posterior cingulate cortices) (eAppendix 1, eFigures 1 and 2, and eTable 1 in the Supplement), consistent with numerous prior reports of activation using this and similar tasks.22,27 Error-related activity in both groups included ventral and dorsal anterior cingulate, insular, dorsolateral prefrontal, and dorsal parietal cortices bilaterally and the caudate nuclei and thalamus (Figure 3; eAppendix 1, eFigures 1 and 2, and eTable 1 in the Supplement), similar to findings in previous studies of error-related activity.30,31 Error-related activations were similar to interference-related ones, although greater in the anterior cingulate cortex and weaker in default-mode regions.
The anterior cingulate cortex activated most consistently in both interference- and error-related analyses. The anterior cingulate is an anatomically and functionally heterogeneous structure that coordinates and regulates activity across space and time in a wide array of neural systems that subserve cognitive, behavioral, and emotional processes.27 Its pregenual and dorsal portions play a prominent role in monitoring errors and providing corrective action to improve performance on subsequent trials.38 The other cortical regions that were activated prominently across tasks are thought to support the conscious cognitive processes needed to perform the task, such as working memory, response monitoring and correction, and attention. Subcortical nuclei that were activated are thought to support more automatic and less conscious aspects of performance.39 The deactivation of default-mode regions is thought to represent either greater autobiographical, self-referential, or mind-wandering activity during the easier baseline condition40–42 (the processing of congruent stimuli) or the suppression of that baseline activity during the more difficult active task condition (the processing of incongruent stimuli).41,42
Risk Endophenotype
The risk endophenotype for MDD (defined as HRAll vs LRAll while covarying for prior illness and masking out group-specific illness effects) included greater activation of cortical regions (insular, lateral prefrontal, superior temporal, superior parietal, and precuneate cortices bilaterally) (Figure 2). These activations likely represent a greater allocation of effort in the HR group to respond correctly, probably as a consequence of the attentional disturbances associated with cortical thinning that we previously identified in the HR group. This interpretation is supported by the association of greater activation in regions identified as risk effects with more prominent right hemisphere thinning in the HR group. We also found that activations in this risk endophenotype were significantly less in participants for whom religion was of high importance than in those for whom it was of low importance (Figure 5), suggesting that the previously documented protective effects of religion on developing MDD in this sample37 may operate by reducing the activity and influences of this risk endophenotype. We detected no risk endophenotype for MDD in error-related activity.
Resilience Endophenotype
This endophenotype comprised activations in persons without prior illness that were greater in the HR group than in the LR group (ie, HRHealthy vs LRHealthy with risk effects masked out). For interference-related activity, resilience to developing MDD in the HR group was associated with greater activation of the pregenual and dorsal anterior cingulate cortex, as well as the dorsolateral prefrontal cortex, and reduced deactivation of the superior frontal gyrus (Figure 2). For error-related activity, resilience was associated with greater activation of the ventral and pregenual anterior cingulate cortex, the insular cortex, and other scattered cortical foci (Figure 3). Greater activation in brain systems that support self-regulatory control in these resilient members of the HR group is consistent with their better performance on the task,38 which was characterized by significantly less cognitive interference than shown by other participants in the HR and LR groups (Table 2). It could support resilience by helping to regulate emotions and the pathogenic cognitions that predispose to MDD.
Lifetime Illness Effects
Illness-related effects (lifetime MDD vs no MDD) common to both risk groups for interference-related activity included exaggerated deactivation of default-mode circuits, especially in posterior brain regions (Figure 2). We attribute these illness effects to increased self-referential thinking and mind wandering during the easier baseline task, possibly representing the proclivity that persons with MDD or anxiety disorder have to rumination.43,44 Whether exaggerated deactivation of default-mode circuits is a cause or consequence of overt MDD illness is impossible to say in this cross-sectional study. A definitive understanding of the direction of causality will require more scanning at future time points to determine whether default-mode activity predicts future illness or vice versa.
Relation to Prior Studies of MDD
Prior studies of MDD have generally included only persons who were ill at the time of the study, making their findings most relevant only to our lifetime illness effects. Extensive reviews have shown that the most consistent imaging finding for persons already affected with MDD is greater baseline activity in the mesial prefrontal cortex (especially the anterior cingulate cortex) and in other portions of the default-mode network (including the posterior cingulate, precuneate, inferior parietal, and parahippocampal cortices),45–47 consistent with the greater default-mode deactivations that we detected as lifetime illness effects. Previous studies have suggested that successful treatment may normalize activity in these default-mode regions.45,46,48,49 Functional abnormalities in default-mode regions may derive from reduced underlying gray matter volumes and reduced glial cell densities in the subgenual anterior cingulate cortex of persons with active MDD.50,51 Meta-analyses of anatomical studies have also concluded that gray matter volumes in MDD are reduced not only in the anterior cingulate cortex, but also in the orbitofrontal and dorsal prefrontal cortices, the hippocampus, the putamen, and the caudate nucleus,26 regions generally implicated in our risk endophenotype (Figure 2). In addition to greater activity in default-mode systems, prior studies have reported reduced cortical activity in persons already affected with MDD,45,46 including adolescents with MDD performing the Simon or other self-regulatory tasks,29 consistent with the reduced cortical activation that we detected in those who have a lifetime history of illness, regardless of familial risk status (Figure 2).
The few preliminary studies relevant to the identification of risk endophenotypes in persons who have not been overtly ill with MDD have reported reduced volumes of the subgenual anterior cingulate cortex early in the course of illness and in young adults at high familial risk for MDD.52,53 One study reported a positive correlation of dorsal anterior cingulate volumes with trait measures of emotion regulation in healthy women.54 The anatomical endophenotype for risk that we previously reported for familial MDD included widespread thinning of the mesial wall of the left hemisphere,21 subsuming the majority of regions of the default-mode network. One fMRI study using a verbal working memory task in young people at HR compared with those at LR for familial MDD reported greater activation in the superior temporal, superior parietal, and lateral occipital cortices in the HR group,55 consistent with the greater cortical activation that we identified as a risk endophenotype. To our knowledge, no prior studies have identified resilience endophenotypes in persons at risk for MDD.
Conclusion
Future studies should assess the utility of our risk, resilience, and illness effects in predicting future illness in youth with a family history of MDD but who have not passed through the age of risk for onset. If sufficiently predictive, these endophenotypes could then be used to aid in determining who should be targeted for preventive interventions. Bolstering the function of the anterior cingulate and dorsolateral prefrontal cortices, components of the resilience endophenotype, using cognitive exercises, electrophysiological stimulation, or appropriate medications, should be considered a target in developing new and more effective treatments for MDD.
Supplementary Material
Acknowledgments
Funding/Support: This work was supported in part by National Institute of Mental Health grants MH36197 and K02-74677, a grant from the estate of Eleanore Jeleniauskas and the Brain and Behavior Research Foundation, a National Institute on Drug Abuse supplement to grant MH36197, the Tom Klingenstein and Nancy Perlman Family Fund, the Sackler Institute at Columbia University, and the Templeton Foundation.
Role of the Sponsor: The funding organizations had no role in the design and conduct of the study; collection, management, analysis, or interpretation of the data; preparation, review, or approval of the manuscript; and decision to submit the manuscript for publication.
Footnotes
Conflict of Interest Disclosures: None reported.
Author Contributions: Dr Peterson had full access to all of the data in the study and takes responsibility for the integrity of the data and the accuracy of the data analysis.
Study concept and design: Peterson, Wickramaratne, Weissman.
Acquisition of data: Peterson, Warner, Klahr, Garcia, Adams, Gerber, Weissman.
Analysis and interpretation of data: Peterson, Wang, Horga, Rutherford, Graniello, Wickramaratne, Garcia, Yu, Hao, Qian, Liu, Gerber.
Drafting of the manuscript: Peterson, Wang, Warner, Adams, Qian, Weissman.
Critical revision of the manuscript for important intellectual content: Peterson, Wang, Horga, Rutherford, Klahr, Graniello, Wickramaratne, Garcia, Yu, Hao, Liu, Gerber, Weissman.
Statistical analysis: Peterson, Wang, Horga, Graniello, Garcia, Liu.
Obtained funding: Peterson, Weissman.
Administrative, technical, or material support: Peterson, Klahr, Garcia, Hao, Adams, Qian, Weissman.
Study supervision: Peterson, Horga, Warner.
References
- 1.Wang PS, Aguilar-Gaxiola S, Alonso J, et al. Use of mental health services for anxiety, mood, and substance disorders in 17 countries in the WHO world mental health surveys. Lancet. 2007;370(9590):841–850. doi: 10.1016/S0140-6736(07)61414-7. [DOI] [PMC free article] [PubMed] [Google Scholar]
- 2.Weissman MM, Bland RC, Canino GJ, et al. Cross-national epidemiology of major depression and bipolar disorder. JAMA. 1996;276(4):293–299. [PubMed] [Google Scholar]
- 3.Ustün TB, Ayuso-Mateos JL, Chatterji S, Mathers C, Murray CJL. Global burden of depressive disorders in the year 2000. Br J Psychiatry. 2004;184:386–392. doi: 10.1192/bjp.184.5.386. [DOI] [PubMed] [Google Scholar]
- 4.Weissman MM, Wickramaratne P, Nomura Y, et al. Families at high and low risk for depression: a 3-generation study. Arch Gen Psychiatry. 2005;62(1):29–36. doi: 10.1001/archpsyc.62.1.29. [DOI] [PubMed] [Google Scholar]
- 5.Beardslee WR, Versage EM, Gladstone TR. Children of affectively ill parents: a review of the past 10 years. J Am Acad Child Adolesc Psychiatry. 1998;37(11):1134–1141. doi: 10.1097/00004583-199811000-00012. [DOI] [PubMed] [Google Scholar]
- 6.Kovacs M, Devlin B, Pollock M, Richards C, Mukerji P. A controlled family history study of childhood-onset depressive disorder. Arch Gen Psychiatry. 1997;54(7):613–623. doi: 10.1001/archpsyc.1997.01830190033004. [DOI] [PubMed] [Google Scholar]
- 7.Bierut LJ, Heath AC, Bucholz KK, et al. Major depressive disorder in a community-based twin sample: are there different genetic and environmental contributions for men and women? Arch Gen Psychiatry. 1999;56(6):557–563. doi: 10.1001/archpsyc.56.6.557. [DOI] [PubMed] [Google Scholar]
- 8.Sullivan PF, Neale MC, Kendler KS. Genetic epidemiology of major depression: review and meta-analysis. Am J Psychiatry. 2000;157(10):1552–1562. doi: 10.1176/appi.ajp.157.10.1552. [DOI] [PubMed] [Google Scholar]
- 9.Lieb R, Isensee B, Höfler M, Pfister H, Wittchen HU. Parental major depression and the risk of depression and other mental disorders in offspring: a prospective-longitudinal community study. Arch Gen Psychiatry. 2002;59(4):365–374. doi: 10.1001/archpsyc.59.4.365. [DOI] [PubMed] [Google Scholar]
- 10.Keller MB, Beardslee WR, Dorer DJ, Lavori PW, Samuelson H, Klerman GR. Impact of severity and chronicity of parental affective illness on adaptive functioning and psychopathology in children. Arch Gen Psychiatry. 1986;43(10):930–937. doi: 10.1001/archpsyc.1986.01800100020004. [DOI] [PubMed] [Google Scholar]
- 11.Wickramaratne PJ, Greenwald S, Weissman MM. Psychiatric disorders in the relatives of probands with prepubertal-onset or adolescent-onset major depression. J Am Acad Child Adolesc Psychiatry. 2000;39(11):1396–1405. doi: 10.1097/00004583-200011000-00014. [DOI] [PubMed] [Google Scholar]
- 12.Fava M, Uebelacker LA, Alpert JE, Nierenberg AA, Pava JA, Rosenbaum JF. Major depressive subtypes and treatment response. Biol Psychiatry. 1997;42(7):568–576. doi: 10.1016/S0006-3223(96)00440-4. [DOI] [PubMed] [Google Scholar]
- 13.Kendler KS. Is seeking treatment for depression predicted by a history of depression in relatives? implications for family studies of affective disorder. Psychol Med. 1995;25(4):807–814. doi: 10.1017/s0033291700035054. [DOI] [PubMed] [Google Scholar]
- 14.Hammen C, Burge D, Burney E, Adrian C. Longitudinal study of diagnoses in children of women with unipolar and bipolar affective disorder. Arch Gen Psychiatry. 1990;47(12):1112–1117. doi: 10.1001/archpsyc.1990.01810240032006. [DOI] [PubMed] [Google Scholar]
- 15.Pine DS, Cohen P, Gurley D, Brook J, Ma Y. The risk for early-adulthood anxiety and depressive disorders in adolescents with anxiety and depressive disorders. Arch Gen Psychiatry. 1998;55(1):56–64. doi: 10.1001/archpsyc.55.1.56. [DOI] [PubMed] [Google Scholar]
- 16.Warner V, Wickramaratne P, Weissman MM. The role of fear and anxiety in the familial risk for major depression: a three-generation study. Psychol Med. 2008;38(11):1543–1556. doi: 10.1017/S0033291708002894. [DOI] [PMC free article] [PubMed] [Google Scholar]
- 17.Peterson BS, Weissman MM. A brain-based endophenotype for major depressive disorder. Annu Rev Med. 2011;62:461–474. doi: 10.1146/annurev-med-010510-095632. [DOI] [PMC free article] [PubMed] [Google Scholar]
- 18.Gottesman II, Gould TD. The endophenotype concept in psychiatry: etymology and strategic intentions. Am J Psychiatry. 2003;160(4):636–645. doi: 10.1176/appi.ajp.160.4.636. [DOI] [PubMed] [Google Scholar]
- 19.Feder A, Nestler EJ, Charney DS. Psychobiology and molecular genetics of resilience. Nat Rev Neurosci. 2009;10(6):446–457. doi: 10.1038/nrn2649. [DOI] [PMC free article] [PubMed] [Google Scholar]
- 20.Masten AS, Coatsworth JD. The development of competence in favorable and unfavorable environments: lessons from research on successful children. Am Psychol. 1998;53(2):205–220. doi: 10.1037//0003-066x.53.2.205. [DOI] [PubMed] [Google Scholar]
- 21.Peterson BS, Warner V, Bansal R, et al. Cortical thinning in persons at increased familial risk for major depression. Proc Natl Acad Sci U S A. 2009;106(15):6273–6278. doi: 10.1073/pnas.0805311106. [DOI] [PMC free article] [PubMed] [Google Scholar]
- 22.Peterson BS, Kane MJ, Alexander GM, et al. An event-related functional MRI study comparing interference effects in the Simon and Stroop tasks. Brain Res Cogn Brain Res. 2002;13(3):427–440. doi: 10.1016/s0926-6410(02)00054-x. [DOI] [PubMed] [Google Scholar]
- 23.Dubin MJ, Maia TV, Peterson BS. Cognitive control in the service of self-regulation. In: Koob GF, Le Moal M, Thompson RF, editors. Encyclopedia of Behavioral Neuroscience. Vol. 1. Oxford, England: Academic Press; 2010. pp. 288–293. [Google Scholar]
- 24.Joormann J, Gotlib IH. Emotion regulation in depression: relation to cognitive inhibition. Cogn Emot. 2010;24(2):281–298. doi: 10.1080/02699930903407948. [DOI] [PMC free article] [PubMed] [Google Scholar]
- 25.Phillips ML, Ladouceur CD, Drevets WC. A neural model of voluntary and automatic emotion regulation: implications for understanding the pathophysiology and neurodevelopment of bipolar disorder. Mol Psychiatry. 2008;13(9):833–857. doi: 10.1038/mp.2008.65. [DOI] [PMC free article] [PubMed] [Google Scholar]
- 26.Koolschijn PC, van Haren NE, Lensvelt-Mulders GJ, Hulshoff Pol HE, Kahn RS. Brain volume abnormalities in major depressive disorder: a meta-analysis of magnetic resonance imaging studies. Hum Brain Mapp. 2009;30(11):3719–3735. doi: 10.1002/hbm.20801. [DOI] [PMC free article] [PubMed] [Google Scholar]
- 27.Peterson BS, Skudlarski P, Gatenby JC, Zhang H, Anderson AW, Gore JC. An fMRI study of Stroop word-color interference: evidence for cingulate subregions subserving multiple distributed attentional systems. Biol Psychiatry. 1999;45(10):1237–1258. doi: 10.1016/s0006-3223(99)00056-6. [DOI] [PubMed] [Google Scholar]
- 28.Posner MI, Rothbart MK, Sheese BE, Tang Y. The anterior cingulate gyrus and the mechanism of self-regulation. Cogn Affect Behav Neurosci. 2007;7(4):391–395. doi: 10.3758/cabn.7.4.391. [DOI] [PubMed] [Google Scholar]
- 29.Halari R, Simic M, Pariante CM, et al. Reduced activation in lateral prefrontal cortex and anterior cingulate during attention and cognitive control functions in medication-naïve adolescents with depression compared to controls. J Child Psychol Psychiatry. 2009;50(3):307–316. doi: 10.1111/j.1469-7610.2008.01972.x. [DOI] [PubMed] [Google Scholar]
- 30.Rubia K, Smith AB, Taylor E, Brammer M. Linear age-correlated functional development of right inferior fronto-striato-cerebellar networks during response inhibition and anterior cingulate during error-related processes. Hum Brain Mapp. 2007;28(11):1163–1177. doi: 10.1002/hbm.20347. [DOI] [PMC free article] [PubMed] [Google Scholar]
- 31.King JA, Korb FM, von Cramon DY, Ullsperger M. Post-error behavioral adjustments are facilitated by activation and suppression of task-relevant and task-irrelevant information processing. J Neurosci. 2010;30(38):12759–12769. doi: 10.1523/JNEUROSCI.3274-10.2010. [DOI] [PMC free article] [PubMed] [Google Scholar]
- 32.Leung HC, Skudlarski P, Gatenby JC, Peterson BS, Gore JC. An event-related functional MRI study of the Stroop color word interference task. Cereb Cortex. 2000;10(6):552–560. doi: 10.1093/cercor/10.6.552. [DOI] [PubMed] [Google Scholar]
- 33.Blumenthal DT, Cannon-Albright LA. Familiality in brain tumors. Neurology. 2008;71(13):1015–1020. doi: 10.1212/01.wnl.0000326597.60605.27. [DOI] [PMC free article] [PubMed] [Google Scholar]
- 34.Neumann J, Lohmann G. Bayesian second-level analysis of functional magnetic resonance images. Neuroimage. 2003;20(2):1346–1355. doi: 10.1016/S1053-8119(03)00443-9. [DOI] [PubMed] [Google Scholar]
- 35.Friston KJ, Penny W, Phillips C, Kiebel S, Hinton G, Ashburner J. Classical and Bayesian inference in neuroimaging: theory. Neuroimage. 2002;16(2):465–483. doi: 10.1006/nimg.2002.1090. [DOI] [PubMed] [Google Scholar]
- 36.Friston KJ, Penny W. Posterior probability maps and SPMs. Neuroimage. 2003;19(3):1240–1249. doi: 10.1016/s1053-8119(03)00144-7. [DOI] [PubMed] [Google Scholar]
- 37.Miller L, Bansal R, Wickramaratne P, et al. Neuroanatomical correlates of religiosity and spirituality: a study in adults at high and low familial risk for depression. JAMA Psychiatry. doi: 10.1001/jamapsychiatry.2013.3067. published online December 25, 2013. [DOI] [PMC free article] [PubMed] [Google Scholar]
- 38.Kerns JG. Anterior cingulate and prefrontal cortex activity in an FMRI study of trial-to-trial adjustments on the Simon task. Neuroimage. 2006;33(1):399–405. doi: 10.1016/j.neuroimage.2006.06.012. [DOI] [PubMed] [Google Scholar]
- 39.Packard MG, Knowlton BJ. Learning and memory functions of the basal ganglia. Annu Rev Neurosci. 2002;25:563–593. doi: 10.1146/annurev.neuro.25.112701.142937. [DOI] [PubMed] [Google Scholar]
- 40.Vann SD, Aggleton JP, Maguire EA. What does the retrosplenial cortex do? Nat Rev Neurosci. 2009;10(11):792–802. doi: 10.1038/nrn2733. [DOI] [PubMed] [Google Scholar]
- 41.Mason MF, Norton MI, Van Horn JD, Wegner DM, Grafton ST, Macrae CN. Wandering minds: the default network and stimulus-independent thought. Science. 2007;315(5810):393–395. doi: 10.1126/science.1131295. [DOI] [PMC free article] [PubMed] [Google Scholar]
- 42.McKiernan KA, D’Angelo BR, Kaufman JN, Binder JR. Interrupting the “stream of consciousness”: an fMRI investigation. Neuroimage. 2006;29(4):1185–1191. doi: 10.1016/j.neuroimage.2005.09.030. [DOI] [PMC free article] [PubMed] [Google Scholar]
- 43.Nolen-Hoeksema S. Ruminative coping with depression. In: Heckhausen J, Dweck CS, editors. Motivation and Self-Regulation Across the Life Span. New York, NY: Cambridge University Press; 1998. pp. 237–256. [Google Scholar]
- 44.Cooney RE, Joormann J, Eugène F, Dennis EL, Gotlib IH. Neural correlates of rumination in depression. Cogn Affect Behav Neurosci. 2010;10(4):470–478. doi: 10.3758/CABN.10.4.470. [DOI] [PMC free article] [PubMed] [Google Scholar]
- 45.Drevets WC, Price JL, Furey ML. Brain structural and functional abnormalities in mood disorders: implications for neurocircuitry models of depression. Brain Struct Funct. 2008;213(1–2):93–118. doi: 10.1007/s00429-008-0189-x. [DOI] [PMC free article] [PubMed] [Google Scholar]
- 46.Koenigs M, Grafman J. The functional neuroanatomy of depression: distinct roles for ventromedial and dorsolateral prefrontal cortex. Behav Brain Res. 2009;201(2):239–243. doi: 10.1016/j.bbr.2009.03.004. [DOI] [PMC free article] [PubMed] [Google Scholar]
- 47.Pizzagalli DA. Frontocingulate dysfunction in depression: toward biomarkers of treatment response. Neuropsychopharmacology. 2011;36(1):183–206. doi: 10.1038/npp.2010.166. [DOI] [PMC free article] [PubMed] [Google Scholar]
- 48.Fitzgerald PB, Oxley TJ, Laird AR, Kulkarni J, Egan GF, Daskalakis ZJ. An analysis of functional neuroimaging studies of dorsolateral prefrontal cortical activity in depression. Psychiatry Res. 2006;148(1):33–45. doi: 10.1016/j.pscychresns.2006.04.006. [DOI] [PubMed] [Google Scholar]
- 49.Posner J, Hellerstein DJ, Gat I, et al. Antidepressants normalize the default mode network in patients with dysthymia. JAMA Psychiatry. 2013;70(4):373–382. doi: 10.1001/jamapsychiatry.2013.455. [DOI] [PMC free article] [PubMed] [Google Scholar]
- 50.Drevets WC, Price JL, Simpson JR, Jr, et al. Subgenual prefrontal cortex abnormalities in mood disorders. Nature. 1997;386(6627):824–827. doi: 10.1038/386824a0. [DOI] [PubMed] [Google Scholar]
- 51.Coryell W, Nopoulos P, Drevets W, Wilson T, Andreasen NC. Subgenual prefrontal cortex volumes in major depressive disorder and schizophrenia: diagnostic specificity and prognostic implications. Am J Psychiatry. 2005;162(9):1706–1712. doi: 10.1176/appi.ajp.162.9.1706. [DOI] [PubMed] [Google Scholar]
- 52.Botteron KN, Raichle ME, Drevets WC, Heath AC, Todd RD. Volumetric reduction in left subgenual prefrontal cortex in early onset depression. Biol Psychiatry. 2002;51(4):342–344. doi: 10.1016/s0006-3223(01)01280-x. [DOI] [PubMed] [Google Scholar]
- 53.Hirayasu Y, Shenton ME, Salisbury DF, et al. Subgenual cingulate cortex volume in first-episode psychosis. Am J Psychiatry. 1999;156(7):1091–1093. doi: 10.1176/ajp.156.7.1091. [DOI] [PMC free article] [PubMed] [Google Scholar]
- 54.Giuliani NR, Drabant EM, Gross JJ. Anterior cingulate cortex volume and emotion regulation: is bigger better? Biol Psychol. 2011;86(3):379–382. doi: 10.1016/j.biopsycho.2010.11.010. [DOI] [PMC free article] [PubMed] [Google Scholar]
- 55.Mannie ZN, Harmer CJ, Cowen PJ, Norbury R. A functional magnetic resonance imaging study of verbal working memory in young people at increased familial risk of depression. Biol Psychiatry. 2010;67(5):471–477. doi: 10.1016/j.biopsych.2009.10.006. [DOI] [PMC free article] [PubMed] [Google Scholar]
Associated Data
This section collects any data citations, data availability statements, or supplementary materials included in this article.