

Abstract
Alzheimer’s disease (AD) has a characteristic hallmark of amyloid-β (Aβ) accumulation in the brain. This accumulation of Aβ has been related to its faulty cerebral clearance. Indeed, preclinical studies that used mice to investigate Aβ clearance showed that efflux across blood-brain barrier (BBB) and brain degradation mediate efficient Aβ clearance. However, the contribution of each process to Aβ clearance remains unclear. Moreover, it is still uncertain how species differences between mouse and human could affect Aβ clearance. Here, a modified form of the brain efflux index method was used to estimate the contribution of BBB and brain degradation to Aβ clearance from the brain of wild type mice. We estimated that 62% of intracerebrally injected 125I-Aβ40 is cleared across BBB while 38% is cleared by brain degradation. Furthermore, in vitro and in silico studies were performed to compare Aβ clearance between mouse and human BBB models. Kinetic studies for Aβ40 disposition in bEnd3 and hCMEC/D3 cells, representative in vitro mouse and human BBB models, respectively, demonstrated 30-fold higher rate of 125I-Aβ40 uptake and 15-fold higher rate of degradation by bEnd3 compared to hCMEC/D3 cells. Expression studies showed both cells to express different levels of P-glycoprotein and RAGE, while LRP1 levels were comparable. Finally, we established a mechanistic model, which could successfully predict cellular levels of 125I-Aβ40 and the rate of each process. Established mechanistic model suggested significantly higher rates of Aβ uptake and degradation in bEnd3 cells as rationale for the observed differences in 125I-Aβ40 disposition between mouse and human BBB models. In conclusion, current study demonstrates the important role of BBB in the clearance of Aβ from the brain. Moreover, it provides insight into the differences between mouse and human BBB with regards to Aβ clearance and offer, for the first time, a mathematical model that describes Aβ clearance across BBB.
Keywords: Amyloid-β, blood–brain barrier, clearance, mechanistic model
1. Introduction
Amyloid-β peptides (Aβ) are by-products of neuronal metabolism that have been linked to the pathogenesis of Alzheimer disease (AD) (Selkoe, 1993). Cerebral levels of these peptides are regulated by their production rate from proteolytic degradation of amyloid precursor protein (APP), influx from plasma that is mediated mainly by receptor for advanced glycation end product (RAGE) (Deane et al., 2003), and by their clearance from the brain (Sommer, 2002). In AD, the rate of cerebral accumulation of Aβ peptides, mainly Aβ40 and Aβ42, is accelerated resulting in toxic aggregates of different sizes ranging from soluble oligomers to insoluble plaques (Jan et al., 2010). In very rare cases of AD (familial AD), Aβ accumulation is related to its overproduction (Citron et al., 1992). However, mounting evidence suggests that Aβ accumulation in the brain of late-onset “sporadic” AD patients and in some cases of familial AD is related to its impaired clearance from brain (Deane and Zlokovic, 2007). Moreover, a previous study has shown that late-onset AD is associated with 30% decrease in the clearance of Aβ while the production rate did not differ between control and AD individuals (Mawuenyega et al., 2010). Clearance of Aβ from the brain takes place by three pathways, transport across the blood-brain barrier (BBB) (Deane et al., 2009), degradation in the brain tissue (Iwata et al., 2000), and bulk flow of cerebrospinal fluid (CSF) (Silverberg et al., 2003). It is estimated that the clearance rate of Aβ40 across BBB is 6-fold higher than its clearance rate through bulk flow of CSF (Bell et al., 2007); however, the relative contribution of brain degradation was not determined.
Clearance of Aβ40 across the BBB has been extensively studied over the past decade where many contributing transporters/receptors at the BBB have been identified (Deane et al., 2009). In addition, accelerated cerebral accumulation of Aβ40 due to impaired clearance across the BBB has also been demonstrated to significantly affect its deposition and plaque formation in the brain of AD patients (Bell and Zlokovic, 2009). The main infrastructure of the BBB that regulates Aβ40 clearance is the endothelial cells lining the brain capillaries. Endothelial cells are connected to each other by strong tight junctions and they are anchored to a continuous basement membrane that is supported by perivascular end-feet of the astrocytes forming a physical barrier for the movement of compounds (Ballabh et al., 2004). Given the important contribution of endothelial cells to the function of the BBB, transport of Aβ40 across these cells is a crucial step in the clearance of Aβ40. As a peptide, Aβ40 has poor passive membrane permeability and it depends on transport system to pass across the endothelial cells of BBB (Banks et al., 2003). Aβ40 is known to be a substrate for many receptors and transporters at the BBB such as low density lipoprotein receptor-related protein-1 (LRP1) and P-glycoprotein (P-gp) that contribute to its clearance from the brain to blood (Cirrito et al., 2005; Shibata et al., 2000), and RAGE that is involved in Aβ40 influx from blood to brain (Deane et al., 2003).
Mouse is a widely used animal model to study cerebral clearance of Aβ40. Available studies, independently (Barten et al., 2005; Cirrito et al., 2003; Mawuenyega et al., 2010), demonstrated a significant difference in Aβ40 clearance rate between mice and humans. In cognitively normal individuals, about 7% of Aβ40 is cleared from the brain per hour (corresponding half-life of ~10 h) and this percent decreased to 5.2% in patients with AD (corresponding half-life of ~13 h) (Mawuenyega et al., 2010). On the other hand, the half-life of human Aβ40 in mouse brain ranges from 0.63 h in Tg2576 mice to 2 h in PDAPP mice (Barten et al., 2005; Cirrito et al., 2003). Thus, the rate of Aβ40 clearance from mouse brain is at least 5-fold higher than human brain. However, differences in the rate of Aβ40 clearance by degradation and/or transport across the BBB between mouse and human remain unknown.
Evaluation of kinetic parameters of Aβ40 uptake, efflux and degradation by endothelial cells is essential to understand key steps involved in Aβ40 clearance across the BBB. To date, available studies have modeled Aβ40 clearance in vivo across the mouse BBB to calculate Aβ40 kinetic parameters (Bell et al., 2007; Kandimalla et al., 2005; Shibata et al., 2000). However, the calculated parameters represented overall clearance across BBB and do not distinguish between clearance via transport or degradation. To estimate the kinetic parameters of the several processes involved in Aβ40 clearance including uptake, efflux and degradation across the BBB, in vitro models of BBB are preferred. Moreover, as Aβ40 disposition in brain endothelial cells involves several processes that simultaneously take place, it is difficult to use a conventional Michaelis-Menten approach to estimate Aβ40 disposition kinetic parameters by these cells. Therefore, utilization of mechanistic models should provide a better approach to estimate and understand Aβ40 kinetic disposition in endothelial cells (Poirier et al., 2008).
Accordingly and given the important role of the BBB in the clearance of Aβ40, we hypothesized that BBB plays the major role in brain Aβ40 clearance compared to Aβ40 brain degradation, and that the higher clearance rate of Aβ40 from mouse brain compared to human brain is due to differences in Aβ40 clearance across the BBB. Three aims were set to examine this hypothesis, 1) investigate the in vivo contribution of the BBB to Aβ40 clearance relative to its brain degradation, 2) compare mechanisms and rate of Aβ40 clearance between mouse and human BBB in vitro models, and 3) establish a mechanistic kinetic model that describe differences in Aβ40 disposition between mouse and human endothelial cells.
2. Material and Methods
2.1. Animals
C57BL/6 male mice (6–7 weeks old; Harlan Laboratories, Houston, TX) were kept under standard environmental conditions (22°C, 35% relative humidity, 12 h dark/light cycle) with free access to tap water and standard rodent food. All animal experiments were approved by the Institutional Animal Care and Use Committee of the University of Louisiana at Monroe. All surgical procedures were consistent with the IACUC policies and procedures.
2.2. Brain efflux index (BEI) study
In vivo Aβ40 clearance was investigated using the BEI method as described previously (Qosa et al., 2012). In brief, a stainless steel guide cannula was implanted stereotaxically into the right caudate nucleus of mice that had been anesthetized with intraperitoneal xylazine and ketamine (20 and 125 mg/kg, respectively) (Henry Schein Inc., NY). After 12 h recovery period, animals were re-anesthetized and tracer fluid (0.5 μl) containing 125I-Aβ40 (30 nM, PerkinElmer, MA) and 14C-inulin (0.02 μCi, American Radiolabeled Chemicals, MO) prepared in extracellular fluid buffer (ECF) was administered. Thirty minutes post 125I-Aβ40 injection (Cirrito et al., 2005; Shibata et al., 2000); brain tissues were rapidly collected for 125I-Aβ40 analysis. To characterize role of P-gp and LRP1, 0.5 μl of ECF containing valspodar (40 μM; XenoTech, KS), a well-established P-gp inhibitor, or RAP (1 μM; Oxford Biomedical Research, MI), an LRP1 inhibitor, were intracerebrally administered 5 min prior to 125I-Aβ40 injection.
2.3. Calculation of in vivo 125I-Aβ40 clearance
Calculations of 125I-Aβ40 clearance were performed as described previously (Qosa et al., 2012; Shibata et al., 2000). Using the trichloroacetic acid (TCA) precipitation assay intact (precipitate) and degraded (supernatant) 125I-Aβ40 were determined in brain tissue using a Wallac 1470 Wizard Gamma Counter (PerkinElmer Inc., Waltham, MA). 14C-inulin in precipitate and supernatant were also determined using a Wallac 1414 WinSpectral Counter (PerkinElmer Inc.). To calculate the total clearance of 125I-Aβ40 from the brain, a modified equation of the BEI method (Qosa et al., 2012) was used to calculate brain clearance index (BCITotal(%)), i.e. clearance across BBB and brain degradation (equation 1). Clearance of 125I-Aβ40 across BBB (BCIBBB(%)) and brain degradation (BCIDegradation(%)) were defined by equations 2 and 3, respectively.
| (Eq. 1) |
| (Eq. 2) |
| (Eq. 3) |
2.4. Cell Culture
The mouse (bEnd3) and human (hCMEC/D3) brain endothelial cells were used as representative models for mouse and human BBB, respectively. bEnd3, passage 25–35, were cultured in DMEM supplemented with 10% fetal bovine serum (FBS), penicillin G (100 units/ml) and streptomycin (100 μg/ml). hCMEC/D3, passage 25–35, were cultured in EBM-2 medium supplemented with 1 ng/ml human basic fibroblast growth factor (Sigma-Aldrich, MO), 10 mM HEPES, 1% chemically defined lipid concentrate (Gibco, NY), 5 μg/ml ascorbic acid, 1.4 μM hydrocortisone, 1% penicillin-streptomycin and 5% of heat-inactivated FBS “gold”. Cultures were maintained in a humidified atmosphere (5%CO2/ 95% air) at 37°C.
2.5. Uptake and degradation of 125I-Aβ40 by bEnd3 and hCMEC/D3 cells
To study uptake and degradation of 125I-Aβ40, cells were seeded at a density of 5 × 10⁴ per well in 24-well plate, and maintained for 3 to 5 days. Uptake and degradation of 125I-Aβ40 were evaluated for 15 min and 12 h in bEnd3 and hCMEC/D3 cells, respectively. These time points were determined from 125I-Aβ40 depletion studies. In addition, initial studies to confirm the indivisible 125I-label from Aβ40, and the integrity of 125I-Aβ40 over different time points were performed by incubation of 0.1 nM of 125I-Aβ40 in media without cells, and by 16% bis-tris gel electrophoresis. The results demonstrated insignificant dissociation of 125I from Aβ40 during the investigated time points (Supplementary figure 1a), and the absence of dimers or higher oligomer formation at 12 h, the duration of the uptake study (Supplementary figure 1b). Uptake studies were initiated by addition of fresh warm medium containing 0.1 nM of 125I-Aβ40. For inhibition studies, RAP (1 μM), RAGE-IgG (5 μg/ml, Santa Cruz Biotechnology Inc., CA, USA) and valspodar (5 μM) were pre- and co-incubated with 125I-Aβ40 at 37°C. At the end of incubation period, media were collected and cells were washed twice with ice-cold PBS containing 0.2% BSA to minimize non-specific binding of 125I-Aβ40, and once with warm PBS. Cells were dissolved in 200 μl RIPA buffer containing complete mammalian protease inhibitors for 20 min on ice with shaking. Intact and degraded 125I-Aβ40 were measured in media and cell lysates as described below. Total amount of protein in each sample was determined using BCA protein assays. Net uptake of 125I-Aβ40 by the cells was normalized to the total amount of cellular protein.
2.6. 125I-Aβ40 analysis
For all in vitro experiments, intact and degraded 125I-Aβ40 were measured in the medium and cells. Total 125I-Aβ40 was determined by counting sample radioactivity. Degraded 125I-Aβ40 was measured in the supernatant following precipitation with TCA (20%) in 1:1 ratio (v/v) (Qosa et al., 2012). The intact fraction was calculated by subtracting degraded 125I-Aβ40 from total 125I-Aβ40. ELISA kits (SensoLyte Anti-Human beta-Amyloid 1–40, Anaspec, CA) were used to calculate exact starting concentrations for all in vitro experiments, and to confirm 125I-Aβ40 degradation obtained from TCA assay. For ELISA analysis, 100 μl of each sample were used to measure intact 125I-Aβ40. All cpm values of 125I-Aβ40 were converted to fmole based on the specific activity of 125I-Aβ40, γ-counter efficiency and fmole versus cpm calibration curve obtained by ELISA assay (data not show).
2.7. Localization of Aβ40-HiLyte Fluor into acidic organelles
For imaging studies, cells were plated on 8-well chambered glass slides (LAB-Tek, Nalge Nunc, NY) at 12,000 cells/cm2, and allowed to grow overnight. bEnd3 and hCMEC/D cells were incubated with Aβ40-HiLyte Fluor (1 nM, Alexa-Fluor, Anaspec, CA) for 15 min and 12 h, respectively. To track Aβ40-HiLyte Fluor in acidic organelles, LysoTraker Red (Invitrogen, OR, USA), a weakly basic fluorophore that selectively accumulates in acidic organelles of the endosomal/ lysosomal pathway, was added at 75 nM to the incubation media 45 min prior to the end of Aβ40-HiLyte Fluor incubation in hCMEC/D cells, and 30 min prior to the addition of Aβ40-HiLyte Fluor and during incubation in bEnd3 cells. At the end of the incubation periods, cells were washed and fixed with 4% formaldehyde for 5 min on ice. Cells were mounted with DAPI. Images for Aβ40-HiLyte Fluor and LysoTracker Red were captured using a Zeiss LSM 5 Pascal confocal microscope equipped with 488 nm Argon laser and 543 nm HeNe Laser using a 63X oil immersion objective lens with numerical aperture = 1.4 (Carl Zeiss MicroImaging LLC, Thornwood, NY).
2.8. 125I-Aβ40 transport across bEnd3 and hCMEC/D3 cells
For transport studies, transwell polyester membrane inserts, 6.5 mm diameter with 0.4 μm pores (Corning, NY), were coated with collagen (150 μg/ml). Cells were plated onto coated inserts at a seeding density of 50,000 cells/cm2, medium was changed every other day. Trans-epithelial electrical resistance (TEER) was measured using an EVOM epithelial volt-ohmmeter with STX2 electrodes (World Precision Instruments, FL). According to the value of TEER (~35 Ω.cm2) both cell lines were used for 125I-Aβ40 transport experiments on day 6. Apical to basolateral (A→B) transport studies were initiated by addition of 0.1 nM 125I-Aβ40 and 0.05 mM 14C-inulin to the apical compartment, while basolateral to apical (B→A) transport studies were initiated by addition of 0.1 nM 125I-Aβ40 and 0.05 mM 14C-inulin to the basolateral compartment. At the end of incubation period (30 min for bEnd3 and 12 h for hCMEC/D3 cells), media in both compartments and cells were separately collected for 125I-Aβ40 analysis and inulin measurement. The clearance quotients of A→B (125I-Aβ40 CQA→B) and B→A (125I-Aβ40 CQB→A) transports were calculated using the following equations (Nazer et al., 2008):
| (Eq. 4) |
| (Eq. 5) |
where 125I-Aβ40 total is the total intact cpm in the apical and basolateral compartments, as well as cpm remaining in cells. 14C-inulin total is the total inulin dpm in the apical and basolateral compartments. To evaluate the effect of different inhibitors on 125I-Aβ40 transport and degradation across cell monolayer valspodar (5 μM), RAP (1 μM), and RAGE-IgG (5 μg/ml) were pre- and co- incubated with 125I-Aβ40.
2.9. Western blotting
For western blot analysis of P-gp, LRP1 and RAGE in bEnd3 and hCMEC/D3 cells, 25 μg of cellular protein was resolved on 7.5% SDS-polyacrylamide gels and transferred onto nitrocellulose membrane. Membranes were blocked with 2% BSA and incubated overnight with monoclonal antibodies for LRP1 (Calbiochem, NJ), P-gp (C-219, Covance Research Products, MA), RAGE (N-16) or β-actin (C-11) (Santa Cruz) at dilutions 1:200, 1:1500, 1:200 and 1:3000, respectively. For protein detection, the membranes were washed and incubated with HRP-labeled secondary IgG antibody for LRP1 and P-gp (anti-mouse) and RAGE and β-actin (anti-goat) (Santa Cruz) at 1:5000 dilutions. The bands were visualized using a SuperSignal West Femto detection kit (Thermo Scientific, IL). Quantitative analysis of the immunoreactive bands was performed using a GeneSnap luminescent image analyzer (Scientific Resources Southwest, TX) and band intensities were measured by densitometric analysis.
2.10. Modeling of 125I-Aβ40 disposition in bEnd3 and hCMEC/D3 cells
Intracellular concentration of intact 125I-Aβ40 is controlled by three active processes; uptake, efflux and degradation. To establish a mechanistic model that describes these processes, cells were grown in 24-well plates and maintained as described above. Experiments were initiated by addition of fresh warm media containing 125I-Aβ40. bEnd3 cells were incubated at 37°C for 5, 15, 30, 60 and 120 min with different 125I-Aβ40 concentrations of 0.4, 0.8, 1.5, 3, 8 nM, while hCMEC/D3 cells were incubated at 37°C for 0.5, 1, 6, 12 and 24 h with 125I-Aβ40 concentrations of 0.8, 1.5, 3, 6, 12 nM. At the end of each incubation period, media were removed and cells were washed and lysed. Concentrations of intact and degraded 125I-Aβ40 were measured in both medium and cells. To calculate efflux parameters, bEnd3 and hCMEC/D3 cells were preloaded with different concentrations of 125I-Aβ40, as above, for 15 min and 12 h, respectively. At the end of the incubation period, culture media were removed, cells were washed and fresh warm media were added to the cells. Cells were incubated for 1, 3, and 5 min at 37°C. After that, media were collected and cells were washed and lysed. 125I-Aβ40 in media and cells were analyzed and efflux rates (fmole/min) of intact 125I-Aβ40 were plotted against intracelluar 125I-Aβ40 concentrations (nM). Efflux parameters were used as fixed values in building the model to simplify modeling procedure by decreasing the number of parameters to be estimated. For intracellular volume estimation (~ 0.18 μl), the protein content of endothelial cells was converted to volume using a previously published constant of 3 μl/mg protein (Brillault et al., 2008). At all examined concentrations, time versus intact 125I-Aβ40 concentration in intracellular compartment was modeled according to equation 6:
| (Eq. 6) |
and the time versus intact 125I-Aβ40 concentration in medium compartment was modeled according to equation 7:
| (Eq. 7) |
whereas, change in the concentration of degraded 125I-Aβ40 in cells overtime was defined by equation 8:
| (Eq. 8) |
In all equations, Vmax was expressed in fmole/min, Km in nM, and CL in nl/min. The mechanistic in vitro model was implemented in MatLab version 7.10 (MathWorks, MA, USA) to simultaneously estimate Vmax, Km and CL of 125I-Aβ40 uptake, while Vmax and Km of the efflux were fed to the model as fixed values that were estimated from the efflux studies. All data points were fitted in a single step using equation 6 with triplicates for each of the five time points for each concentration. SDs were calculated for all parameters obtained from individual experiments and coefficients of variation (CVs) for each parameter were subsequently calculated and expressed as a percentage to assess the quality of the parameter (Poirier et al., 2008).
2.11. Statistical analysis
Unless otherwise indicated, the data were expressed as mean±SEM. The experimental results were statistically analyzed for significant difference using two-tailed Student’s t-test for 2 two groups, and one-way analysis of variance (ANOVA) for more than two groups analysis. Values of P<0.05 were considered statistically significant.
3. Results
3.1. In vivo clearance of 125I-Aβ40 across BBB
The first objective of current study was to estimate the specific contribution of BBB to the clearance of 125I-Aβ40 from the brains of C57BL/6 mice. BCI method, a modified method for BEI, was used to calculate total clearance, i.e. efflux across BBB and clearance by degradation of 125I-Aβ40 in mouse brain. BCITotal(%) demonstrated 58.7±3.9% of administered 125I-Aβ40 was cleared from mouse brain 30 min following 125I-Aβ40 microinjection (Figure 1A). BCIBBB(%) showed that 35.6±3.3% of injected 125I-Aβ40, i.e. 62% of the BCITotal(%), was cleared across the BBB (Figure 1B). On the other hand, 23.1±2.3% of injected 125I-Aβ40, i.e. 38% of BCITotal(%), was cleared by brain degradation (Figure 1C). To elucidate the specific contribution of P-gp and LRP1 to BBB clearance and brain degradation of 125I-Aβ40, BCITotal(%), BCIBBB(%) and BCIDegradation(%) of 125I-Aβ40 were determined in the presence of specific P-gp and LRP1 inhibitors. P-gp and LRP1 inhibition caused 25% (43.9±4.8%, P<0.05) and 49% (30.1±1.7, P<0.01) reduction, respectively, in 125I-Aβ40 BCITotal(%) (Figure 1A). Moreover, our results showed that although P-gp and LRP1 inhibition significantly decreased 125I-Aβ40 BCIBBB(%) to 18.3±1.5% (P<0.01) and 22.9±1.7 (P<0.05), respectively, only inhibition of LRP1 decreased 125I-Aβ40 BCIDegradation(%) to 7.2±0.4% (P<0.001; Figures 1B and C). Collectively, these results confirm the significant contribution of BBB to cerebral clearance of 125I-Aβ40 compared to brain degradation, and signify the importance of P-gp and LRP1 at the BBB in this process.
Figure 1. In vivo clearance of 125I-Aβ40 from brain of C57BL/6 mice.
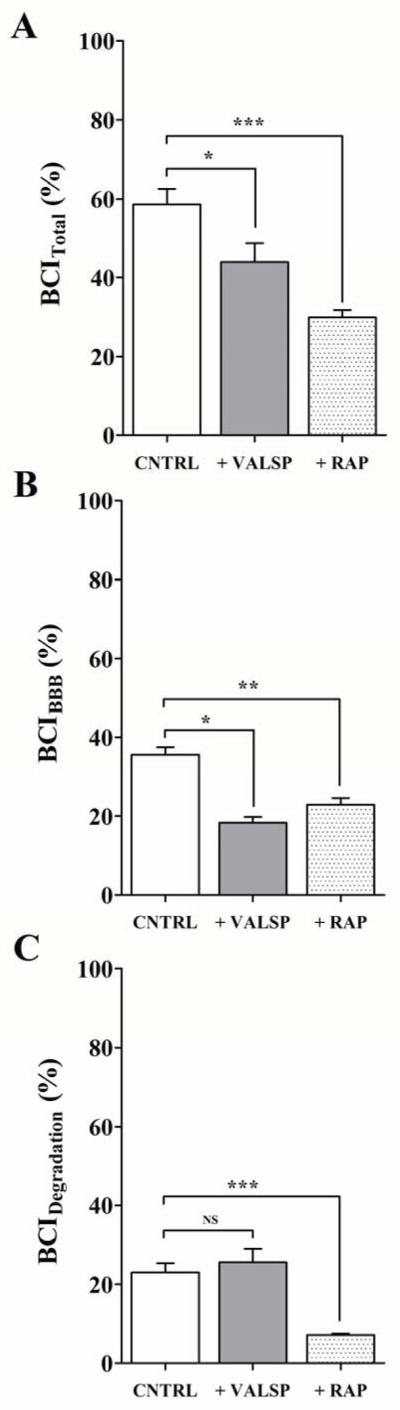
Total brain clearance (BCITotal(%)) of 125I-Aβ40 in control (CNTRL), with P-gp inhibitor valspodar (VALSP) or LRP1 inhibitor RAP (A), BBB clearance (BCIBBB(%)) of 125I-Aβ40 in control and inhibitor groups (B), clearance of 125I-Aβ40 by brain degradation (BCIDegradation(%)) in control and inhibitor groups (C). Data represent mean±SEM for n=4; * P<0.05, ** P<0.01 and *** P<0.001. NS is not significant.
3.2. In vitro uptake of 125I-Aβ40 by bEnd3 and hCMEC/D3 cells
Results from preliminary depletion studies showed that while 2 h incubation time was sufficient for complete depletion of 125I-Aβ40 from the medium of bEnd3 cells, more than 24 h incubation time was required with hCMEC/D3 cells (Figure 2). Consistent with the depletion study, bEnd3 cells showed very rapid uptake and degradation of 125I-Aβ40 compared to hCMEC/D3 cells. As shown in Figure 3A, bEnd3 cellular level of intact 125I-Aβ40 was 0.27±0.02 fmole/mg after 15 min incubation, while 12 h was needed for hCMEC/D3 to reach a similar cellular level of intact 125I-Aβ40 (0.26±0.01 fmole/mg). The degradation of 125I-Aβ40 by bEnd3 and hCMEC/D3, measured in the medium, reached 73.7±2.0 and 65.7±1.8% after 15 min and 12 h of 125I-Aβ40 addition, respectively (Figure 3B). Inhibition of LRP1 by RAP significantly decreased the cellular level of intact 125I-Aβ40 in bEnd3 and hCMEC/D3 cells by 67% and 42%, respectively (P<0.001, Figure 3A). The degradation of 125I-Aβ40 in bEnd3 and hCMEC/D3 was also decreased by 24% and 28%, respectively, by RAP (P<0.01, Figure 3B). On the other hand, inhibition of RAGE significantly decreased the cellular level of intact 125I-Aβ40 by 75% in both cells (P<0.001, Figure 3A), while 125I-Aβ40 degradation was not altered by RAGE inhibition in both cells (P>0.05, Figure 3B). Inhibition of P-gp by valspodar did not cause any significant change in 125I-Aβ40 accumulation in bEnd3 cells (P>0.05, Figure 3A), whereas this effect was obvious and significant in hCMEC/D3 where P-gp inhibition caused 15% increase in cellular levels of intact 125I-Aβ40 (P<0.05, Figure 3A). As expected, P-gp inhibition has no effect on 125I-Aβ40 degradation in both cells (P>0.05, Figure 3B). In order to explain the differences in 125I-Aβ40 disposition between the two cell lines, expression studies were performed by Western blotting. Both cell lines showed comparable levels of LRP1, significantly higher RAGE expression in bEnd3 compared to hCMEC/D3, and higher expression of P-gp in hCMEC/D3 compared to bEnd3 cells (Figure 4).
Figure 2. Depletion studies of 125I-Aβ40 in bEnd3 and hCMEC/D3 cells over 24 h.

Media containing 1.5 nM 125I-Aβ40 was added to cells in 24-well plate. Media were collected after 5, 15, 30 min and 1, 6, 12, 24 h to measure intact 125I-Aβ40 remaining in media by ELISA and radioactivity analyses. Figure inside inset demonstrates the linear range of depletion (0–0.5 h) observed with bEnd3.
Figure 3. In vitro uptake and degradation of 125I-Aβ40 by bEnd3 and hCMEC/D3 cells.

A) In vitro uptake of intact 125I-Aβ40 by bEnd3 and hCMEC/D3 cells. Cellular level of intact 125I-Aβ40 is expressed in fmole/mg protein following cells treatment with 0.1 nM 125I-Aβ40 without (control; CNTRL) and with RAGE (RAGE-IgG), or P-gp (valspodar; VALSP), or LRP1 (RAP) inhibitors for 15 min and 12 h in bEnd3 and hCMEC/D3, respectively. B) Percent of degraded 125I-Aβ40 in the media of bEnd3 and hCMEC/D3 cells following treatment with 0.1 nM of 125I-Aβ40, with or without inhibitor. Data represent mean±SEM from three independent experiments; *P<0.05, **P< 0.01 and *** P<0.001.
Figure 4. Expression of LRP1, RAGE and P-gp in bEnd3 and hCMEC/D3 cells.
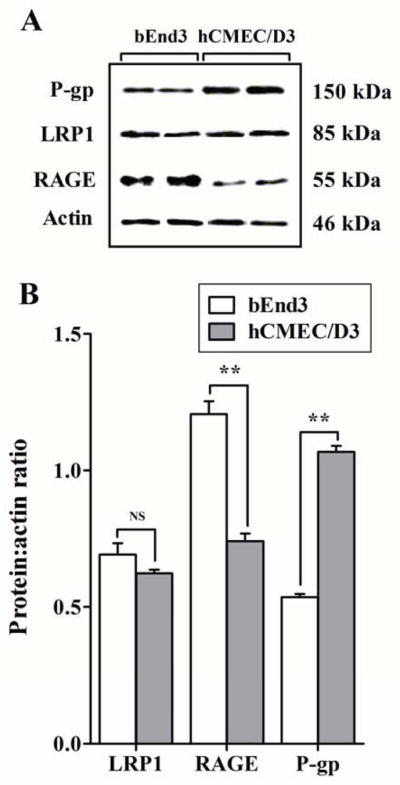
A) Western blot analysis of LRP1, RAGE and P-gp protein expression in bEnd3 and hCMEC/D3 cells. B) Densitometry analyses showed similar expression level of LRP1 in two cells, higher RAGE expression in bEnd3 cells and higher P-gp expression in hCMEC/D3 cells. Data represent mean±SEM from three independent experiments; ** P<0.01, NS is not significant.
3.3. Accumulation of Aβ40 in acidic organelles
While the localization of Aβ40 in endosomal/lysosomal organells has been previously reported in bovine endothelial cells (Kandimalla et al., 2009), in this study, we have shown for the first time the endosomal/ lysosomal localization of Aβ40 in human and mouse brain endothelial cells, a pathway that is associated with degradation preceded by peptide uptake. The cellular localization of Aβ40 was studied by monitoring cellular accumulation of Aβ40-HiLyte Fluor in the acidic organelles. Aβ40-HiLyte Fluor showed a clear co-localization with LysoTracker Red in bEnd3 and hCMEC/D3 cells (Figure 5). Pearson’s correlation coefficients of Aβ40-HiLyte Fluor co-localization with LysoTracker Red were about 0.64 in both cell lines, suggesting that uptaken Aβ40 was directed to degradation via endosomal/lysosomal pathway.
Figure 5. Degradation of Aβ40 within endosomal/lysosomal pathaway of bEnd3 and hCMEC/D3 cells.
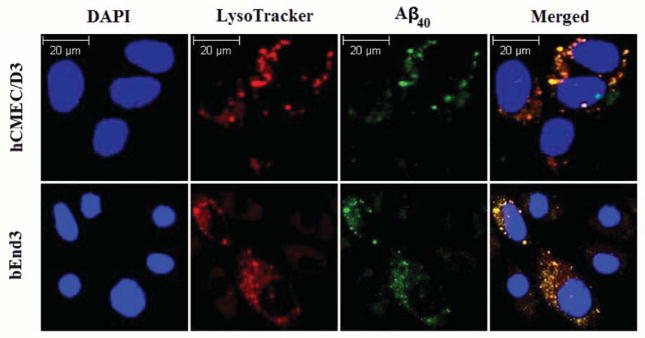
Co-localization of intracellular Aβ40-HiLyte Fluor and LysoTracker Red in endosomal/lysosomal pathway of brain endothelial cells (bEnd3 and hCMEC/D3) analyzed using confocal immunoFluorescence microscope. bEnd3 cells and hCMEC/D3 were incubated with 1 nM of Aβ40-HiLyte Fluor for 15 min or 12 h; respectively. DAPI stains nuclei. Lysosomes were labeled with LysoTracker Red for 45 min before the end of study. The yellow color in the merged image represent co-localization of green (Aβ40-HiLyte Fluor) and red (LysoTracker Red) fluorescence.
Additional experiments were performed to evaluate the contribution of specific 125I-Aβ40 degrading proteases to its total degradation relative to the lysosomal degradation. In these studies, the expression and activity of major Aβ40 degrading enzymes including insulin-degrading enzyme (IDE) and neprilysin in bEnd3 and hCMEC/D3 cells were evaluated. Expression studies were achieved by Western blotting, and activity studies were examined using inhibition studies for each enzyme. The results demonstrated that IDE and neprilysin are expressed in both cell lines with significantly higher expression in bEnd3 (Supplementary figure 2a). In addition, while the inhibition of IDE by bacitracin (1 mg/mL) significantly decreased Aβ40 degradation in both cells, its contribution to the total degradation was low (20% and 12% in bEnd3 and hCMEC/D3, respectively (Supplementary figure 2b). On the other hand, the inhibition of neprilysin by thiorphan (2 mM) did not show any significant effect on Aβ40 degradation in both cells (Supplementary figure 2b). Neprilysin has low affinity for its physiological substrates (in the low mM range) (Shibata et al., 2000) and Aβ40 concentrations used in our experiments were in the low nM range, thus it is more likely for Aβ40 to bind its high affinity receptors that mediate its endocytosis and non-specific lysosomal degradation. Collectively, these findings demonstrate that both non-specific lysosomal degradation and specific protease dependent degradation are involved in Aβ40 degradation by brain endothelial cells, however, with superior contribution of the non-specific lysosomal pathway.
3.4. 125I-Aβ40 transport across endothelial cells
Results of transport studies showed A→B transport of 125I-Aβ40 was about 2-fold higher across bEnd3 than hCMEC/D3 cells. CQA→B of intact 125I-Aβ40 was 0.62±0.06 and 0.32±0.02 across bEnd3 and hCMEC/D3 cells, respectively (P<0.01, Figure 6A). RAGE inhibition decreased A→B transport of 125I-Aβ40 by 50% in bEnd3 and 33% in hCMEC/D3 cells (P<0.01, Figure 6A). Consistent with the results of the uptake study, inhibition of P-gp increased transport of 125I-Aβ40 from A→B by 22% in hCMEC/D3 while no alteration in 125I-Aβ40 transport in bEnd3 was observed (Figure 6A). On the other hand, 125I-Aβ40 transport from B→A was more than 2-fold higher in hCMEC/D3 compared to bEnd3 (P<0.01, Figure 6B). This observation can be explained by the fact that at 30 min the concentration of intact 125I-Aβ40 available in bEnd3 for transport is lower than that at 12 h in hCMEC/D3, which is consistent with the rapid degradation of 125I-Aβ40 seen in the depletion studies (Figure 2). In agreement with the role of LRP1, RAP decreased intact 125I-Aβ40 transport from B→A direction by 42% in both cells (P<0.01, Figure 6B). In addition, consistent with rapid depletion in bEnd3, degradation of 125I-Aβ40 was significantly higher in bEnd3 than hCMEC/D3 in both directions (P<0.01, Figures 6C and D). Inhibition of RAGE, P-gp, or LRP1 did not affect 125I-Aβ40 degradation in both cell lines and in either direction (Figures 6C and D).
Figure 6. Transport of Aβ40 across bEnd3 and hCMEC/D3 cell monolayers.

Apical to basolateral (A→B) and basolateral to apical (B→A) permeability and degradation of 0.1 nM 125I-Aβ40 across bEnd3 and hCMEC/D3 cells determined at 30 min and 12 h, respectively. Clearance quotient CQA→B and degradation of 125I-Aβ40 across bEnd3 and hCMEC/D3 cells in the absence (CNTRL) or presence of RAGE (RAGE-IgG) or P-gp (VALSP) inhibitors (A, C). CQB→A and degradation of 125I-Aβ40 across bEnd3 and hCMEC/D3 in the absence (CNTRL) or presence of LRP1 inhibitor (RAP) (B, D). Data represent mean±SEM from three independent experiments, * P<0.05, ** P<0.01 and *** P<0.001.
3.5. Mechanistic model for Aβ40 cellular disposition
Initial uptake studies of 125I-Aβ40 (0.1 nM) over 2 and 24 h incubation in bEnd3 and hCMEC/D3, respectively, showed a saturable uptake process of 125I-Aβ40 by both cells, with significantly higher rate of uptake in bEnd3 cells (Supplementary figure 3). On the other hand, efflux studies demonstrated a saturable efflux process in both cells with similar rates (Supplementary figure 4). Degradation studies, however, demonstrated unsaturable intracellular degradation of 125I-Aβ40 in both cells as the percentage of degraded 125I-Aβ40 were constant (73.7±2.0 and 65.7±1.8% in bEnd3 and hCMEC/D3, respectively) as a function of concentration. High intracellular concentration of Aβ40 and presence of multiple processes that work simultaneously necessitates the use of a mechanistic model approach to estimate kinetic parameters for each of these integrated processes. Kinetic parameter determination using a mechanistic model approach depends on measurement of 125I-Aβ40 uptake and degradation at multiple time points and for different 125I-Aβ40 concentrations at each time point. Based on our results of 125I-Aβ40 uptake and degradation in bEnd3 and hCMEC/D3 cells at different time points and 125I-Aβ40 concentrations, we established a mechanistic two-compartment model that describes uptake, efflux and degradation of 125I-Aβ40 by endothelial cells. The model structure consisted of saturable uptake and efflux processes in addition to linear intracellular degradation process (Figure 7A). Appropriate equations were fit to the mean 125I-Aβ40 accumulation in endothelial cells versus time data plotted in Figure 7 (B-E). Based on visual inspection of the residuals, coefficients of variation (CV%) of the recovered parameters and Akaike’s information criterion values, the model structure presented in Figure 7A provided the best description of the entire data set. This model scheme incorporated saturable uptake and efflux steps (Km,uptake, Vm,uptake and Km,efflux, Vm,efflux) and a linear intracellular degradation (CL). Estimates of kinetic parameters obtained from the model are shown in Table 1. The model recovered good estimates of all parameters. Consistent with the observed data, established model indicated a very rapid 125I-Aβ40 uptake in bEnd3 when compared to hCMEC/D3 cells with intrinsic uptake (Vmax/Km) from media of 35-fold higher in bEnd3. Moreover, this model showed 15-fold higher rate of intracellular degradation (CL) by bEnd3 cells. Estimated Km values indicated that 125I-Aβ40 has higher affinity for uptake receptors in bEnd3 than in hCMEC/D3 while it has similar affinity for efflux transporters/receptors (Table 1). Similarly, uptake was more efficient in bEnd3 than hCMEC/D3 evident by the higher Vmax for 125I-Aβ40 uptake in bEnd3 cells while the rate of efflux were comparable between the two cells.
Figure 7. Mechanistic modeling of Aβ40 disposition by bEnd3 and hCMEC/D3 cells.

Schematic description of proposed mechanistic model that describes 125I-Aβ40 uptake, efflux and degradation by endothelial cells (A). This mechanistic model contains two-compartments corresponding to the incubation media (Cmed, concentration of intact 125I-Aβ40 in media in nM), and intracellular space of the cells (Ccell, cellular concentration of intact 125I-Aβ40 in nM; Dcell, cellular concentration of degraded 125I-Aβ40 in nM). This model provides the optimal model structure for 125I-Aβ40 disposition in endothelial cells. Kinetic profiles of cellular levels of intact (B) and degraded (D) 125I-Aβ40 in bEnd3 cells obtained when measured in plated cells at 0.4 nM (●), 0.8 nM (▲), 1.5 nM (▼), 3 nM (◆) and 6 nM (■) over 2 h incubation period; and cellular levels of intact (C) and degraded (E) 125I-Aβ40 in hCMEC/D3 cells when measured in plated cells at 0.8 nM (●), 1.5 nM (▲), 3 nM (▼), 6 nM (◆) and 12 nM (■) over 24 h incubation period. Lines represent the predicted cellular level obtained from the mechanistic two-compartment model. Observed data points are mean of triplicate measurements.
Table 1.
Kinetic apparent parameters of 125I-Aβ40 disposition by hCMEC/D3 and bEnd3 cells estimated from mechanistic model.
| Parameter | hCMEC/D3 | bEnd3 | ||
|---|---|---|---|---|
|
| ||||
| Estimate | CV% | Estimate | CV% | |
| Km, uptake (nM) | 49.1 | 0.1 | 19.8 | 14.3 |
| Vmax, uptake (fmole/min) | 4.0 | 0.01 | 56.4 | 3.9 |
| Intrinsic uptake (nl/min) | 81 | 2848 | ||
| Km, efflux (nM) | 7.5 | 17.4 | 7.6 | 22.7 |
| Vmax, efflux (fmole/min) | 0.12 | 12.2 | 0.14 | 17.1 |
| Intrinsic efflux (nl/min) | 16 | 18 | ||
| CL (nl/min) | 17 | 4.5 | 260 | 5 |
4. Discussion
Efficient brain clearance of Aβ40 is important to prevent its brain accumulation (Mawuenyega et al., 2010). Therefore, quantitative assessment of the contribution of different clearance pathways is important to elucidate key factors that could significantly enhance brain Aβ40 accumulation. Although Aβ40 is less pathogenic than Aβ42 due to its low propensity to aggregate (Jan et al., 2010; Sommer, 2002), Aβ40 is found at several fold higher than Aβ42 in the brain, and its accumulation disrupts the integrity of BBB (Gregory and Halliday, 2005). Therefore, it is important to investigate clearance of Aβ40 across the BBB. Previous studies reported significant contribution of the BBB to Aβ40 clearance with less contribution of CSF bulk flow; however, the role of brain degradation was not elucidated (Bell et al., 2007). In the current study, we estimated contribution of BBB and brain degradation to the total brain clearance of Aβ40 in mouse brain using a modified form of the BEI method. The BEI method depends on measuring intact 125I-Aβ40 remained in the brain after specific time of intracerebrally injected 125I-Aβ40, which does not only consider clearance across the BBB but also brain degradation of 125I-Aβ40. The modified method of BEI allowed quantification of BBB relative contribution (62%) and brain degradation (38%) to the total clearance of brain Aβ40, excluding clearance via CSF flow which was previously estimated to contribute by 10–15% of overall brain Aβ40 clearance (Shibata et al., 2000). The relative contribution of these Aβ40 clearance pathways from the brain is summarized in Fig. 8. Consistent with its function as Aβ40 efflux transporter (Cirrito et al., 2005), inhibition of P-gp decreased the clearance of Aβ40 across the BBB without altering its brain degradation, while LRP1 inhibition by RAP decreased both, clearance across the BBB and brain degradation of Aβ40. These results are in agreement with brain distribution and function of LRP1. LRP1 is expressed in brain microvessels where it mediates intact Aβ40 clearance via receptor-mediated transcytosis (Castellano et al., 2012; Shibata et al., 2000), and in neurons and brain vascular smooth muscle cells where it mediates endocytosis and degradation of Aβ40 (Fuentealba et al., 2010; Kanekiyo et al., 2012). Low-density lipoprotein receptor (LDLR) family members have also been reported to mediate Aβ40 degradation in particular cell types within the brain (Basak et al., 2012), and similar to LRP1, these LDLR members are subjected to RAP inhibition (Bu, 1998). Thus, reduction in brain Aβ40 degradation observed following RAP intracerebral administration could be related to LRP1 inhibition and possibly other LDLRs expressed in different brain cellular components. However, at the BBB, it is possible that RAP primarily inhibited LRP1transport of Aβ40 as proposed by a previous study where the inhibition of LRP1 at the mouse brain capillaries by RAP or a specific LRP1 antibody showed comparable reduction in Aβ40 uptake and clearance suggesting RAP specific inhibition of LRP1 (Deane et al., 2004).
Figure 8. Schematic representation of Aβ40 disposition in the brain.

Different cellular compartments in the brain contribute to Aβ40 clearance. Endothelial cells express LRP1 which mediates Aβ40 transport across the BBB from the brain to the blood by transcytosis (1 and 2), at the luminal side P-gp effluxes Aβ40 to the blood (3), and RAGE mediates Aβ40 uptake toward the brain (4). In addition, endothelial cells express unknown components that mediate uptake and degradation of Aβ40 (5). LRP1 expressed at the cell membranes of neurons and astrocytes (6 and 7, respectively) mediates uptake and degradation of Aβ40. In addition to cellular components, interstitial enzymes, IDE and NEP participate in Aβ40 disposition by extracellular degradation (8). About 10–15% of Aβ40 is cleared from interstitial fluid by CSF bulk flow (9).
Transgenic AD mice models are widely used in AD research. Available studies showed that transgenic mice clear human Aβ40 from the brain at higher rate compared to human brain (Cirrito et al., 2003; Mawuenyega et al., 2010). Given the differences in clearance rate of Aβ40 between mouse and human and the important contribution of BBB to Aβ40 clearance, a set of experiments were designed to compare Aβ40 disposition in mouse and human endothelial cells as BBB in vitro models.
Brain endothelial cells, astrocytes, pericytes, and neurons form the neurovascular unit that contributes to Aβ levels regulation in brain ISF (Bell and Zlokovic, 2009). While the astrocytes, pericytes and basement membrane play important role in regulating the BBB function, only the capillary endothelium forms the physical barrier separating brain from blood. To cross the BBB toward the blood, Aβ utilizes specific transporters/receptors to facilitate its transport across the endothelial physical barrier. Thus, in the current study we focused our investigation on the specific contribution of endothelial cells to the clearance of Aβ40 mediated by different transport proteins from brain to blood. Our preliminary studies demonstrated a rapid depletion of Aβ40 from bEnd3 cells to the media compared to hCMEC/D3. To explain this difference in Aβ40 disposition, we characterized the activity of known Aβ40 receptors and transporters in both cells using uptake and transport studies. For degradation studies, we used the percent of degraded Aβ40 in the media as a measure for cellular degradation due to the rapid release of degraded Aβ40 fragments into the media (Yamada et al., 2008). Cells grown on wells surface do not form polarized monolayers, thus cellular level of intact Aβ40 is controlled by uptake by LRP1 and RAGE, efflux by P-gp, lysosomal degradation, and to a lesser extent by Aβ degrading proteases. On the other hand, cells plated on a transwell filters are polarized and form tight junctions mimicking the BBB where RAGE and P-gp are expressed on the apical side while LRP1 is expressed on the basolateral side. In transport studies, the activity of RAGE and P-gp was investigated in A→B direction, and activity of LRP1 was investigated in B→A direction. Our findings demonstrated that in the uptake studies, LRP1 in bEnd3 and hCMEC/D3 mediates uptake of intact Aβ40 and partial Aβ40 degradation as confirmed by RAP inhibition. On the other hand, LRP1 only mediates transport of intact Aβ40 from B→A in the transport studies, but not degradation. This result is consistent with previous in vivo studies demonstrated LRP1 function in Aβ40 transcytosis across the BBB (Castellano et al., 2012; Shibata et al., 2000), and is further supported by in vitro transport studies conducted using primary brain endothelial cells plated on filters (Pflanzner et al., 2011). In addition, this result confirms our in vivo data where LRP1 mediates transport of intact Aβ40 across BBB. The partial reduction in Aβ40 degradation by RAP observed in the uptake studies is possibly related to inhibition of another receptor that play role in Aβ40 degradation, most likely expressed at the apical side in the transport model, and on the cell surface in the uptake model (Figs, 3 and 6C&D). Another possible explanation is based on previously reported studies, which utilized LRP1 minireceptors transfected into epithelial cells such as MDCK II and CHO cells. These studies showed LRP1 to mediate Aβ40 degradation mainly via endocytosis (Cam et al., 2005; Nazer et al., 2008). Conflicting findings regarding LRP1 function suggest LRP1 mediates both Aβ40 endocytosis and transcytosis probably depending on cell type and polarization state. This behavior of LRP1 is consistent with other members of the LDL receptors family shown previously to mediate endocytosis and transcytosis (Doherty and McMahon, 2009; Tuma and Hubbard, 2003).
RAGE is a BBB receptor that is expressed mainly at the apical side of brain endothelial cells and mediates influx of Aβ40 from blood to brain (Deane et al., 2003). In non-polarized and polarized bEnd3 and hCMEC/D3 cells, RAGE has significant contribution to the uptake and A→B transport of intact Aβ40 but not degradation. The results of current study support the finding of previous studies reported role for RAGE in the transcytosis of Aβ40 from blood to brain (Candela et al., 2010; Deane et al., 2003).
P-gp, an efflux transporter, has been shown to contribute to Aβ40 clearance across BBB (Cirrito et al., 2005; Qosa et al., 2012; Tai et al., 2009). hCMEC/D3 cells demonstrated higher P-gp expression and activity compared to bEnd3. While the effect of P-gp inhibition in bEnd3 cells was not obvious, this does not necessarily exclude the function of P-gp at the mouse BBB in Aβ40 clearance. This finding could be explained rather by the rapid uptake and degradation of Aβ40 by bEnd3, which hinders the role of P-gp efflux. Findings from our current and previous in vivo and in vitro P-gp inhibition studies supported P-gp function at the mouse BBB in the efflux of intact Aβ40 (Abuznait et al., 2013; Qosa et al., 2012), which entered the cells by transcytosis via LRP1, and possibly other receptors, or Aβ40 molecules leaked from cell organelles such as endosomes (Hansson Petersen et al., 2008). Though results from previous studies observed conflicting data about P-gp contribution to Aβ40 clearance across BBB (Cirrito et al., 2005; Ito et al., 2006; Nazer et al., 2008; Tai et al., 2009), several imaging studies utilizing positron emission tomography technology demonstrated an association between P-gp function and Aβ plaque formation in AD brains (van Assema et al., 2012). Collectively, results of the current study and findings from previous mouse and human studies strongly suggest the contribution of P-gp to the clearance of Aβ40 across mouse and human BBB.
Aβ40 transport proteins including LRP1, RAGE and P-gp, in addition to degradation, have comparable functions in the mouse and human endothelial cells; however, differences in expression and/or activity between the two species may explain differences in Aβ40 cellular disposition, thus, clearance rate. To identify the main process(s) that contributes to such differences, a mechanistic two-compartment model was established. Parameters estimated by this model describe the activity of an overall process, i.e. overall uptake (include receptor mediated endocytosis and transcytosis), overall efflux (P-gp, other efflux proteins and exocytosis), and degradation, thus these parameters were termed as apparent parameters. Nevertheless, degradation of Aβ40 described by this model represents mainly lysosomal degradation and does not differentiate between different Aβ40 metabolites. Consistent with observed data, the mechanistic model suggests higher Aβ40 affinity to surface uptake receptors, and higher receptor activity in bEnd3 compared to hCMEC/D3 cells. As demonstrated in the model scheme (Figure 7A), removal of Aβ40 from cellular compartment takes place by degradation and efflux. Apparent parameters obtained by mechanistic modeling indicated the rate of Aβ40 removal by efflux process was similar in the two cells while degradation rate is higher in bEnd3 compared to hCMEC/D3 cells (Table 1). The established model also showed saturation of the uptake process in both cells was at low nanomolar concentrations of Aβ40 (Km values of 19.8 and 49.1 nM in bEnd3 and hCMEC/D3 cells, respectively). Although these concentrations are higher than those found in brains of normal individuals and in young transgenic mice (0.65 nM and 0.4 nM, respectively) (Brody et al., 2008; Kawarabayashi et al., 2001), they are much lower than Aβ40 concentrations in the ISF of AD patients and aged transgenic mouse brains (2000 nM and 2500 nM, respectively) (Gregory and Halliday, 2005; Kawarabayashi et al., 2001). This suggests that in normal brains with low Aβ40 concentration, clearance of Aβ40 across BBB is efficient, while it is significantly diminished in AD brains due to saturable clearance across the BBB.
Collectively, parameters estimated from the mechanistic model and results obtained from uptake and transport studies permit us to conclude that; i) the uptake process of Aβ40 determines subsequent steps including degradation and efflux processes, ii) brain endothelial cells mediate Aβ40 degradation, however degradation rate is dependent on uptake rate which is higher in bEnd3, iii) both cells mediate efficient efflux of intact Aβ40 supporting the role of efflux transporters as well as receptor mediated transcytosis in the clearance of Aβ40 across endothelial cells.
Both, the in vitro and mechanistic models provided novel tools to study Aβ transport and clearance across BBB that should facilitate our understanding of physiological and pathological factors affecting Aβ clearance, however, it is worth noting that there are some limitations with these models including; i) bEnd3 and hCMEC/D3 are immortalized cell lines, thus whether current findings can be translated to in vivo differences or not remain to be evaluated; ii) the transport kinetics of free Aβ40 was evaluated here, however, in physiological and pathological conditions, Aβ40 is also found in complex with chaperone proteins that influence its transport kinetics; and iii) our studies focused on Aβ40 disposition and not Aβ42. Compared to Aβ40, Aβ42 clearance across the BBB is slower (Ito et al., 2006), and prone to rapid aggregation. However, as both peptides use the same clearance pathways, the findings of this study with Aβ40 are expected to be applicable for Aβ42.
5. Conclusions
In conclusion, our results confirmed the significant contribution of BBB to the total clearance of Aβ40 from brain compared to parenchymal degradation, and demonstrated that the higher clearance rate of Aβ40 across the mouse BBB compared to human BBB could be explained by the rapid uptake process precedes its efflux and degradation. Furthermore, we successfully established a mechanistic model that could predict Aβ40 disposition in brain endothelial cells.
Supplementary Material
Highlights.
Brain clearance index, a modification of brain efflux index method, was established.
Compared to brain degradation, clearance across BBB is major clearance pathway for Aβ.
Aβ40 clearance rate by mouse brain endothelial cells is 15 x faster than human endothelial cells.
The rapid clearance rate of Aβ40 across mouse BBB is controlled by uptake and degradation.
Aβ40 disposition in brain endothelial cells was best described by 2-compartment model.
Acknowledgments
This research work was funded by an Institutional Development Award (IDeA) from the National Institute of General Medical Sciences of the National Institutes of Health under grant number P20GM103424.
Abbreviations
- AD
Alzheimer’s disease
- Aβ
amyloid-β
- APP
amyloid-β precursor protein
- BBB
blood-brain barrier
- BCI
brain clearance index
- BEI
brain efflux index
- CSF
cerebrospinal fluid
- IDE
insulin degrading enzyme
- LRP1
low density lipoprotein receptor-related protein-1
- P-gp
P-glycoprotein
- RAGE
advanced glycation end product
- TCA
trichloroacetic acid
Footnotes
Conflict of interest
The authors declare no competing financial interest.
Publisher's Disclaimer: This is a PDF file of an unedited manuscript that has been accepted for publication. As a service to our customers we are providing this early version of the manuscript. The manuscript will undergo copyediting, typesetting, and review of the resulting proof before it is published in its final citable form. Please note that during the production process errors may be discovered which could affect the content, and all legal disclaimers that apply to the journal pertain.
References
- Abuznait AH, Qosa H, Busnena BA, El Sayed KA, Kaddoumi A. Olive-Oil-Derived Oleocanthal Enhances beta-Amyloid Clearance as a Potential Neuroprotective Mechanism against Alzheimer’s Disease: In Vitro and in Vivo Studies. ACS Chemical Neuroscience. 2013 doi: 10.1021/cn400024q. [DOI] [PMC free article] [PubMed] [Google Scholar]
- Ballabh P, Braun A, Nedergaard M. The blood-brain barrier: an overview: structure, regulation, and clinical implications. Neurobiol Dis. 2004;16:1–13. doi: 10.1016/j.nbd.2003.12.016. [DOI] [PubMed] [Google Scholar]
- Banks WA, Robinson SM, Verma S, Morley JE. Efflux of human and mouse amyloid beta proteins 1–40 and 1–42 from brain: impairment in a mouse model of Alzheimer’s disease. Neuroscience. 2003;121:487–492. doi: 10.1016/s0306-4522(03)00474-3. [DOI] [PMC free article] [PubMed] [Google Scholar]
- Barten DM, Guss VL, Corsa JA, Loo A, Hansel SB, Zheng M, Munoz B, Srinivasan K, Wang B, Robertson BJ, Polson CT, Wang J, Roberts SB, Hendrick JP, Anderson JJ, Loy JK, Denton R, Verdoorn TA, Smith DW, Felsenstein KM. Dynamics of {beta}-amyloid reductions in brain, cerebrospinal fluid, and plasma of {beta}-amyloid precursor protein transgenic mice treated with a {gamma}-secretase inhibitor. J Pharmacol Exp Ther. 2005;312:635–643. doi: 10.1124/jpet.104.075408. [DOI] [PubMed] [Google Scholar]
- Basak JM, Verghese PB, Yoon H, Kim J, Holtzman DM. Low-density lipoprotein receptor represents an apolipoprotein E-independent pathway of Abeta uptake and degradation by astrocytes. Journal of Biological Chemistry. 2012;287:13959–13971. doi: 10.1074/jbc.M111.288746. [DOI] [PMC free article] [PubMed] [Google Scholar]
- Bell RD, Sagare AP, Friedman AE, Bedi GS, Holtzman DM, Deane R, Zlokovic BV. Transport pathways for clearance of human Alzheimer’s amyloid beta-peptide and apolipoproteins E and J in the mouse central nervous system. J Cereb Blood Flow Metab. 2007;27:909–918. doi: 10.1038/sj.jcbfm.9600419. [DOI] [PMC free article] [PubMed] [Google Scholar]
- Bell RD, Zlokovic BV. Neurovascular mechanisms and blood-brain barrier disorder in Alzheimer’s disease. Acta Neuropathol. 2009;118:103–113. doi: 10.1007/s00401-009-0522-3. [DOI] [PMC free article] [PubMed] [Google Scholar]
- Brillault J, Lam TI, Rutkowsky JM, Foroutan S, O’Donnell ME. Hypoxia effects on cell volume and ion uptake of cerebral microvascular endothelial cells. Am J Physiol Cell Physiol. 2008;294:C88–96. doi: 10.1152/ajpcell.00148.2007. [DOI] [PubMed] [Google Scholar]
- Brody DL, Magnoni S, Schwetye KE, Spinner ML, Esparza TJ, Stocchetti N, Zipfel GJ, Holtzman DM. Amyloid-beta dynamics correlate with neurological status in the injured human brain. Science. 2008;321:1221–1224. doi: 10.1126/science.1161591. [DOI] [PMC free article] [PubMed] [Google Scholar]
- Bu G. Receptor-associated protein: a specialized chaperone and antagonist for members of the LDL receptor gene family. Current Opinion in Lipidology. 1998;9:149–155. doi: 10.1097/00041433-199804000-00012. [DOI] [PubMed] [Google Scholar]
- Cam JA, Zerbinatti CV, Li Y, Bu G. Rapid endocytosis of the low density lipoprotein receptor-related protein modulates cell surface distribution and processing of the beta-amyloid precursor protein. J Biol Chem. 2005;280:15464–15470. doi: 10.1074/jbc.M500613200. [DOI] [PubMed] [Google Scholar]
- Candela P, Gosselet F, Saint-Pol J, Sevin E, Boucau MC, Boulanger E, Cecchelli R, Fenart L. Apical-to-basolateral transport of amyloid-beta peptides through blood-brain barrier cells is mediated by the receptor for advanced glycation end-products and is restricted by P-glycoprotein. J Alzheimers Dis. 2010;22:849–859. doi: 10.3233/JAD-2010-100462. [DOI] [PubMed] [Google Scholar]
- Castellano JM, Deane R, Gottesdiener AJ, Verghese PB, Stewart FR, West T, Paoletti AC, Kasper TR, DeMattos RB, Zlokovic BV, Holtzman DM. Low-density lipoprotein receptor overexpression enhances the rate of brain-to-blood Abeta clearance in a mouse model of beta-amyloidosis. Proc Natl Acad Sci U S A. 2012;109:15502–15507. doi: 10.1073/pnas.1206446109. [DOI] [PMC free article] [PubMed] [Google Scholar]
- Cirrito JR, Deane R, Fagan AM, Spinner ML, Parsadanian M, Finn MB, Jiang H, Prior JL, Sagare A, Bales KR, Paul SM, Zlokovic BV, Piwnica-Worms D, Holtzman DM. P-glycoprotein deficiency at the blood-brain barrier increases amyloid-beta deposition in an Alzheimer disease mouse model. Journal of Clinical Investigation. 2005;115:3285–3290. doi: 10.1172/JCI25247. [DOI] [PMC free article] [PubMed] [Google Scholar]
- Cirrito JR, May PC, O’Dell MA, Taylor JW, Parsadanian M, Cramer JW, Audia JE, Nissen JS, Bales KR, Paul SM, DeMattos RB, Holtzman DM. In vivo assessment of brain interstitial fluid with microdialysis reveals plaque-associated changes in amyloid-beta metabolism and half-life. Journal of Neuroscience. 2003;23:8844–8853. doi: 10.1523/JNEUROSCI.23-26-08844.2003. [DOI] [PMC free article] [PubMed] [Google Scholar]
- Citron M, Oltersdorf T, Haass C, McConlogue L, Hung AY, Seubert P, Vigo-Pelfrey C, Lieberburg I, Selkoe DJ. Mutation of the beta-amyloid precursor protein in familial Alzheimer’s disease increases beta-protein production. Nature. 1992;360:672–674. doi: 10.1038/360672a0. [DOI] [PubMed] [Google Scholar]
- Deane R, Bell RD, Sagare A, Zlokovic BV. Clearance of amyloid-beta peptide across the blood-brain barrier: implication for therapies in Alzheimer’s disease. CNS Neurol Disord Drug Targets. 2009;8:16–30. doi: 10.2174/187152709787601867. [DOI] [PMC free article] [PubMed] [Google Scholar]
- Deane R, Du Yan S, Submamaryan RK, LaRue B, Jovanovic S, Hogg E, Welch D, Manness L, Lin C, Yu J, Zhu H, Ghiso J, Frangione B, Stern A, Schmidt AM, Armstrong DL, Arnold B, Liliensiek B, Nawroth P, Hofman F, Kindy M, Stern D, Zlokovic B. RAGE mediates amyloid-beta peptide transport across the blood-brain barrier and accumulation in brain. Nat Med. 2003;9:907–913. doi: 10.1038/nm890. [DOI] [PubMed] [Google Scholar]
- Deane R, Wu Z, Sagare A, Davis J, Du Yan S, Hamm K, Xu F, Parisi M, LaRue B, Hu HW, Spijkers P, Guo H, Song X, Lenting PJ, Van Nostrand WE, Zlokovic BV. LRP/amyloid beta-peptide interaction mediates differential brain efflux of Abeta isoforms. Neuron. 2004;43:333–344. doi: 10.1016/j.neuron.2004.07.017. [DOI] [PubMed] [Google Scholar]
- Deane R, Zlokovic BV. Role of the blood-brain barrier in the pathogenesis of Alzheimer’s disease. Curr Alzheimer Res. 2007;4:191–197. doi: 10.2174/156720507780362245. [DOI] [PubMed] [Google Scholar]
- Doherty GJ, McMahon HT. Mechanisms of endocytosis. Annu Rev Biochem. 2009;78:857–902. doi: 10.1146/annurev.biochem.78.081307.110540. [DOI] [PubMed] [Google Scholar]
- Fuentealba RA, Liu Q, Zhang J, Kanekiyo T, Hu X, Lee JM, LaDu MJ, Bu G. Low-density lipoprotein receptor-related protein 1 (LRP1) mediates neuronal Abeta42 uptake and lysosomal trafficking. PLoS One. 2010;5:e11884. doi: 10.1371/journal.pone.0011884. [DOI] [PMC free article] [PubMed] [Google Scholar]
- Gregory GC, Halliday GM. What is the dominant Abeta species in human brain tissue? A review. Neurotox Res. 2005;7:29–41. doi: 10.1007/BF03033774. [DOI] [PubMed] [Google Scholar]
- Hansson Petersen CA, Alikhani N, Behbahani H, Wiehager B, Pavlov PF, Alafuzoff I, Leinonen V, Ito A, Winblad B, Glaser E, Ankarcrona M. The amyloid beta-peptide is imported into mitochondria via the TOM import machinery and localized to mitochondrial cristae. Proc Natl Acad Sci U S A. 2008;105:13145–13150. doi: 10.1073/pnas.0806192105. [DOI] [PMC free article] [PubMed] [Google Scholar]
- Ito S, Ohtsuki S, Terasaki T. Functional characterization of the brain-to-blood efflux clearance of human amyloid-beta peptide (1–40) across the rat blood-brain barrier. Neuroscience Research. 2006;56:246–252. doi: 10.1016/j.neures.2006.07.006. [DOI] [PubMed] [Google Scholar]
- Iwata N, Tsubuki S, Takaki Y, Watanabe K, Sekiguchi M, Hosoki E, Kawashima-Morishima M, Lee HJ, Hama E, Sekine-Aizawa Y, Saido TC. Identification of the major Abeta1–42-degrading catabolic pathway in brain parenchyma: suppression leads to biochemical and pathological deposition. Nat Med. 2000;6:143–150. doi: 10.1038/72237. [DOI] [PubMed] [Google Scholar]
- Jan A, Hartley DM, Lashuel HA. Preparation and characterization of toxic Abeta aggregates for structural and functional studies in Alzheimer’s disease research. Nat Protoc. 2010;5:1186–1209. doi: 10.1038/nprot.2010.72. [DOI] [PubMed] [Google Scholar]
- Kandimalla KK, Curran GL, Holasek SS, Gilles EJ, Wengenack TM, Poduslo JF. Pharmacokinetic analysis of the blood-brain barrier transport of 125I-amyloid beta protein 40 in wild-type and Alzheimer’s disease transgenic mice (APP,PS1) and its implications for amyloid plaque formation. J Pharmacol Exp Ther. 2005;313:1370–1378. doi: 10.1124/jpet.104.081901. [DOI] [PubMed] [Google Scholar]
- Kandimalla KK, Scott OG, Fulzele S, Davidson MW, Poduslo JF. Mechanism of neuronal versus endothelial cell uptake of Alzheimer’s disease amyloid beta protein. PLoS One. 2009;4:e4627. doi: 10.1371/journal.pone.0004627. [DOI] [PMC free article] [PubMed] [Google Scholar]
- Kanekiyo T, Liu CC, Shinohara M, Li J, Bu G. LRP1 in brain vascular smooth muscle cells mediates local clearance of Alzheimer’s amyloid-beta. J Neurosci. 2012;32:16458–16465. doi: 10.1523/JNEUROSCI.3987-12.2012. [DOI] [PMC free article] [PubMed] [Google Scholar]
- Kawarabayashi T, Younkin LH, Saido TC, Shoji M, Ashe KH, Younkin SG. Age-dependent changes in brain, CSF, and plasma amyloid (beta) protein in the Tg2576 transgenic mouse model of Alzheimer’s disease. J Neurosci. 2001;21:372–381. doi: 10.1523/JNEUROSCI.21-02-00372.2001. [DOI] [PMC free article] [PubMed] [Google Scholar]
- Mawuenyega KG, Sigurdson W, Ovod V, Munsell L, Kasten T, Morris JC, Yarasheski KE, Bateman RJ. Decreased clearance of CNS beta-amyloid in Alzheimer’s disease. Science. 2010;330:1774. doi: 10.1126/science.1197623. [DOI] [PMC free article] [PubMed] [Google Scholar]
- Nazer B, Hong S, Selkoe DJ. LRP promotes endocytosis and degradation, but not transcytosis, of the amyloid-beta peptide in a blood-brain barrier in vitro model. Neurobiol Dis. 2008;30:94–102. doi: 10.1016/j.nbd.2007.12.005. [DOI] [PMC free article] [PubMed] [Google Scholar]
- Pflanzner T, Janko MC, Andre-Dohmen B, Reuss S, Weggen S, Roebroek AJ, Kuhlmann CR, Pietrzik CU. LRP1 mediates bidirectional transcytosis of amyloid-beta across the blood-brain barrier. Neurobiol Aging. 2011;32:2323 e2321–2311. doi: 10.1016/j.neurobiolaging.2010.05.025. [DOI] [PubMed] [Google Scholar]
- Poirier A, Lave T, Portmann R, Brun ME, Senner F, Kansy M, Grimm HP, Funk C. Design, data analysis, and simulation of in vitro drug transport kinetic experiments using a mechanistic in vitro model. Drug Metab Dispos. 2008;36:2434–2444. doi: 10.1124/dmd.108.020750. [DOI] [PubMed] [Google Scholar]
- Qosa H, Abuznait AH, Hill RA, Kaddoumi A. Enhanced brain amyloid-beta clearance by rifampicin and caffeine as a possible protective mechanism against Alzheimer’s disease. J Alzheimers Dis. 2012;31:151–165. doi: 10.3233/JAD-2012-120319. [DOI] [PMC free article] [PubMed] [Google Scholar]
- Selkoe DJ. Physiological production of the beta-amyloid protein and the mechanism of Alzheimer’s disease. Trends Neurosci. 1993;16:403–409. doi: 10.1016/0166-2236(93)90008-a. [DOI] [PubMed] [Google Scholar]
- Shibata M, Yamada S, Kumar SR, Calero M, Bading J, Frangione B, Holtzman DM, Miller CA, Strickland DK, Ghiso J, Zlokovic BV. Clearance of Alzheimer’s amyloid-beta(1–40) peptide from brain by LDL receptor-related protein-1 at the blood-brain barrier. Journal of Clinical Investigation. 2000;106:1489–1499. doi: 10.1172/JCI10498. [DOI] [PMC free article] [PubMed] [Google Scholar]
- Silverberg GD, Mayo M, Saul T, Rubenstein E, McGuire D. Alzheimer’s disease, normal-pressure hydrocephalus, and senescent changes in CSF circulatory physiology: a hypothesis. Lancet Neurol. 2003;2:506–511. doi: 10.1016/s1474-4422(03)00487-3. [DOI] [PubMed] [Google Scholar]
- Sommer B. Alzheimer’s disease and the amyloid cascade hypothesis: ten years on. Curr Opin Pharmacol. 2002;2:87–92. doi: 10.1016/s1471-4892(01)00126-6. [DOI] [PubMed] [Google Scholar]
- Tai LM, Loughlin AJ, Male DK, Romero IA. P-glycoprotein and breast cancer resistance protein restrict apical-to-basolateral permeability of human brain endothelium to amyloid-beta. J Cereb Blood Flow Metab. 2009;29:1079–1083. doi: 10.1038/jcbfm.2009.42. [DOI] [PubMed] [Google Scholar]
- Tuma P, Hubbard AL. Transcytosis: crossing cellular barriers. Physiol Rev. 2003;83:871–932. doi: 10.1152/physrev.00001.2003. [DOI] [PubMed] [Google Scholar]
- van Assema DM, Lubberink M, Rizzu P, van Swieten JC, Schuit RC, Eriksson J, Scheltens P, Koepp M, Lammertsma AA, van Berckel BN. Blood-brain barrier P-glycoprotein function in healthy subjects and Alzheimer’s disease patients: effect of polymorphisms in the ABCB1 gene. EJNMMI Res. 2012;2:57. doi: 10.1186/2191-219X-2-57. [DOI] [PMC free article] [PubMed] [Google Scholar]
- Veinbergs I, Van Uden E, Mallory M, Alford M, McGiffert C, DeTeresa R, Orlando R, Masliah E. Role of apolipoprotein E receptors in regulating the differential in vivo neurotrophic effects of apolipoprotein E. Experimental Neurology. 2001;170:15–26. doi: 10.1006/exnr.2001.7684. [DOI] [PubMed] [Google Scholar]
- Yamada K, Hashimoto T, Yabuki C, Nagae Y, Tachikawa M, Strickland DK, Liu Q, Bu G, Basak JM, Holtzman DM, Ohtsuki S, Terasaki T, Iwatsubo T. The low density lipoprotein receptor-related protein 1 mediates uptake of amyloid beta peptides in an in vitro model of the blood-brain barrier cells. J Biol Chem. 2008;283:34554–34562. doi: 10.1074/jbc.M801487200. [DOI] [PMC free article] [PubMed] [Google Scholar]
Associated Data
This section collects any data citations, data availability statements, or supplementary materials included in this article.