

Abstract
Optical imaging with spectroscopic vibrational contrast is a label-free solution for visualizing, identifying, and quantifying a wide range of biomolecular compounds in biological materials. Both linear and nonlinear vibrational microscopy techniques derive their imaging contrast from infrared active or Raman allowed molecular transitions, which provide a rich palette for interrogating chemical and structural details of the sample. Yet nonlinear optical methods, which include both second-order sum-frequency generation (SFG) and third-order coherent Raman scattering (CRS) techniques, offer several improved imaging capabilities over their linear precursors. Nonlinear vibrational microscopy features unprecedented vibrational imaging speeds, provides strategies for higher spatial resolution, and gives access to additional molecular parameters. These advances have turned vibrational microscopy into a premier tool for chemically dissecting live cells and tissues. This review discusses the molecular contrast of SFG and CRS microscopy and highlights several of the advanced imaging capabilities that have impacted biological and biomedical research.
Keywords: vibrational spectroscopy, nonlinear optical microscopy, sum-frequency generation, coherent Raman scattering, biomedical imaging
1. INTRODUCTION
The challenge in biomolecular optical imaging is to efficiently probe endogenous compounds, while maintaining sample integrity and ensuring that other off-target molecules remain optically unresponsive. Vibrational excitation of molecules is a natural choice to achieve such chemically selective contrast, as it allows nondestructive and label-free imaging of biological samples.
The energies of molecular vibrations, which include the vibrations of chemical bonds and chemical groups, are found in the ~100 cm−1 to 4,000 cm−1 range. These energies correspond to the mid-infrared (mid-IR) to far-IR range of the electromagnetic spectrum. Microscopy based on IR absorption contrast has grown into a mature technique for interrogating biological samples (1–6). Nonetheless, IR absorption microscopy necessitates special sample preparations to suppress the contribution of water absorption, which can dominate the response in biological tissues. In addition, the spatial resolution, dictated by the wavelength of light, is of the order of a few micrometers or more and thus is insufficient to resolve intracellular details. For these reasons, IR absorption microscopy has played a limited role in the study of live biological specimens.
Raman-type excitations constitute another approach to probe the vibrational properties of molecules. The Raman excitation is an indirect, off-resonance excitation of a molecular mode. Compared to direct IR excitation, the Raman process can be induced with visible or near-IR radiation. This flexibility offers an important practical advantage over IR absorption microscopy, as the refractive-based optics of standard light microscopes can be used for Raman microscopy (7–10). The optimized optics in the visible/near-IR range provide the submicrometer spatial resolution needed to visualize subcellular compartments. In addition, the Raman spectrum is less affected by a ubiquitous water background, which permits, for instance, imaging of aqueous cell culture specimens with good spectral contrast.
Raman microscopy has enabled label-free and selective imaging of cellular compartments, including the nucleus, endoplasmic reticulum, Golgi apparatus, and mitochondria (11–13). Such imaging capabilities fill an important void in biological imaging; previously, this degree of organelle selectivity was only possible with the use of fluorescent labels. And yet Raman microscopy has its weaknesses. In particular, the image-acquisition speed is not conducive for live-cell applications. The intrinsically low photon yield of the spontaneous Raman process gives rise to long signal integration times, well over 1 ms per spatial pixel, which is incompatible with fast imaging applications.
Some of the shortcomings encountered in conventional vibrational microscopy can be overcome with nonlinear vibrational techniques. In nonlinear vibrational microscopy, the detected optical signal scales nonlinearly with the power of the incident light. Nonlinear vibrational microscopy methods include vibrationally resonant sum-frequency generation (SFG) imaging and coherent Raman scattering (CRS) imaging techniques. Similar to their linear predecessors, these optical techniques are sensitive to molecular vibrational modes and generate label-free images with chemical contrast. Although nonlinear optical methods can be more complex in terms of instrumentation, they deliver several improved imaging properties relative to their linear counterparts.
First, nonlinear vibrational imaging methods enjoy high signal levels that permit pixel dwell times of 1 μs or less. These fast imaging conditions make it possible to record images at rates suitable for examining dynamic processes in cells and tissues. Second, nonlinear optical techniques provide ways to improve the spatial resolution. SFG imaging addresses vibrational modes with IR light, yet it provides a much higher spatial resolution than what can be obtained with linear IR microscopy. CRS imaging also offers opportunities to visualize structures with an improved spatial resolution relative to linear Raman microscopy. Third, nonlinear light-matter interactions provide access to an expanded set of parameters, including higher-order molecular symmetries and vibrational phase information, which cannot be probed with conventional vibrational imaging methods.
In this review, we highlight several of these new imaging properties of coherent nonlinear vibrational microscopy techniques. We discuss both second-order and third-order vibrational imaging approaches and point out the advantages of these techniques over their existing linear counterparts. We place special emphasis on new molecular parameters and structural properties of the sample that can be retrieved when using nonlinear vibrational methods and how these properties may impact biological research. For more information on other important differences between linear and nonlinear vibrational microscopy techniques, such as the role of spatial coherence in coherent nonlinear imaging, the reader is referred elsewhere (14–16). Similarly, for an in-depth overview of current biomedical applications of CRS microscopy, we refer to existing reviews in the literature (17–19).
2. VIBRATIONAL CONTRAST
2.1. Vibrational Modes in Biomolecules
The contrast in nonlinear vibrational microscopy arises from molecular vibrations. These vibrations are commonly modeled as normal modes, which correspond to the vibrational motion of a chemical moiety that can include multiple chemical bonds. Depending on the symmetry properties of the mode, the molecular vibration can be IR active or Raman active, display both IR and Raman activity, or can be nonactive with respect to its ability to couple to the electric component of the light field. IR-active modes are vibrations that bring about a change in the electric dipole moment μ of the molecule, whereas Raman-active modes are vibrations that give rise to a nonzero change in the molecular polarizability α. These well-established selection rules highlight that IR- and Raman-based spectroscopies complement each other. For instance, modes that are totally symmetric along their normal coordinate are typically not IR active, but they do display Raman activity. Nonetheless, unless the molecule exhibits perfect inversion symmetry (the mode is centrosymmetric), optically active normal modes often have nonvanishing contributions to both IR and Raman spectra.
In addition to fundamental modes, the vibrational spectrum contains band structures that can be assigned to overtones, combination bands, and Fermi resonances. In the harmonic approximation, the first overtone and transitions into combination bands are not allowed. The appearance of these features in the spectrum thus indicates the presence of anharmonicity in the system, which is commonly understood as the anharmonicity of the potential energy surface. Fermi resonances are also a result of anharmonicity and arise when an overtone or combination band mixes with a fundamental mode at near-degenerate energies.
The vibrational spectrum of biological samples is dominated by fundamental modes of organic biomolecular compounds. This implies that the number of chemical moieties that contribute to the spectrum is limited. Because many bioorganic molecules comprise a finite set of chemical moieties, the corresponding vibrational signatures in the IR/Raman spectra of many biomolecular compounds show a significant amount of overlap. Vibrational spectroscopy is thus not suitable for a complete chemical analysis of biological materials such as cells and tissues because the limited amount of spectral features is by far insufficient to identify all molecular species and their corresponding concentrations within the probing volume.
Despite the difficulty of performing a detailed chemical analysis on vibrational spectra, a surprising amount of information can be gleaned from vibrational microspectroscopic measurements in biological samples. First, microspectroscopic measurements confine the probing volume to (sub)micrometer dimensions. The spatial resolution is often sufficient to spatially discriminate biologically distinct structures such as intracellular organelles. Consequently, biological samples show significant variation in chemical composition on these length scales, which is reflected in changes in the vibrational spectrum when spatially scanning across the sample. The relative changes in the vibrational spectrum are highly informative and can reveal important differences in the composition and concentration of key biomolecular compounds. Figure 1 shows an example in which information from the Raman spectrum alone is sufficient to discriminate various organelles in cultured mammalian cells.
Figure 1.
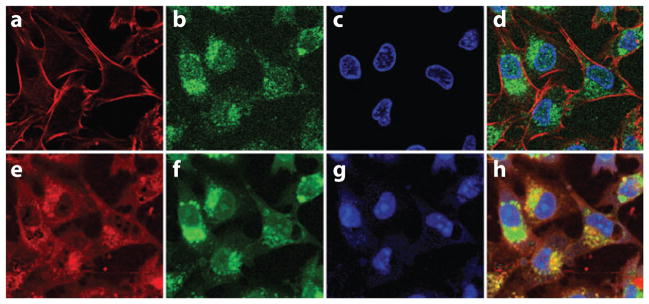
Comparison of immunofluorescence images (a–d ) with Raman-based images (e–h). Fluorescence stains for actin (a; red ), Golgi apparatus (b; green), and nucleus (c; blue) were used. The different compartments in the cell can also be distinguished by sets of Raman intensities at selected wave numbers determined by an information-based spectral decomposition approach (13): actin (e; red ), Golgi apparatus ( f; green), and nucleus ( g; blue). Panels d and h show the overlapped fluorescence and Raman-based images, respectively. Figure reproduced with permission from Reference 13.
Second, although band structures can significantly overlap, a detailed reading of the vibrational spectrum can reveal essential information about the composition and physical state of endogenous biomolecular compounds. This type of information can be retrieved even in regions of the spectrum that are particularly dense, such as the range spanned by the stretching modes of CH-containing moieties. In the following subsection, we briefly discuss the CH stretching region and highlight how nonlinear vibrational methods can help improve the analysis of band profiles.
2.2. The CH Stretching Vibrations
The CH stretching vibrations play a prominent role in coherent nonlinear vibrational microscopy. Their prominence is related to the sheer quantity of C-H bonds per unit volume in biological samples, which, combined with their moderately strong cross sections for both IR- and Raman-type transitions, produce strong vibrational band structures in the 2,700 cm−1 to 3,100 cm−1 range. The CH stretching range is largely devoid of contributions from other chemical moieties, which somewhat simplifies the assignment of band structures in this region of the vibrational spectrum: They all arise from CH stretching modes. However, an accurate assignment is complicated by the fact that there is a multitude of CH stretching modes.
The primary contributing chemical moieties are the methyl (CH3), methylene (CH2), and methine (CH) groups of sp3 hybridized carbon. Both the methyl and methylene groups exhibit symmetric and asymmetric stretching modes that have nonvanishing IR and Raman cross sections. The methyl modes contribute notably to the vibrational spectra of proteins, given that the methyl-containing amino acids (alanine, valine, leucine, isoleucine, methionine, and threonine) constitute almost 40% of the total amino acid content on average in proteins with more than 200 residues (20). The methylene stretching modes are dominant in the vibrational spectra of aliphatic lipids, but they also contribute substantially to the spectra of carbohydrates and proteins. Methine modes contribute only moderately to the spectra of most biomolecules (21–23), but they are thought to be prominent in carbohydrate spectra (24).
In addition to the normal modes associated with sp3 hybridized carbons, the CH stretching vibrations of chemical groups with an sp2 hybridized carbon introduce distinct features to the vibrational spectrum as well. The most significant contributors in this category are the CH stretching vibrations of the vinyl (=CH-) groups, which are prominent in aromatic compounds and (poly-)unsaturated fatty acids.
The contributions of the CH-containing chemical groups produce vibrational bands that overlap significantly, which complicates a detailed assignment of the band structures of most biomolecular compounds. Mode assignments in larger molecules are complicated by the sensitivity of CH vibrations to their immediate chemical environment and by the multitude of structural conformers, which can give rise to shifting of the fundamental frequencies and broadening of the band profiles. For instance, in biomolecules that contain both methyl and methylene groups, it is challenging to identify the vibrational energies of the asymmetric CH2 modes, which can show substantial overlap with the symmetric and asymmetric CH3 modes. Furthermore, Fermi resonances between the first overtone of CH bending modes and the fundamental stretching modes of the methyl and methylene groups can shift peak positions and add spectral density to otherwise weak overtone bands (25).
Most of the spectral band assignments in the CH stretching range of IR and Raman spectra originate from normal-mode analysis methods and calculations based on a valence force field derived from empirical data (25–29). It has been difficult to rigorously verify these assignments with more advanced computational methods. Ab initio calculations within the harmonic approximation provide useful information about the fundamental modes (30–34), but they are unable to predict the contribution of Fermi resonances and other band structures induced by anharmonicities. Vibrational self-consistent field methods with anharmonic potentials have enabled a qualitative reproduction of the CH stretching range of aliphatic molecules (35, 36), but they have so far been insufficient to confirm clear trends in the vibrational energies of fundamental modes, nor have they pointed out the exact influence of degeneracies.
In this regard, additional information about the symmetries of the CH band structures is helpful in deciphering their chemical origin. Compared to linear IR and Raman spectroscopy, SFG spectroscopy is sensitive to oriented molecules at surfaces. This property alleviates uncertainty about orientation and offers a detailed look at the polarization properties of the CH stretching bands, providing a means to unlock band profiles based on mode symmetries. Figure 2a shows the IR and Raman spectra of 1-octanol, an aliphatic compound rich in methylene groups. The band structure in both IR and Raman spectra is congested, revealing limited substructure. The use of polarization-sensitive SFG spectroscopy (23) can provide more information, as illustrated in Figure 2b. Individual normal-mode contributions are now resolved, allowing a more accurate assignment of the fundamental frequencies as well as the identification of Fermi resonances. Table 1 summarizes the vibrational frequencies of the most dominant modes in the CH stretching range. Note, however, that the frequency ranges of the different modes may vary among molecular classes.
Figure 2.

Chemical information in the CH stretching vibrational range. (a) Raman (black) and IR ( gray) spectra of 1-octanol. (b) Band assignments of 1-octanol based on surface-sensitive sum-frequency generation measurements. Ssp, ppp, and sps (signal, visible, IR beam) correspond to the polarization orientations of the beams (s, surface polarized; p, plane polarized). Panels a and b reproduced in part with permission from Reference 23. Copyright 2005 American Chemical Society. Raman spectra of (c) elastin, a structural protein; (d ) cellulose, a carbohydrate; (e) palmityl palmitate, a wax ester; ( f ) cholesterol; ( g) cholesteryl linoleate, a cholesteryl ester; and (h) tristearin, a triglyceride.
Table 1.
Common modes in CH-rich biomolecules and their corresponding frequency ranges
| Mode | Description | Frequency range (cm−1) |
|---|---|---|
|
| ||
| CH2-ss | Methylene symmetric stretch | 2,845–2,850 |
| CH3-ss | Methyl symmetric stretch | 2,865–2,875 |
| CH2-as | Methylene asymmetric stretch | 2,880–2,910 |
| CH2-Fermi | Methylene Fermi (multiple) | 2,904–2,906, 2,918, 2,954 |
| CH-ss | Methane symmetric stretch | 2,900–2,915 |
| CH3-Fermi | Methyl Fermi resonance | 2,925–2,940 |
| CH3-as | Methyl asymmetric stretch | 2,960–2,970 |
Mode assignments are based on the findings in Reference 23.
These additional insights can help improve the analytical capabilities of vibrational microscopies. Figure 2c–h depicts the vibrational spectra of several CH-rich biomolecular compounds. Despite the congested character of the CH stretching range, clear substructures can be identified that enable an analytical discrimination of important molecular classes. These subtle yet identifiable differences have already spurred nonlinear vibrational imaging studies in which cholesterol, cholesteryl esters, aliphatic lipids, and structural proteins are separately visualized in biological tissues (37–41). With the aid of better band assignments, the features of the CH stretching profile can be separated based on a priori knowledge, which can deepen the level of spectroscopic analysis in vibrational microscopy.
2.3. Nonlinear Susceptibilities
Vibrationally resonant SFG is sensitive to the second-order nonlinear susceptibility χ(2), and CRS methods probe the third-order nonlinear susceptibility χ(3) of the sample. In SFG, the incident fields ω1 and ω2 induce a nonlinear polarization in the sample, which subsequently radiates at a frequency ω3 = ω1 +ω2. In CRS, the incident fields ω1, ω2, and ω3 set up a nonlinear polarization that can radiate at frequencies ω4 = ±(ω1 − ω2) + ω3. The energy-level diagrams of selected SFG and CRS processes are shown in Figure 3, in which the vibrational transition is between the ground state a and the first vibrationally excited state b, with n and n′ (electronic) levels with energies much higher than the vibrational energies. In this case, the second- and third-order nonlinear susceptibilities can be summarized as
Figure 3.
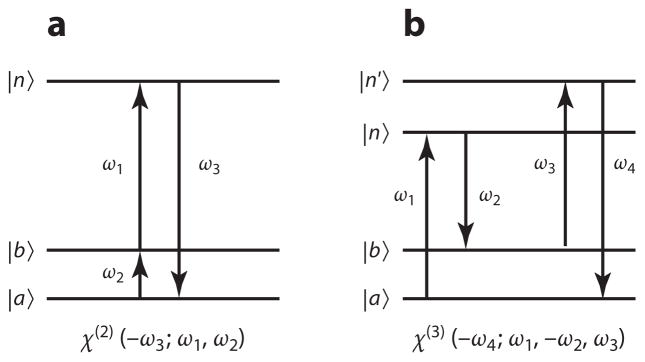
Energy diagrams of (a) sum-frequency generation and (b) coherent anti-Stokes Raman scattering. In these diagrams, |a〉 is the ground state, |b〉 is the first vibrationally excited state, and |n〉, |n′〉 are higher-energy states in the material. The arrows are not necessarily ordered in time. The arrows to the far right correspond to the signal field: An upward arrow corresponds to field absorption, whereas a downward arrow denotes a field emission.
| (1) |
| (2) |
with i the polarization orientations of the emitted radiation, and j, k, and l the polarization orientation of the incident fields, respectively (42). The operator S sums over all permutations of the fields (42), and the frequency-dependent functions f(n) capture the spectral properties of the n-th-order nonlinear susceptibility. The negative sign in front of the signal frequency means that the signal is emitted, whereas a positive sign would indicate that the signal is absorbed. The magnitude of the transition dipole moment along the i coordinate between the levels n and a is indicated by . The product of two transition dipole moments (e.g., ) can be written as the coefficient , which has symmetry properties similar to that of the Raman polarizability tensor. The triple product of transition dipole moments in the expression for the second-order nonlinear susceptibility that describes the SFG process can thus be understood as a product of a dipole-allowed IR transition (~μ) and a Raman-type transition (~α). Consequently, the vibrational modes observed in SFG microscopy must have both IR and Raman activity. Similarly, the CRS process, which is described by a quadruple product of transition dipole moments, can be interpreted as the product of two Raman-type transitions. The vibrational modes observed in CRS imaging are indeed Raman-active modes.
A quick comparison between χ(2) and χ(3) suggests that the second-order response must be significantly stronger than the third-order response. This can be expected because a direct electric dipole excitation is generally much stronger than a Raman-type excitation, even under off-resonant conditions. Indeed, the nonresonant χ(2) of quartz is of the order of 10−9 electrostatic units, whereas the nonresonant χ(3) is of the order of 10−14 electrostatic units (43). However, other factors such as phase matching, sample density, sample geometry, and the efficiency of signal collection also affect the magnitude of the measured response. In practice, in microscopic applications of SFG and CRS, the collected vibrationally resonant signals derived from χ(2) and χ(3) are comparable in magnitude, thus enabling simultaneous second-order and third-order vibrational investigations of microstructured samples (44).
2.3.1. Polarization properties
Compared to linear vibrational techniques, nonlinear techniques use multiple excitation fields. By using different polarization orientations of the incident fields, the sample can be examined in a more advanced fashion, which can give access to additional molecular symmetry parameters. In isotropic media, however, it is difficult to retrieve such new information. The situation is different when the sample is anisotropic or highly ordered on a microscopic scale. Examples of ordered structures in biological samples include lipid membranes and ordered structures therein, protein fibrillar structures, and biomolecular microcrystallites such as cholesterol crystals. In these cases, nonlinear vibrational microscopy offers opportunities to unveil molecular symmetries that go beyond what can be retrieved with linear techniques.
The observed macroscopic nonlinear susceptibility is defined in the laboratory frame (x, y, z), which is related to the coordinates (a, b, c) of the molecular frame through a transformation. The nonlinear susceptibilities can be written as
| (3) |
| (4) |
where N is the number density of the molecules and Rλ′λ are elements of the Euler transformation matrices that relate the microscopic coordinate λ(a, b, c ) to the macroscopic coordinate λ′(x, y, z) (45). The brackets in these expressions indicate the average over the orientations of the molecules. When the orientation of the molecules and the orientation angles of the contributing chemical groups are known, information about the molecular symmetries contained in and can be obtained. Vice versa, if the molecular symmetries are known, information about the shape and orientation of the molecules can be acquired (46).
An example of the use of polarization-sensitive second-order vibrational techniques to study structural information about biomolecular compounds is the study of type I collagen fibrils. Assuming that the triple-helix structure of type I collagen can be described as a rod with cylindrical symmetry, seven nonvanishing and independent elements of can be identified if the fibril is aligned along one of the laboratory axes (47, 48). Three of these elements describe chiral contributions, and the other four represent achiral contributions to the SFG spectrum (49, 50). These contributions can be independently measured by controlling the input polarizations of the excitation fields. SFG measurements on aligned type I collagen have revealed that a symmetric methylene mode constitutes a major component of the achiral optical response, whereas carbonyl amide I vibrational modes are identified as chiral contributions in the SFG spectrum (50). Although these measurements have been performed only on macroscopic samples, similar experiments can be conducted in an optical microscope, providing access to detailed structural chemical information on a microscopic scale (44, 51).
In addition to the capability of SFG to probe molecular chirality, it has recently been pointed out that polarization-sensitive CRS measurements also provide access to information about molecular chirality in uniaxially oriented materials (52). Furthermore, the higher-order nonlinearity of the CRS process makes it possible to probe higher-order molecular symmetries. Recent polarization-dependent coherent anti-Stokes Raman scattering (CARS) microscopy studies have shown that fourth-order symmetries of the nonlinear susceptibility near vibrational resonances can be observed in microcrystallites of cubic symmetry (46, 53). This method can be extended to other ordered materials as well, providing molecular symmetry information that is inaccessible with spontaneous Raman scattering techniques.
2.3.2. Frequency dependence
In Equations 1 and 2, the frequency dependence of the second-order and third-order susceptibilities is described by the functions and , respectively. For the SFG and CRS processes, only the terms that contain a vibrational resonance give rise to the desired chemical contrast. These terms have the following form:
| (5) |
| (6) |
Here ωab is the vibrational frequency corresponding to the transition from the ground state a to the vibrational state b, and Γab is a parameter related to the dephasing rate of the vibrational excitation. The label b corresponds to both IR and Raman accessible states. The complex amplitude functions Aab,n(ω3) and Aab,nn′ (ω1, ω4) can contain additional (one-photon) electronic resonances. When the frequency parameters are close to an electronic resonance, the amplitudes can grow significantly, boosting the overall magnitude of vibrationally resonant nonlinear susceptibility. Electronic resonance enhanced CARS (54, 55) and doubly resonant SFG (56–58) operate under these conditions. Far from electronic resonances, the amplitude functions are generally much smaller and real.
The vibrational resonance is described by the denominator in Equations 5 and 6. In SFG, the resonance occurs when the frequency of the IR field, ω2, matches the molecular vibrational transition frequency ωab. In CRS, vibrational resonance is achieved when the difference frequency ω1 − ω2 is tuned to ωab. Vibrational sensitivity in CRS techniques thus arises as a consequence of a two-photon resonance. In addition to the vibrationally resonant terms, both the second-order and third-order susceptibilities include terms that lack vibrational resonances. These terms can be written as and for the second- and third-order susceptibilities, respectively, and are generally not negligible. They can give rise to a significant background in vibrational measurements. These terms are generally complex and can contain one- and two-photon electronic resonances. Far away from electronic resonances, however, these contributions can be considered purely real.
The functional form of the vibrational resonance in Equations 5 and 6 is complex; it contains real and imaginary parts. Far from electronic resonances, the nonlinear susceptibilities χ(n) can be written as
| (7) |
where is the vibrationally resonant contribution to the n-th-order nonlinear susceptibility, and is the nonresonant contribution. The imaginary part of the response corresponds to the dissipation of energy; it accounts for the exchange of energy of the light fields with the material. During a vibrational excitation, energy initially contained in the light fields is absorbed by the molecule, leaving the molecule in a higher energy state. Both IR absorption spectroscopy and spontaneous Raman scattering spectroscopy are sensitive to the absorption of a vibrational quantum, which implies that they probe the imaginary part of the material susceptibility.
The real part of the susceptibility, which accounts for the refractive properties of the material, is not directly probed in linear vibrational techniques. Although the real and imaginary parts of the susceptibility are related to one another through a Kramers-Kronig transformation, it is impossible in linear spectroscopy to retrieve the real part of the response in an isolated and narrow frequency range without knowing the vibrational spectrum at large. In nonlinear vibrational microscopy, alternatively, it is possible to fully characterize the real and imaginary parts of the nonlinear susceptibility with the aid of interferometric detection at single frequencies.
Detecting the real and imaginary parts of the nonlinear susceptibility as separate entities is attractive for vibrational imaging applications. It is clear from Equation 7 that, whereas the real part contains both nonresonant and vibrationally resonant terms, Imχ(n) is sensitive solely to vibrational resonances. Hence vibrational microscopy based on the amplitude of Imχ(n) provides images in which the contrast is directly derived from molecular vibrations without electronic background contributions. This can be achieved with phase-sensitive SFG (Imχ(2)) and phase-sensitive CARS [Imχ(3)] by tuning a reference field, commonly called the local oscillator, in phase with the imaginary part of the response (59–62). In stimulated Raman scattering (SRS) methods, the local oscillator is provided by the incident light fields, which have a fixed phase with respect to the material response (63–66). These techniques illustrate that coherent detection allows a direct inspection of the energy flow between the light fields and the material, which is the source of chemical contrast. This concept was recently generalized for CRS microscopy by demonstrating that the energy loss in the combined light fields corresponds to a vibrational energy gain in the material (67, 68).
However, it is the ability to detect both the real and imaginary parts of the material susceptibility that really sets nonlinear vibrational methods apart from their linear counterparts. When both Reχ(n) and Imχ(n) are known, the amplitude and phase of the vibrational transition can be determined (69). Figure 4a,b shows the CARS amplitude and phase of two different polymers, polyethylene and poly(methyl)-methacrylate. The difference in chemical structure between the two polymers is reflected in both the amplitude and phase spectra, which implies that both the amplitude dimension and the phase dimension can be used to distinguish the two chemical species. This information can also be presented in the complex plane, as shown in Figure 4e, which plots the amplitudes of both Reχ(3) and Imχ(3) for each pixel in an image. Different areas can be recognized in the complex plane, corresponding to chemical groups whose vibrations have a specific vibrational amplitude and phase. Consequently, different molecules can be discriminated based on their position in the complex plane. Note that this information was obtained at a single (narrowband) Raman frequency, which is a detection strategy compatible with very fast image-acquisition times. Hence phase-sensitive methods, such as interferometric CARS and optically heterodyne-detected Raman-induced Kerr effect (70) microscopy, permit the simultaneous detection and separation of multiple chemical species at image-acquisition rates that are orders of magnitude higher than what can be attained with linear vibrational microscopies.
Figure 4.
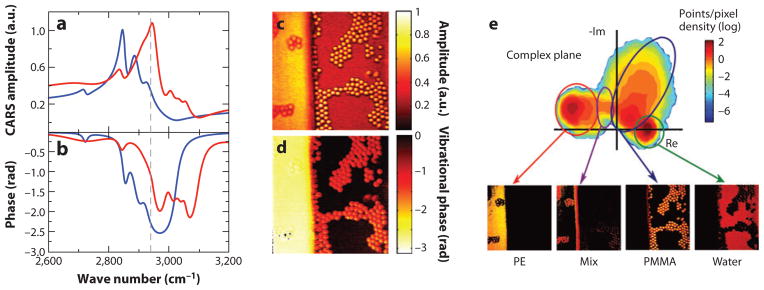
Vibrational phase microscopy with interferometrically detected coherent anti-Stokes Raman scattering (CARS). (a) CARS amplitude of poly(methyl)-methacrylate (red ) and polyethylene (blue). (b) Corresponding vibrational phase of the two polymers. (c) CARS amplitude image and (d ) corresponding phase image of a sample containing a sheet of polyethylene (PE), poly(methyl)-methacrylate (PMMA) beads, and water. The images were acquired at 2,940 cm−1, corresponding to the dashed line in panels a and b. (e) Density graph of the projected amplitude and phase points in the complex plane. Images are plotted below for several locations in the complex plane, showing chemically distinct contrast that enables the separation of the several components. Figure reproduced in part with permission from Reference 69. Copyright 2010 American Chemical Society. Courtesy of Herman Offerhaus, Twente University.
3. SECOND-ORDER VIBRATIONAL MICROSCOPY
3.1. Sum-Frequency Generation Microscopy
Vibrationally resonant SFG has long been recognized as a spectroscopic technique for probing molecules at interfaces. Because the SFG response is dictated by χ(2), the sample needs to exhibit noncentrosymmetry. This condition is fulfilled at planar interfaces, which enables the generation of SFG radiation, induced by molecules at the surface, in a phase-matched direction (71–74). For example, SFG spectroscopy has unveiled important information about the molecular structure and dynamics of phospholipid membranes (75–78) and water surfaces (79). In addition to nonvanishing SFG signals at planar surfaces, it has been demonstrated that second-order nonlinear optical signals can be generated from a suspension of microscopic vesicles (80, 81). This observation has triggered several spectroscopic studies of vesicles whose membranes have curvatures that are relevant for biological function (82).
The SFG surface sensitivity, which is unique and has no equivalent in linear vibrational spectroscopy, has also been exploited in SFG microscopy. Most implementations of surface-sensitive SFG microscopy are based on a wide-field excitation geometry. In these experiments, an area of several hundred squared micrometers of the sample is illuminated with amplified laser beams, and the SFG radiation is captured by a high-numerical-aperture lens to form an image on a camera (83). The wide-field illumination approach is sensitive enough to visualize self-assembled monolayers with chemical selectivity in the CH stretching range (84–88). An example is shown in Figure 5. The spatial resolution in wide-field SFG can be as high as 2 μm (89–91), which is much higher than what can be obtained in linear IR microscopy. The higher resolution is a direct consequence of the nonlinear upconversion of an initial IR excitation to a signal in the visible range of the spectrum.
Figure 5.

Surface-sensitive sum-frequency generation (SFG) imaging of a patterned monolayer of hexadecane-dithiocarboxylic acid and 16-phenyl-hexadecanethiol. (a) Image taken at 2,875 cm−1 showing strong contrast from the methyl group of hexadecane-dithiocarboxylic acid. (b) Image taken at 3,065 cm−1 showing strong contrast from the aromatic CH stretching mode. Note that the contrast in panels a and b is inverted. (c) Close-up of the highlighted area in panel a. (d ) SFG spectra of the selected blue and green areas in panel c. Spectra are offset for clarity. Based on results presented in Reference 88. Courtesy of Steven Baldelli, University of Houston.
Besides mapping the spatial heterogeneity in interfacial molecular layers, the SFG microscope is sensitive to biological structures with intrinsic noncentrosymmetry on the microscopic scale. Biofibers such as cellulose, collagen, and microtubules share this property and are thus suitable targets for SFG imaging. In addition, crystallized structures of chiral biomolecules maintain a macroscopic noncentrosymmetry (92, 93) and can thus produce detectable SFG signals in the nonlinear microscope. Some examples are discussed below.
Relaxed phase-matching conditions in a microscope can be used when measuring biological structures with nonzero χ(2) elements. Using collinearly aligned IR and visible excitation beams, while maintaining a wide-field detection strategy, investigators have achieved a lateral resolution as high as 1.1 μm for SFG imaging in the CH stretching range (94, 95). High axial resolution was furthermore accomplished by illuminating the sample in a wide-field fashion with the IR beam and focusing the visible excitation beam with a high-numerical-aperture lens (96). In this configuration, the visible SFG radiation can be detected through a pinhole with a point detector, and the image is formed by raster scanning the sample with a translation stage. Alternatively, reflective objective lenses can be utilized, which permit collinear focusing of both the visible and IR beams to a joint focal spot. Adopting the latter implementation, researchers demonstrated SFG imaging with a lateral resolution of 0.6 μm (44). Hence the nonlinearity of SFG produces a dual-color excitation volume that is much smaller than what can be achieved with focused IR light alone.
Most SFG microscopes to date have used amplified laser systems, whose low repetition rates are not optimized for fast imaging applications. A picosecond synchronously pumped optical parametric oscillator, which produces high-repetition-rate radiation in the 2,800 to 3,100 cm−1 range, is an attractive option for rapid narrowband SFG imaging (44). Importantly, vibrationally resonant, single-frequency SFG signals are comparable in magnitude to the signal strength of conventional nonlinear optical imaging modalities based on second-harmonic generation (SHG) or CRS contrast, which makes laser-scanning SFG microscopy with microsecond pixel dwell times possible. With optimized, high-repetition-rate mid-IR light sources in place, SFG imaging is fully compatible with the fast imaging capabilities of existing nonlinear imaging techniques, making SFG contrast a promising addition to the multimodal nonlinear optical microscope.
3.2. SFG Biomolecular Imaging Applications
Cellulose, the most abundant natural polymer on Earth, exhibits a noncentrosymmetric structure and displays SFG activity. In plant cells, the cellulose biopolymer, consisting of polymerized β-D-glucopyranose units, gives mechanical strength to plant cell walls. The selective visualization of cellulose at the microscopic scale provides valuable information about the structure and rheology of cellulose fibers, information that is relevant to the paper and textile industry, as well as to research concerned with biofuel production. Using vibrationally resonant SFG experiments, researchers demonstrated that the noncentrosymmetric ordering of the (exocyclic) methylene group gives rise to strong signatures in the CH stretching range of the SFG spectrum (97). Furthermore, polarization-sensitive SFG measurements have shown that the SFG-active methylene mode at 2,945 cm−1, which was ascribed to an asymmetric stretching vibration, gives rise to a dominant chiral component to the signal in this range (98). Imaging of cellulose fibers with 2-μm spatial resolution revealed spatial heterogeneity along the fibers introduced by variations in the orientation and density of micrometer-sized crystalline domains (98). Figure 6a shows an example of SFG imaging of cellulose. Other polysaccharides display similar SFG-active molecular vibrations. For instance, SFG microscopy has been used to map starch granules in living Chara fibrosa plants (99) and in rice grains (100).
Figure 6.
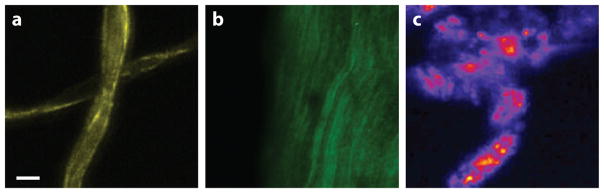
Sum-frequency generation imaging of noncentrosymmetric biomolecular compounds using tightly focused beams and raster scanning of the sample: (a) cellulose fibers, (b) collagen fibers from rat tail tendon, and (c) cholesterol monohydrate crystals. Images were taken at 2,950 cm−1. Scale bar is 20 μm.
Besides carbohydrates such as cellulose, several fibrous protein structures also give rise to strong SFG signals. Type I collagen, discussed in Section 2.3.1, is a protein-based fibrous structure that can be visualized in the SFG microscope with signal levels comparable to the magnitude of visible SHG signals (44). An example is shown in Figure 6b. Other biopolymers that could be examined with SFG microscopy include microtubules (101), aligned DNA (102), and ordered amyloid polypeptides (103).
Crystals formed from chiral biological molecules are another important target for SFG imaging. The second-order optical activity of chiral crystals has been used, for instance, to monitor protein crystal nucleation (104) and to visualize protein microcrystallites in pharmaceutical products with SHG microscopy (105). Cholesterol crystals, which are thought to play a prominent role in atherosclerotic disease progression, are noncentrosymmetric and can be probed by SHG (41) and SFG microscopy. Figure 6c shows a vibrationally resonant SFG image of cholesterol microcrystals. SFG microspectroscopy has also been used to discriminate several saccharide microcrystallites, including D-glucose, amylopectin, and β-cyclodextrin (106), illustrating the usefulness of chemically selective SFG imaging.
Finally, recent SFG microscopy studies on cultured cells have shown that SFG signals with a spectral dependence in the CH stretching vibrational range can be observed (95). Although the origin of these signals remains to be determined, it is clear that SFG microscopy may provide useful information about intracellular constituents that can complement the contrast seen in CRS images of cells.
4. THIRD-ORDER VIBRATIONAL MICROSCOPY
4.1. Coherent Raman Scattering Techniques
The imaging capabilities of CRS imaging techniques have improved dramatically over the past 15 years. Technological developments have pushed the imaging speed of CRS methods to video rate (107, 108), firmly inserting CRS microscopy as a viable imaging tool for biomedical research and diagnostics. CRS enables the generation of real-time images with vibrational contrast in live animals (107, 109, 110) and human subjects (108, 111, 112), a capability that remains out of reach for linear vibrational imaging methods.
Fast imaging applications of CRS commonly use two excitation beams, ω1 and ω2, called pump and Stokes (ω1 > ω2), respectively. In this configuration, four main types of CRS signals can be collected: coherent Stokes Raman scattering (CSRS) at ωc s = 2ω2 −ω1, stimulated Raman gain at ω2, stimulated Raman loss at ω1, and CARS at ωas = 2ω1 − ω2. All these CRS signals result from the same Raman transition and are generated simultaneously. They can be detected separately with spectral filters and/or modulation techniques (65).
Experimentally, fast CRS imaging applications make use of a collinear excitation geometry in which both excitation beams are focused to a common focal volume. Images are generated by rapidly raster scanning the focus across the image and collecting the signal through spectral filters onto large-aperture detectors. SRS techniques use additional demodulators to filter the nonlinear Raman signals from the laser background. The CRS microscope has matured into a user-friendly instrument, and easy-to-use commercial solutions have become available.
All CRS techniques enjoy signal levels that can be many orders of magnitude higher than in spontaneous Raman scattering, which is a direct consequence of the coherence among the oscillators in focus. The strong signals permit short pixel dwell times of less than 1 μs, enabling real-time imaging at video rates (107, 108). Yet the fastest implementations of CRS imaging are narrowband techniques in which the intensity of one particular Raman band is used as the contrast in the image. This single-frequency approach produces little spectral information. Hence, where as CRS microscopy is superior to Raman microscopy in terms of imaging speed, spontaneous Raman spectroscopy tops most CRS methods in terms of spectral information. To visualize and identify multiple biomolecular compounds in live samples, it is essential to combine the fast imaging speed of CRS microscopy with spectroscopic information from a broader range of the vibrational spectrum.
Current developments focus on improving the spectral content of the CRS signal while maintaining the advantage of fast imaging. Broadband CARS and SRS methods, which make use of spectrally broad pulses and CCD (charge-coupled-device)-based spectrometers, are continuing to improve, pushing spectral acquisition times to several milliseconds or less. These spectral acquisition times are currently one order of magnitude less compared to those of spontaneous Raman microscopy (38, 113). Other broadband techniques make use of tuning mechanisms based on spectral focusing (114, 115) or employ pulses with a spectral amplitude and phase optimized to efficiently drive a particular Raman chromophore (116), which allows fast detection with a large-aperture detector. The latter method enables selective imaging of particular biomolecular compounds in mixtures with effective pixel dwell times of ~0.1 ms. Alternatively, a narrowband pulse or portions of a broadband pulse can be spectrally swept to achieve spectral bandwidth. In this approach, image frames are collected for a series of single frequencies, which are then combined in a stack for further spectral analysis (41, 117). Effective spectral acquisition times of the order of 1 ms have been reported (118), and further developments are likely to reduce the acquisition time even more.
In addition to the improved image-acquisition times, CRS methods introduce new nonlinear mechanisms to sharpen the resolution of the vibrational microscope. Using beam-shaping techniques, nonlinear excitation volumes can be formed with smaller focal spots than what can be obtained with (linear) single-beam techniques. Focal spot sizes as small as 0.13μm have been reported, improving the resolution by twofold relative to standard CRS imaging conditions (119). Other advanced nonlinear optical schemes promise CRS imaging with an even higher resolution (120, 121).
4.2. Fast Biomolecular Imaging Applications
The fast imaging capabilities of CRS imaging make it possible to follow dynamic processes in live cells without using labels. Most studies reported to date have focused on cellular processes related to intracellular lipid bodies, which are often called lipid droplets (122). Because the droplets are mobile and biologically dynamic, the slower acquisition time of spontaneous Raman microscopy is typically insufficient to capture important processes associated with lipid droplets. The ability to follow mobile droplets in living cells with CRS has provided useful information, for example, about lipid droplet trafficking mechanisms (123), lipid droplet growth and remodeling (124, 125), and variation in adipogenesis as a function of insulin signaling pathways (126). The fast imaging capability of CRS is also leveraged in studies that focus on water diffusion and water membrane permeability in single living cells, in which the OH stretching vibration is used as a marker for water (127, 128). Beyond individual cells, CRS methods have proved useful for probing lipid dynamics in live microorganisms, including Caenorhabditis elegans (129) and Drosophila larva (130). Because microorganisms can move significantly in real time, fast imaging capabilities are crucial in these studies.
In most CRS microscopy studies of cells and microorganisms, the single-frequency approach has been used to ensure sufficient imaging speed. Better chemical analytical capabilities are attained with broadband CARS techniques, which have shown that cellular compartments can be identified through vibrational signatures in a broad spectral range from 600 to 3,200 cm−1 and with acquisition times of the order of several tens of milliseconds per pixel (113). Figure 7 shows spectral SRS images of human lung cancer cells, collected in the CH stretching spectral range from 2,810 to 2,980 cm−1 using wavelength sweeping. Although here the spectral range is moderate, the effective acquisition time is of the order of a few milliseconds, which is sufficiently fast to capture spectral images within a time frame of several minutes. Spectral CRS imaging discriminates important spectral features that can be associated with cellular compartments using multivariate analysis techniques.
Figure 7.

Spectral stimulated Raman scattering (SRS) imaging of human lung A549 cancer cells in the 2,810 cm−1 to 2,980 cm−1 range. (Top row) The projected SRS intensity image of the spectral data stack. (Middle row) The data represented by the dominant three principal components (PCs) of the spectral data stack plotted as red (PC1), blue (PC2), and green (PC3). Each pixel in the image is assigned an RGB (red, green, blue) value, according to the weight of each principal component. The color differences in the image correspond to differences in the spectral properties between the pixels. (Bottom row) The same data represented with the help of a K-means clustering analysis. Each color (dark blue, cyan, green, yellow, and red ) corresponds to a characteristic spectrum, each found by the clustering analysis. In this case, the data are decomposed into five distinct clusters. The first column (a–c) and second column (d–f ) show control cells. The third column ( g–i ) shows cells treated with a low dose of indole-3-carbinol (IC3), an anticancer drug. The fourth column ( j–l ) shows cells treated with a high dose of IC3. Note that differences between the nuclear and cytosolic parts of the cells are readily recognized in the spectral images, which facilitates identification of phenotype differences resulting from drug treatments.
Similar to the imaging of cells, visualization of live tissues requires fast imaging capabilities to intercept stills from a moving specimen. CRS imaging has proved tremendously successful in meeting this need. For instance, single-frequency CRS techniques have been used to generate maps of nervous tissue in live animals based on the strong nonlinear Raman signal of CH-rich lipids in myelin-wrapped neurons (109, 131–135). These studies have revealed important details about neurological injuries and have helped visualize possible repair mechanisms. Similarly, CRS imaging has also been used to visualize endogenous and exogenous molecular compounds in the skin of live human subjects (108, 111, 112). Moreover, fast imaging allows for the collection of images from larger tissue areas, through the acquisition of multiple frames that can be arranged in a tiled mosaic, with realistic imaging times of the order of minutes. For instance, macroscopic CRS maps of brain tissue have been generated, comprising tiled microscopic frames, up to several squared centimeters in size (136–138). Such maps are useful for detailed pathological assessment of brain lesions and neurological defects. Although these large mosaics in principle can be recorded with linear Raman microscopy, the corresponding acquisition time would be more than several weeks, which is clinically unacceptable. The image-acquisition times of single-frequency CRS methods are also compatible with the requirements for endoscopic imaging (139, 140), further stressing the potentially high impact of nonlinear Raman techniques in clinical research and diagnostics.
5. CONCLUDING REMARKS
Although the source of contrast in linear and nonlinear vibrational microscopy techniques derives from the same molecular modes, coherent nonlinear methods feature several improved imaging capabilities that have elevated the impact of vibrational microscopy in the biological and biomedical research fields. Higher spatial resolution, the opportunity to probe the vibrational phase, and the ability to examine higher-order molecular symmetries are examples of new capabilities that nonlinear vibrational techniques have added to the imaging properties of existing linear vibrational microscopes. Above all, it is the much higher imaging speed of nonlinear vibrational microscopy that has opened up a new area of biomolecular imaging applications. Nonetheless, the improved imaging speed is accompanied by a loss of spectral information. The challenge ahead is to bring together the excellent analytical capabilities of linear vibrational microscopy techniques with the superior image-acquisition times of single-frequency nonlinear methods. Recent developments in CRS microscopy indicate that this goal is within reach. The fruition of such capabilities would transform nonlinear vibrational microscopy into a real-time chemical diagnostic tool, which is likely to have a significant impact in multiple areas of fundamental and applied research, including clinical imaging, cell biological research, material science, and surface chemistry.
SUMMARY POINTS.
Interferometric detection of the coherent SFG or CRS signal allows a full characterization of the amplitude and phase of the vibrational mode at any driving frequency. Knowledge of the vibrational phase translates into an enhanced differentiation of molecules at a single vibrational frequency.
Nonlinear microscopy methods offer opportunities to improve the imaging resolution relative to linear vibrational techniques. The spatial resolution in IR/visible SFG microscopy is significantly better compared to the resolution in linear IR microscopy because of the nonlinear upconversion to a signal in the visible range. Similarly, spatial shaping of the nonlinear CRS excitation volume has produced smaller focal spot sizes compared to the focal volumes in Raman microscopy.
Single-frequency SFG and CRS imaging techniques have much higher imaging speeds than their linear counterparts. These fast image-acquisition times enable high-resolution mapping of live and dynamic biological samples in real time, a capability currently impossible with linear techniques.
The current technical challenge in coherent nonlinear vibrational microscopy is to merge its fast imaging capabilities with spectroscopic information over a broad spectral bandwidth. Recent developments have provided glimpses of such nonlinear vibrational microscopes with improved analytical imaging capabilities.
Acknowledgments
We thank Roza Korai and Jeffrey Suhalim for their help in preparing the figures. We acknowledge support from the National Institutes of Health, grant P41-RR-01192 (Laser Microbeam and Medical Program), and from the National Science Foundation, grant CHE-0807097. J.B. acknowledges financial support from the Life Extension Foundation.
Glossary
- SFG
sum-frequency generation
- CRS
coherent Raman scattering
- CARS
coherent anti-Stokes Raman scattering
- SRS
stimulated Raman scattering
- SHG
second-harmonic generation
Footnotes
DISCLOSURE STATEMENT
The authors are not aware of any affiliations, memberships, funding, or financial holdings that might be perceived as affecting the objectivity of this review.
LITERATURE CITED
- 1.Wetzel DL, Levine SM. Imaging molecular chemistry with infrared microscopy. Science. 1999;285:1224–25. doi: 10.1126/science.285.5431.1224. [DOI] [PubMed] [Google Scholar]
- 2.Diem M, Boydston-White S, Chiriboga L. Infrared spectroscopy of cells and tissues: shining light onto a novel subject. Appl Spectrosc. 1999;53:A148–61. [Google Scholar]
- 3.Bhargava R, Levib IW. Fourier transform infrared imaging: theory and practice. Anal Chem. 2001;73:5157–67. doi: 10.1021/ac010380m. [DOI] [PubMed] [Google Scholar]
- 4.Levin IW, Bhargava R. Fourier transform infrared vibrational spectroscopic imaging: integrating microscopy and molecular recognition. Annu Rev Phys Chem. 2005;56:429–74. doi: 10.1146/annurev.physchem.56.092503.141205. [DOI] [PubMed] [Google Scholar]
- 5.Fernandez DC, Bhargava R, Hewitt SM, Levin IW. Infrared spectroscopic imaging for histopathologic recognition. Nat Biotechnol. 2005;23:469–74. doi: 10.1038/nbt1080. [DOI] [PubMed] [Google Scholar]
- 6.Lasch P, Boese M, Pacifico A, Diem M. FT-IR spectroscopic investigations of single cells on the subcellular level. Vib Spectrosc. 2002;28:147–57. [Google Scholar]
- 7.Delhaye M, Dhamelincourt P. Raman microprobe and microscope with laser excitation. J Raman Spectrosc. 1975;3:33–43. [Google Scholar]
- 8.Delhaye M, Migeon M. Interet de la concentration d’un faisceau laser pour l’excitation de l’effet Raman. C R Acad Sci Paris. 1966;262:1513–16. [Google Scholar]
- 9.Turrell G, Corset J, editors. Raman Microscopy: Developments and Applications. San Diego: Academic; 1996. [Google Scholar]
- 10.Matthäus C, Bird B, Miljković M, Chernenko T, Romeo M, Diem M. Infrared and Raman microscopy in cell biology. Methods Cell Biol. 2008;89:275–308. doi: 10.1016/S0091-679X(08)00610-9. [DOI] [PMC free article] [PubMed] [Google Scholar]
- 11.Uzunbajakava N, Lenferink A, Kraan Y, Volokhina E, Vrensen G, et al. Nonresonant confocal Raman imaging of DNA and protein distribution in apoptotic cells. Biophys J. 2003;84:3968–81. doi: 10.1016/S0006-3495(03)75124-8. [DOI] [PMC free article] [PubMed] [Google Scholar]
- 12.Matthäus C, Chernenko T, Newmark JA, Warner CM, Diem M. Label-free detection of mitochondrial distribution in cells by nonresonant Raman microspectroscopy. Biophys J. 2007;93:668–73. doi: 10.1529/biophysj.106.102061. [DOI] [PMC free article] [PubMed] [Google Scholar]
- 13.Klein K, Gigler AM, Aschenbrenner T, Monetti R, Bunk W, et al. Label-free live-cell imaging with confocal Raman microscopy. Biophys J. 2012;102:360–68. doi: 10.1016/j.bpj.2011.12.027. [DOI] [PMC free article] [PubMed] [Google Scholar]
- 14.Cheng J-X, Volkmer A, Xie XS. Theoretical and experimental characterization of coherent anti-Stokes Raman scattering microscopy. J Opt Soc Am B. 2002;19:1363–75. [Google Scholar]
- 15.Potma EO, Krishnamachari VV. Imaging with phase-sensitive narrowband nonlinear microscopy. In: Yakovlev VV, editor. Biochemical Applications of Nonlinear Optical Spectroscopy. Boca Raton, FL: CRC; 2009. pp. 213–38. [Google Scholar]
- 16.Popov KI, Pegoraro AF, Stolow A, Ramunno L. Image formation in CARS microscopy: effect of the Gouy phase shift. Opt Express. 2011;19:5902–11. doi: 10.1364/OE.19.005902. [DOI] [PubMed] [Google Scholar]
- 17.Evans CL, Xie XS. Coherent anti-Stokes Raman scattering microscopy: chemical imaging for biology and medicine. Annu Rev Anal Chem. 2008;1:883–909. doi: 10.1146/annurev.anchem.1.031207.112754. [DOI] [PubMed] [Google Scholar]
- 18.Le TT, Yue S, Cheng JX. Shedding new light on lipid biology with coherent anti-Stokes Raman scattering microscopy. J Lipid Res. 2010;51:3091–102. doi: 10.1194/jlr.R008730. [DOI] [PMC free article] [PubMed] [Google Scholar]
- 19.Pezacki JP, Blake JA, Danielson DC, Kennedy DC, Lyn RK, Singaravelu R. Chemical contrast for imaging living systems: Molecular vibrations drive CARS microscopy. Nat Chem Biol. 2011;7:137–45. doi: 10.1038/nchembio.525. [DOI] [PMC free article] [PubMed] [Google Scholar]
- 20.Carugo O. Amino acid composition and protein dimension. Protein Sci. 2008;17:2187–91. doi: 10.1110/ps.037762.108. [DOI] [PMC free article] [PubMed] [Google Scholar]
- 21.Pozefsky A, Coggeshall ND. Infrared absorption studies of carbon hydrogen stretching frequencies. Anal Chem. 1951;23:1611–19. [Google Scholar]
- 22.Fox JJ, Martin AE. Investigations of infra-red spectra: determination of C-H frequencies (~3000 cm−1) in paraffins and olefins with some observations of polythenes. Proc R Soc. 1940;175:208–33. [Google Scholar]
- 23.Lu R, Gan W, Wu BH, Zhang Z, Guo Y, Wang HF. C-H stretching vibrations of methyl, methylene and methine groups at the vapor/alcohol (n = 1–8) interfaces. J Phys Chem B. 2005;109:14118–29. doi: 10.1021/jp051565q. [DOI] [PubMed] [Google Scholar]
- 24.Wiley JH, Atalla RH. Band assignments in the Raman spectra of celluloses. Carbohydr Res. 1987;160:113–29. [Google Scholar]
- 25.Snyder RG, Hsu SL, Krimm S. Vibrational spectra in the C-H stretching region and the structure of the polymethylene chain. Spectrochim Acta. 1978;34A:395–406. [Google Scholar]
- 26.Gaber BP, Peticolas WL. On the quantitative interpretation of biomembrane structure by Raman spectroscopy. Biochim Biophys Acta. 1977;465:260–74. doi: 10.1016/0005-2736(77)90078-5. [DOI] [PubMed] [Google Scholar]
- 27.Kodati VR, El-Jastimi R, Lafleur M. Contribution of the intermolecular coupling and librotorsional mobility in the methylene stretching modes in the infrared spectra of acyl chains. J Phys Chem. 1994;98:12191–97. [Google Scholar]
- 28.Snyder RG, Scherer JR, Gaber BP. Effects of chain packing and chain mobility on the Raman spectra of biomembranes. Biochim Biophys Acta. 1980;601:47–53. doi: 10.1016/0005-2736(80)90512-x. [DOI] [PubMed] [Google Scholar]
- 29.Snyder RG, Strauss HL, Elliger CA. C-H stretching modes and structure of n-alkyl chains 1. Long, disordered chains. J Phys Chem. 1982;86:5145–50. [Google Scholar]
- 30.Miyazawa T, Shimanouchi T, Mizushima SI. Normal vibrations of N-methyl acetamide. J Chem Phys. 1958;29:611–16. [Google Scholar]
- 31.Gwinn WD. Normal coordinates: general theory, redundant coordinates and general analysis using electronic computers. J Chem Phys. 1971;55:477–81. [Google Scholar]
- 32.Mirkin NG, Krimm S. Ab initio vibrational analysis of hydrogen-bonded trans- and cis-N-methylacetamide. J Am Chem Soc. 1991;113:9742–47. [Google Scholar]
- 33.Csaszar AG. On the structures of free glycine and α-alanine. J Mol Struct. 1995;346:141–52. [Google Scholar]
- 34.Csaszar AG. Conformers of gaseous α-alanine. J Phys Chem. 1996;100:3541–51. [Google Scholar]
- 35.Sebek J, Pele L, Potma EO, Geber RB. Raman spectra of long chain hydrocarbons: anharmonic calculations, experiment and implications for imaging of biomembranes. Phys Chem Chem Phys. 2011;13:12724–33. doi: 10.1039/c1cp20618d. [DOI] [PMC free article] [PubMed] [Google Scholar]
- 36.Pele L, Sebek J, Potma EO, Gerber RB. Raman and IR spectra of butane: anharmonic calculations and interpretation of room temperature spectra. Chem Phys Lett. 2011;515:7–12. [Google Scholar]
- 37.Krafft C, Ramoji AA, Bielecki C, Vogler N, Meyer T, et al. A comparative Raman and CARS imaging study of colon tissue. J Biophotonics. 2009;2:303–12. doi: 10.1002/jbio.200810063. [DOI] [PubMed] [Google Scholar]
- 38.Pohling C, Buckup T, Motzkus M. Hyperspectral data processing for chemoselective multiplex coherent anti-Stokes Raman scattering microscopy of unknown samples. J Biomed Opt. 2011;16:021105. doi: 10.1117/1.3533309. [DOI] [PubMed] [Google Scholar]
- 39.Chowdary PD, Benalcazar WA, Jiang Z, Marks DM, Boppart SA, Gruebele M. High speed nonlinear interferometric vibrational analysis of lipids by spectral decomposition. Anal Chem. 2010;82:3812–18. doi: 10.1021/ac100222c. [DOI] [PMC free article] [PubMed] [Google Scholar]
- 40.Lim RS, Suhalim JL, Miyazaki-Anzai S, Miyazaki M, Levi M, et al. Identification of cholesterol crystals in plaques of atherosclerotic mice using hyperspectral CARS imaging. J Lipid Res. 2011;52:2177–86. doi: 10.1194/jlr.M018077. [DOI] [PMC free article] [PubMed] [Google Scholar]
- 41.Suhalim JL, Chung CY, Lilledahl MB, Lim RS, Levi M, et al. Characterization of cholesterol crystals in atherosclerotic plaques using stimulated Raman scattering and second-harmonic generation microscopy. Biophys J. 2012;102:1988–95. doi: 10.1016/j.bpj.2012.03.016. [DOI] [PMC free article] [PubMed] [Google Scholar]
- 42.Butcher PN, Cotter D. The Elements of Nonlinear Optics. New York: Cambridge Univ. Press; 1990. [Google Scholar]
- 43.Chase LL, Stryland EWV. Inorganic materials. In: Weber MJ, editor. CRC Handbook of Laser Science and Technology Supplement 2: Optical Materials. Boca Raton, FL: CRC; 1995. pp. 269–88. [Google Scholar]
- 44.Raghunathan V, Han Y, Korth O, Ge NH, Potma EO. Rapid vibrational imaging with sum frequency generation microscopy. Opt Lett. 2011;36:3891–93. doi: 10.1364/OL.36.003891. [DOI] [PMC free article] [PubMed] [Google Scholar]
- 45.Wang HF, Gan W, Lu R, Rao Y, Wu BH. Quantitative spectral and orientational analysis in surface sum frequency generation vibrational spectroscopy. Int Rev Phys Chem. 2005;24:191–256. [Google Scholar]
- 46.Brasselet S. Polarization-resolved nonlinear microscopy: application to structural and biological imaging. Adv Opt Photonics. 2011;3:205–71. [Google Scholar]
- 47.Dick B. Irreducible tensor analysis of sum-frequency and difference-frequency generation in partially oriented samples. Chem Phys. 1985;96:199–215. [Google Scholar]
- 48.Fisher P, Hache F. Nonlinear optical spectroscopy of chiral molecules. Chirality. 2005;17:421–37. doi: 10.1002/chir.20179. [DOI] [PubMed] [Google Scholar]
- 49.Haupert LM, Simpson GJ. Chirality in nonlinear optics. Annu Rev Phys Chem. 2009;60:345–65. doi: 10.1146/annurev.physchem.59.032607.093712. [DOI] [PubMed] [Google Scholar]
- 50.Rocha-Mendoza I, Yankelevich DR, Wang M, Reiser KM, Frank CW, Knoesen A. Sum frequency vibrational spectroscopy: the molecular origins of the optical second-order nonlinearity of collagen. Biophys J. 2007;93:4433–44. doi: 10.1529/biophysj.107.111047. [DOI] [PMC free article] [PubMed] [Google Scholar]
- 51.Ji N, Zhang K, Yang H, Shen YR. Three-dimensional chiral imaging by sum-frequency generation. J Am Chem Soc. 2006;128:3482–83. doi: 10.1021/ja057775y. [DOI] [PubMed] [Google Scholar]
- 52.Davis RP, Moad AJ, Goeken GS, Wampler RD, Simpson GJ. Selection rules and symmetry relations for four-wave mixing measurements of uniaxial assemblies. J Phys Chem B. 2008;112:5834–48. doi: 10.1021/jp709961k. [DOI] [PubMed] [Google Scholar]
- 53.Munhoz F, Rigneault H, Brasselet S. High order symmetry structural properties of vibrational resonances using multiple-field polarization coherent anti-Stokes Raman spectroscopy microscopy. Phys Rev Lett. 2010;105:123903. doi: 10.1103/PhysRevLett.105.123903. [DOI] [PubMed] [Google Scholar]
- 54.Druet SAJ, Attal B, Gustafson TK, Taran JP. Electronic resonance enhancement of CARS. Phys Rev A. 1978;18:1529–57. [Google Scholar]
- 55.Maeda S, Kamisuki T, Kataoka H, Adachi Y. Resonance CARS studies of electronic excited molecules. Appl Spectrosc Rev. 1985;21:211–57. [Google Scholar]
- 56.Humbert C, Dreesen L, Mani AA, Gaudano Y, Lemaire JJ, et al. IR-visible sum-frequency vibrational spectroscopy of biphenyl-3 methylene thiol monolayer on gold and silver: effect of the visible wavelength on the SFG spectrum. Surf Sci. 2002;502–503:203–7. [Google Scholar]
- 57.Humbert C, Dreesen L, Nihonyanagi S, Masuda Y, Kondo T, et al. Probing a molecular electronic transition by two-colour sum-frequency generation spectroscopy. Appl Surf Sci. 2003;212–213:797–803. [Google Scholar]
- 58.Raschke MB, Hayashi M, Shen YR. Doubly-resonant sum-frequency generation spectroscopy for surface studies. Chem Phys Lett. 2002;359:367–73. [Google Scholar]
- 59.Evans CL, Potma EO, Xie XS. Coherent anti-Stokes Raman scattering interferometry: determination of the real and imaginary components of the nonlinear susceptibility for vibrational microscopy. Opt Lett. 2004;29:2930–32. doi: 10.1364/ol.29.002923. [DOI] [PubMed] [Google Scholar]
- 60.Jurna M, Korterik JP, Otto C, Offerhaus HL. Shot noise limited heterodyne detection of CARS signals. Opt Express. 2007;15:15207–13. doi: 10.1364/oe.15.015207. [DOI] [PubMed] [Google Scholar]
- 61.Marks DL, Boppart SA. Nonlinear interferometric vibrational imaging. Phys Rev Lett. 2004;92:123905. doi: 10.1103/PhysRevLett.92.123905. [DOI] [PubMed] [Google Scholar]
- 62.Potma EO, Evans CL, Xie XS. Heterodyne coherent anti-Stokes Raman scattering (CARS) imaging. Opt Lett. 2006;31:241–43. doi: 10.1364/ol.31.000241. [DOI] [PubMed] [Google Scholar]
- 63.Freudiger CW, Min W, Saar BG, Lu S, Holtom GR, et al. Label-free biomedical imaging with high sensitivity by stimulated Raman scattering microscopy. Science. 2008;322:1857–61. doi: 10.1126/science.1165758. [DOI] [PMC free article] [PubMed] [Google Scholar]
- 64.Ploetz E, Laimgruber S, Berner S, Zinth W, Gilch P. Femtosecond stimulated Raman microscopy. Appl Phys B. 2007;87:389–93. [Google Scholar]
- 65.Min W, Freudiger CW, Lu S, Xie XS. Coherent nonlinear optical microscopy: beyond fluorescence microscopy. Annu Rev Phys Chem. 2011;62:507–30. doi: 10.1146/annurev.physchem.012809.103512. [DOI] [PMC free article] [PubMed] [Google Scholar]
- 66.Nandakumar P, Kovalev A, Volkmer A. Vibrational imaging based on stimulated Raman scattering. New J Phys. 2009;11:033026. [Google Scholar]
- 67.Rahav S, Mukamel S. Stimulated coherent anti-Stokes Raman spectroscopy (CARS) resonances originate from double-slit interference of two Stokes pathways. Proc Natl Acad Sci USA. 2010;107:4825–29. doi: 10.1073/pnas.0910120107. [DOI] [PMC free article] [PubMed] [Google Scholar]
- 68.Garbacik ET, Korterik JP, Otto C, Mukamel S, Herek JL, Offerhaus HL. Background-free non-linear microspectroscopy with vibrational molecular interferometry. Phys Rev Lett. 2011;107:253902. doi: 10.1103/PhysRevLett.107.253902. [DOI] [PMC free article] [PubMed] [Google Scholar]
- 69.Jurna M, Garbacik ET, Korterik JP, Herek JL, Otto C, Offerhaus HL. Visualizing resonances in the complex plane with vibrational phase contrast coherent anti-Stokes Raman scattering. Anal Chem. 2010;82:7656–59. doi: 10.1021/ac101453s. [DOI] [PubMed] [Google Scholar]
- 70.Freudiger CW, Roeffaers MBJ, Zhang X, Saar BG, Min W, Xie XS. Optical heterodyne-detected Raman-induced Kerr effect (OHD-RIKE) microscopy. J Phys Chem B. 2011;115:5574–81. doi: 10.1021/jp1113834. [DOI] [PMC free article] [PubMed] [Google Scholar]
- 71.Shen YR. Surface properties probed by second-harmonic and sum-frequency generation. Nature. 1989;337:519–25. [Google Scholar]
- 72.Shen YR. Surfaces probed by nonlinear optics. Surf Sci. 1994;299:551–62. [Google Scholar]
- 73.Eisenthal KB. Liquid interfaces probed by second-harmonic and sum-frequency spectroscopy. Chem Rev. 1996;96:1343–60. doi: 10.1021/cr9502211. [DOI] [PubMed] [Google Scholar]
- 74.Eisenthal KB. Equilibrium and dynamic processes at interfaces by second harmonic and sum frequency generation. Annu Rev Phys Chem. 1992;43:627–61. [Google Scholar]
- 75.Walker RA, Conboy JC, Richmond GL. Molecular structure and ordering of phospholipids at a liquid-liquid interface. Langmuir. 1997;13:3070–73. [Google Scholar]
- 76.Liu J, Conboy JC. Direct measurement of the transbilayer movement of phospholipids by sum-frequency vibrational spectroscopy. J Am Chem Soc. 2004;126:8376–77. doi: 10.1021/ja048245p. [DOI] [PubMed] [Google Scholar]
- 77.Chen X, Tang H, Even MA, Wang J, Tew GN, Chen Z. Observing a molecular knife at work. J Am Chem Soc. 2006;128:2711–14. doi: 10.1021/ja057029t. [DOI] [PubMed] [Google Scholar]
- 78.Roke S. Nonlinear spectroscopy of bio-interfaces. Int J Mater Res. 2011;102:906–12. [Google Scholar]
- 79.Richmond GL. Molecular bonding and interactions at aqueous surfaces as probed by vibrational sum frequency spectroscopy. Chem Rev. 2002;102:2693–724. doi: 10.1021/cr0006876. [DOI] [PubMed] [Google Scholar]
- 80.Eisenthal KB. Second harmonic spectroscopy of aqueous nano- and microparticle interfaces. Chem Rev. 2006;106:1462–77. doi: 10.1021/cr0403685. [DOI] [PubMed] [Google Scholar]
- 81.Roke S, Gonella G. Nonlinear light scattering and spectroscopy of particles and droplets in liquids. Annu Rev Phys Chem. 2012;63:353–78. doi: 10.1146/annurev-physchem-032511-143748. [DOI] [PubMed] [Google Scholar]
- 82.Roke S, Roeterdink W, Wijnhoven J, Petukhov A, Kleyn A, Bonn M. Vibrational sum frequency scattering from a submicron suspension. Phys Rev Lett. 2003;91:258302. doi: 10.1103/PhysRevLett.91.258302. [DOI] [PubMed] [Google Scholar]
- 83.Cimatu KA, Baldelli S. Chemical microscopy of surfaces by sum frequency generation imaging. J Phys Chem C. 2009;113:16575–88. [Google Scholar]
- 84.Flörsheimer M, Brillert C, Fuchs H. Chemical imaging of interfaces by sum frequency microscopy. Langmuir. 1999;15:5437–39. [Google Scholar]
- 85.Kuhnke K, Hoffmann DMP, Wu XC, Bittner AM, Kern K. Chemical imaging of interfaces by sum-frequency generation microscopy: application to patterned self-assembled monolayers. Appl Phys Lett. 2003;83:3830–32. [Google Scholar]
- 86.Cimatu K, Baldelli S. Sum frequency generation microscopy of microcontact-printed mixed self-assembled monolayers. J Phys Chem B. 2006;110:1807–13. doi: 10.1021/jp0562779. [DOI] [PubMed] [Google Scholar]
- 87.Cimatu K, Baldelli S. Spatially resolved surface analysis of an octadecanethiol self-assembled monolayer on mild steel using sum frequency generation imaging microscopy. J Phys Chem C. 2007;111:7137–43. [Google Scholar]
- 88.Cimatu K, Moore HJ, Barriet D, Chinwangso P, Lee TR, Baldelli S. Sum frequency generation imaging microscopy of patterned self-assembled monolayers with terminal -CH3, -OCH3, -CF2CF3, -C=C, -phenyl, and -cyclopropyl groups. J Phys Chem C. 2008;112:14529–37. [Google Scholar]
- 89.Hoffmann DMP, Kuhnke K, Kern K. Sum-frequency generation microscope for opaque and reflecting samples. Rev Sci Instrum. 2002;73:3221–26. [Google Scholar]
- 90.Hernandez M, Chinwangso P, Cimatu K, Srisombat L, Lee TR, Baldelli S. Chemical imaging and distribution analysis of mono-, bi-, and tridentate alkanethiol self-assembled monolayers on gold by sum frequency generation imaging microscopy. J Phys Chem C. 2011;115:4688–95. [Google Scholar]
- 91.Nakai IF, Tachioka M, Ugawa A, Watanabe K, Matsumoto Y. Molecular structure and carrier distributions at semiconductor/dielectric interfaces in organic field-effect transistors studied with sum frequency generation microscopy. Appl Phys Lett. 2009;95:243304. [Google Scholar]
- 92.Wampler RD, Kissick DJ, Dehen CJ, Gualtieri EJ, Grey JL, et al. Selective detection of protein crystals by second harmonic generation. J Am Chem Soc. 2008;130:14076–77. doi: 10.1021/ja805983b. [DOI] [PMC free article] [PubMed] [Google Scholar]
- 93.Kissick DJ, Wanapun D, Simpson GJ. Second-order nonlinear optical imaging of chiral crystals. Annu Rev Anal Chem. 2011;4:419–37. doi: 10.1146/annurev.anchem.111808.073722. [DOI] [PMC free article] [PubMed] [Google Scholar]
- 94.Inoue K, Fujii M, Sakai M. Development of a non-scanning vibrational sum-frequency generation detected infrared super-resolution microscope and its application to biological cells. Appl Spectrosc. 2010;64:275–81. doi: 10.1366/000370210790918481. [DOI] [PubMed] [Google Scholar]
- 95.Kogure S, Inoue K, Ohmori T, Ishihara M, Kikuchi M, et al. Infrared imaging of an A549 cultured cell by a vibrational sum-frequency generation detected infrared super-resolution microscopy. Opt Express. 2010;18:13402–6. doi: 10.1364/OE.18.013402. [DOI] [PubMed] [Google Scholar]
- 96.Locharoenrat K, Sano H, Mizutani G. Demonstration of confocal sum frequency microscopy. Phys Stat Solidi C. 2009;6:304–6. [Google Scholar]
- 97.Barnette AL, Bradley LC, Veres BD, Schreiner EP, Park YB, et al. Selective detection of crystalline cellulose in plant cell walls with sum-frequency-generation (SFG) vibration spectroscopy. Biomacro-molecules. 2011;12:2434–39. doi: 10.1021/bm200518n. [DOI] [PubMed] [Google Scholar]
- 98.Hieu HC, Tuan NA, Li H, Miyauchi Y, Mizutani G. Sum frequency generation microscopy study of cellulose fibers. Appl Spectrosc. 2011;65:1254–59. doi: 10.1366/11-06388. [DOI] [PubMed] [Google Scholar]
- 99.Miyauchi Y, Sano H, Mirzutani G. Selective observation of starch in a water plant using optical sum-frequency microscopy. J Opt Soc Am A. 2006;23:1687–90. doi: 10.1364/josaa.23.001687. [DOI] [PubMed] [Google Scholar]
- 100.Li H, Miyauchi Y, Tuan NA, Mizutani G, Koyano M. Optical sum frequency generation image of rice grains. J Biomat Nanobiotechnol. 2012;3:286–91. [Google Scholar]
- 101.Campagnola PJ, Millard AC, Terasaki M, Hoppe PE, Malone CJ, Mohler WA. Three-dimensional high-resolution second-harmonic generation imaging of endogenous structural proteins in biological tissue. Biophys J. 2002;81:493–508. doi: 10.1016/S0006-3495(02)75414-3. [DOI] [PMC free article] [PubMed] [Google Scholar]
- 102.Walter SR, Geiger FM. DNA on stage: showcasing oligonucleotides at surfaces and interfaces with second harmonic and vibrational sum frequency generation. J Phys Chem Lett. 2010;1:9–15. [Google Scholar]
- 103.Fu L, Ma G, Yan ECY. In situ misfolding of human islet amyloid polypeptide at interfaces probed by vibrational sum frequency generation. J Am Chem Soc. 2010;132:5405–12. doi: 10.1021/ja909546b. [DOI] [PubMed] [Google Scholar]
- 104.Wanapun D, Kestur US, Kissick DJ, Simpson GJ, Taylor LS. Selective detection and quantitation of organic molecule crystallization by second harmonic generation microscopy. Anal Chem. 2010;82:5425–32. doi: 10.1021/ac100564f. [DOI] [PubMed] [Google Scholar]
- 105.Toth SJ, Madden JT, Taylor LS, Marsac P, Simpson GJ. Selective imaging of active pharmaceutical ingredients in powdered blends with common excipients utilizing two-photon excited ultraviolet fluorescence and ultraviolet-second order nonlinear optical imaging of chiral crystals. Anal Chem. 2012;84:5869–75. doi: 10.1021/ac300917t. [DOI] [PMC free article] [PubMed] [Google Scholar]
- 106.Mizutani G, Koyama T, Tomizawa S, Sano H. Distinction between some saccharides in scattered optical sum frequency intensity images. Spectrochim Acta A. 2005;62:845–49. doi: 10.1016/j.saa.2005.03.014. [DOI] [PubMed] [Google Scholar]
- 107.Evans CL, Potma EO, Puoris’haag M, Cote D, Lin C, Xie XS. Chemical imaging of tissue in vivo with video-rate coherent anti-Stokes Raman scattering (CARS) microscopy. Proc Natl Acad Sci USA. 2005;102:16807–12. doi: 10.1073/pnas.0508282102. [DOI] [PMC free article] [PubMed] [Google Scholar]
- 108.Saar BG, Freudiger CW, Reichman J, Michael SC, Holtom GR, Xie XS. Video-rate molecular imaging in vivo with stimulated Raman scattering. Science. 2010;330:1368–70. doi: 10.1126/science.1197236. [DOI] [PMC free article] [PubMed] [Google Scholar]
- 109.Henry F, Côté D, Randolph MA, Rust EAZ, Redmond RW, et al. Real-time in vivo assessment of the nerve microenvironment with coherent anti-Stokes Raman scattering microscopy. Plastic Reconstr Surg. 2009;123:S123–30. doi: 10.1097/PRS.0b013e318191c5b8. [DOI] [PubMed] [Google Scholar]
- 110.Huff TB, Shi Y, Yan Y, Wang H, Cheng JX. Multimodal nonlinear optical microscopy and applications to central nervous system. IEEE J Sel Top Quantum Electron. 2008;14:4–9. doi: 10.1109/JSTQE.2007.913419. [DOI] [PMC free article] [PubMed] [Google Scholar]
- 111.König K, Breunig HG, Bückle R, Kellner-Höfer M, Weinigel M, et al. Optical skin biopsies by clinical CARS and multiphoton fluorescence/SHG tomography. Laser Phys Lett. 2011;8:465–68. [Google Scholar]
- 112.Breunig HG, Bückle R, Kellner-Höfer M, Weinigel M, Lademann J, et al. Combined in vivo multiphoton and CARS imaging of healthy and disease-affected human skin. Microsc Res Techn. 2012;75:492–98. doi: 10.1002/jemt.21082. [DOI] [PubMed] [Google Scholar]
- 113.Parekh SH, Lee YJ, Aamer KA, Cicerone MT. Label-free cellular imaging by broadband coherent anti-Stokes Raman scattering microscopy. Biophys J. 2010;99:2695–704. doi: 10.1016/j.bpj.2010.08.009. [DOI] [PMC free article] [PubMed] [Google Scholar]
- 114.Hellerer T, Enejder AMK, Zumbusch A. Spectral focusing: high spectral resolution spectroscopy with broad-bandwidth laser pulses. Appl Phys Lett. 2004;85:25–27. [Google Scholar]
- 115.Pegoraro AF, Ridsdale A, Moffatt DJ, Jia Y, Pezacki JP, Stolow A. Optimally chirped multimodal CARS microscopy based on a single Ti:sapphire oscillator. Opt Express. 2009;17:2984–96. doi: 10.1364/oe.17.002984. [DOI] [PubMed] [Google Scholar]
- 116.Freudiger CW, Min W, Holtom GR, Xu B, Dantus M, Xie XS. Highly specific label-free molecular imaging with spectrally tailored excitation-stimulation Raman scattering (STE-SRS) microscopy. Nat Photonics. 2011;5:103–9. doi: 10.1038/nphoton.2010.294. [DOI] [PMC free article] [PubMed] [Google Scholar]
- 117.Lin CY, Suhalim JL, Nien C, Miljkovic M, Diem M, et al. Picosecond spectral coherent anti-Stokes Raman scattering (CARS) imaging with principal component analysis of meibomian glands. J Biomed Opt. 2011;16:021104. doi: 10.1117/1.3533716. [DOI] [PMC free article] [PubMed] [Google Scholar]
- 118.Bégin S, Burgoyne B, Mercier V, Villeneuve A, Vallée R, Côté D. Coherent anti-Stokes Raman scattering hyperspectral tissue imaging with a wavelength-swept system. Biomed Opt Express. 2011;2:1296–306. doi: 10.1364/BOE.2.001296. [DOI] [PMC free article] [PubMed] [Google Scholar]
- 119.Kim H, Bryant GW, Stranick SJ. Superresolution four-wave mixing microscopy. Opt Express. 2012;20:6042–51. doi: 10.1364/OE.20.006042. [DOI] [PubMed] [Google Scholar]
- 120.Beeker WP, Groβ P, Lee CJ, Cleff C, Offerhaus HL, et al. A route to sub-diffraction limited CARS microscopy. Opt Express. 2009;17:22632–38. doi: 10.1364/OE.17.022632. [DOI] [PubMed] [Google Scholar]
- 121.Beeker WP, Lee CJ, Boller KJ, Groβ P, Cleff C, et al. Spatially dependent Rabi oscillations: an approach to sub-diffraction limited coherent anti-Stokes Raman scattering microscopy. Phys Rev B. 2010;81:012507. [Google Scholar]
- 122.Walther TC, Farese RV., Jr Lipid droplets and cellular lipid metabolism. Annu Rev Biochem. 2012;81:687–714. doi: 10.1146/annurev-biochem-061009-102430. [DOI] [PMC free article] [PubMed] [Google Scholar]
- 123.Nan X, Potma EO, Xie XS. Nonperturbative chemical imaging of organelle transport in living cells with coherent anti-Stokes Raman scattering microscopy. Biophys J. 2006;91:728–35. doi: 10.1529/biophysj.105.074534. [DOI] [PMC free article] [PubMed] [Google Scholar]
- 124.Yamaguchi T, Omatsu N, Morimoto E, Nakashima H, Ueno K, et al. CGI-58 facilitates lipolysis on lipid droplets but is not involved in the vesculation of lipid droplets by hormonal stimulation. J Lipid Res. 2007;48:1078–89. doi: 10.1194/jlr.M600493-JLR200. [DOI] [PubMed] [Google Scholar]
- 125.Paar M, Jüngst C, Steiner NA, Magnes C, Sinner F, et al. Remodeling of lipid droplets during lipolysis and growth in adipocytes. J Biol Chem. 2012;287:11164–73. doi: 10.1074/jbc.M111.316794. [DOI] [PMC free article] [PubMed] [Google Scholar]
- 126.Le TT, Cheng JX. Single-cell profiling reveals the origin of phenotypic variability in adipogenesis. PLoS One. 2009;4:e5189. doi: 10.1371/journal.pone.0005189. [DOI] [PMC free article] [PubMed] [Google Scholar]
- 127.Potma EO, de Boeij WP, van Haastert PJM, Wiersma DA. Real-time visualization of intracellular hydrodynamics. Proc Natl Acad Sci USA. 2001;98:1577–82. doi: 10.1073/pnas.031575698. [DOI] [PMC free article] [PubMed] [Google Scholar]
- 128.Ibata K, Takimoto S, Morisaku T, Miyawaki A, Yasui M. Analysis of aquaporin-mediated diffusional water permeability by coherent anti-Stokes Raman scattering microscopy. Biophys J. 2011;101:2277–83. doi: 10.1016/j.bpj.2011.08.045. [DOI] [PMC free article] [PubMed] [Google Scholar]
- 129.Folick A, Min W, Wang MC. Label-free imaging of lipid dynamics using coherent anti-Stokes Raman scattering (CARS) and stimulated Raman scattering microscopy. Curr Opin Genet Dev. 2011;21:585–90. doi: 10.1016/j.gde.2011.09.003. [DOI] [PMC free article] [PubMed] [Google Scholar]
- 130.Chien CH, Chen WW, Wu JT, Chang YC. Label-free imaging of Drosophila in vivo by coherent anti-Stokes Raman scattering and two-photon excitation fluorescence microscopy. J Biomed Opt. 2011;16:016012. doi: 10.1117/1.3528642. [DOI] [PubMed] [Google Scholar]
- 131.Huff TB, Cheng JX. In vivo coherent anti-Stokes Raman scattering imaging of sciatic nerve tissues. J Microsc. 2007;225:175–82. doi: 10.1111/j.1365-2818.2007.01729.x. [DOI] [PMC free article] [PubMed] [Google Scholar]
- 132.Wang H, Fu Y, Zickmund P, Shi R, Cheng JX. Coherent anti-Stokes Raman scattering imaging of live spinal tissues. Biophys J. 2005;89:581–91. doi: 10.1529/biophysj.105.061911. [DOI] [PMC free article] [PubMed] [Google Scholar]
- 133.Huff TB, Shi Y, Sun W, Wu W, Shi R, Cheng JX. Real-time CARS imaging reveals a calpain-dependent pathway for paranodal myelin retraction during high-frequency stimulation. PLoS One. 2011;6:e17176. doi: 10.1371/journal.pone.0017176. [DOI] [PMC free article] [PubMed] [Google Scholar]
- 134.Fu Y, Wang H, Huff TB, Shi R, Cheng JX. Coherent anti-Stokes Raman scattering imaging of myelin degradation reveals a calcium-dependent pathway in lyo-PtdCho-induced demyelination. J Neurosci Res. 2007;85:2870–81. doi: 10.1002/jnr.21403. [DOI] [PMC free article] [PubMed] [Google Scholar]
- 135.Imitola J, Rasmussen S, Liu Y, Chitnis T, Khoury SJ, et al. Multimodal coherent anti-Stokes Raman scattering microscopy reveals microglia-associated myelin and axonal dysfunction in multiple sclerosis-like lesions in mice. J Biomed Opt. 2011;16:021109. doi: 10.1117/1.3533312. [DOI] [PMC free article] [PubMed] [Google Scholar]
- 136.Evans CL, Xu X, Kesari S, Xie XS, Wong STC, Young GS. Chemically-selective imaging of brain structures with CARS microscopy. Opt Express. 2007;15:12076–87. doi: 10.1364/oe.15.012076. [DOI] [PubMed] [Google Scholar]
- 137.Fu Y, Huff TB, Wang HW, Wang H, Cheng JX. Ex vivo and in vivo imaging of myelin fibers in mouse brain by coherent anti-Stokes Raman scattering microscopy. Opt Express. 2008;16:19396–409. doi: 10.1364/oe.16.019396. [DOI] [PMC free article] [PubMed] [Google Scholar]
- 138.Meyer T, Bergner N, Bielecki C, Krafft C, Akimov D, et al. Nonlinear microscopy, infrared, and Raman microspectroscopy for brain tumor analysis. J Biomed Opt. 2011;16:021113. doi: 10.1117/1.3533268. [DOI] [PubMed] [Google Scholar]
- 139.Balu M, Liu G, Chen Z, Tromberg BJ, Potma EO. Fiber delivered probe for efficient CARS imaging of tissues. Opt Express. 2010;18:2380–88. doi: 10.1364/OE.18.002380. [DOI] [PMC free article] [PubMed] [Google Scholar]
- 140.Saar BG, Johnston RS, Freudiger CW, Xie XS, Seibel EJ. Coherent Raman scattering fiber endoscopy. Opt Lett. 2011;36:2396–98. doi: 10.1364/OL.36.002396. [DOI] [PMC free article] [PubMed] [Google Scholar]