

Abstract
Despite evidence of adverse health effects resulting from exposure to manganese (Mn), biomarkers of exposure are poorly understood. To enhance understanding, mean blood Mn (MnB) and mean air Mn (MnA) were extracted from 63 exposure groups in 24 published papers, and the relationship was modeled using segmented regression. On a log/log scale, a positive association between MnA and MnB was observed among studies reporting MnA concentrations above about 10 μg/m3, although interpretation is limited by largely cross-sectional data, study design variability, and differences in exposure monitoring methods. Based on the results of the segmented regression, we hypothesize that below the concentration of about 10 μg/m3, Mn in the body is dominated by dietary Mn, and additional inhaled Mn only causes negligible changes in Mn levels unless the inhaled amount is substantial. However, stronger study designs are required to account for temporal characteristics of the MnA to MnB relationships which reflect the underlying physiology and toxicokinetics of Mn uptake and distribution. Thus, we present an inception cohort study design we have conducted among apprentice welders, and the analytical strengths this study design offers. To determine if blood could be a useful biomarker for Mn to be utilized by industrial hygienists in general industry requires additional time-specific analyses, which our inception cohort study design will allow.
Key terms: Biomarkers of exposure, Exposure assessment, Manganese, Occupational Health, Welding
INTRODUCTION
Manganese (Mn) is a naturally occurring trace element essential for development and function of the brain, and other biological systems and processes (1). Mn is common in the human diet, from foods such as pineapple, whole grains, dark leafy greens, legumes, nuts and seeds, and multivitamins (2). The dietary Mn intake for adults is estimated to range between 0.9 to 10 mg/day, with the estimated safe and adequate dietary intake (ESADDI) establied by the U.S. National Research Council being 2.3 mg/day for men, and 1.8 mg/day for women(3). However, only 1–5% of orally ingested Mn is absorbed into the blood; a level that is tightly regulated based on concentration of Mn in the diet, with less Mn absorbed into the blood when more Mn has been ingested (4). Mn exposure can also occur through inhalation of airborne Mn, although exposure via ambient air sources is estimated to be less than 2 μg Mn/day for an average person (4).
With Mn uptake from dietary sources so tightly regulated in the body, and ambient environmental exposures generally low, elevated exposures most often occur from inhalation in occupational settings, including manganese ore processing (5), ferroalloy production (6–8), and of particular interest to this study, welding (9–11). Excessive exposure to Mn can result in adverse health effects including neurological, pulmonary, reproductive, and developmental toxicity (12, 13). Chronic elevated exposures to Mn have been implicated in the development of a parkinsonian syndrome called “manganism”, and even workers with considerably lower Mn exposures than those associated with manganism have demonstrated mild Parkinsonian signs (14–17).
In welding shops, mean personal breathing zone concentrations of Mn range from 0.04 mg/m3 to over 2.0 mg/m3 (10, 18–24). Hobson et al. (25) have summarized the published literature on Mn exposures among welders in multiple industries, and showed that welding type, degree of enclosure, and use of ventilation can be used to predict exposure levels. Small sample sizes and absence of repeated measurements in most studies prevent a thorough analysis of exposure variability, which may be high given the dynamic nature of welding work.
Particle size is an important determinant of metal fume deposition in the respiratory tract, and therefore of potential health effects and absorption (9, 26). Inhaled Mn can be deposited in the nasopharyngeal airways (and may reach the brain through direct olfactory transport), the trachea-bronchial region (and mostly swallowed, entering the gastrointestinal tract), or the alveolar or pulmonary region of the respiratory tract (27). For those particles deposited in the alveolar or pulmonary region, time and method of uptake into body fluids is further dependent on Mn oxidation state, particle solubility, and particle concentration among other properties (27, 28).
Consequently, quantitative estimation of workers’ exposure and dose of Mn, and subsequent evaluation of exposure-related health effects remains problematic when solely using traditional air monitoring for exposure assessment. Biomarkers have been investigated as an alternative way to characterise acute and cumulative Mn exposure. The purpose of this paper is twofold: (1) To review the current body of literature with respect to blood as a biomarker for Mn exposure, and describe in detail quantitative relationships between MnA and MnB that have been previously reported in the literature; and (2) to describe the design of our current inception cohort study characterizing the relationship between MnA and MnB, and suggest analyses possible with these data.
METHODS
A variety of tissues and fluids have been proposed as media for biomarkers to evaluate Mn exposure, including short-term biomarkers of exposure such as serum (16, 29–31), plasma (14, 32), urine (5, 19, 30), and saliva (24), and long-term biomarkers such as brain tissue (evaluated via magnetic resonance imaging) (33, 34), toenails (35), and hair (7, 36). Mn in whole blood is the most commonly used short-term biomarker, but literature presents mixed results. Thus, its validity demands further evaluation, and is therefore the focus of this literature-based analysis.
A literature search was conducted in PubMed (NCBI) using the search string manganese AND exposure AND blood AND air. Results were restricted to human studies published in English, with no restrictions made on year of publication. Because the relationship between MnA and MnB was the basis of this review, only peer-reviewed articles that presented MnA values in addition to MnB measurements on humans were included; those studies only including biomarkers other than whole blood were excluded. Bowler et al. (37) was the only study presenting modeled exposure estimates based on historical air emissions data, and the only study of environmental exposures, whereas all other studies utilised traditional stationary or personal sampling in an occupational setting. In total, 29 studies met our criteria, and are summarized in Table 1.
TABLE I.
Summary of studies comparing MnA and MnB from the literature
| Reference | Setting | Exposure Groups | Significant MnB difference by group | Significant MnB and MnA correlation |
|---|---|---|---|---|
| Lauwerys et al. 1985(49) | Mn salt/oxide mfg | 2 | Yes | NA |
| Roels et al. 1987 (5) | Mn salt/oxide mfg | 12 | Yes | No |
| Jarvisalo et al. 1992 (30) | Shipyard Welders | 2 | Yes | No |
| Roels et al. 1992 (50) | Battery mfg | 2 | Yes | No |
| Chia et al. 1993 (29) | Mn ore | 2 | No | NA |
| Mergler et al. 1994 (51) | Ferroalloy plant | 2 | Yes | NA |
| Loranger & Zayed 1995 (31) | Garage workers | 2 | No | NA |
| Lucchini et al. 1995 (41) | Ferroalloy plant | 3 | Yes | Yes, R2 = 0.36 |
| Lucchini et al. 1997 (42) | Ferroalloy plant | 2 | Yes | Yes, R2 = 0.27 |
| Lucchini et al. 1999 (43) | Ferroalloy plant | 2 | Yes | Yes, R2 = 0.13 |
| Bader et al. 1999 (36) | Battery plant | 4 | Yes | Yes * |
| Lander et al. 1999 (38)1 | Foundries, scrap metal plant | 5 | Yes | NA |
| Kim et al. 1999 (20) | Mn mfg | 3 | No | NA |
| Apostoli et al. 2000 (6) | Ferroalloy plant | 2 | Yes | Yes, R2 = 0.11 |
| Myers et al. 2003a (16) | Mn smelting | 2 | Yes | Yes* |
| Myers et al. 2003b††(52) | Mn mine | 2 | NA | No |
| Ellingsen et al. 2003 (53) | Ferroalloy plant | 2 | Yes | No |
| Yuan et al. 2006** (44) | Welders | 2 | Yes | NA |
| Ellingsen et al. 2006 (19) | Welders | 2 | Yes | Yes, R2 = 0.10 |
| Wang et al. 2006 (40) | Welders | 2 | No | NA |
| Bowler et al. 2007 (14) | Welders | 1 | -- | NA |
| Jiang et al. 2007** (34) | Ferroalloy/smelter | 3 | No | NA |
| Smith et al. 2007 (8) | Ferroalloy plant | 3 | Yes*** | Yes† |
| Chang et al. 2010 (54) | Welders | 2 | Yes | NA |
| Bowler et al. 2012 (37) | Community | 2 | No | NA |
| Pesch et al. 2012 (47) | Welders | 1 | -- | No |
|
| ||||
| Excluded from analysis | ||||
|
| ||||
| Deschamps et al. 2001 (39) | Enamels mfg | 2 | No | NA |
| Grass et al. 2010 (32) | Subway workers | 3 | No | No |
| Laohaudomchok et al. 2011(35) | Welders | 1 | -- | No |
NA means author did not look at this measure; -- means the measure doesn’t apply because study had only 1 exposure group
Only on the group, not individual, level. Other studies refer to individual level correlations.
Outliers; excluded from figure 1B
Significant difference between high and both low and moderate group, no difference between low and moderate
R2=0.27 in low exposure group, R2=0.08 in medium exposure group, no significant correlation in high group
Personal communication with author for information on exposed and unexposed groups, presented as one group in publication
Twenty-five of the 29 studies included compared MnB between a Mn exposed group and an unexposed control group. Most studies reported significant differences between the unexposed and exposed groups, although Lander et al. (38) only found significant differences between the unexposed group and two of the four workplaces considered exposed, and eight studies found no difference between the exposed and control groups (20, 29, 31, 32, 34, 37, 39, 40). Even in studies that did find significant differences between exposed and reference groups, highly overlapping MnB distributions were observed. For example, Bader et al. (36) found a significant difference in MnB levels between three exposure groups and the controls, but concluded that MnB alone did not allow classification into MnA groups due to the high degree of variability in MnB between groups.
Of the 29 papers included in this review, 13 (45%) did not explicitly explore the relationship between MnA and MnB on either the group or individual level. Of the 16 (55%) studies that did assess this relationship, eight found no relationship, and eight found some relationship, though the strength and nature vary considerably. In the literature, association was evaluated with a variety of techniques, but R2 is presented for consistency, whether it comes from a correlation study or a regression analysis. Smith et al. (8) stratified data into three groups based on MnA and found slight (but statistically significant) relationships between individual MnB and MnA values in the low and moderate MnA exposure groups (R2 = 0.27 and 0.08, respectively), but no significant correlation in the high MnA exposure group (R2 = 0.04). However, by fitting regression models to three exposure groups of restricted ranges instead of considering the entire range of MnA, these group relationships may just be an artifact of how the data were reported. Both Bader et al. (36) and Meyers et al. (16) found significant differences in MnB between groups based on group mean air exposures; no significant correlation was present at the individual level. In separate studies carried out at the same ferroalloy plant, Lucchini et al. (41, 42) found a significant relationship between log MnB and a log-transformed cumulative exposure index (CEI) based on respirable Mn (R2 = 0.36 and 0.27, respectively). A third Lucchini et al. (43) study at the same ferroalloy plant did not find a relationship between MnB and a CEI, though did report a significant relationship on the individual level between log MnA and log MnB; however, with a reported R2 value of 0.13, very little of the variability in MnB measured is explained by MnA. Apostoli et al. (6) and Ellingsen et al. (19) also reported slight but significant relationships between MnA and MnB on the individual level, with reported R2 values of 0.11 and 0.10, respectively. From the variety of results presented in these 29 studies, it is clear there is only weak evidence of increasing MnB with increasing MnA, and no consensus on the validity of MnB as a biomarker of Mn exposure emerges.
To summarize the relationships between MnA and MnB across the totality of these studies, reported mean MnA values were plotted against reported mean MnB values for all exposure groups (including control populations) for 26 of the 29 studies summarized in Table 1 (Figure 1A). Studies reporting only respirable MnA data (32, 35, 39) were not included in the analysis, but those reporting inhalable MnA data were included, as inhalable Mn approximates Mn found in total dust. When arithmetic mean values were not presented in the text, and conversion from geometric means or medians to arithmetic means was not possible (e.g. no geometric standard deviation was presented with the geometric mean), either the median or geometric mean (whichever was presented in the text) was plotted as a comparable measure of central tendency. For studies with multiple exposure groups (e.g. high, medium, low), all groups are presented separately on the figure. Generally, MnA values were not given for unexposed groups included as a control in a study, and thus were assigned zero exposure.
FIGURE 1.

Group-based relationships between mean MnA and mean MnB from the literature on (A) native scale; and (B) log transformed with outliers removed
A total of 68 exposure groups from these 26 studies were plotted, with studies of welders denoted with an open circle (Figure 1A). Preliminary mean MnB and MnA values from our welder study described in the discussion section of this paper were also plotted, for a total of 69 exposure groups. To provide better resolution of the relationship at the low end of air exposure, we excluded apparent MnB outliers, log transformed both the air and blood Mn levels, and replotted the results as a log-log plot. Air levels assumed to be 0 were assigned the value of 0.01 μg/m3 so log transformation would be possible. Four outliers with reported MnB levels above 40 μg/L from two studies (34, 44) were removed, along with their control groups. These removed values were more than three standard deviations higher than the mean MnB value in this analysis, and noticeably higher than the range of MnB values for both exposed and unexposed populations presented in the literature, leading us to believe these data may have been compromised by laboratory error or sources of external contamination
To quantify the resulting relationship between MnA and MnB, a segmented regression was computed which fit two lines with an inflection point (using Stata function NL for nonlinear least-squares estimation). As each point in our analysis represents an average value computed from a varying number of points, we weighted the points using analytic weights based on the number of blood samples represented by the mean values. The estimated lines are plotted on Figure 1B for the whole group (n=64 exposure groups) and for non-welder studies (n=50 exposure groups) separately. Diameters of the circles are scaled to be proportional to the number of samples included in the estimate. The point representing preliminary data from our welder study described in the discussion section of the paper is the largest open circle, positioned at the base of the dashed regression line for welders, representing a mean MnA of 46.1 μg/m3, and mean MnB of 8.5 μg/L from 534 air samples and 998 blood samples, taken April 2011 – December 2012.
RESULTS
Results from the segmented regression analysis are presented in Table 2. When considering all studies, the inflection point fit between the two lines was 2.48 (95% CI: −1.22, 6.19) ln(μg/m3), and 4.36 (95% CI: 2.05, 6.68) ln(μg/m3) when considering only non-welder studies. When considering both all studies and only non-welder studies, the 1st segment was found to be consistent with a zero slope (p=0.92 and 0.57, respectively). However, above the inflection point, both sets of data had slopes significantly different from zero, as is shown in Table 2. As no welder studies included in this analysis have air exposure values below the inflection point calculated for all studies, exposed groups from welder studies (n=8 groups) were fit with a simple linear regression and the result is plotted separately on Figure 1B. The weighted mean MnB for unexposed groups in welder studies was 2.36 (n=6 group). The point where the fit regression line for the welders would intersect with this background level is at a value of 1.69 ln(μg/m3) (95% CI: 1.22, 2.15). The slope for the exposed groups in welders-only studies was 0.291 ln(μg/L)/ln(μg/m3) (95% CI: 0.85, 0.498) which is higher than, though not statistically significantly different from, the 2nd segment slope for non-welders, which was 0.142 ln(μg/L)/ln(μg/m3) (95% CI: 0.042, 0.239). The R2 value for the segmented regression is 0.34 considering all points, whereas a simple weighed linear regression model yields a lower R2 of 0.25, indicating a better fit to the data when segmented regression was used.
TABLE II.
Segmented regression models for literature-based analysis
| All Studies | Non-Welder Studies | Welder Studies | ||||
|---|---|---|---|---|---|---|
|
| ||||||
| Estimate (CI) | p value | Estimate (CI) | p value | Estimate (CI) | p value | |
|
|
|
|
||||
| Inflection point* | 2.48 (−1.22, 6.19) | -- | 4.36 (2.05, 6.68) | -- | NA | NA |
| 1st segment slope** | −0.003 (−0.051, 0.046) | 0.92 | 0.009 (−0.022, 0.039) | 0.57 | NA | NA |
| 2nd segment slope** | 0.098 (0.043, 0.152) | 0.001 | 0.142 (0.042, 0.239) | 0.006 | 0.291 (0.85, 0.498) | 0.014 |
presented in units of ln(μg/m3)
presented in units of ln(μg/L)/ln(μg/m3)
p value not presented for inflection point as it is not relevent
DISCUSSION
The literature-based analysis allowed us to explore the linear and non-linear relationship between MnB and MnA over a variety of exposure levels from different environments. While in our preliminary analysis we did not find a correlation between reported mean MnA and MnB values, after log transforming both variables for greater resolution over all scales, removing clear outliers, using analytical weights by sample size (for MnB), and fitting a segmented regression, we showed that a positive association exists between air exposure levels and MnB for MnA concentrations of approximately 10 μg/m3 and above. This analysis suggests there may be a degree of exposure above which Mn levels in the blood begin to act as an exposure biomarker for inhaled Mn.
From our literature-based analysis, we found the inflection point for Mn exposure to be around 10 μg/m3. To assess the potential contribution to MnB from this level of exposure, we made a simple calculation as follows. Assuming a worker doing moderate intensity work breathes 13 m3 of air contaminated with 10 μg Mn/m3 over an 8 hour work day (45), the corresponding work day potential dose, assuming a 100% uptake from the lung into the blood, would be 130 μg, or 0.026 μg/mL (26 μg/L) (assuming 5 L of blood in the average adult) (46). If even only 5% of inhaled Mn passes into the blood, it would produce a 1.3 μg/L concentration increase, which when compared to the weighted mean MnB in unexposed groups (8.16 μg/L) would be a noticeable and detectable increase. Thus, we speculate that airborne exposures above 10 μg/m3 are in the range in which they could begin making a substantial contribution to blood concentration and body burden.
Our literature-based analysis represents the first time a non-linear relationship between MnB and MnA has been quantified to suggest a threshold below which one would not expect to see inhaled exposure reflected in MnB. Our findings are consistent with what Pesch et al. (47) found in their welder data, as they commented that there seemed to be no obvious correlation between MnB and respirable MnA below approximately 50–100 μg/m3, but above this a positive relationship was observed, although the specific inflection point or slope was not provided. One study which did not meet our inclusion criteria for the literature analysis is from Cowan et al. (7), who evaluated the relationship between MnA and Mn in erythrocytes, reporting a significant correlation (R2=0.47), though whole blood Mn was not evaluated in this cross-sectional study.
Consistent with the majority of studies presented, this analysis was cross-sectional and did not address the temporal relationships between air exposures and blood biomonitoring or the duration of exposure prior to monitoring. As no study reported baseline (pre-exposure) MnB levels, it is impossible to know how much of the MnB value is related to concurrent or recent exposure, and how much may be related to previous exposures or individual physiological factors.
Limitations of Available Literature
The overwhelming majority of studies included in this analysis are of cross-sectional design, and the three longitudinal studies were conducted over short time periods, with Laohaudomchok et al. (35) and Roels et al. (5) taking blood samples pre- and post-shift on the same day, and Lander et al. (38) taking a single follow-up blood measurement one month post-exposure. No studies account for inter-individual variability in exposure by making repeat measurements over time, and similarly no studies have baseline measures of workers prior to exposure. Six studies (21%) use strictly stationary measures of environmental exposure which do not account for the dynamic nature of manufacturing processes that vary at an individual level, and a stationary sample was often administered for less than a full shift (36, 38). Similarly, many studies that used personal air monitoring did not monitor all (or any) of the exposed workers who gave blood samples, making individual comparisons between the two measures less meaningful (14, 30).
Many studies did not specify when the blood sample was taken in relation to the air sampling, but those that did, were over a variety of time scales. The time course for uptake of inhaled Mn from the lung into the blood is dependent on many factors, including the Mn oxidation state, particle size distribution, and particle concentration, all of which vary between occupational and environmental settings. By not considering the temporal relationship between air exposure and expression in blood, correlations (either positive or negative) between MnB and MnA are less meaningful and applicable.
These limitations are common to many of the reported studies, and a stronger study design that addresses these limitations would improve the understanding of a relationship between MnA and MnB. An ideal and novel study design would: (1) be a longitudinal cohort study with repeat measurements over a more substantial period of time; (2) include baseline measurements before workers become exposed; (3) ensure air and blood samples are taken at appropriately aligned time periods on the same worker for accurate individual-level comparisons; (4) administer personal full-shift sampling repeatedly, as opposed to stationary sampling, to reflect the dynamic nature of manufacturing work and inter-individual variability in exposure; and (5) be able to explore the time course from very short to long-term accumulation to determine what previous time period the measured MnB values represent. Our current study incorporates the elements listed above to address the limitations inherent in previous studies, and is described below.
Current Study Design
We are conducting an inception cohort study among welder trainees at a technical college in Washinton State. Students typically enter the traineeship with no prior welding experience. The welding traineeship consists of five academic quarters, where students progress through a schedule of different welding processes, generally in the order of: oxyacetylene, SMAW (shielded metal arc welding), FCAW (flux core arc welding, encompassing both dual shield and inner shield), GMAW (gas metal arc welding), and GTAW (gas tungsten arc welding). After 21 months of data collection (April 2011—December 2012), 53 subjects had been enrolled in the study (43 in their first quarter of study, 10 in a later quarter of study). Figure 2 shows preliminary MnA levels by welding type for these subjects over the 21 month period. Data collection has continued through June 2013, although no additional subjects were recruited.
FIGURE 2.

Measured MnA concentration by weld type in inception cohort study of apprentice welders
Subjects are asked to provide blood and urine samples eight times over four days during each academic quarter, and are fitted with a personal air pump on these days. Upon entry into the study, and at the end of each quarter, subjects complete two neurological function tests and give a hair sample (Figure 3). Students complete a daily questionnaire at the end of each sampling day to assess their workplace characteristics and confounding exposures. All study protocols were reviewed and approved by the University of Washington Institutional Review Board and subjects provided written informed consent.
FIGURE 3.
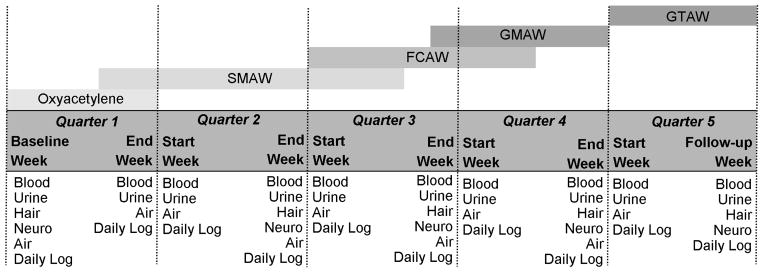
Inception cohort study design of apprentice welders
Trainees progress through the welding program in the order indicated: Oxyacetylene, SMAW (shielded metal arc welding, or stick), FCAW (flux core arc welding, encompassing inner and dual shield), GMAW (gas metal arc welding, or MIG), and GTAW (gas tungsten arc welding, or TIG). The baseline measurement occurs the morning of trainees first day in the program. With the exception of the follow-up week at the end of quarter 5, each week blood and urine sampling occurs both Monday and Friday, in both the morning and afternoon, for a total of 4 samples a week, and 8 samples a quarter.
The longitudinal study design with apprentice welders which we describe here is the first to examine blood as a biomarker of Mn with an inception cohort study design, incorporating a pre-exposure baseline measurement. Our longitudinal study design allows us to investigate the time between exposure and blood uptake of Mn by using exposure time windowing. In forthcoming analyses we plan to use all blood values for an individual to determine which preceding time period of exposure best predicts MnB. Moreover, because we have baseline blood measurements, we can accurately track individual changes in MnB over time, and assess how those changes relate to estimated cumulative exposures, in order to assess the role of inter-individual variability in Mn pharmacokinetics.
Another strength of our study design is that it greatly reduces the possible healthy worker survivor bias (HWSE). Applebaum et al.(48) found that HWSE could be reduced by including more incident hires than prevalent hires in workplace-based studies. With our inception cohort consisting of incident hires, HWSE is greatly reduced in our study, while this bias is likely present to a greater degree in the other studies considered in our literature-based analysis relying largely on prevalent hires.
CONCLUSIONS
Environmental exposures to Mn are typically well below the threshold we calculated in our literature-based analysis, above which we found MnB is associated with MnA. The primary effect we observed was present at higher levels of exposure, such as those seen among ferroalloy and Mn smelting operations, and production of Mn-containing minerals. Welders typically have intermediate levels of Mn exposures—in the range of 10 – 200 μg/m3, depending on the type of welding and degree to which they work in enclosed or confined spaces. The majority of the MnA exposures we observed in our study of welders in training are on the lower end of this range of concentrations, though still well above typical environmental concentrations, making the time-specificity of our models crucial for identifying a relationship. However, chronic Mn exposure, even at these low levels, has been linked to adverse neurological outcomes (14–16), making accurate assessment of Mn exposure a relevant public health issue. It is critical to better elucidate the pharmacokinetics of Mn in humans, so biomarkers of exposure can be meaningfully interpreted in environmental and occupational settings.
Our literature-based analysis suggests there is a point above which Mn levels in the blood begin to act as an exposure biomarker for inhaled Mn. We hypothesize that below this concentration Mn in the body is dominated by dietary Mn, and additional inhaled Mn only causes negligible changes in MnB levels. At higher exposure levels, there is enough inhaled Mn to noticeably increase MnB levels, though the limitations of these data require additional and more detailed studies before we can develop definitive physiological explanations. Therefore, we describe a longitudinal study with apprentice welders that is the first to examine blood as a biomarker of Mn with an inception cohort study design, incorporating a pre-exposure baseline measurement. This unique study design will allow us to better explore the pharmacokinetics of inhaled Mn, and how MnB relates to MnA while accounting for inter-individual variability and timing between exposure and biomarker sampling.
The pharmacokinetics of inhaled Mn will need to be better understood for blood to serve as a meaningful biomarker of inhaled Mn. Mn solubility is dependent on the oxidation state and chemical form of Mn, the concentration of Mn, and the particle size, amongst other factors. Because the oxidation state and particle size distribution of Mn varies between different environmental and occupational exposures, the dissolution time and bioavailability of Mn will likewise vary. Only when the time course between exposure to Mn and blood uptake is resolved can the exposure-biomarker data be meaningfully interpreted, and our inception cohort study design will allow us to be able to explore this time course more thoroughly than previous publications.
Acknowledgments
The authors thank the welders and staff at Renton Technical College, Renton, WA, without whom this study would not have been possible. The authors acknowledge the University of Washington Environmental Health Laboratory for analysis of biological and air samples and Michelle Eisen for help with data collection and analysis. Research reported in this publication was supported by the National Institute of Environmental Health Sciences of the National Institutes of Health Under award number R01ES017809. The content is solely the responsibility of the authors and does not necessarily represent the official views of the National Institutes of Health.
References
- 1.Elder A, Gelein R, Silva V, Feikert T, Opanashuk L, Carter J, et al. Translocation of inhaled ultrafine manganese oxide particles to the central nervous system. Environ Health Perspect. 2006;114(8):1172–1178. doi: 10.1289/ehp.9030. [DOI] [PMC free article] [PubMed] [Google Scholar]
- 2.USDA. USDA National Nutrient Database for Standard Reference, Release 25. 2012 [Google Scholar]
- 3.Greger JL. Dietary standards for manganese: overlap between nutritional and toxicological studies. J Nutr. 1998;128(2 Suppl):368S–371S. doi: 10.1093/jn/128.2.368S. [DOI] [PubMed] [Google Scholar]
- 4.Aschner M, Erikson KM, Dorman DC. Manganese dosimetry: species differences and implications for neurotoxicity. Crit Rev Toxicol. 2005;35(1):1–32. doi: 10.1080/10408440590905920. [DOI] [PubMed] [Google Scholar]
- 5.Roels H, Lauwerys R, Genet P, Sarhan MJ, de Fays M, Hanotiau I, et al. Relationship between external and internal parameters of exposure to manganese in workers from a manganese oxide and salt producing plant. Am J Ind Med. 1987;11(3):297–305. doi: 10.1002/ajim.4700110307. [DOI] [PubMed] [Google Scholar]
- 6.Apostoli P, Lucchini R, Alessio L. Are current biomarkers suitable for the assessment of manganese exposure in individual workers? Am J Ind Med. 2000;37(3):283–290. doi: 10.1002/(sici)1097-0274(200003)37:3<283::aid-ajim6>3.0.co;2-e. [DOI] [PubMed] [Google Scholar]
- 7.Cowan DM, Fan Q, Zou Y, Shi X, Chen J, Aschner M, et al. Manganese exposure among smelting workers: blood manganese-iron ratio as a novel tool for manganese exposure assessment. Biomarkers. 2009;14(1):3–16. doi: 10.1080/13547500902730672. [DOI] [PMC free article] [PubMed] [Google Scholar]
- 8.Smith D, Gwiazda R, Bowler R, Roels H, Park R, Taicher C, et al. Biomarkers of Mn exposure in humans. Am J Ind Med. 2007;50(11):801–811. doi: 10.1002/ajim.20506. [DOI] [PubMed] [Google Scholar]
- 9.Antonini JM. Health effects of welding. Crit Rev Toxicol. 2003;33(1):61–103. doi: 10.1080/713611032. [DOI] [PubMed] [Google Scholar]
- 10.Harris MK, Ewing WM, Longo W, DePasquale C, Mount MD, Hatfield R, et al. Manganese exposures during shielded metal arc welding (SMAW) in an enclosed space. J Occup Environ Hyg. 2005;2(8):375–382. doi: 10.1080/15459620591007736. [DOI] [PubMed] [Google Scholar]
- 11.Meeker JD, Susi P, Flynn MR. Manganese and welding fume exposure and control in construction. J Occup Environ Hyg. 2007;4(12):943–951. doi: 10.1080/15459620701718867. [DOI] [PubMed] [Google Scholar]
- 12.Aschner M, Dorman DC. Manganese: pharmacokinetics and molecular mechanisms of brain uptake. Toxicol Rev. 2006;25(3):147–154. doi: 10.2165/00139709-200625030-00002. [DOI] [PubMed] [Google Scholar]
- 13.Frumkin H, Solomon G. Manganese in the U.S. gasoline supply. Am J Ind Med. 1997;31(1):107–115. doi: 10.1002/(sici)1097-0274(199701)31:1<107::aid-ajim16>3.0.co;2-6. [DOI] [PubMed] [Google Scholar]
- 14.Bowler RM, Roels HA, Nakagawa S, Drezgic M, Diamond E, Park R, et al. Dose-effect relationships between manganese exposure and neurological, neuropsychological and pulmonary function in confined space bridge welders. Occup Environ Med. 2007;64(3):167–177. doi: 10.1136/oem.2006.028761. [DOI] [PMC free article] [PubMed] [Google Scholar]
- 15.Mergler D. Neurotoxic effects of low level exposure to manganese in human populations. Environ Res. 1999;80(2 Pt 1):99–102. doi: 10.1006/enrs.1998.3902. [DOI] [PubMed] [Google Scholar]
- 16.Myers JE, Thompson ML, Ramushu S, Young T, Jeebhay MF, London L, et al. The nervous system effects of occupational exposure on workers in a South African manganese smelter. Neurotoxicology. 2003;24(6):885–894. doi: 10.1016/S0161-813X(03)00081-0. [DOI] [PubMed] [Google Scholar]
- 17.Racette BA, Criswell SR, Lundin JI, Hobson A, Seixas N, Kotzbauer PT, et al. Increased risk of parkinsonism associated with welding exposure. Neurotoxicology. 2012;33(5):1356–1361. doi: 10.1016/j.neuro.2012.08.011. [DOI] [PMC free article] [PubMed] [Google Scholar]
- 18.Choi DS, Kim EA, Cheong HK, Khang HS, Ryoo JW, Cho JM, et al. Evaluation of MR signal index for the assessment of occupational manganese exposure of welders by measurement of local proton T1 relaxation time. Neurotoxicology. 2007;28(2):284–289. doi: 10.1016/j.neuro.2006.05.020. [DOI] [PubMed] [Google Scholar]
- 19.Ellingsen DG, Dubeikovskaya L, Dahl K, Chashchin M, Chashchin V, Zibarev E, et al. Air exposure assessment and biological monitoring of manganese and other major welding fume components in welders. J Environ Monit. 2006;8(10):1078–1086. doi: 10.1039/b605549d. [DOI] [PubMed] [Google Scholar]
- 20.Kim Y, Kim KS, Yang JS, Park IJ, Kim E, Jin Y, et al. Increase in signal intensities on T1-weighted magnetic resonance images in asymptomatic manganese-exposed workers. Neurotoxicology. 1999;20(6):901–907. [PubMed] [Google Scholar]
- 21.Korczynski RE. Occupational health concerns in the welding industry. Appl Occup Environ Hyg. 2000;15(12):936–945. doi: 10.1080/104732200750051175. [DOI] [PubMed] [Google Scholar]
- 22.Li GJ, Zhang LL, Lu L, Wu P, Zheng W. Occupational exposure to welding fume among welders: alterations of manganese, iron, zinc, copper, and lead in body fluids and the oxidative stress status. J Occup Environ Med. 2004;46(3):241–248. doi: 10.1097/01.jom.0000116900.49159.03. [DOI] [PMC free article] [PubMed] [Google Scholar]
- 23.Lu L, Zhang LL, Li GJ, Guo W, Liang W, Zheng W. Alteration of serum concentrations of manganese, iron, ferritin, and transferrin receptor following exposure to welding fumes among career welders. Neurotoxicology. 2005;26(2):257–265. doi: 10.1016/j.neuro.2004.09.001. [DOI] [PMC free article] [PubMed] [Google Scholar]
- 24.Wang D, Du X, Zheng W. Alteration of saliva and serum concentrations of manganese, copper, zinc, cadmium and lead among career welders. Toxicol Lett. 2008;176(1):40–47. doi: 10.1016/j.toxlet.2007.10.003. [DOI] [PMC free article] [PubMed] [Google Scholar]
- 25.Hobson A, Seixas N, Sterling D, Racette BA. Estimation of particulate mass and manganese exposure levels among welders. Ann Occup Hyg. 2011;55(1):113–125. doi: 10.1093/annhyg/meq069. [DOI] [PMC free article] [PubMed] [Google Scholar]
- 26.Antonini JM, Taylor MD, Zimmer AT, Roberts JR. Pulmonary responses to welding fumes: role of metal constituents. J Toxicol Environ Health A. 2004;67(3):233–249. doi: 10.1080/15287390490266909. [DOI] [PubMed] [Google Scholar]
- 27.Antonini JM, Santamaria AB, Jenkins NT, Albini E, Lucchini R. Fate of manganese associated with the inhalation of welding fumes: potential neurological effects. Neurotoxicology. 2006;27(3):304–310. doi: 10.1016/j.neuro.2005.09.001. [DOI] [PubMed] [Google Scholar]
- 28.Berlinger B, Ellingsen DG, Naray M, Zaray G, Thomassen Y. A study of the bio-accessibility of welding fumes. J Environ Monit. 2008;10(12):1448–1453. doi: 10.1039/b806631k. [DOI] [PubMed] [Google Scholar]
- 29.Chia SE, Foo SC, Gan SL, Jeyaratnam J, Tian CS. Neurobehavioral functions among workers exposed to manganese ore. Scand J Work Environ Health. 1993;19(4):264–270. doi: 10.5271/sjweh.1475. [DOI] [PubMed] [Google Scholar]
- 30.Järvisalo J, Olkinuora M, Kiilunen M, Kivistö H, Ristola P, Tossavainen A, et al. Urinary and blood manganese in occupationally nonexposed populations and in manual metal arc welders of mild steel. Int Arch Occup Environ Health. 1992;63(7):495–501. doi: 10.1007/BF00572116. [DOI] [PubMed] [Google Scholar]
- 31.Loranger S, Zayed J. Environmental and occupational exposure to manganese: a multimedia assessment. Int Arch Occup Environ Health. 1995;67(2):101–110. doi: 10.1007/BF00572233. [DOI] [PubMed] [Google Scholar]
- 32.Grass DS, Ross JM, Family F, Barbour J, James Simpson H, Coulibaly D, et al. Airborne particulate metals in the New York City subway: a pilot study to assess the potential for health impacts. Environ Res. 2010;110(1):1–11. doi: 10.1016/j.envres.2009.10.006. [DOI] [PMC free article] [PubMed] [Google Scholar]
- 33.Criswell SR, Perlmutter JS, Huang JL, Golchin N, Flores HP, Hobson A, et al. Basal ganglia intensity indices and diffusion weighted imaging in manganese-exposed welders. Occup Environ Med. 2012;69(6):437–443. doi: 10.1136/oemed-2011-100119. [DOI] [PMC free article] [PubMed] [Google Scholar]
- 34.Jiang Y, Zheng W, Long L, Zhao W, Li X, Mo X, et al. Brain magnetic resonance imaging and manganese concentrations in red blood cells of smelting workers: search for biomarkers of manganese exposure. Neurotoxicology. 2007;28(1):126–135. doi: 10.1016/j.neuro.2006.08.005. [DOI] [PMC free article] [PubMed] [Google Scholar]
- 35.Laohaudomchok W, Lin X, Herrick RF, Fang SC, Cavallari JM, Christiani DC, et al. Toenail, blood, and urine as biomarkers of manganese exposure. J Occup Environ Med. 2011;53(5):506–510. doi: 10.1097/JOM.0b013e31821854da. [DOI] [PMC free article] [PubMed] [Google Scholar]
- 36.Bader M, Dietz MC, Ihrig A, Triebig G. Biomonitoring of manganese in blood, urine and axillary hair following low-dose exposure during the manufacture of dry cell batteries. Int Arch Occup Environ Health. 1999;72(8):521–527. doi: 10.1007/s004200050410. [DOI] [PubMed] [Google Scholar]
- 37.Bowler RM, Harris M, Gocheva V, Wilson K, Kim Y, Davis SI, et al. Anxiety affecting parkinsonian outcome and motor efficiency in adults of an Ohio community with environmental airborne manganese exposure. Int J Hyg Environ Health. 2012;215(3):393–405. doi: 10.1016/j.ijheh.2011.10.005. [DOI] [PubMed] [Google Scholar]
- 38.Lander F, Kristiansen J, Lauritsen JM. Manganese exposure in foundry furnacemen and scrap recycling workers. Int Arch Occup Environ Health. 1999;72(8):546–550. doi: 10.1007/s004200050414. [DOI] [PubMed] [Google Scholar]
- 39.Deschamps FJ, Guillaumot M, Raux S. Neurological effects in workers exposed to manganese. J Occup Environ Med. 2001;43(2):127–132. doi: 10.1097/00043764-200102000-00011. [DOI] [PubMed] [Google Scholar]
- 40.Wang X, Yang Y, Xu S. The effect of occupational exposure to metals on the nervous system function in welders. J Occup Health. 2006;48(2):100–106. doi: 10.1539/joh.48.100. [DOI] [PubMed] [Google Scholar]
- 41.Lucchini R, Selis L, Folli D, Apostoli P, Mutti A, Vanoni O, et al. Neurobehavioral effects of manganese in workers from a ferroalloy plant after temporary cessation of exposure. Scand J Work Environ Health. 1995;21(2):143–149. doi: 10.5271/sjweh.1369. [DOI] [PubMed] [Google Scholar]
- 42.Lucchini R, Bergamaschi E, Smargiassi A, Festa D, Apostoli P. Motor function, olfactory threshold, and hematological indices in manganese-exposed ferroalloy workers. Environ Res. 1997;73(1–2):175–180. doi: 10.1006/enrs.1997.3702. [DOI] [PubMed] [Google Scholar]
- 43.Lucchini R, Apostoli P, Perrone C, Placidi D, Albini E, Migliorati P, et al. Long-term exposure to “low levels” of manganese oxides and neurofunctional changes in ferroalloy workers. Neurotoxicology. 1999;20(2–3):287–297. [PubMed] [Google Scholar]
- 44.Yuan H, He S, He M, Niu Q, Wang L, Wang S. A comprehensive study on neurobehavior, neurotransmitters and lymphocyte subsets alteration of Chinese manganese welding workers. Life Sci. 2006;78(12):1324–1328. doi: 10.1016/j.lfs.2005.07.008. [DOI] [PubMed] [Google Scholar]
- 45.EPA. Exposure Factors Handbook. 2011. 2011. [Google Scholar]
- 46.Price PS, Conolly RB, Chaisson CF, Gross EA, Young JS, Mathis ET, et al. Modeling interindividual variation in physiological factors used in PBPK models of humans. Crit Rev Toxicol. 2003;33(5):469–503. [PubMed] [Google Scholar]
- 47.Pesch B, Weiss T, Kendzia B, Henry J, Lehnert M, Lotz A, et al. Levels and predictors of airborne and internal exposure to manganese and iron among welders. J Expo Sci Environ Epidemiol. 2012;22(3):291–298. doi: 10.1038/jes.2012.9. [DOI] [PubMed] [Google Scholar]
- 48.Applebaum KM, Malloy EJ, Eisen EA. Reducing healthy worker survivor bias by restricting date of hire in a cohort study of Vermont granite workers. Occup Environ Med. 2007;64(10):681–687. doi: 10.1136/oem.2006.031369. [DOI] [PMC free article] [PubMed] [Google Scholar]
- 49.Lauwerys R, Roels H, Genet P, Toussaint G, Bouckaert A, De Cooman S. Fertility of male workers exposed to mercury vapor or to manganese dust: a questionnaire study. Am J Ind Med. 1985;7(2):171–176. doi: 10.1002/ajim.4700070208. [DOI] [PubMed] [Google Scholar]
- 50.Roels HA, Ghyselen P, Buchet JP, Ceulemans E, Lauwerys RR. Assessment of the permissible exposure level to manganese in workers exposed to manganese dioxide dust. Br J Ind Med. 1992;49(1):25–34. doi: 10.1136/oem.49.1.25. [DOI] [PMC free article] [PubMed] [Google Scholar]
- 51.Mergler D, Huel G, Bowler R, Iregren A, Belanger S, Baldwin M, et al. Nervous system dysfunction among workers with long-term exposure to manganese. Environ Res. 1994;64(2):151–180. doi: 10.1006/enrs.1994.1013. [DOI] [PubMed] [Google Scholar]
- 52.Myers JE, te Water Naude J, Fourie M, Zogoe HB, Naik I, Theodorou P, et al. Nervous system effects of occupational manganese exposure on South African manganese mineworkers. Neurotoxicology. 2003;24(4–5):649–656. doi: 10.1016/S0161-813X(03)00035-4. [DOI] [PubMed] [Google Scholar]
- 53.Ellingsen DG, Haug E, Ulvik RJ, Thomassen Y. Iron status in manganese alloy production workers. J Appl Toxicol. 2003;23(4):239–247. doi: 10.1002/jat.913. [DOI] [PubMed] [Google Scholar]
- 54.Chang Y, Woo ST, Kim Y, Lee JJ, Song HJ, Lee HJ, et al. Pallidal index measured with three-dimensional T1-weighted gradient echo sequence is a good predictor of manganese exposure in welders. J Magn Reson Imaging. 2010;31(4):1020–1026. doi: 10.1002/jmri.22104. [DOI] [PubMed] [Google Scholar]