Abstract
Leiomyosarcoma (LMS) is the most common uterine sarcoma. Although the disease is relatively rare, it is responsible for considerable mortality due to frequent metastasis and chemoresistance. The molecular events related to LMS metastasis are unknown to date. The present study compared the global gene expression patterns of primary uterine LMS and LMS metastases. Gene expression profiles of 13 primary and 15 metastatic uterine LMS were analyzed using the HumanRef-8 BeadChip from Illumina. Differentially expressed candidate genes were validated using quantitative real-time PCR and immunohistochemistry. To identify differently expressed genes between primary and metastatic tumors, we performed one-way ANOVA with Benjamini-Hochberg correction. This lead to identification of 203 unique probes that were significantly differentially expressed in the two tumor groups by greater than 1.58-fold with p-value <0.01%, of which 94 and 109 were overexpressed in primary and metastatic LMS, respectively. Genes overexpressed in primary uterine LMS included OSTN, NLGN4X, NLGN1, SLITRK4, MASP1, XRN2, ASS1, RORB, HRASLS and TSPAN7. Genes overexpressed in LMS metastases included TNNT1, FOLR3, TDO2, CRYM, GJA1, TSPAN10, THBS1, SGK1, SHMT1, EGR2 and AGT. Quantitative real-time PCR confirmed significant anatomic site-related differences in FOLR3, OSTN and NLGN4X levels, and immunohistochemistry showed significant differences in TDO2 expression. Gene expression profiling differentiates primary uterine LMS from LMS metastases. The molecular signatures unique to primary and metastatic LMS may aid in understanding tumor progression in this cancer and in providing a molecular basis for prognostic studies and therapeutic target discovery.
Keywords: Gene expression array, uterine leiomyosarcoma, metastasis
Introduction
Uterine sarcomas are rare tumors, comprising 7% of all soft tissue sarcomas and 3% of uterine cancers [1,2]. With the exclusion of carcinosarcomas, now regarded as metaplastic carcinomas, from this category, the most common uterine sarcomas are endometrial stromal sarcoma (ESS) and leiomyosarcoma (LMS) [2]. In a recent series of all sarcomas in Norway in the period 1970–2000, uterine sarcomas comprised 419 of 12,431 (3.4%) uterine malignancies [3]. LMS are clinically aggressive tumors [3,4].
Several studies have analyzed the molecular profile of LMS. However, the majority of these series consisted predominantly or exclusively of soft tissue LMS, and included other types of soft tissue sarcomas [5–9]. Analyses focusing exclusively or predominantly on uterine LMS are few to date. Quade et al. compared the gene expression profiles of 9 uterine LMS, 7 leiomyomas and 4 normal myometria, as well as 4 non-uterine LMS [10]. A set of 153 probes representing 146 genes differentiated between uterine LMS, leiomyomas and normal myometria. Non-uterine LMS resembled their uterine counterparts.
Skubitz compared the gene expression profiles of 4 uterine and 4 non-uterine LMS, 19 leiomyomas, 46 normal myometria and 250 other tissues [11]. A gene panel differentiating LMS from normal myometrium was defined, with less distinct differences between LMS and the other tissues sampled.
Comparative analysis of 2 uterine LMS and 3 normal myometria identified several overexpressed genes in LMS, of which GRN, encoding for acrogranin, was shown to have a biological role in vitro and in nude mice model [12]
Two comparative genomic hybridization array analyses of 7 and 15 uterine LMS from one group identified frequently gained and lost genes, although lists differed in these 2 studies [13,14].
Comparative analysis of primary and metastatic soft tissue LMS identified 335 differentially expressed genes [9]. However, data for uterine LMS are unavailable to date. In the present study, we compared the gene expression profiles of 28 primary and metastatic uterine LMS. We identified a set of genes that were differentially expressed in primary and metastatic disease, which may improve our understanding of disease progression in this cancer, as well as provide new potential candidates for targeted therapy.
Material and methods
Patients and material
The clinical material consisted of 28 uterine LMS, submitted for routine diagnostic purposes to the Department of Pathology at the Norwegian Radium Hospital during the period 2002–2009. Tumors consisted of 13 primary uterine tumors and 15 metastases, the latter consisting of 11 intra-abdominal and 4 distant metastases (1 bone and 3 lung metastases). Metastases were from 10 patients, of whom 1 had 3 lesions, 3 had 2 lesions and 6 had a single metastasis. For patients with >1 metastasis, tumors were metachronous. Primary and metastatic lesions were not patient-matched, with the exception of one patient with primary LMS and lung metastasis.
Tumors were snap-frozen and kept at −70°C. Frozen sections from all tumors were evaluated for the presence of a >80% tumor component and absence of necrosis. Diagnoses were established by experienced gynecologic pathologists based on morphology and immunohistochemistry (IHC) [3,15].
The material analyzed using quantitative real-time PCR (qRT-PCR) consisted of 29 LMS (11 primary, 18 metastatic), including 10 of the 13 primary LMS and all 15 metastatic LMS analyzed in gene expression arrays. The remaining 4 specimens were snap-frozen at the Norwegian Radium Hospital during the same period.
The material analyzed using IHC consisted of 21 patient-matched primary and metastatic LMS operated at the Norwegian Radium Hospital during the period 1998–2011. Cases were chosen based on the availability of patient-matched primary and metastatic tumor. Metastases were predominantly (n=16) intra-abdominal, the remaining 5 consisting of 1 bone and 4 lung metastases. Tumors from 5 of these patients were analyzed by gene expression arrays.
Patient consent was obtained according to national guidelines and the study was approved by the Regional Committee for Medical Research Ethics in Norway.
Microarray Expression and GeneChip analysis
RNA was prepared from tumor samples using a Qiagen RNeasy kit (Qiagen, Valencia, CA). Illumina HumanRef-8 BeadChip arrays were used to analyze gene expression in both tumors. The BeadChip includes ~24,500 well-annotated transcripts with up-to-date content derived from the National Center for Biotechnology Information Reference Sequence (NCBI RefSeq) database (Build 36.2, Release 22). RNA labeling, hybridization and scanning of the arrays were performed using the standard protocols in the Johns Hopkins Medical Institutions Microarray Core.
qRT-PCR
Among the above-detailed differentially expressed genes, we selected 14 for validation using qRT-PCR. These consisted of 8 genes that were overexpressed in primary LMS (OSTN, NLGN4X, NLGN1, EGR2, SLITRK4, MASP1, XRN2, and HRASLS) and 6 genes that were overexpressed in metastatic LMS (TNNT1, FOLR3, TDO2, SHMT1, CRYM and THBS1). Genes were chosen based on their potential biological and clinical relevance, as judged by the two senior authors of this manuscript (BD and TLW). Specifically, genes known to have a role in cancer and/or expressed in soft tissue, particularly in muscle, were prioritized. qRT-PCR was performed using a SyBr Green-based detection system as previously described [16]. Primers were designed to test the performance in qRT-PCR and those generating robust and specific PCR products in melting curve analysis with minimal primer dimers were selected for analysis (Table 1).
Table 1.
Primers used in quantitative PCR analysis
| Gene Symbol | Forward Primer | Reverse Primer |
|---|---|---|
| OSTN | AATCCGATCCATGGGGATA | CCCCTTGACAGACTCTCAGC |
| NLGN4X | GTGCCCTCCATGTAAGATCC | CTACGTGCCCACGGAAGA |
| NLGN1 | ATAGTTCCCCTTTGCAGCCT | TGTCTTGGCAAGTTATGGCA |
| EGR2 | AGCAAAGCTGCTGGGATATG | TTGACCAGATGAACGGAGTG |
| SLITRK4 | GGGCTGACAAAATCAGAAACA | ACCAGACGCTGGGCTCTA |
| MASP1 | GCACCTGGTCCTCAGTTTCT | CACTGTCCCAGATGGGTTTC |
| XRN2 | TGGATTAGGTTTACTGGCATCA | GCAAGTACCCGTCCATCATAG |
| HRASLS | GGTTGCCAGGGTAGTTCAAA | AAGAGAGACCCCAGGACACA |
| TNNT1 | CAGCTCCAGCAGGTCTTTCT | AGAGCCAGAAGAGGAACGC |
| FOLR3 | AGCAGGCATTCTTCTTCCAG | CTCAATGTCTGCATGAACGC |
| TDO2 | TCAGCCACCTGTTCCTCTTT | TCTGGGGAAAGCTTGAAAAA |
| SHMT1 | GTTGACTGGCATCGTCATTG | GTCAGCGGGTCTGGGACT |
| CRYM | TAATGGCTGTAGGCCTGGAC | GAACAGCTGCAGTTTCTGCC |
| THBS1 | CACAGCTCGTAGAACAGGAGG | CAATGCCACAGTTCCTGATG |
| APP a | CCACAGAACATGGCAATCTG | TTTGGCACTGCTCCTGCT |
Reference gene
Approximately 16–100ng of cDNA was used in the qRT-PCR analysis, performed on an iCycler. Threshold cycle numbers (Ct) were obtained using the iCycler Optical system interface software (Bio-Rad Lab, Hercules, CA). Averages in the Ct of duplicate measurements were obtained. The results were expressed as the difference between the Ct of the gene of interest and the Ct of a control gene (APP) for which expression is relatively constant among previously analyzed SAGE libraries. In cases where no gene expression was observed, a cutoff Ct value of 45 cycles was used.
IHC
Protein expression of 10 gene products, including 6 overexpressed in primary LMS (ASS1, NLGN4X, NLGN1, SLITRK4, XRN2, and HRASLS) and 4 overexpressed in metastatic LMS (TDO2, SHMT1, CRYM and GJA1) products was analyzed using IHC. The choice of proteins for validation was based on the availability of commercial antibodies with adequate performance in formalin-fixed paraffin-embedded material. Antibody details and staining conditions are provided in Table 2. IHC was performed using the EnVision FLEX+ system (Dako, Glostrup, Denmark). Appropriate positive and negative controls were used and were satisfactory in each staining round.
Table 2.
Antibodies used for validation by immunohistochemistry
| Antibody a | Type b | Cat. # | Manufacturer | Dilution | Antigen retrieval |
|---|---|---|---|---|---|
| ASS1 | Rabbit PC | ab96433 | Abcam (Cambridge, UK) | 1:100 | Citrate |
| NLGN4X | Rabbit PC | HPA001651 | Atlas Antibodies (Stockholm, Sweden) | 1:100 | Citrate |
| NLGN1 | Rabbit PC | HPA006680 | Atlas Antibodies | 1:100 | Citrate |
| SLITRK4 | Rabbit PC | HPA001039 | Atlas Antibodies | 1:300 | Citrate |
| XRN2 | Rabbit PC | ab74408 | Abcam | 1:1000 | Citrate |
| HRASLS | Goat PC | ab134828 | Abcam | 1:150 | Citrate |
| TDO2 | Mouse MC | ab128532 | Abcam | 1:150 | Citrate |
| SHMT1 | Mouse MC | ab115665 | Abcam | 1:100 | Citrate |
| CRYM | Mouse MC | ab54669 | Abcam | 1:50 | Citrate |
| Cx43/GJA1 | Rabbit PC | ab11370 | Abcam | 1:1000 | Citrate |
ASS1=Argininosuccinate synthetase 1; NLGN4X=Neuroligin 4X; NLGN1=Neuroligin 1 protein-3; SLITRK4=SLIT and NTRK-like family, member 4; HRASLS=HRAS like suppressor; TDO2=Tryptophan 2,3-dioxygenase; SHMT1=Serine hydroxymethyltransferase-1; CRYM=mu-Crystallin; Cx43=Connexin 43
PC=polyclonal; MC=monoclonal
Immunostained slides were scored by a gynecopathologist (BD). A subset of the slides (25%) was additionally scored by a second gynecopathologist (VMA). Staining extent was scored on a 0–3 scale, corresponding to 0%, 1–10%, 11–50% and 51–100% stained cells, whereas staining intensity was scored as negative (score=0), weak (score=1) or strong (score=2). Multiplying these 2 values provided a staining score scale of 0–6, which was used in the statistical analysis. Differences in protein expression between primary and metastatic LMS were analyzed by the Mann Whitney U test using the SPSS program (version 18.0, Chicago IL).
Results
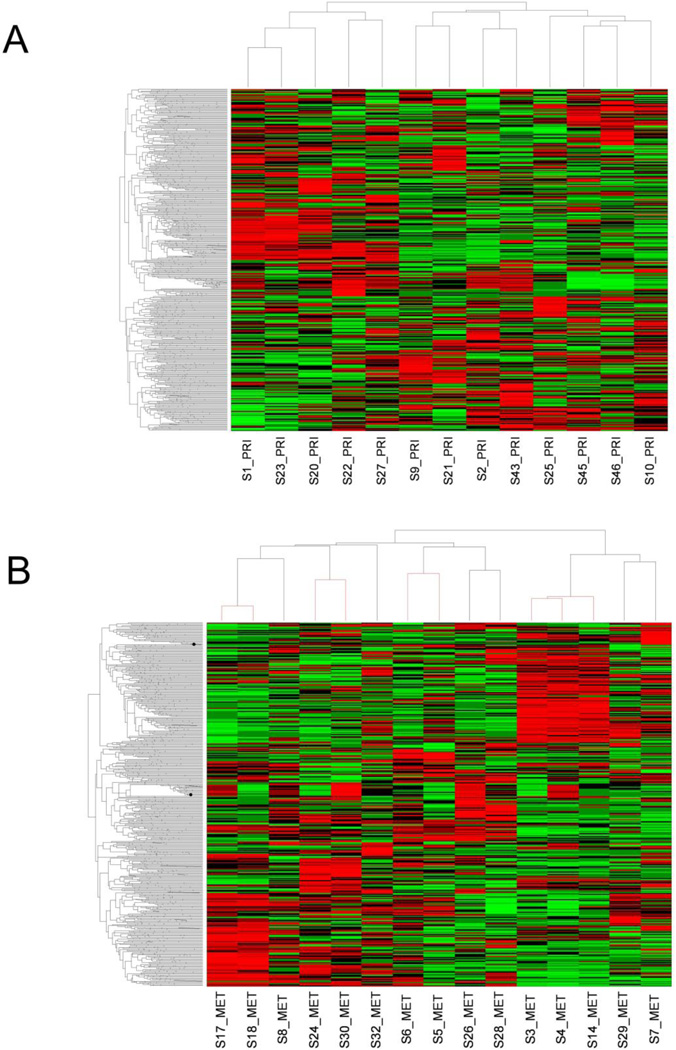
Unsupervised hierarchical clustering, performed on primary tumors to determine the similarity in gene expression patterns among these 13 samples, demonstrated two major clusters (Figure 1-A). Review of the morphology of tumors in these two clusters did not show differences with respect to the degree of atypia or mitotic counts. The 15 metastatic samples were derived from 10 patients, of whom 1 had 3 lesions (S3–S4–S14), 3 had 2 lesions (S5–S6, S17–S18, S24–S30), and 6 had a single metastasis. To test if metastatic samples from the same patient shared similar transcriptome profiles, unsupervised hierarchical clustering analysis was performed. This analysis demonstrated that metastatic samples derived from the same patient all clustered under the same branch (Figure 1-B). This indicates that although tumor cells from an individual patient have metastasized to different organs, their transcriptome profiles are by-and-large very similar. Of note, the 5 metastases in the right branch originated from primary LMS with very high mitotic count (>20/10 high-power fields).
Figure 1.
A: Unsupervised hierarchical clustering of primary leiomyosarcomas (n=13). B: Unsupervised hierarchical clustering of metastatic leiomyosarcomas (n=15). The 4 red branches correspond to metastatic samples from 4 different patients.
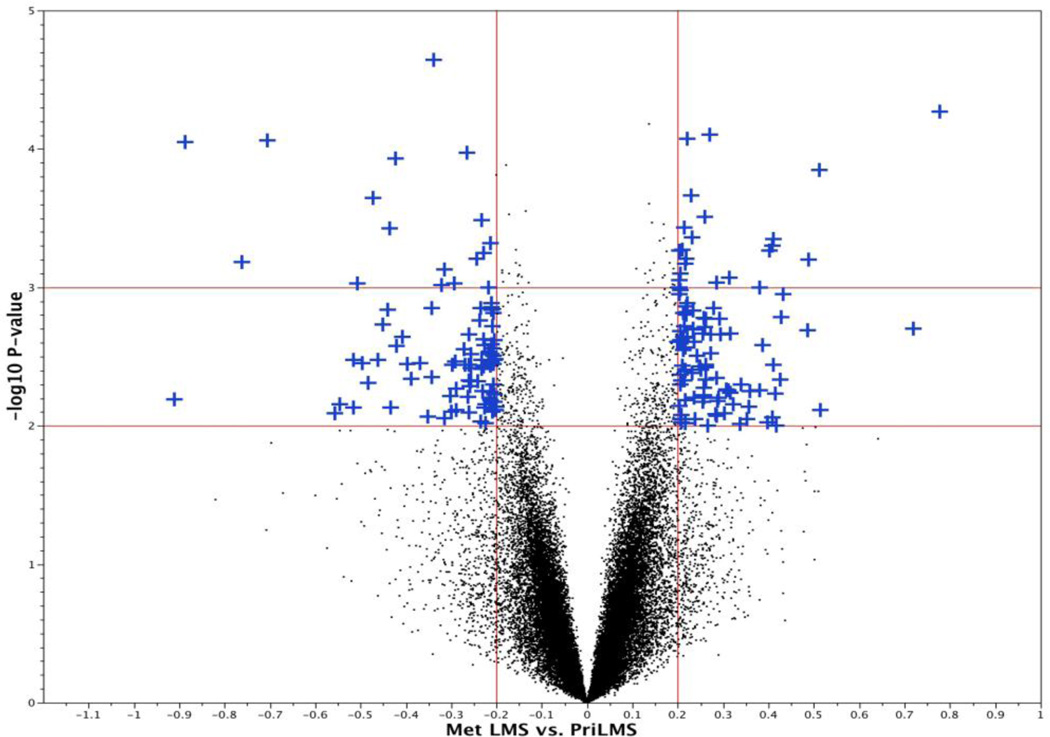
To identify genes differentially expressed in primary and metastatic LMS, we performed one-way ANOVA with Benjamini-Hochberg correction and found 203 unique probes that were significantly differentially expressed by greater-than-1.58-fold with p<0.01% (Figure 2). Among these genes, 94 and 109 were overexpressed in primary and metastatic LMS, respectively. Genes overexpressed in primary uterine LMS included OSTN, NLGN4X, NLGN1, SLITRK4, MASP1, XRN2, ASS1, RORB, HRASLS and TSPAN7. Genes overexpressed in LMS metastases included TNNT1, FOLR3, TDO2, CRYM, GJA1, TSPAN10, THBS1, SGK1, SHMT1, EGR2 and AGT. Differences among the groups were in general less pronounced than in our previous comparative analysis of ESS and LMS using the same platform [17]. The full gene list is provided in Supplementary Table 1.
Figure 2.
Volcano Plot depicting the results of the t-test for differential expression between primary and metastatic LMS. 203 gene probes were significantly differentially expressed in these two groups by >1.58-fold change (p<0.01).
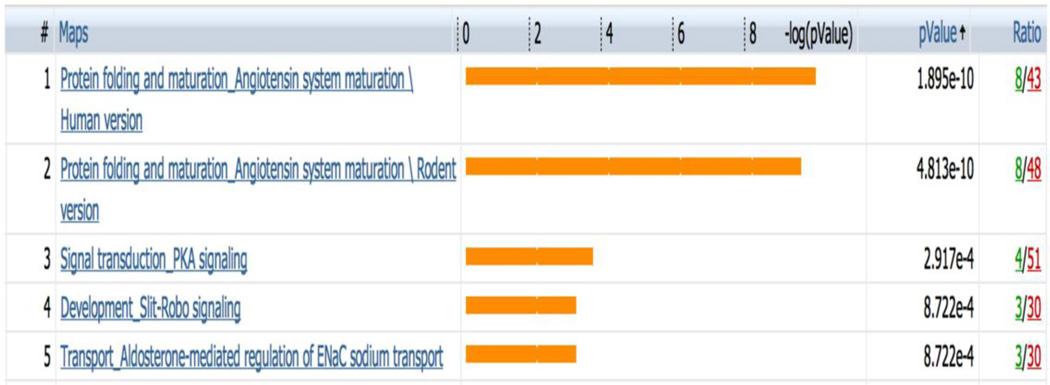
Next we performed GeneGo MetaCore analysis to determine functional ontologies that are enriched in the 203 differentially expressed gene probes. The most enriched GeneGo biological processes are related to angiotensin maturation as well as PKA signaling (Figure 3). Closer look at the angiotensin-related pathway showed that angiotensin I-IV and the angiotensin precursor angiotensinogen were up-regulated in metastatic LMS (Supplementary Figure 1).
Figure 3.
The five most significantly enriched GeneGo biological processes in the 203 gene probes. The bars represent significance as −log(p-value). All ontology enrichments were filtered to allow no more than 10% false discovery rate.
Validation experiments
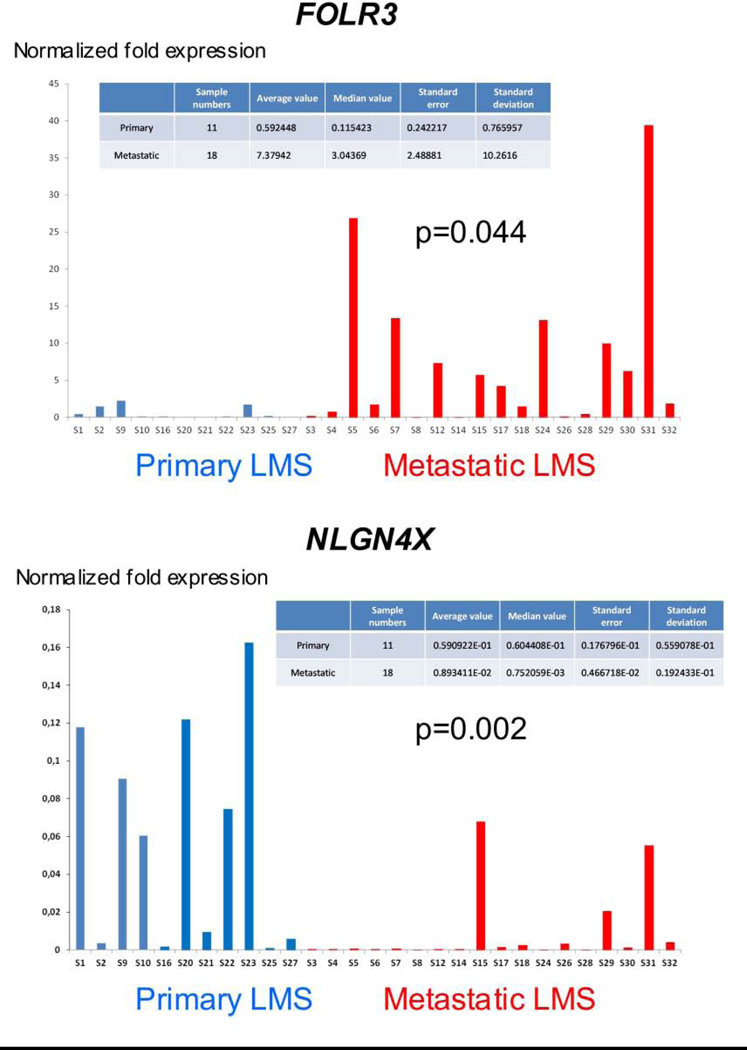
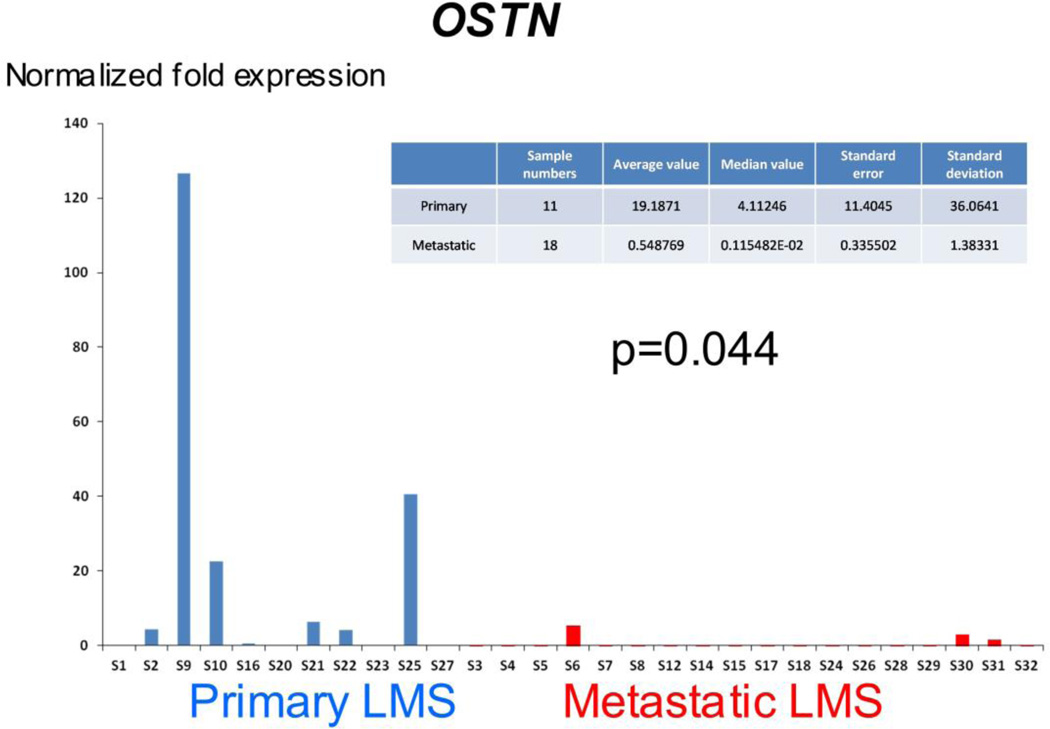
Expression levels of 14 selected transcripts were analyzed in 11 primary and 18 metastatic LMS using qRT-PCR. Statistically significant differences were observed for OSTN (p=0.044) and NLGN4X (p=0.002), overexpressed in primary LMS, and for FOLR3 (p=0.044), overexpressed in metastatic LMS (Figure 4). A trend for higher expression in primary LMS was seen for SLITRK4 (p=0.07), and p-values <0.3 were found for several additional genes, including TDO2 (p=0.13), MASP1 (p=0.14), EGR2 (p=0.15) and SHMT1 (p=0.23) (data not shown). Marked differences in expression level were seen within each group for the majority of genes.
Figure 4.
qRT-PCR results for the 3 genes with greatest degree of differential expression among 14 analyzed genes. OSTN and NLGN4X are overexpressed in primary LMS, whereas FOLR3 is overexpressed in metastatic LMS.
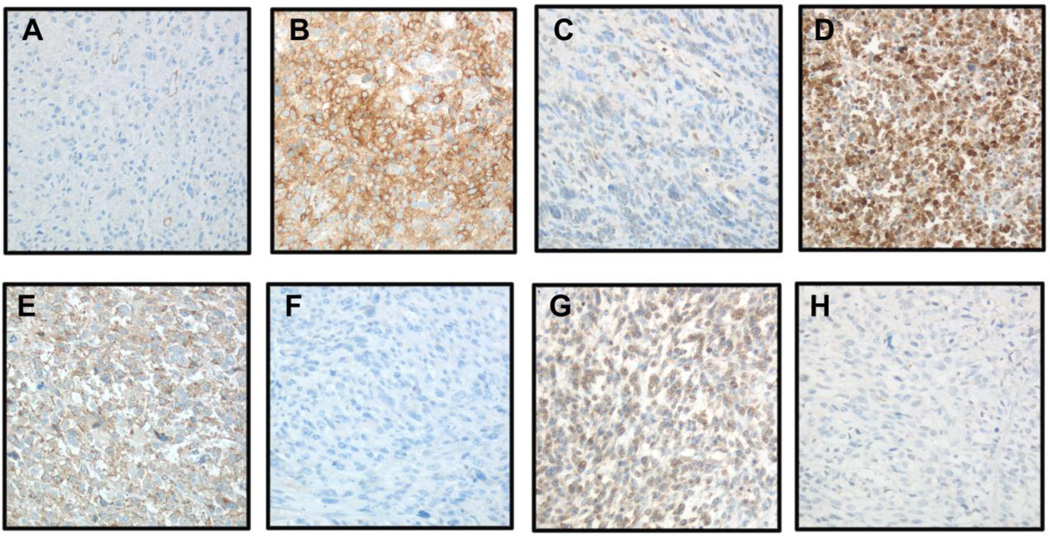
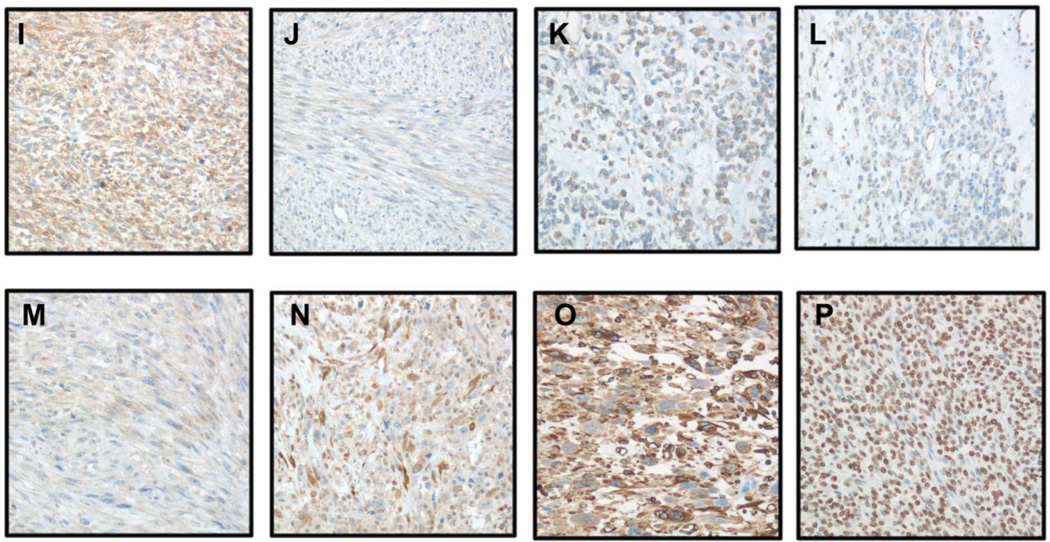
IHC was applied to analysis of 10 proteins, of which 6 and 4 were overexpressed in primary and metastatic LMS, respectively, in 21 patient-matched paired tumors. Eight of the proteins (NLGN4X, NLGN1, SLITRK4, XRN2, HRASLS, TDO2, CRYM and Cx43/GJA1) had variable degree of expression across tumors, with evident expression differences observed in some primary-metastasis pairs (Figure 5). SHMT1 was diffusely expressed in all tumors irrespective of anatomic site, whereas ASS1 protein was not expressed in any of the tumors. Statistical analysis showed significantly higher TDO2 expression in LMS metastases (p=0.01), with no significant differences for the remaining proteins. Inter-observer agreement for staining score was 75%. Differences were predominantly of one staining extent or intensity level, and were resolved in a consensus session.
Figure 5.
IHC analysis of NLGN4X, NLGN1, SLITRK4, XRN2, HRASLS, TDO2, CRYM, Cx43/GJA1 and SHMT1 protein expression in LMS (A–N: primary LMS in left column, metastatic LMS in right column; ×200 magnification for all).
A–B: Higher Cx43/GJA1 expression in metastatic LMS
C–D: Higher CRYM expression in metastatic LMS
D–F: Higher HRASLS expression in primary LMS
G–H: Higher NLGN1 expression in primary LMS
I–J: Higher NLGN4X expression in primary LMS
K–L: Higher SLITRK4 expression in primary LMS
M–N: Higher TDO2 expression in metastatic LMS
O: SHMT1 in primary LMS
P: XRN2 in primary LMS
Discussion
Uterine LMS is a rare aggressive cancer, and there is currently little knowledge regarding the molecular events undergone by LMS cells in the process of metastasis. In the present study, we applied gene expression profiling to address this biological question. We identified 203 unique probes that significantly differentiated between primary and metastatic LMS. These showed little overlap with the genes identified by Lee et al. as differentiators between primary and metastatic soft tissue LMS [9]. One possible reason for this, apart from technical considerations, may be the fact that uterine LMS, while sharing many morphological and biological characteristics with soft tissue LMS, is a distinct entity, and arises in an organ which differs considerably from soft tissue. That would imply different microenvironment, in turn modifying the genotype of tumor cells.
The majority of genes found to be overexpressed in primary uterine LMS have not been previously studied in this tumor, although some have been localized to muscle tissue. Osteocrin, encoded by OSTN, was the most overexpressed gene in primary LMS. Osteocrin was originally identified as a secreted protein in osteoblasts, but was later found in other mesenchymal cells, including muscle. It has structural homology to natriuretic peptides and is considered to be a hormone-like peptide, with possible role in metabolic regulation in muscle [18].
Two Neuroligin family members, Neuroligins 1 and 4X, were overexpressed in primary LMS. Neuroligins are encoded by 5 genes and undergo alternative splicing. Together with Neurexins, they are expressed in the nervous systems, where they form trans-synaptic complexes and are thought to regulate synaptic development and function. Genetic alterations have been described in both gene families in autism. Though predominantly expressed within the nervous system, Neuroligin 3 was detected in pancreas, skeletal and cardiac muscle and glia, and Neuroligin mRNA was found in endothelial cells. In endothelium, Neuroligins may regulate crosstalk between nerves and vessels or angiogenesis, the latter suggesting a role in tumor biology [19]. Both Neurologins were widely expressed at the protein level in our series and their clinical role may merit further study in a larger series.
As for Neuroligins, Slitrk family members, encoded by SLITRK1-6, are nervous system proteins. Slitrk proteins are integral membrane proteins resembling Trk tyrosine kinase receptors, which are involved in neural development. They are expressed in different brain tumors, including both gliomas and small blue round cell tumors such as medulloblastoma and primitive neuroectodermal tumor (PNET) [20]. The current report is the first to describe expression of a Slitrk family member in sarcomas.
XRN2 is member of the 5’→3’exoribonuclease (XRN) family, conserved enzymes in eukaryotes which regulate RNA metabolism. XRN2 is hypermethylated in salivary adenoid cystic carcinoma [21]. It has not been studied in sarcomas to date.
Tetraspanins are a large family of 33 transmembrane adhesion molecules which interact with both membrane and cytoplasmic partners, including integrins, claudin-1 and EGFR. Tetraspanins are deregulated in multiple cancers and regulate angiogenesis, invasion and metastasis, promoting or inhibiting tumor progression depending on the tumor and family member involved, and are considered as candidates for targeted therapy [22]. Uterine sarcomas were reported to have low expression of the tetraspanin member KAI-1. However, 5 of the 15 analyzed tumors in this group were carcinosarcomas, which are currently not considered as sarcomas, the remaining 10 consisting of 8 ESS and 2 LMS [23]. In the present study, TSPAN7 (CD231) was overexpressed in primary LMS whereas TSPAN10 was overexpressed in metastatic LMS. The clinical significance of this alteration, if any, remains to be established.
Genes overexpressed in LMS metastases consisted mainly of molecules which have been characterized in sarcomas, non-malignant muscle cells or other cancers. The latter category included 2 molecules involved in folate metabolism, FOLR3 and SHMT1. FOLR3, the secreted member of the folate receptor family, is overexpressed in ovarian carcinoma [24]. SHMT1 encodes serine hydroxymethyltranferase 1, vitamin B6-dependent enzyme catalyzing the conversion of tetrahydrofolate to 5,10-methylene tetrahydrofolate, which provides one-carbon units for the synthesis of purine, thymidilate and methionine [25]. SHMT1 polymorphisms are associated with higher risk for different cancers, e.g. childhood acute lymphoblastic leukemia [25], and SHMT1 was found to be one of the oncogenic genes at chromosome 17p11.2–p12 in osteosarcoma [26].
TDO2 encodes tryptophan 2,3-dioxygenase, one of three heme-containing enzymes which convert tryptophan to N-formyl kynurenine, and is highly expressed in normal liver [27]. While TDO2 has not been well characterized in cancer to date, indoleamine 2,3-dioxygenase 2 (IDO2), one of the other enzymes mediating this reaction, was associated with poor metastasis-free and overall survival in osteosarcoma [28].
TNNT1 is part of a 7-gene group encoding for thin filament skeletal proteins, in which >140 different mutations have been identified, forming the molecular basis for congenital skeletal myopathies [29]. The role of this gene in sarcomas has not been studied to date.
EGR2 (early growth response 2) is involved in myelination by Schwann cells and is mutated in peripheral neuropathies. A risk locus for Ewing sarcoma was recently identified 5kb upstream to the EGR2 gene [30].
Another gene found to be overexpressed in metastatic LMS was SGK1, encoding the serum/glucocorticoid-induced kinase SGK-1, which is widely expressed in normal tissue and regulates ion transport. SGK-1 is a serine-threonine kinase belonging to the AGC kinase family, which includes protein kinases A-C and G (PKA, PKB/Akt, PKC, PKG), and is induced by mTOR, a downstream target of Akt. SGK-1 mediates cell survival and tumor growth in colon carcinoma [31].
Finally, we observed overexpression of CRYM and GJA1 in metastatic LMS. Crystallins are a family of structural lens proteins, and mutations in Crystallin genes are associated with cataract. Crystallin μ, encoded by CRYM, is expressed in various tissues, including muscle, and CRYM mutations are associated with deafness [32]. CRYM expression has not been studied in sarcomas to date. However, CRYAB, another member of this family, was reported to be overexpressed in osteosarcoma compared to normal bone [33].
Connexins (Cx) are a family of gap junction proteins which are deregulated in different cancers and are associated with tumor progression and metastasis, and thus considered as potential therapeutic targets [34]. Expression of Cx43, the most widely-studied member of this family, is associated with poor survival in Ewing sarcoma [35].
In conclusion, the first gene expression array analysis comparing primary and metastatic LMS identified sets of genes that are differentially expressed at different anatomic sites in this cancer. Differences in gene expression levels were, however, more subtle that in our previous comparison of ESS and LMS [17], which is likely to have impacted our validation analyses. Metastatic samples from the same patient have similar overall transcriptome. Ideally, to identify genes differentially expressed in primary versus metastatic samples, patient-matched lesions should be studied. However, obtaining frozen material form the primary tumor and metastasis for rare tumors is difficult. Such analysis was nevertheless performed for protein expression by IHC. Validation by qPCR and IHC did confirm anatomic site-related differences in the expression of several molecules which may be relevant for tumor biology and disease progression in LMS, and analysis of the genomic landscape may help further delineate the pathogenesis in developing recurrence of LMS. Further studies of larger series are likely to elucidate the prognostic and potential therapeutic relevance of these molecules, hopefully benefiting a patient population that critically depends on targeted therapy for prolonging survival.
Supplementary Material
Acknowledgments
Financial acknowledgement: This work was supported by a grant from the National Sarcoma Foundation at the Norwegian Radium Hospital and NIH grant RO1CA148826.
Footnotes
Publisher's Disclaimer: This is a PDF file of an unedited manuscript that has been accepted for publication. As a service to our customers we are providing this early version of the manuscript. The manuscript will undergo copyediting, typesetting, and review of the resulting proof before it is published in its final citable form. Please note that during the production process errors may be discovered which could affect the content, and all legal disclaimers that apply to the journal pertain.
Presented at the 2013 AACR Annual Meeting, April 6–10, Washington DC.
References
- 1.Toro JR, Travis LB, Wu HJ, Zhu K, Fletcher CM, Devesa SS. Incidence patterns of soft tissue sarcomas, regardless of primary site, in the surveillance, epidemiology and end results program, 1978–2001: An analysis of 26,758 cases. Int J Cancer. 2006;119:2922–2930. doi: 10.1002/ijc.22239. [DOI] [PubMed] [Google Scholar]
- 2.D'Angelo E, Prat J. Uterine sarcomas: a review. Gynecol Oncol. 2010;116:131–139. doi: 10.1016/j.ygyno.2009.09.023. [DOI] [PubMed] [Google Scholar]
- 3.Abeler VM, Røyne O, Thoresen S, Danielsen HE, Nesland JM, Kristensen GB. Uterine sarcomas in Norway. A histopathological and prognostic survey of a total population from 1970 to 2000 including 419 patients. Histopathology. 2009;54:355–364. doi: 10.1111/j.1365-2559.2009.03231.x. [DOI] [PubMed] [Google Scholar]
- 4.Amant F, Coosemans A, Debiec-Rychter M, Timmerman D, Vergote I. Clinical management of uterine sarcomas. Lancet Oncol. 2009;10:1188–1198. doi: 10.1016/S1470-2045(09)70226-8. [DOI] [PubMed] [Google Scholar]
- 5.Edris B, Espinosa I, Mühlenberg T, et al. ROR2 is a novel prognostic biomarker and a potential therapeutic target in leiomyosarcoma and gastrointestinal stromal tumour. J Pathol. 2012;227:223–233. doi: 10.1002/path.3986. [DOI] [PMC free article] [PubMed] [Google Scholar]
- 6.Gibault L, Pérot G, Chibon F, et al. New insights in sarcoma oncogenesis: a comprehensive analysis of a large series of 160 soft tissue sarcomas with complex genomics. J Pathol. 2011;223:64–71. doi: 10.1002/path.2787. [DOI] [PubMed] [Google Scholar]
- 7.Mills AM, Beck AH, Montgomery KD, et al. Expression of subtype-specific group 1 leiomyosarcoma markers in a wide variety of sarcomas by gene expression analysis and immunohistochemistry. Am J Surg Pathol. 2011;35:583–589. doi: 10.1097/PAS.0b013e318211abd6. [DOI] [PMC free article] [PubMed] [Google Scholar]
- 8.Beck AH, Lee CH, Witten DM, et al. Discovery of molecular subtypes in leiomyosarcoma through integrative molecular profiling. Oncogene. 2010;29:845–854. doi: 10.1038/onc.2009.381. [DOI] [PMC free article] [PubMed] [Google Scholar]
- 9.Lee YF, John M, Falconer A, et al. A gene expression signature associated with metastatic outcome in human leiomyosarcomas. Cancer Res. 2004;64:7201–7204. doi: 10.1158/0008-5472.CAN-04-1673. [DOI] [PubMed] [Google Scholar]
- 10.Quade BJ, Wang TY, Sornberger K, Dal Cin P, Mutter GL, Morton CC. Molecular pathogenesis of uterine smooth muscle tumors from transcriptional profiling. Genes Chromosomes Cancer. 2004;40:97–108. doi: 10.1002/gcc.20018. [DOI] [PubMed] [Google Scholar]
- 11.Skubitz KM, Skubitz AP. Differential gene expression in leiomyosarcoma. Cancer. 2003;98:1029–1038. doi: 10.1002/cncr.11586. [DOI] [PubMed] [Google Scholar]
- 12.Matsumura N, Mandai M, Miyanishi M, et al. Oncogenic property of acrogranin in human uterine leiomyosarcoma: direct evidence of genetic contribution in in vivo tumorigenesis. Clin Cancer Res. 2006;12:1402–1411. doi: 10.1158/1078-0432.CCR-05-2003. [DOI] [PubMed] [Google Scholar]
- 13.Raish M, Khurshid M, Ansari MA, et al. Analysis of molecular cytogenetic alterations in uterine leiomyosarcoma by array-based comparative genomic hybridization. J Cancer Res Clin Oncol. 2012;138:1173–1186. doi: 10.1007/s00432-012-1182-6. [DOI] [PubMed] [Google Scholar]
- 14.Cho YL, Bae S, Koo MS, et al. Array comparative genomic hybridization analysis of uterine leiomyosarcoma. Gynecol Oncol. 2005;99:545–551. doi: 10.1016/j.ygyno.2005.07.017. [DOI] [PubMed] [Google Scholar]
- 15.Abeler VM, Nenodovic M. Diagnostic immunohistochemistry in uterine sarcomas: a study of 397 cases. Int J Gynecol Pathol. 2011;30:236–243. doi: 10.1097/PGP.0b013e318200caff. [DOI] [PubMed] [Google Scholar]
- 16.Morrison TB, Weis JJ, Wittwer CT. Quantification of low-copy transcripts by continuous SYBR Green I monitoring during amplification. Biotechniques. 1998;24:954–958. 960, 962. [PubMed] [Google Scholar]
- 17.Davidson B, Abeler VM, Hellesylt E, et al. Gene expression signatures differentiate uterine endometrial stromal sarcoma from leiomyosarcoma. Gynecol Oncol. 2013;128:349–355. doi: 10.1016/j.ygyno.2012.11.021. [DOI] [PMC free article] [PubMed] [Google Scholar]
- 18.Moffatt P, Thomas GP. Osteocrin--beyond just another bone protein? Cell Mol Life Sci. 2009;66:1135–1139. doi: 10.1007/s00018-009-8716-3. [DOI] [PMC free article] [PubMed] [Google Scholar]
- 19.Bottos A, Rissone A, Bussolino F, Arese M. neurexins and neuroligins: synapses look out of the nervous system. Cell Mol Life Sci. 2011;68:2655–2666. doi: 10.1007/s00018-011-0664-z. [DOI] [PMC free article] [PubMed] [Google Scholar]
- 20.Aruga J, Yokota N, Mikoshiba K. human SLITRK family genes: genomic organization and expression profiling in normal brain and brain tumor tissue. Gene. 2003;315:87–94. doi: 10.1016/s0378-1119(03)00715-7. [DOI] [PubMed] [Google Scholar]
- 21.Bell A, Bell D, Weber RS, El-Naggar AK. CpG island methylation profiling in human salivary gland adenoid cystic carcinoma. Cancer. 2011;117:2898–2909. doi: 10.1002/cncr.25818. [DOI] [PMC free article] [PubMed] [Google Scholar]
- 22.Hemler ME. Targeting of tetraspanin proteins--potential benefits and strategies. Nat Rev Drug Discov. 2008;7:747–758. doi: 10.1038/nrd2659. [DOI] [PMC free article] [PubMed] [Google Scholar]
- 23.Briese J, Schulte HM, Sajin M, et al. Correlations between reduced expression of the metastasis suppressor gene KAI-1 and accumulation of p53 in uterine carcinomas and sarcomas. Virchows Arch. 2008;453:89–96. doi: 10.1007/s00428-008-0608-7. [DOI] [PubMed] [Google Scholar]
- 24.Yuan Y, Nymoen DA, Dong HP, et al. Expression of the folate receptor genes FOLR1 and FOLR3 differentiates ovarian carcinoma from breast carcinoma and malignant mesothelioma in serous effusions. Hum Pathol. 2009;40:1453–1460. doi: 10.1016/j.humpath.2009.02.013. [DOI] [PubMed] [Google Scholar]
- 25.Koppen IJ, Hermans FJ, Kaspers GJ. Folate related gene polymorphisms and susceptibility to develop childhood acute lymphoblastic leukaemia. Br J Haematol. 2010;148:3–14. doi: 10.1111/j.1365-2141.2009.07898.x. [DOI] [PubMed] [Google Scholar]
- 26.Both J, Wu T, Bras J, Schaap GR, Baas F, Hulsebos TJ. Identification of novel candidate oncogenes in chromosome region 17p11.2–p12 in human osteosarcoma. PLoS One. 2012;7:e30907. doi: 10.1371/journal.pone.0030907. [DOI] [PMC free article] [PubMed] [Google Scholar]
- 27.Bakmiwewa SM, Fatokun AA, Tran A, Payne RJ, Hunt NH, Ball HJ. Identification of selective inhibitors of indoleamine 2,3-dioxygenase 2. Bioorg Med Chem Lett. 2012;22:7641–7646. doi: 10.1016/j.bmcl.2012.10.010. [DOI] [PubMed] [Google Scholar]
- 28.Urakawa H, Nishida Y, Nakashima H, Shimoyama Y, Nakamura S, Ishiguro N. Prognostic value of indoleamine 2,3-dioxygenase expression in high grade osteosarcoma. Clin Exp Metastasis. 2009;26:1005–1012. doi: 10.1007/s10585-009-9290-7. [DOI] [PubMed] [Google Scholar]
- 29.Ochala J. Thin filament proteins mutations associated with skeletal myopathies: defective regulation of muscle contraction. J Mol Med (Berl) 2008;86:1197–1204. doi: 10.1007/s00109-008-0380-9. [DOI] [PubMed] [Google Scholar]
- 30.Postel-Vinay S, Véron AS, Tirode F, et al. Common variants near TARDBP and EGR2 are associated with susceptibility to Ewing sarcoma. Nat Genet. 2012;44:323–327. doi: 10.1038/ng.1085. [DOI] [PubMed] [Google Scholar]
- 31.Lang F, Perrotti N, Stournaras C. Colorectal carcinoma cells--regulation of survival and growth by SGK1. Int J Biochem Cell Biol. 2010;42:1571–1575. doi: 10.1016/j.biocel.2010.05.016. [DOI] [PubMed] [Google Scholar]
- 32.Graw J. Genetics of crystallins: cataract and beyond. Exp Eye Res. 2009;88:173–189. doi: 10.1016/j.exer.2008.10.011. [DOI] [PubMed] [Google Scholar]
- 33.Folio C, Mora MI, Zalacain M, et al. Proteomic analysis of chemonaive pediatric osteosarcomas and corresponding normal bone reveals multiple altered molecular targets. J Proteome Res. 2009;8:3882–3888. doi: 10.1021/pr900113w. [DOI] [PubMed] [Google Scholar]
- 34.Kandouz M, Batist G. Gap junctions and connexins as therapeutic targets in cancer. Expert Opin Ther Targets. 2010;14:681–692. doi: 10.1517/14728222.2010.487866. [DOI] [PubMed] [Google Scholar]
- 35.Bui MM, Han G, Acs G, et al. Connexin 43 is a potential prognostic biomarker for ewing sarcoma/primitive neuroectodermal tumor. Sarcoma. 2011;2011:971050. doi: 10.1155/2011/971050. [DOI] [PMC free article] [PubMed] [Google Scholar]
Associated Data
This section collects any data citations, data availability statements, or supplementary materials included in this article.


