Abstract
Vitreoretinal surgery requires very fine motor control to perform precise manipulation of the delicate tissue in the interior of the eye. Besides physiological hand tremor, fatigue, poor kinesthetic feedback, and patient movement, the absence of force sensing is one of the main technical challenges. Previous two degrees of freedom (DOF) force sensing instruments have demonstrated robust force measuring performance. The main design challenge is to incorporate high sensitivity axial force sensing. This paper reports the development of a sub-millimetric 3-DOF force sensing pick instrument based on fiber Bragg grating (FBG) sensors. The configuration of the four FBG sensors is arranged to maximize the decoupling between axial and transverse force sensing. A super-elastic nitinol flexure is designed to achieve high axial force sensitivity. An automated calibration system was developed for repeatability testing, calibration, and validation. Experimental results demonstrate a FBG sensor repeatability of 1.3 pm. The linear model for calculating the transverse forces provides an accurate global estimate. While the linear model for axial force is only locally accurate within a conical region with a 30° vertex angle, a second-order polynomial model can provide a useful global estimate for axial force. Combining the linear model for transverse forces and nonlinear model for axial force, the 3-DOF force sensing instrument can provide sub-millinewton resolution for axial force and a quarter millinewton for transverse forces. Validation with random samples show the force sensor can provide consistent and accurate measurement of three dimensional forces.
Index Terms: Bragg Gratings, Force Feedback, Force Sensors, Force Measurement, Surgical Instruments
I. Introduction
Vitreoretinal surgery is considered one of the most technically demanding microsurgeries. It refers to the intraocular surgical procedures that treat retina-related diseases, such as epiretinal membrane, diabetic retinopathy, retinal detachment, and macular holes. Vitreoretinal surgery requires very fine motion to perform precise manipulation of the delicate tissue in a small and constrained workspace of the eye. Besides physiological hand tremor, fatigue, poor kinesthetic feedback, and patient movement, the absence of force sensing is a formidable technical challenge. Gupta et al. [1] investigated forces applied during in vitro retinal manipulation in porcine cadaver eyes. About 75% of all forces measured are below 7.5 mN and only 19% of the events with this force magnitude can be felt by the surgeons. Applying excessive forces can cause retinal hemorrhages and tears, leading to potentially irreversible damage. “Smart” surgical instruments with force sensing capability, can provide surgeons with imperceptible force information that will guide the surgeon through a maneuver, and potentially improve the safety and efficacy of a surgical procedure.
Various studies have been carried out to develop force sensors for microsurgery, micromanipulation, minimally invasive surgery (MIS), and other surgical disciplines. Menciassi et al. [2] fabricated a robotic 17×7.5×0.4 mm micro-forceps using the LIGA process (Lithography, Electroplating, and Molding). Strain gauges are incorporated as force sensors to measure the grip force. Bell et al. [3] developed a force sensing micro-forceps with fiber Bragg grating (FBG) for stapedectomy. The crimp force measurement can be used to increase the reproducibility of the crimp process. Zhang [4] incorporated a micrograting-based force sensor into a cell manipulation probe to measure the penetration force with micro-newton resolution. Seibold et al. [5] designed a robotic MIS instrument with distal force sensing. The six-axis force torque sensor consists of six stain gauges mounted on a miniature Steward platform. Peirs et al. [6] developed a triaxial force sensing laparoscopic instrument with a diameter of 5 mm. The force sensor is based on intensity modulated fiber optic sensors and can provide a resolution of 0.04 N. Puangmali et al. [7] designed a triaxial distal force sensor for tissue palpation in MIS, also based on intensity modulated fiber optic sensor with 0.02 N resolution. Furthermore, various distal force sensing techniques for MIS applications have been developed based on piezoresistor [8]–[11] and fiber optical sensor [12][13]. Although the aforementioned works show promising results, they are not compatible with the requirements of retinal microsurgery. Berkelman et al. [14] developed a miniature triaxial force sensor based on strain gauges that can provide sub-millinewton resolution, but it is designed to be mounted in the handle of a microsurgical instrument. A handle mounted force sensor is not practical for vitreoretinal surgery, because it cannot distinguish the force applied at the instrument tip and the contact force at the sclera [15].
Vitreoretinal surgery imposes strict dimension constraints and high sensing performance requirements for sensorized instruments. In order to directly measure the tool-to-tissue interaction force at the instrument tip, our approach is to incorporate fiber optic sensors into the distal portion of the instrument shaft that is typically located inside the eye. Previously, a series of 2-DOF force sensing instruments [16]–[18] were developed and tested in in vivo experiments. These instruments preserve same functionalities as conventional ophthalmological instruments and provide transverse force measurements with 0.25 mN resolution, i.e. Fx and Fy as shown in Fig. 1(b). Previous studies show that the force sensing instruments can robustly measure essential forces that are below the human sensory threshold [19]. Combined with appropriate sensory substitution as force feedback, it can effectively reduce forces with improved precision for a membrane peeling task [20]. However, in order to obtain valid force measurements, the surgeons have to keep the 2-DOF force sensing instrument perpendicular to the tissue to apply only transverse forces. This additional constraint reduces an already limited workspace and results in poor ergonomics. In other work [21], our group has developed a 3-DOF force-sensing instrument based on Fabry-Pérot interferometry. A phase unwrapping method is implemented to extend the force sensing range. It provides sufficient force measuring performance, but is potentially unable to measure forces during rapidly changing force inputs. FBG strain sensors are not limited by the possible phase discontinuity while offering the advantages of fiber optic sensors that are of small dimension, high sensitivity, low cost, sterilizable, biocompatible, and immune from electrostatic and electromagnetic noise. Therefore, we designed an ophthalmological micro-pick instrument with 3-DOF force sensing utilizing FBG sensors. Herein, the design, fabrication, calibration, and experiment results will be described and discussed.
Fig. 1.
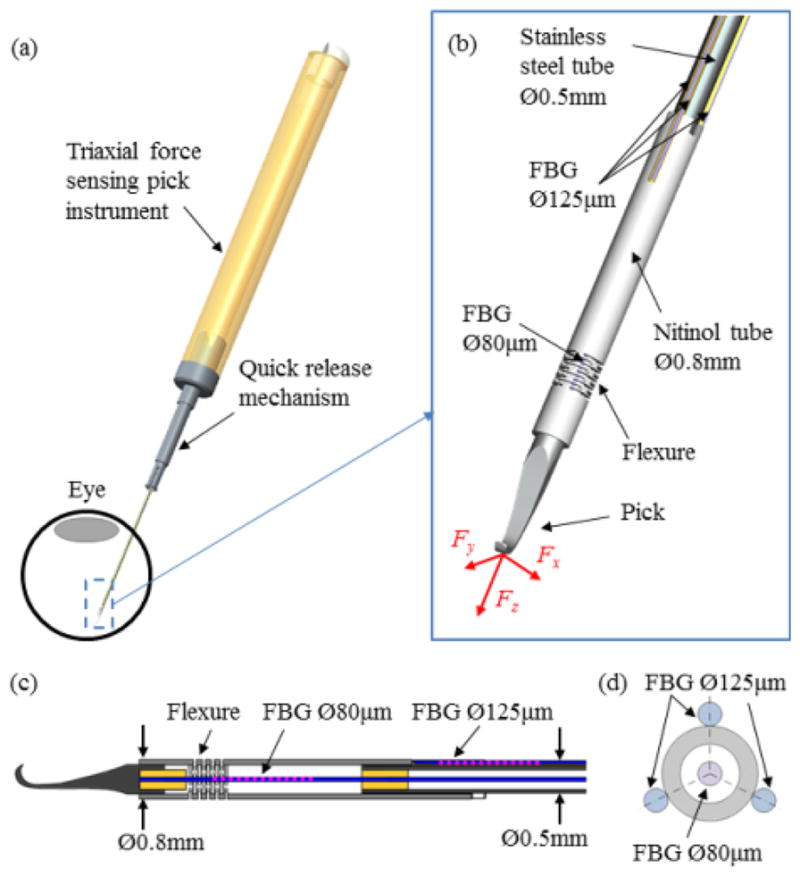
CAD model of the 3-DOF force sensing pick instrument (a), the close up (b) and the section view (c) of the distal force sensing portion, and the section view of the FBG sensor configuration (d).
II. Design
A. Design Requirements
Our previous 2-DOF force sensing instruments have exhibited robust force measuring performance [16]–[18]. The design requirements of the present device were derived from the specifications of these instruments. The main design challenge is to incorporate high sensitivity axial force sensing, because the axial stiffness of the instrument shaft is significantly greater than the transverse stiffness. The desired axial force resolution is below one millinewton while the desired transverse force resolution is less than a quarter millinewton. The inconsistency of the axial and transverse force resolution is a common phenomenon in force sensing applications in MIS [22]. The safety-critical forces in retinal surgery have a magnitude of about 7.5 mN [1], therefore the desired force range is greater than 10 mN. The force sensor must be compact to meet the dimension constraints of ophthalmological instruments. The average diameter of human eye is 25 mm. The force sensor is desired to be no longer than 15 mm in order to ensure the force sensing segment remains inside the eye. In addition, the force sensing instrument is intended to be incorporated with the Steady-Hand Eye Robot [23]–[25] to enable various robotic force feedback [26] and force control methods [27]. The tool quick release mechanism [25] should be integrated into the tool handle. The details of the design requirements are listed in Table I.
TABLE I.
Design Requirements For The 3-DOF Force Sensing Instrument
| Dimension | Tool shaft diameter | ≤ 0.9 mm |
| Tool shaft length | ≈ 30 mm | |
| Force sensor length | ≤ 15 mm | |
|
| ||
| Sensing Performance | Force resolution (X/Y) | ≤ 0.25 mN |
| Force resolution (Z) | ≤ 1.00 mN | |
| Force range (X/Y/Z) | ≥ 10 mN | |
| Sampling rate | ≥ 100 Hz | |
|
| ||
| Additional requirements | Compatible with the tool quick release mechanism of the Eye Robot | |
Fig. 1 illustrates the design concept of the new 3-DOF force sensing pick instrument. Two aspects are considered to achieve high sensitivity axial and transverse force sensing:
FBG sensor configuration;
Flexure design for instrument shaft.
B. FBG Sensor Configuration
Fig. 1(b), (c), and (d) illustrate the proposed configuration of four FBG sensors. FBG sensors reflect a narrow spectrum spike with the Bragg grating. The Bragg wavelength, at which the reflection occurs, depends on the strain in the FBG segment. It can be used to measure strain precisely [28]. Three FBG sensors are longitudinally attached along the instrument shaft with 120° intervals. One FBG sensor is placed in the center of the tubular instrument shaft, along the instrument shaft axis. This configuration is chosen to maximize the decoupling of axial and transverse force measurements, because bending of the instrument shaft due to the transverse forces does not generate strain along the instrument shaft axis. The inner fourth FBG sensor measures the strain that results from axial forces while the three outer FBG sensors measure the transverse forces in the same manner as the previous 2-DOF force sensing instruments. All FBG sensors have one 3 mm FBG segment with center Bragg wavelength of 1545 nm (Technica S.A. Beijing, China). Because the FBG sensors contribute to the overall stiffness, a smaller FBG sensor (cladding diameter of 80 μm and total diameter of 100 μm with polyimide coating) is used for axial force sensing to improve sensitivity, while standard FBG sensors (cladding diameter of 125 μm and total diameter of 150 μm) are used for transverse force sensing to increase signal to noise ratio. The cladding diameter is used in this paper to distinguish the two FBG types. The SM 130–700 optical sensing interrogator from Micron Optics (Atlanta, GA) is used to sample the FBG sensors at a 2 kHz refresh rate.
C. Flexure Design for Instrument Shaft
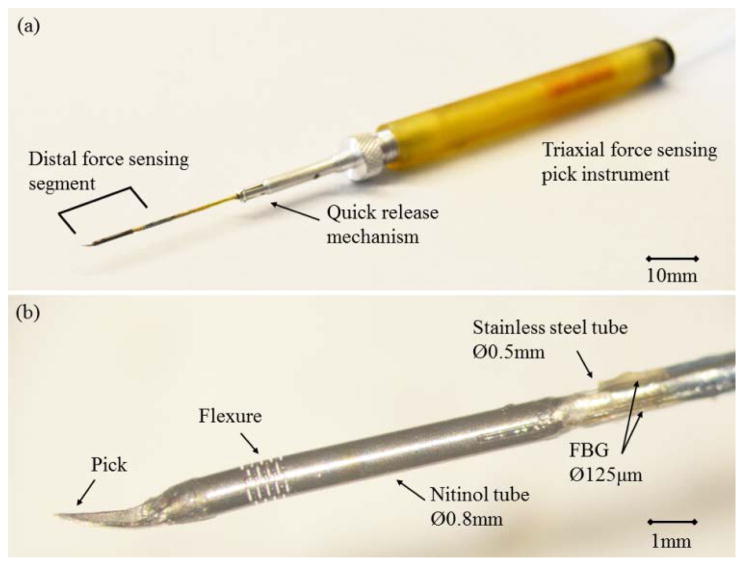
The instrument shaft consists of two parts: the distal force sensing portion and the remaining proximal portion of the instrument shaft, as shown in Fig. 1. The distal force sensing portion is approximately 12 mm in length. It includes a pick, a nitinol flexure tube (outer diameter of 0.8 mm, inner diameter of 0.6 mm, and length of 7.0 mm), the 5 mm distal section of a stainless steel tube (0.5 mm in diameter), and the FBG segments of the four FBG sensors. The non-sensing proximal portion is the rest of the stainless steel tube with approximate length of 20 mm that guides the FBG fibers into the instrument handle.
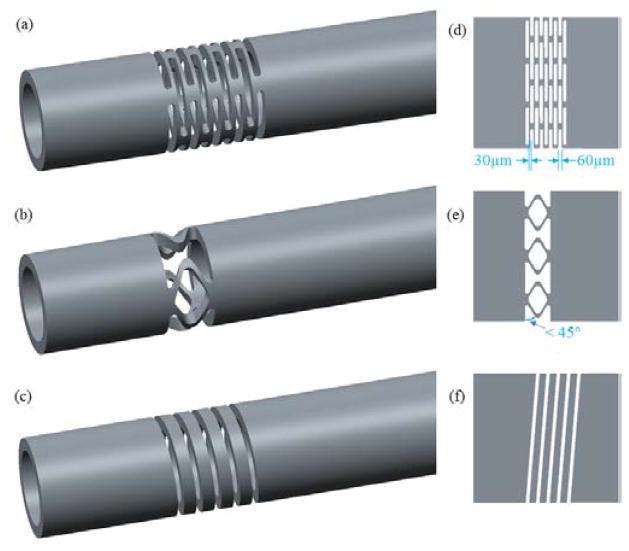
To increase axial force sensitivity, the stiffness of the distal portion of the instrument shaft can be reduced through selecting appropriate material and creating a flexure segment. Stainless steel, titanium, and nitinol (a metal alloy of nickel and titanium) are material candidates. The super-elastic nitinol is chosen because it offers low Young’s modulus (as low as 41 GPa [29]) and biocompatibility. Furthermore, it can be precisely cut with laser micro-machining. Three flexure concepts were devised based on laser micro-machining, as shown in Fig. 2. Concept 1 uses multilayer parallel slots to form the flexure, as shown in Fig. 2 (a) and (d). This structure is easy to fabricate and its stiffness easily adjusted by changing the width of the slots and beams, as well as the number of layers. Concept 2 provides a compact structure with three pairs of V-shape struts. As shown in Fig. 2 (b) and (e), the angle between the V-arm and the radial plane is designed to be smaller than 45° so that the flexure is more elastic under axial forces. However, the complex shape increases the fabrication complexity. Concept 3 functions as a helical spring, as shown in Fig. 2 (c) and (f). It provides high elasticity but is not robust against torsion. Another safety drawback is the single helical connection between the distal and the proximal parts. Serious consequences can potentially be caused by a structural failure at any position of this flexure. Finite element analysis (FEA) was carried out using Creo/Simulate (PTC, MA) to analyze the stress, strain, and displacement generated in the flexures under various force loads. The FEA simulation uses the Young’s modulus (41 GPa) of the nitinol tubes purchased from NDC (Fremont, CA). Fig. 3 shows the stress and the displacement generated in the three flexures when 1 mN axial force is applied. The selected candidate should provide large displacement with low stress. Although Concept 3 can provide good elasticity with fairly small stress, we still exclude it due to the critical safety disadvantages. Concept 2 offers adequate elasticity with relatively high stress, and requires a complex fabrication process. Consequently, we have selected Concept 1 as the force sensor prototype due to the good elasticity, fabrication feasibility, and design flexibility. The final iteration of Concept 1 consists of 9 layers of 60μm wide slots with 30μm wide beams in between, as shown in Fig. 2(d).
Fig. 2.
Flexure concept 1 (a), 2 (b), and 3 (c) to increase sensitivity of axial force sensing and their 2D unfolded flexure pattern (d), (e), and (f). Tube outer diameter is 0.8 mm, and inner diameter is 0.6 mm.
Fig. 3.
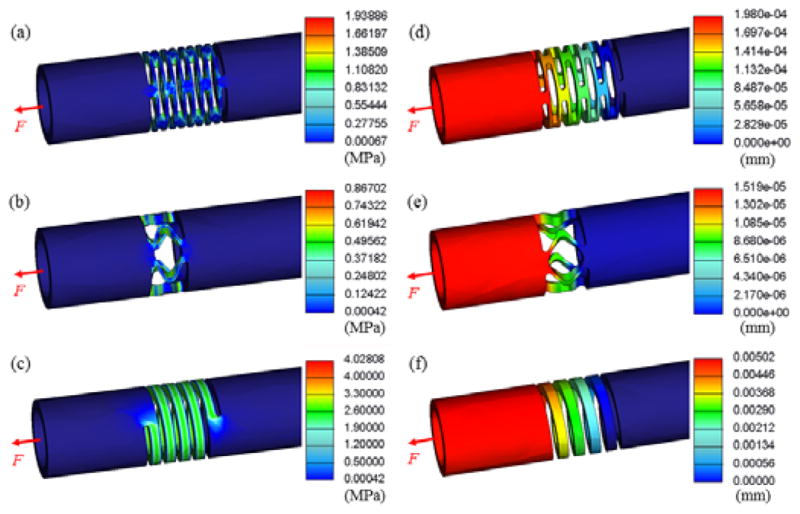
FEA simulation results of the stress (a), (b), and (c) as well as the displacement (d), (e), and (f) generated in the flexures under 1mN axial force load. Maximum stress and displacement can be read from the legend.
D. Instrument Assembly
Fig. 1 illustrates the assembly of the 3-DOF force sensing pick instrument. Medical adhesive Loctite 4013 (tensile strength 28 N/mm2; Henkel, CT) is used to bond the optical and mechanical components. The inner 80 μm FBG sensor is centered and fixed with the help of two intermediate tubes. These tubes are made of stainless steel, 1.5 mm long, shown as yellow tubes in Fig. 1 (c). An axial tension preload is applied, in order to enable both tension and compression measurement. The preload is set at 50 mN to overcome the friction between the components and to account for the stress relaxation after removing the preload. The FBG segment of the inner FBG sensor is located in the middle of the nitinol tube, while the FBG segments of the outer FBG sensors are placed proximally next to the nitinol tube. Therefore the axial strain amplification by the flexure only acts on the inner FBG sensor for axial force sensing. The flexure deformation does not affect the outer FBG sensors. Although the inner FBG sensor is intended to be perfectly aligned with the instrument shaft axis, it is not realistic because the FBG sensor (100 μm in diameter) is not a one dimensional line. Machining and assembly tolerance can also result in significant assembly offset due to the micron level part dimensions. In addition, the FBG segment of the inner FBG sensor is not fully constrained to be perfectly aligned with the instrument shaft axis because it is only fixed at two ends with the intermediate tubes. Under large bending, the inner FBG sensor could shift away from the bending neutral surface. It is to be expected that the inner FBG sensor is not completely decoupled from transverse forces. Thus a linear model to calculate axial force may not be sufficient. For these reasons, a nonlinear model is investigated. More details are discussed in Section III-B. Fig. 4 shows the fully assembled 3-DOF force sensing pick instrument and the close-up view of the distal force sensing segments.
Fig. 4.
The 3-DOF force sensing pick instrument: assembled prototype (a) and the close-up of distal force sensing segment (b).
III. Force Calculation Algorithm
A. Transverse Force Calculation
The 3-DOF force sensing instrument preserves the sensor configuration of the previous 2-DOF tools [16]–[18], so the algorithm for calculating the transverse forces follows [16] using the three outer FBG sensors. The strain is linearly dependent on the moment and thus proportional to the transverse forces applied at the tool tip:
| (1) |
where ε is the local strain at the FBG sensor, M is the bending moment attributed to the transverse forces Ft applied at the tool tip, d is the distance between the tool tip and the FBG sensor, E is the Young’s modulus, I is the moment of inertia, and r is the radial distance between the bending neutral axis and the FBG sensor.
The shift in Bragg wavelength of the FBG sensors is linearly dependent on local strain and temperature change:
| (2) |
where Δλ denotes the shift in Bragg wavelength, ε denotes the local strain, ΔT denotes the temperature change, kε and kΔT are constant coefficients associated to strain and temperature, respectively.
The common mode of all three FBG sensors is due to the strain attributed to axial forces and temperature change. We remove the common mode by subtracting the mean of the Bragg wavelength shifts of all three FBG sensors. The remaining differential mode is called sensor reading Δsi:
| (3) |
where Δsi denotes the differential mode in FBG sensor i, Δλi denotes the shift in Bragg wavelength of FBG sensor i, kεi is the strain coefficient and εi is the local strain of FBG sensor i associated with transverse forces, and i = 1, 2, and 3.
Combining Equations (1) (2), and (3), we can obtain the following equation to describe the linear relationship between the transverse forces and the sensor reading:
| (4) |
where denotes the estimated transverse forces applied at the tool tip, denotes the sensor reading of the outer FBG sensors, and Kt is a 2×3 coefficient matrix representing the linear mapping from the FBG sensor readings to the transverse forces.
B. Axial Force Calculation
An ideal decoupling between the axial and transverse forces would result in a linear equation between the axial force and the Bragg wavelength shift of the inner FBG sensor. However, this assumption is invalid due to the small dimension of the FBG fiber, and imperfections resulting from the machining and assembly tolerance, as previously discussed in Section II-D. The Bragg wavelength shift of the inner FBG sensor is attributed not only to the axial force, but also to the transverse forces. The three outer FBG sensors can be used to bias the inner FBG sensor in order to provide an estimation of the axial force.
1) Linear Method
A linear model for calculating axial force is as follows:
| (5) |
where F̂z is the estimated axial force, Kz is a 1×4 coefficient vector, and denotes the Bragg wavelength shifts of FBG sensors.
Our hypothesis is that the axial force sensing can be linear in a local region where the axial component is significantly larger than the transverse components, but not in the global region.
2) Polynomial Method
In order to obtain a global estimate of the axial force, we test a nonlinear fitting method based on Bernstein polynomials:
| (6) |
where F̂z denotes the estimated axial force, n = 2 is the order of the Bernstein polynomial, cijkl denotes the constant coefficients, and , and denote the scaled Bragg wavelength shifts of the FBG sensors. They are scaled to the interval [0, 1]:
| (7) |
where i can be 1, 2, 3, and 4. And bv,n is the Bernstein basis polynomial defined as follows:
| (8) |
substitute n =2 and define
| (9) |
we can then rewrite Equation (6) as:
| (10) |
where F̂z is the estimated axial force, is a 1×81 row vector of the product of the Bernstein basis polynomials, and is a 81×1 column vector of the coefficients.
Bernstein polynomials exhibit good numerical stability [30] on the interval [0, 1]. A second-order polynomial is used to avoid overfitting. Known forces in various directions are applied in the calibration to obtain an estimation of axial force with the polynomial interpolation. The coefficients in C can be calculated using least squares to obtain a global estimate of the axial force.
3) Temperature Compensation for Axial Force Calculation
The current iteration of the 3-DOF force sensing instrument does not incorporate additional measures to compensate thermal drift of the inner FBG sensor that is dedicated to axial force sensing. In addition, the linear and nonlinear axial force calculation methods discussed above use the wavelength shifts of the FBG sensors, which are subject to both mechanical strain and temperature variation.
We hypothesize that the thermal drift of the inner FBG sensor and that of the common mode of the three outer FBG sensors are linearly correlated, i.e.
| (11) |
where Δλ1, Δλ2, and Δλ3 are wavelength shifts of the outer FBG sensors, is the temperature induced wavelength shift of the inner FBG sensor, and κ denotes the slope of the linear dependence between the inner FBG sensor and the common mode of the outer FBG sensors. Equation (11) is a very strong assumption and will be tested with experiments in Section IV-F. The following temperature compensation method for axial force calculation is devised based on this hypothesis.
First, we define sensor reading Δs4 for the inner FBG sensor:
| (12) |
where Δλ1, Δλ2, Δλ3, and Δλ4 are the wavelength shifts of FBG sensor 1, 2, 3, and 4, respectively, and κ denotes the slope of the linear dependence between the inner FBG sensor and the common mode of the outer FBG sensors. The sensor reading Δs4 is assumed to be the wavelength shift that is only attributed to mechanical strain.
Then, we rewrite Equation (6) as follows to calculate axial force with temperature compensation:
| (13) |
where F̂z denotes the estimated axial force, n = 2 is the order of the Bernstein polynomial, cijkl denotes the constant coefficients, , and denote the scaled sensor readings of the FBG sensors. bv,n and can be calculated using Equation (7) and (8) by replacing Δλi with Δsi. And Δs1, Δs2, and Δs3 are defined by Equation (3), while Δs4 is defined by Equation (12). The method is only applied to calculate the axial forces in the temperature experiment in Section IV-F.
IV. Experiments and Results
With an automated calibration system, experiments are conducted to examine the repeatability of the force sensor, to calibrate the force sensor for 3-dimensional (3D) forces, to validate the force calculation algorithms with the coefficients obtained from the calibration, and to evaluate the proposed temperature compensation method.
A. Experiment Setup
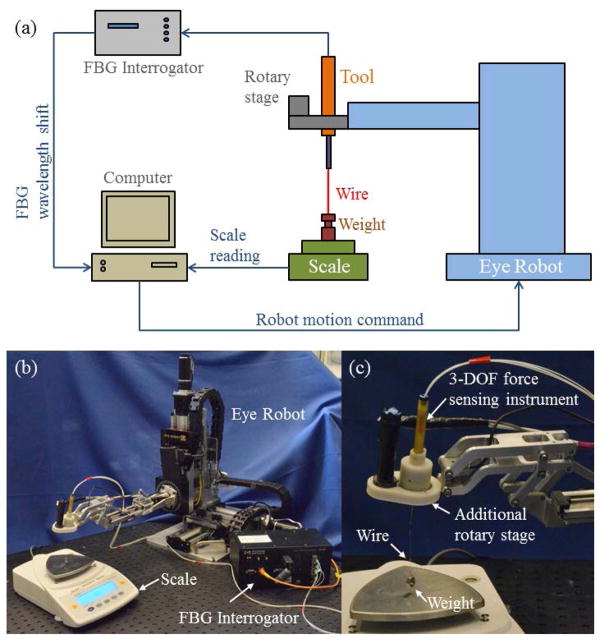
Previous 2-DOF force sensing instruments [16]–[18] exhibit good linearity in the transverse plane. Manual calibration in the direction of the two principle axes of the transverse plane can provide sufficient data to compute a calibration matrix for force calculation. However, the linearity of the axial force sensing is not guaranteed. In the calibration, forces should be applied in different directions besides the three principle axes, in order to obtain enough samples to characterize the polynomial interpolation for the axial force. Because manual calibration is time consuming and is prone to human error, an automated calibration system was developed using the Steady-Hand Eye Robot [23]–[25] to carry out the calibration of the 3-DOF force sensing pick instrument, as shown in Fig. 5.
Fig. 5.
The diagram of the automated calibration system (a), the picture of the calibration setup with the robot, the scale, the tool, and the FBG interrogator (b), and the close-up of the additional rotary stage with the tool (c). Calibration chamber is not shown.
The automated calibration system consists of the robot with an additional rotary stage, a precision scale, a calibration weight, the FBG interrogator, a computer, and a calibration chamber, as shown in Fig. 5. The motorized rotary stage is attached to the 5-DOF robot to provide the rotational DOF about the instrument axis and desired range of motion. The precision scale (Sartorius GC2502, Germany) has a resolution of 1 mg and a repeatability of ±2 mg. It is used together with the calibration weight (2.15 g) to measure forces applied to the 3-DOF force sensing instrument. The calibration weight is approximately 21 mN, which is sufficient to cover the desired force range without the risk of damaging the tool. The computer reads in Bragg wavelength shifts from the FBG interrogator and scale weight, and commands the robot to translate and rotate the instrument to adjust the magnitude and the direction of the force load. The calibration weight is attached to the instrument pick tip through a thin wire. The robot can control the position of the calibration weight with micron level precision [24] (translation resolution 1 μm, rotation resolution ≤ 0.005°, and payload 5 N). The height of the calibration weight determines the portion of the calibration weight applied on the instrument, i.e. the force magnitude. Two rotational DOFs, roll and sweep, are used to adjust the orientation of the instrument with respect to the robot and the scale. The gravitational force by the calibration weight is always pointing downwards, thus the instrument orientation determines the force direction with respect to the instrument. The X-, Y-, and Z-components of the force applied on the tool tip can be calculated as follows:
| (14) |
| (15) |
| (16) |
where α is the roll angle, β is the sweep angle, and ||F|| is the total force magnitude that equals the calibration weight subtracted by the scale reading. Fig. 6 shows the roll angle α and sweep angle β in the tool tip coordinate system. The calibration chamber shields against environmental disturbances, such as temperature variation and air currents. We thus assume the temperature variation is negligible during the experiments, and that there is no external force disturbance. The orientation and the position of the instrument, the scale weight, the Bragg wavelength of the FBG sensors, and timestamp are logged during the experiment.
Fig. 6.
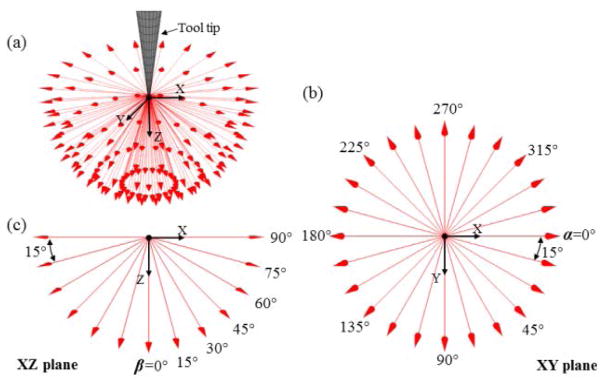
Roll angle α and sweep angle β shown in the tool tip coordinate. The ISO view of all force directions applied in the calibration (a), the top view of variation of α in XY plane (b), and the side view of variation of β in XZ plane (c).
B. Repeatability
The purpose of this experiment is to examine the consistency of the force sensor response. Eight roll (α) and seven sweep (β) angles are combined to generate a total of 56 directions. The roll angle α ranges from 0° to 315° with 45° intervals, while the sweep angle β ranges from 0° to 90° with 15° intervals. Force magnitude spans from 1.25 mN to 21.07 mN. For each force direction, the robot first orients the instrument in the desired direction, then starts with the calibration weight above the scale, i.e. maximum force load on the instrument tip, slowly lowers the calibration weight until the scale reading reaches the threshold of minimum force load, and then slowly lifts the calibration weight until it is again above the scale. It then moves on to the next force direction until all 56 directions are finished. This experiment is repeated four times to examine the repeatability of the force sensor.
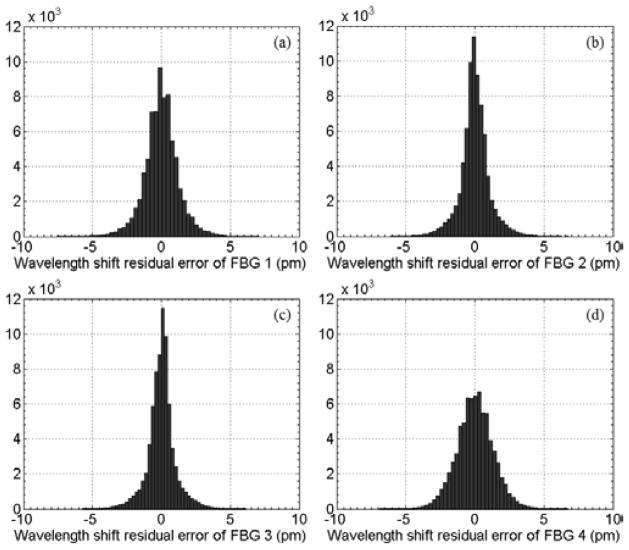
The log data of 20764 samples is divided into subsets (total 5191 subsets). Within each subset, the samples have the same force direction and magnitude. For each subset, the mean and residual errors of the Bragg wavelength shifts are calculated. Then the residual errors of all subsets are combined to calculate the standard deviation for each FBG sensor as a measure of repeatability. Fig. 7 illustrates the probability distribution of the wavelength shift residual errors of the FBG sensors. The standard deviations are 1.23 pm, 1.06 pm, and 1.01 pm for the outer FBG sensors 1, 2, and 3, respectively. The inner FBG sensor 4 has a standard deviation of 1.29 pm. The FBG interrogator has a wavelength repeatability of 1pm. Its wavelength stability is typically 2 pm, and 5 pm at maximum. Therefore, we can conclude that the force sensor provides reliable repeatability which is consistent with the intrinsic optical properties of the FBG interrogator.
Fig. 7.
The histograms of the wavelength shift residual errors of the FBG sensor 1 (a), 2 (b), 3 (c), and 4 (d). The probability distribution of wavelength shift residual errors shows the force sensor provides a reliable repeatability with standard deviations of less than 1.3 pm.
C. Calibration
The purpose of the calibration experiment is to collect sufficient data with a fine sampling grid in order to obtain the constant coefficients for the force calculation algorithms described in Section III. The roll angle α ranges from 0° to 345° with 15° intervals, and the sweep angle β ranges from 0° to 90° with 15° intervals, as shown in Fig. 6. In total, 168 force directions with magnitudes from 0.10 mN to 21.07 mN are calibrated. Each trial follows the same procedure as described in Section IV-B. In total, 853459 samples are recorded. The calibration analysis consists of three parts: linear global calibration for transverse forces, linear local calibration for axial force in a certain region, and nonlinear global calibration for axial force.
1) Linear Calibration for Transverse Forces
The following coefficient matrix is calculated as the solution of the least squares problem stated in Section III-A:
| (17) |
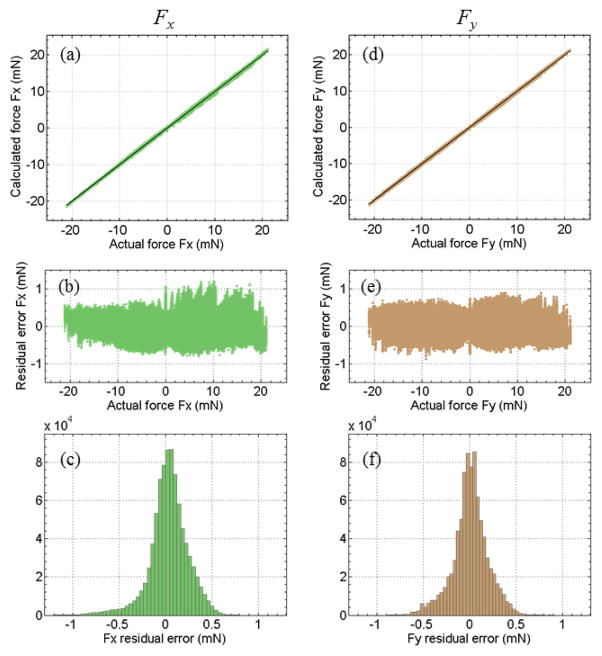
The wavelength resolution of the FBG interrogator is 1 pm. It propagates to a transverse force resolution of about 0.083 mN. Fig. 8 illustrates the linear fitting results. Fig. 8(a) and (d) show the estimated transverse forces versus the actual forces. An ideal fit would yield a 45° straight line through the origin (slope = 1). The estimation of both Fx and Fy is consistent with the actual value. Fig. 8(b) and (e) show the residual error versus the actual force. The root mean square (RMS) error is 0.21 mN for Fx and 0.19 mN for Fy. Fig. 8(c) and (f) illustrate the probability distribution of the fitting residual errors for Fx and Fy. The probability of large estimation error over 0.5 mN is very low.
Fig. 8.
The calculated transverse force along X-axis Fx versus the actual value using linear fitting (a), its residual error (b), and the histogram of the residual error of Fx (c). The calculated transverse force along Y-axis Fy versus the actual value using linear fitting (d), its residual error (e), and the histogram of the residual error of Fy (f).
2) Linear Calibration for Axial Forces
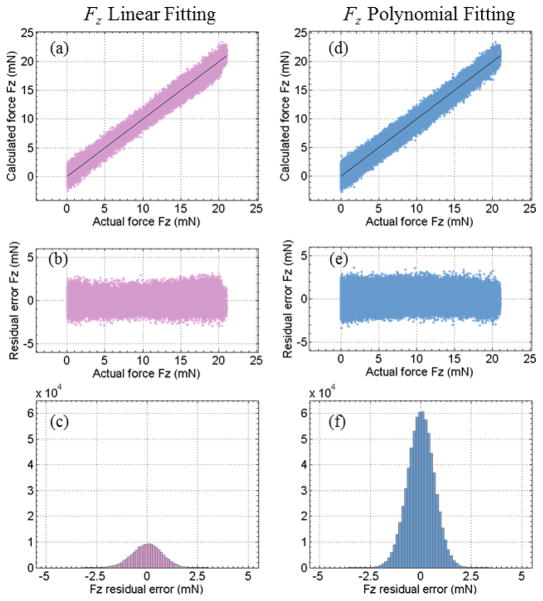
The first attempt using Equation (5) does not provide an adequate global linear fitting for axial force, because the linearity assumption does not hold when large transverse forces are applied, as discussed in Section II and III. However, it is possible to obtain a linear fitting for the calibration data subset with the sweep angle β ≤ 15°:
| (18) |
which indicates an axial force resolution of about 0.44 mN. The sample count is 138872. Fig. 9(a) shows the estimated axial force versus the actual axial force. The residual error is independent of the force magnitude, as shown in Fig. 9(b). While the residual error spans approximately ±3 mN, the RMS error is 0.74 mN. Fig. 9(c) illustrates the probability distribution of the residual error. Most of the residual errors stay within ±2 mN range. Within the sweep angle region β ≤ 15°, which is equivalent to a cone with a vertex angle of 30°, the linear fitting provides an adequate estimation for the axial force. This also verifies our hypothesis described in Section III-B-1. However, it imposes undesired workspace constraints for the 3-DOF force sensing instrument. Hence a polynomial method is attempted to achieve an improved global estimate.
Fig. 9.
The calculated axial force Fz versus the actual value using linear fitting with the samples with sweep angle β less than 15° (a), its residual error (b), and the histogram of the residual error (c). The calculated axial force Fz versus the actual value using second-order Bernstein polynomial fitting with all calibration data (d), its residual error (e), and the histogram of the residual error (f).
3) Nonlinear Calibration for Axial Forces
Second-order Bernstein polynomials provide a useful global fitting for all calibration data, as shown in Fig. 9(d). The Bernstein coefficient vector C derives an axial force resolution of about 0.46 mN. The magnitude of the residual error remains fairly constant across the entire force magnitude range, as shown in Fig. 9(e). Fig. 9(f) illustrates the probability distribution of the residual error. Although the residual error spans approximately ±3.5 mN, the overall RMS error is 0.67 mN. The global polynomial fitting provides smaller RMS error than the local linear fitting.
In order to investigate the relationship between the estimation residual error and the force direction, we calculate the RMS error in each calibration direction. Fig. 10 illustrates the RMS error in each calibration direction mapped onto a unit sphere as well as onto the α-β angle grid. The squares with the angle values of multiples of 15° provide the RMS error calculated from the calibration data, while other squares are interpolated from the neighbor squares that are calculated from the calibration data. Among the 168 calibration directions, 84.5% fall below 0.75 mN while only 3.6% lie above 1 mN. The RMS error is relatively small when the force direction is close to pure axial (α=0°) or pure transverse (α=90°). But when the axial and transverse components are comparable, i.e. the force direction is close to “diagonal”, the RMS error becomes larger. This is probably due to the imperfect decoupling between the axial and transverse forces.
Fig. 10.
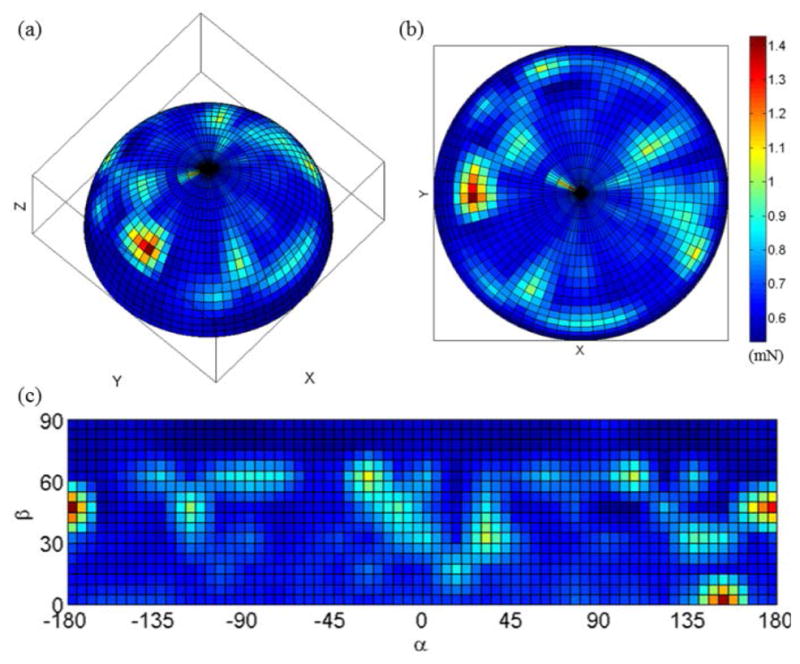
RMS error of polynomial fitting in each calibration direction plotted on spherical coordinates with ISO view (a) and with top view (b), as well as on α-β angle grid (c).
Third-order Bernstein polynomial fitting is also tested to explore the fitting performance of higher order polynomials. It yields similar results as a second-order polynomial. The residual error range is approximately ±3.5 mN and the RMS error is 0.62 mN. This shows that a second-order polynomial is an appropriate model to estimate the axial force. We propose a hybrid force calculation algorithm that uses a linear model for transverse force calculation, and a second-order Bernstein polynomial for axial force calculation, as shown in Fig. 11.
Fig. 11.
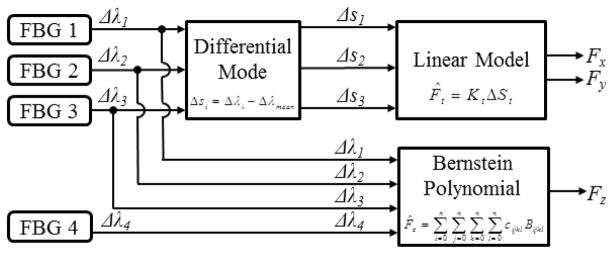
Hybrid force calculation algorithm uses linear model to estimate transverse forces and a second-order Bernstein polynomial to estimate axial force.
D. Validation
The purpose of the next experiment is to validate whether the force calculation algorithms with the constant coefficients obtained from the calibration can provide reliable force estimation. The linear model for transverse force sensing has demonstrated robust performance with the previous 2-DOF force sensing instruments. We first validate the performance of the polynomial fitting method over the space that was not included in the calibration, and then test the 3-DOF force measurements with random forces.
1) Interpolation Validation for Nonlinear Axial Force Calculation
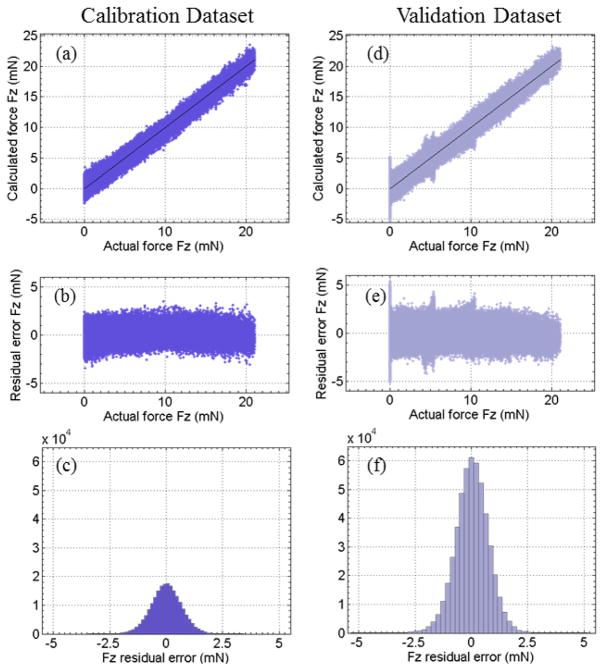
In order to test whether the second-order Bernstein polynomial can provide a suitable interpolation for the axial force over the 3D space, the data set used for fine calibration in Section IV-C is divided into a coarse calibration data set and a validation data set. The coarse calibration data set includes 48 force directions with 12 roll angles α ranging from 0° to 330° with 30° intervals, and four sweep angles β ranging from 0° to 90° with 30° intervals. The validation data set consists of the remaining 120 force directions. The Bernstein coefficient vector Cc is computed using the coarse calibration data set. The axial force estimation for both coarse calibration and validation data sets are then calculated using these coefficients. Fig. 12 illustrates the estimated axial force versus the actual axial force, the residual error, and the error probability distribution for the coarse calibration and the validation data sets. Although the coarse calibration data set is relatively small and sparse, the polynomial model still provides an adequate interpolation over the unexplored space. The RMS error of the coarse calibration is 0.67 mN, while the RMS error of the validation is 0.74 mN. The residual error spans ±3.5 mN for the coarse calibration, and about ±5 mN for the validation. With the complete fine calibration data set, the worst case fitting error can be reduced.
Fig. 12.
Axial force nonlinear fitting for the coarse calibration data set: the calculated axial force versus the actual axial force (a), the residual error (b), and the histogram of the residual error (c). Axial force nonlinear estimation for the validation data set: the estimated axial force versus the actual axial force using a second-order Bernstein polynomial with the coefficients obtained from the coarse calibration data set (d), the residual error (e), and the histogram of the residual error (f).
2) Randomized Validation for 3D Force Calculation
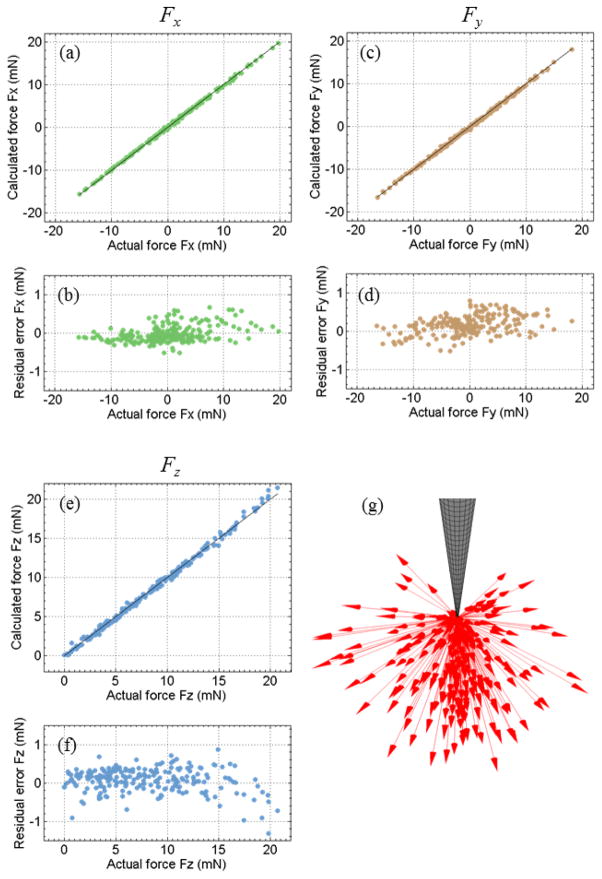
In this experiment, the force direction (roll and sweep angles) and magnitude are randomized. The robot first orients the 3-DOF force sensing instrument in the desired direction, and then adjusts its height to reach the desired force magnitude. In total, 236 random force samples are tested, as shown in Fig. 13(g). The roll angle α ranges from 1.22° to 358.82°, the sweep angle β ranges from 0° to 89.90°, and the force magnitude spans from 2.8 mN to 21.09 mN. The linear model with the coefficient matrix Kt obtained from the fine calibration is used to estimate the transverse forces, and the second-order Bernstein polynomial with the coefficient vector C obtained from the fine calibration is used to estimate the axial force. Fig. 13 shows the estimated force components Fx, Fy, and Fz versus their actual values as well as the residual errors. The estimation of all three force components is very consistent with the actual values. The RMS errors are 0.21 mN, 0.28 mN, and 0.31 mN for Fx, Fy, and Fz, respectively. They are consistent with the calibration results.
Fig. 13.
Estimated forces using the hybrid force calculation algorithm versus actual forces for Fx (a), Fy (c), and Fz (e), and the residual errors of Fx (b), Fy (d), and Fz (f). All force vectors of the randomized validation are shown in (g).
The validation experiments demonstrate that the 3-DOF force sensing instrument with the hybrid force calculation algorithm can provide accurate measurements with desired sensitivity and precision.
E. Compression Experiments
The experiments described in previous sections were conducted with the experiment setup that can only apply tension forces. We modified the experiment setup described in Section IV-A in order to apply compression forces. Fig. 14 (a) and (b) show the setup for compression experiments. Instead of pulling a weight away from the scale, the tool now pushes onto the scale through a leaf spring. The leaf spring reduces the combined spring constant together with the scale, and provides a safety clearance between the tool and the scale. First, a compression calibration experiment is carried out with the 3-DOF force sensing instrument in order to obtain the Bernstein polynomial coefficients for compression. Then, a randomized validation experiment with compression forces is conducted to validate the calibration results.
Fig. 14.
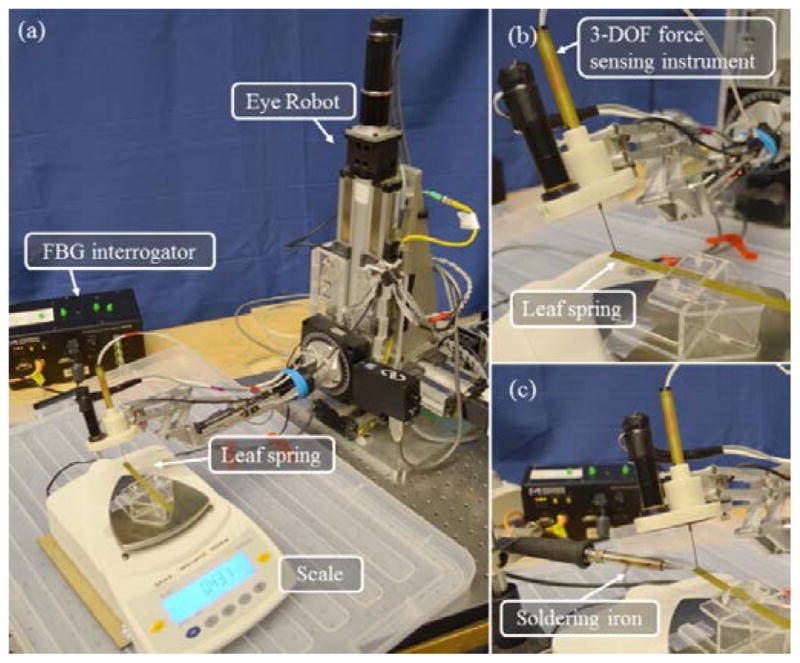
Experiment setup for applying compression forces with a leaf spring (a), the close-up view (b), and experiment setup to test the temperature compensation algorithm (c). A soldering iron is used as a heat source to modify the temperature. Calibration chamber is not shown.
1) Compression Calibration
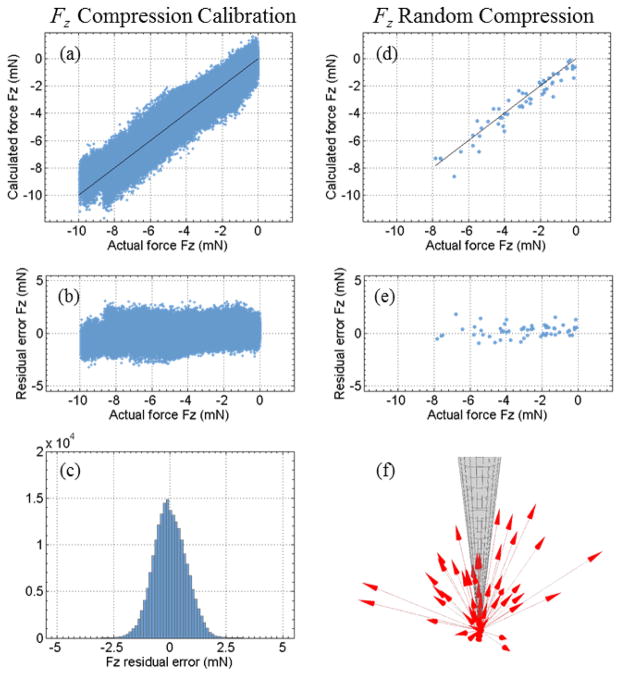
The compression calibration includes 204394 samples in 144 force directions, with the roll angle α ranging from 0° to 345° with 15° intervals, and the sweep angle β ranging from 0° to 75° with 15° intervals. The force magnitude spans from 0 to 10 mN. Coefficients of a second-order Bernstein polynomial are calculated with the calibration data. An axial force resolution of 0.41 mN is derived from the Bernstein coefficients. Fig. 15 (a) shows the estimated axial force versus the actual axial force. Fig. 15 (b) illustrates that the residual error remains approximately the same bandwidth across the entire force magnitude range. The probability distribution of the residual error is shown in Fig. 15 (c). The residual error spans approximately ±3.2 mN, while the overall RMS error is 0.71 mN. These results show the nonlinear model is also suitable for estimating compression forces.
Fig. 15.
Axial force nonlinear fitting for the compression calibration data set: the calculated axial force versus the actual axial force (a), the residual error (b), and the histogram of the residual error (c). Axial force nonlinear estimation for the validation data set of random compression forces: the estimated axial force versus the actual axial (d), the residual error (e), and compression force vectors applied in the random validation experiment (f).
2) Randomized Validation with Compression Forces
In this experiment, random compression forces are applied in order to validate the compression calibration results and to test the performance of the nonlinear model for calculating axial compression forces. Fig. 15 (f) illustrates the 57 random compression force samples applied in the experiment. The roll angle α ranges from 0.12° to 88.53°, the sweep angle β ranges from 5.00° to 347.95°, and the force magnitude spans from 0.12 to 8.80 mN. Fig. 15 (a) and (b) illustrate the estimated axial force versus the actual axial force, and the residual error, respectively. The second-order Bernstein polynomial with the coefficients obtained from the compression calibration estimates the axial compression forces with a RMS error of 0.62 mN in this random compression experiment.
F. Temperature Compensation
This experiment is to test and to evaluate the temperature compensation algorithm for axial force calculation proposed in Section II-B-3. In the compression experiment setup, a soldering iron is carefully placed close to the leaf spring, as shown in Fig. 14 (c). It is used as a heat source to change the temperature. The experiment is carried out in two steps:
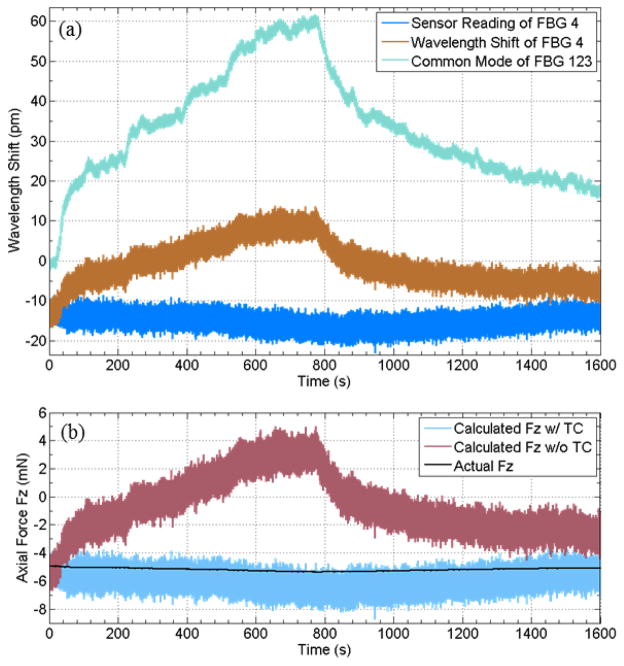
The first step is a temperature calibration to test the hypothesis of the linear correlation between the inner FBG sensor and the common mode of the outer FBG sensors. The tip of the 3-DOF force sensing instrument is positioned very close above the leaf spring, with no forces exerted between them. The soldering iron is turned on for approximately 10 minutes and then turned off for approximately 10 minutes. The wavelength shifts of all four FBG sensors are solely subject to temperature variation. The covariance between the wavelength shift of the inner FBG sensor and the common mode (average) of the outer FBG sensors is 0.95, indicating the hypothesis is approximately correct. The slope κ of the linear temperature correlation defined in Equation (12) is 0.43.
The second step is to lower the 3-DOF force sensing instrument to apply a compression force load. The soldering iron is then turned on for approximately 13 minutes and then turned off for approximately 14 minutes. The total temperature change at the instrument tip is about 2.5 °C. Fig. 16 (a) illustrates the increase and the decrease of both wavelength shifts of the inner FBG sensor and the common mode of the outer FBG sensors during the heating and cooling, respectively. The sensor reading of the inner FBG sensor, which is calculated using Equation (12), rejects this thermal drift, as shown in Fig. 16(a). Fig. 16 (b) shows the axial force calculated with temperature compensation using Equation (13), the axial force calculated without temperature compensation using Equation (6), and the actual axial force measured with the scale. While the axial force calculated without temperature compensation drifts along the temperature variation, the axial force calculated with temperature compensation remains close to the actual axial force with an RMS error of 0.92 mN. The experiment results show that the temperature compensation method can suppress the thermal drift of the inner FBG sensor, and provide an adequate estimate of the axial force under temperature variation.
Fig. 16.
Results of the experiment to test temperature compensation for axial force calculation. The wavelength shift and sensor reading of the inner FBG sensor, and the common mode of the outer FBG sensors versus time (a). The axial force calculated with temperature compensation, the axial force calculated without temperature compensation, and the actual axial force versus time (b).
V. Discussion
A. Temperature Compensation
Previous study [16] has shown that transverse force measurements are robust against temperature variation. The proposed temperature compensation for axial force sensing demonstrates an adequate estimate within a small temperature fluctuation. It can be incorporated into the hybrid force calculation algorithm shown in Fig. 11. The updated hybrid force calculation algorithm with temperature compensation for all 3 DOFs is illustrated in Fig. 17.
Fig. 17.
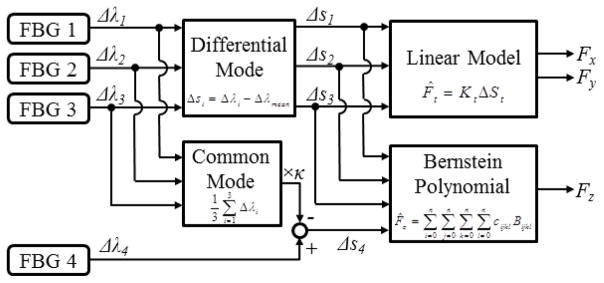
Hybrid force calculation algorithm with temperature compensation. Sensor readings Δs are used to replace wavelength shifts Δλ in order to calculate forces.
In practice, another measure that can alleviate the thermal drift is a rebias of the force sensor to adapt to the current temperature level before taking the measurements. During an in vivo experiment, the temperature change inside the rabbit eye is considered to be minimal, so rebiasing the force sensor at the beginning inside the rabbit eye may improve the effectiveness of the temperature compensation algorithm.
There are several additional measures that might improve temperature robustness, including the addition of a separate reference FBG [31], using two different wavelengths [32], or using different optical modes [33][34]. We will explore these possibilities and incorporate a more robust and effective temperature compensation method into the next iteration of the 3-DOF force sensing instrument.
B. Tool Fabrication and Assembly
The current prototyping process does not guarantee machine level assembly precision due to the manual assembly process involved. To allow human users to assemble the tool manually, the part tolerances are designed to be relatively large. In addition, the manual assembly process is prone to human error and cannot deliver consistent quality.
The current prototype, as a proof of concept, has demonstrated consistent force sensing performance under more than 1000 load/unload cycles. We are confident that utilizing micro-machining and MEMS manufacturing technology can improve the fabrication quality and further reduce the size of the force sensor. With mass production, the cost of the force sensing instrument can be dramatically reduced so that it could become disposable.
VI. Conclusion
We have developed a novel sub-millimetric 3-DOF force sensing pick instrument for vitreoretinal surgery based on FBG sensors. Our design uses four FBG sensors to maximize the decoupling between axial and transverse force sensing and a super elastic nitinol flexure to achieve high sensitivity for axial force measurements. We have proposed a hybrid force calculation algorithm that uses a linear model and second-order Bernstein polynomial to estimate the transverse forces and the axial force, respectively. A temperature compensation method is devised to alleviate the thermal drift of axial force sensing. In order to characterize the force sensing performance, we have developed an automated calibration system based on the Steady-Hand Eye Robot and a precision scale. Experiments sensor, to validate the force sensing performance, and to investigate the temperature compensation method. The experiment results show that the 3-DOF force sensing pick instrument with the hybrid force calculation algorithm can provide reliable repeatability, high sensitivity, sufficient precision, and adequate temperature robustness for micro force measurement in retinal microsurgery. Table II lists the main performance criteria obtained from the calibration experiments.
TABLE II.
Summary of the Calibration Results (unit: millinewton)
| Model | Range | Resolution | RMS error | Max error | ||
|---|---|---|---|---|---|---|
| Min | Max | |||||
| Fx | Linear | −20 | +20 | 0.083 | 0.21 | 1.2 |
| Fy | Linear | −20 | +20 | 0.083 | 0.19 | 0.88 |
| +Fz (Pull) | Nonlinear | 0 | +20 | 0.49 | 0.67 | 3.5 |
| −Fz (Push) | Nonlinear | −10 | 0 | 0.41 | 0.71 | 3.2 |
The 3-DOF force sensing pick instrument either can be used free-hand or can be incorporated with the Steady-Hand Eye Robot to implement various robotic force feedback and force control methods [27] to potentially assist difficult microsurgical tasks. The capability of 3D force measurement enables using these robot cooperative control laws without imposing constraints such as planar forces and planar motion. We will investigate the dynamic response of the 3-DOF force sensing pick instrument in future experiments. It will also be further evaluated in phantom studies and in in vivo experiments.
Acknowledgments
This research was supported in part by NIH BRP grant 1 R01 EB 007969, NIH grant R01 EB 000526, Wilmer Eye Institute’s Research to Prevent Blindness, and in part by Johns Hopkins University internal funds. Other equipment and systems infrastructure support were developed within the CISST ERC under NSF grant EEC9731748.
Contributor Information
Xingchi He, Email: xingchi.he@jhu.edu, Mechanical Engineering Department, Johns Hopkins University, Baltimore, MD 21218 USA.
James Handa, Department of Ophthalmology, Johns Hopkins School of Medicine, Baltimore, MD 21287 USA.
Peter Gehlbach, Department of Ophthalmology, Johns Hopkins School of Medicine, Baltimore, MD 21287 USA.
Russell Taylor, Computer Science Department, Johns Hopkins University, Baltimore, MD 21218 USA.
Iulian Iordachita, Mechanical Engineering Department, Johns Hopkins University, Baltimore, MD 21218 USA.
References
- 1.Gupta P, Jensen P, de Juan E. Surgical forces and tactile perception during retinal microsurgery. MICCAI. 1999;1679:1218–1225. [Google Scholar]
- 2.Menciassi A, Eisinberg A, Scalari G, Anticoli C, Carrozza M, Dario P. Force feedback-based microinstrument for measuring tissue properties and pulse in microsurgery. IEEE ICRA. 2001;1:626–631. [Google Scholar]
- 3.Bell B, Stankowski S, Moser B, Oliva V, Stieger C, Nolte L-P, Caversaccio M, Weber S. Integrating optical fiber force sensors into microforceps for ORL microsurgery. IEEE EMBC. 2010;2010:1848–1851. doi: 10.1109/IEMBS.2010.5625967. [DOI] [PubMed] [Google Scholar]
- 4.Zhang X. Silicon microsurgery-force sensor based on diffractive optical MEMS encoders. Sensor Review. 2004;24(1):37–41. [Google Scholar]
- 5.Seibold U, Kubler B, Hirzinger G. Prototype of Instrument for Minimally Invasive Surgery with 6-Axis Force Sensing Capability. IEEE ICRA. 2005:496–501. [Google Scholar]
- 6.Peirs J, Clijnen J, Reynaerts D, Van Brussel H, Herijgers P, Corteville B, Boone S. A micro optical force sensor for force feedback during minimally invasive robotic surgery. Sensors and Actuators A: Physical. 2004;115(2–3):447–455. [Google Scholar]
- 7.Puangmali P, Liu H, Seneviratne LD, Dasgupta P, Althoefer K. Miniature 3-Axis distal force sensor for minimally invasive surgical palpation. IEEE/ASME Trans Mechatron. 2012;17(4):646–656. [Google Scholar]
- 8.Valdastri P, Houston K, Menciassi A, Dario P, Sieber A, Yanagihara M, Fujie M. Miniaturized cutting tool With triaxial force sensing capabilities for minimally invasive surgery. Journal of Medical Devices. 2007;1(3):206–211. [Google Scholar]
- 9.Park WT, Kotlanka RK, Lou L, Hamidullah M, Lee C. MEMS tri-axial force sensor with an integrated mechanical stopper for guidewire applications. Microsystem Technologies. 2012 Nov;19(7):1005–1015. [Google Scholar]
- 10.Baki P, Székely G, Kósa G. Miniature tri-axial force sensor for feedback in minimally invasive surgery. Proc IEEE Int Conf Biomed Robot and Biomechatron. 2012:805–810. [Google Scholar]
- 11.Baki P, Székely G, Kósa G. Design and characterization of a novel, robust, tri-axial force sensor. Sens Actuators A Phys. 2013 Apr;192:101–110. [Google Scholar]
- 12.Polygerinos P, Seneviratne LD, Razavi R, Schaeffter T, Althoefer K. Triaxial catheter-tip force sensor for MRI-guided cardiac procedures. IEEE/ASME Trans Mechatron. 2013;18(1):386–396. [Google Scholar]
- 13.Song H, Kim K, Lee J. Development of optical fiber Bragg grating force-reflection sensor system of medical application for safe minimally invasive robotic surgery. The Review of Scientific Instruments. 2011 Jul;82(7):074301. doi: 10.1063/1.3606502. [DOI] [PubMed] [Google Scholar]
- 14.Berkelman P, Whitcomb L, Taylor R, Jensen P. A miniature instrument tip force sensor for robot/human cooperative microsurgical manipulation with enhanced force feedback. MICCAI. 2000:247–286. [Google Scholar]
- 15.Jagtap AS, Riviere CN. Applied force during vitreoretinal microsurgery with handheld instruments. Proc IEEE EMBC. 2004;4(1):2771–2773. doi: 10.1109/IEMBS.2004.1403792. [DOI] [PubMed] [Google Scholar]
- 16.Iordachita I, Sun Z, Balicki M, Kang JU, Phee SJ, Handa J, Gehlbach P, Taylor R. A sub-millimetric, 0.25 mN resolution fully integrated fiber-optic force-sensing tool for retinal microsurgery. IJCARS. 2009;4(4):383–390. doi: 10.1007/s11548-009-0301-6. [DOI] [PMC free article] [PubMed] [Google Scholar]
- 17.He X, Balicki M, Kang JU, Gehlbach P, Handa J, Taylor R, Iordachita I. Force sensing micro-forceps with integrated fiber Bragg grating for vitreoretinal surgery. Proc SPIE Phontics West. 2012;8218-82180W:1–7. [Google Scholar]
- 18.Kuru İ, Gonenc B, Balicki M, Handa J, Gehlbach P, Taylor RH, Iordachita I. Force Sensing Micro-Forceps for Robot Assisted Retinal Surgery. Proc IEEE EMBC. 2012:1401–1404. doi: 10.1109/EMBC.2012.6346201. [DOI] [PMC free article] [PubMed] [Google Scholar]
- 19.Sunshine S, Balicki M, He X, Olds K, Kang JU, Gehlbach P, Taylor R, Iordachita I, Handa JT. A force-sensing microsurgical instrument that detects forces below human tactile sensation. RETINA. 2013;33(1):200–206. doi: 10.1097/IAE.0b013e3182625d2b. [DOI] [PMC free article] [PubMed] [Google Scholar]
- 20.Cutler N, Balicki M, Finkelstein M, Wang J, Gehlbach P, McGready J, Iordachita I, Taylor R, Handa JT. Auditory Force Feedback Substitution Improves Surgical Precision during Simulated Ophthalmic Surgery. IOVS. 2013;54(2):1316–24. doi: 10.1167/iovs.12-11136. [DOI] [PMC free article] [PubMed] [Google Scholar]
- 21.Liu X, Iordachita I, He X, Taylor R, Kang JU. Miniature fiber-optic force sensor based on low-coherence Fabry-Pérot interferometry for vitreoretinal microsurgery. Biomedical Optics Express. 2012;3(5):1062–1076. doi: 10.1364/BOE.3.001062. [DOI] [PMC free article] [PubMed] [Google Scholar]
- 22.Trejos A, Patel R, Naish M. Force sensing and its application in minimally invasive surgery and therapy: a survey. Journal of Mechanical Engineering Science. 2010;224:1435–1454. [Google Scholar]
- 23.Mitchell B, Koo J, Iordachita I, Kazanzides P, Kapoor A, Handa J, Hager G, Taylor R. Development and application of a new steady-hand manipulator for retinal surgery. IEEE International Conference on Robotics and Automation; 2007. pp. 623–629. [Google Scholar]
- 24.Uneri A, Balicki MA, Handa J, Gehlbach P, Taylor RH, Iordachita I. New Steady-Hand Eye Robot with micro-force sensing for vitreoretinal surgery. IEEE BioRob. 2010:814–819. doi: 10.1109/BIOROB.2010.5625991. [DOI] [PMC free article] [PubMed] [Google Scholar]
- 25.He X, Roppenecker D, Gierlach D, Balicki M, Olds K, Gehlbach P, Handa J, Taylor R, Iordachita I. Toward clinically applicable Steady-Hand Eye Robot for vitreoretinal surgery. Proc ASME IMECE 2012. 2012;IMECE2012:88384. [Google Scholar]
- 26.He X, Balicki M, Gehlbach P, Handa J, Taylor R, Iordachita I. A Novel Dual Force Sensing Instrument with Cooperative Robotic Assistant for Vitreoretinal Surgery. IEEE ICRA. 2013:213–218. doi: 10.1109/ICRA.2013.6630578. [DOI] [PMC free article] [PubMed] [Google Scholar]
- 27.Balicki M, Uneri A, Iordachita I, Handa J, Gehlbach P, Taylor R. Micro-force sensing in robot assisted membrane peeling for vitreoretinal surgery. MICCAI. 13:303–310. doi: 10.1007/978-3-642-15711-0_38. [DOI] [PMC free article] [PubMed] [Google Scholar]
- 28.Othonos A, Kalli K. Fiber Bragg Gratings. Artech House; 1999. [Google Scholar]
- 29.NDC. Material data sheet of superelastic nitinol alloys. 2012 [Online]. Available: http://www.nitinol.com/wp-content/uploads/2012/01/Material-Data-Sheet-Superelastic.pdf.
- 30.Gerald F. Curves and Surfaces for Computer Aided Geometric Design. 4. Academic Press; 1996. [Google Scholar]
- 31.Kersey A, Berkoff T, Morey W. Fiber-optic Bragg grating strain sensor with drift-compensated high-resolution interferometric wavelength-shift detection. Optics letters. 1993;18(1):72–4. doi: 10.1364/ol.18.000072. [DOI] [PubMed] [Google Scholar]
- 32.Xu M, Dong L, Reekie L. Temperature-independent strain sensor using a chirped Bragg grating in a tapered optical fibre. Electronics Letters. 1995;31(10):823–825. [Google Scholar]
- 33.James S, Dockney M, Tatam R. Simultaneous independent temperature and strain measurement using in-fibre bragg grating sensors. Electronics Letters. 1996;32(12):1133–1134. [Google Scholar]
- 34.Xu M, Archambault JL, Reekie L, Dakin JP. Discrimination between strain and temperature effects using dual-wavelength fibre grating sensors. Electronics Letters. 1994;30(13):1085–1087. [Google Scholar]


