

Abstract
With the wide use of small animals for biomedical studies, in vivo small-animal whole-body imaging plays an increasingly important role. Photoacoustic tomography (PAT) is an emerging whole-body imaging modality that shows great potential for preclinical research. As a hybrid technique, PAT is based on the acoustic detection of optical absorption from either endogenous tissue chromophores, such as oxy-hemoglobin and deoxy-hemoglobin, or exogenous contrast agents. Because ultrasound scatters much less than light in tissue, PAT generates high-resolution images in both the optical ballistic and diffusive regimes. Using near-infrared light, which has relatively low blood absorption, PAT can image through the whole body of small animals with acoustically defined spatial resolution. Anatomical and vascular structures are imaged with endogenous hemoglobin contrast, while functional and molecular images are enabled by the wide choice of exogenous optical contrasts. This paper reviews the rapidly growing field of small-animal whole-body PAT and highlights studies done in the past decade.
Keywords: Photoacoustic tomography, photoacoustic macroscopy, computed tomography, small animal whole body imaging, anatomical imaging, functional imaging, molecular imaging, metabolic imaging, kidney perfusion, fluorescent protein, nanoparticle distribution
I. INTRODUCTION
Small Animals, especially mice, are widely used in biomedical research for studying and modeling the progression of human diseases and the response to potential therapies. During the past thirty years, there has been an exponential increase in the number of scientific publications on small-animal models [1]. Compared with slicing and staining numerous sacrificed animals at multiple time points, in vivo whole-body imaging allows researchers to follow biological processes and disease progression more accurately [2]. In response, many clinical whole-body imaging modalities, such as magnetic resonance imaging (MRI), positron electron tomography (PET), and X-ray computed tomography (CT), have evolved preclinical counterparts with higher spatial resolution. However, these techniques have their own limitations on small-animal research. For instance, micro MRI requires a costly high magnetic field to achieve high spatial resolution and suffers from slow data acquisition [3]; micro X-ray CT and PET utilize ionizing radiation, which may confound longitudinal observations [4]; and ultrasound biomicroscopy (UBM) [5] has low acoustic-impedance contrast among soft tissues. Pure optical imaging modalities have also been widely used in small-animal whole-body research; however, they are afflicted with either limited penetration depth, requiring slicing sacrificed animals [2, 6], or very poor spatial resolution (>1 mm) [7].
Recently, there has been increasing interest in whole-body photoacoustic tomography (PAT). PAT utilizes non-ionizing laser illumination to generate an internal temperature rise, which is subsequently converted to pressure via thermoelastic expansion. The pressure waves are detected by ultrasonic transducers, and the temporal signals are reconstructed to form an image of the optical absorbers. The conversion to acoustic waves enables photoacoustic tomography to generate high-resolution images in both the optically ballistic and diffusive regimes [8, 9]. Combining endogenous and exogenous contrasts, PAT can provide anatomical, functional, and molecular assessments in a single modality. Anatomical structures can be imaged based on endogenous hemoglobin contrast. Hemoglobin can also serve as a functional contrast for imaging hemoglobin oxygen saturation (sO2) [10], speed of blood flow [11, 12], and metabolic rate of oxygen [13]. Molecular imaging is enabled by the broad choice of labeling dyes [14], nanoparticles [15], and proteins [16, 17]. These unique advantages position whole-body PAT to make a broad impact in preclinical medical research and life sciences.
Over the past few years, several small-animal whole-body PAT systems, employing different light illumination and detection schemes, have been developed [18–21]. In this paper, we review different photoacoustic whole-body imaging techniques and highlight studies done in the past decade. While whole-body imaging includes both brain and trunk imaging, this review focuses on trunk imaging. Recent reviews on photoacoustic brain imaging can be found in references [22, 23]. Nevertheless, most of the systems discussed in this review can image the brain with little or no modifications.
II. PAT principles and image reconstruction
Following short laser pulse excitation, PAT signal originates from optical absorption in tissue. The laser pulse duration is normally within several nanoseconds, which is less than both the thermal and stress confinement times. The initial photoacoustic pressure in an object can then be expressed by [24]
| (1) |
where Γ is the Grüneisen parameter, μa optical absorption coefficient, and F is the local fluence. Based on the photoacoustic signals received at multiple detecting positions, the distribution of in the object can be reconstructed.
Several image reconstruction algorithms have been developed for PAT in the past few years [25–28], and reviews of the subject are available in references [29, 30]. For three canonical detection geometries—planar, cylindrical, and spherical—the universal back-projection (UBP) algorithm [25] offers exact reconstruction and is the most widely used. UBP's time-domain formulation can be expressed as
| (2) |
Here Ω0 is the solid angle of the whole detection surface S with respect to a given source point at , is the pressure received at detecting position and time t and vs is the speed of sound. Eq. (2) indicates that can be obtained by back-projecting the filtered data— —onto collection of concentric spherical surfaces that are centered at each transducer location is the weighting factor applied to each back-projection.
The time-reversal (TR) method is another widely used reconstruction algorithm [31]. Compared to UBP, the TR method can be used in arbitrarily closed surfaces and can incorporate acoustic heterogeneities [32]. In the TR method, one imposes zero initial conditions at time T and boundary conditions equal to the measured data. Here T is the maximum time for the wave to traverse the detection domain. The wave equation is then solved in the reversed time direction (from t = T to t = 0) using numerical methods, such as finite difference techniques [33]. An open source MATLAB toolbox for TR reconstruction has been made available by Treeby et al.[33]
It should also be noted that most image reconstruction algorithms assume point-like ultrasonic transducers with an infinite temporal-frequency bandwidth. In practice, however, the photoacoustic pressure waveform is always degraded by the finite aperture size [28, 34, 35] and the finite bandwidth [36–38] of the transducer. Therefore, directly applying these algorithms to experimental data may cause artifacts. To compensate for transducer degradations, iterative image reconstruction algorithms have been developed based on the transducer characteristics, which are described by time invariant linear systems with the transducer's spatial impulse response and acousto-electric impulse response as convolution kernels [36]. On the basis of these comprehensive imaging models, more accurate images have been reconstructed using iterative image reconstruction algorithms [34, 36].
III. Whole-body PAT systems and representative images
A. Planar-view PAT
Planar-view imaging systems scan over a two-dimensional (2D) surface to provide three-dimensional (3D) images of the object. Deep reflection-mode photoacoustic macroscopy (Deep-PAMac) was one of the first photoacoustic systems to image rats at the organ level [39, 40]. Figure 1a shows the schematic of the system. A dark-field ring-shaped illumination is formed by a concave lens, a spherical conical lens, and an optical condenser in tandem. This illumination has a great advantage over bright-field illumination in that it can reduce the generation of surface photoacoustic signals and improve the detection of deep photoacoustic signals. The excitation light is delivered in free space using prisms, which maximize the light delivery efficiency compared to fiber optical light delivery. The ultrasound transducer has a 5 MHz central frequency and is spherically focused. At its focal point, the transverse resolution (~560 μm) can be estimated by 1.4λf/d, where λ is the acoustic wavelength, f is the focal length, and d is the diameter of the active element. The axial resolution (~144 μm) is spatially invariant and determined by the transducer's bandwidth and central frequency, which are ultimately limited by the desired maximum imaging depth in tissue. Using a spherically focused transducer, one assumes that the received photoacoustic signals are all generated along the axial line of the transducer, and therefore image reconstruction is not necessary. However, advanced reconstruction algorithms, such as virtual-detector image reconstruction [41], can sustain transverse resolution along the axial direction over a broader interval.
Figure 1.

a. Schematic of the deep reflection-mode photoacoustic imaging system. b. Sagittal photoacoustic MAP image of the blood vessels around the ribs and the liver. c. Sagittal photoacoustic MAP image of the kidney, the vena cava inferior, and the spinal cord. d. Anatomical photograph with the ribs (RB) intact, but the skin removed. e. Anatomical photograph with the skin and the ribs removed. The photographs and photoacoustic images were obtained from the right side of the rat. AA, arcuate blood vessels; IB, interlobar blood vessels; IT, intestines; KN, kidney; LF, lumbodorsal fascia; LV, liver; RV, blood vessels around ribs; SC, blood vessels in the spinal cord; and VC, vena cava inferior. Reproduced with permission from ref. [23].
Figures 1b–1e show in situ images of a rat's kidney region. To reveal structures at different depths, the 3D volumetric images were divided into two sections, above and below the top surface of the kidney. Maximum amplitude projection (MAP) was then performed within each section. Figure 1b shows a MAP image of the liver (LV) and blood vessels around the ribs (RV), and Figure 1c shows a MAP image of the kidney (KN), spinal cord (SC) and vena cava (VC). The structures agree well with the corresponding anatomical photographs (Figures 1d and 1e).
Instead of using piezoelectric transducers, photoacoustic signals can also be detected optically using a Fabry-Perot interferometer (FPI) [42]. The FPI sensor is transparent and can be attached to the surface of the object without blocking the excitation laser (Figure 2a). A focused probe beam from a 1550-nm continuous-wave laser raster-scans over the surface of the sensor to map the distribution of the photoacoustic waves arriving at the sensing film. This configuration is equivalent to scanning an unfocused single-element piezoelectric transducer with an active area equaling the size of the focal spot (22 μm). Unlike Deep-PAMac, volumetric image reconstruction is required because of the unfocused detector. The axial resolution (27 μm) of the system is spatially invariant and determined mainly by the bandwidth and central frequency of the sensor [43]. The lateral resolution (~120 μm) depends on the detection aperture, the effective acoustic element size, and the bandwidth of the sensor.
Figure 2.

(a) Schematic illustrating the operation of the photoacoustic imaging system. Photoacoustic waves are generated by the absorption of nanosecond optical pulses provided by a wavelength-tunable OPO laser and detected by a transparent Fabry-Perot polymer film ultrasound sensor. The sensor comprises a pair of dichroic mirrors separated by a 40 μm thick polymer spacer thus forming a Fabry-Perot interferometer (FPI). The waves are mapped in 2D by raster-scanning a CW focused interrogation laser beam across the sensor and recording the acoustically induced modulation of the reflectivity of the FPI at each scan point. (b)–(e) In situ images of the abdomen of a pregnant female mouse containing two embryos for different depth ranges. The excitation wavelength was 640 nm and the step size was 115 μm. (b) x – y MAP of complete 3-D image data set (depth 0 to 6 mm) showing the two embryos (shaded red), (c) x – y MAP for depths of 0 to 1 mm showing the blood vessel network in the abdominal skin and the uterus. (d) x – y MAP for depths of 1 to 3 mm. This shows the anatomy of the two embryos. The right atrium, the pulmonary vein, and the vessels in the embryo head are evident as are organs such as the liver and parts of the developing skeleton, such as the ribs. (e) x – y MAP for depths of 3 to 6 mm showing vascular features such as the abdominal aorta, the Azygos vein, and the inferior vena cava. The spinal region, which contains the intercostal arteries, is also visible. Reproduced with permission from ref. [42].
Figures 2b to 2e show in situ images of the abdomen of a pregnant mouse containing two embryos [42]. The images were reconstructed using the time-reversal algorithm [33]. In the 0–6 mm depth MAP image (Figure 2b), two embryos (shaded red) can be seen along with the vasculature of the uterus and the skin. As in Deep-PAMac studies, MAP over different depth ranges can be performed to distinguish different structures. Figure 2c shows the MAP for 0 to 1 mm depths, where the maternal blood vessel network in the abdominal skin and the uterus can be seen. Figure 2d (MAP for 1 to 3 mm depths) clearly shows the vasculature of the embryo. Blood vessels in the head and the developing skeleton can also be identified. The abdominal aorta and the Azygos vein of the embryo can be seen in deeper regions (Figure 2e), where the spines of the two embryos are also visible.
Planar-view PAT can also be performed using commercial linear [44, 45], phased [45], or 2D matrix [46] ultrasonic transducer arrays. These systems have the advantage of simultaneous acquisition of ultrasonic B-mode and photoacoustic images. The handheld probe also simplifies animal handling and the experimental procedure. However, photoacoustic imaging in these systems is still suboptimum in terms of light illumination [47], detection coverage [48] and receiving sensitivity [49]. Further improvements are still needed in order to match the image quality of dedicated PAT systems.
B. Circular-view PAT
Circular-view PAT has a detection geometry analogous to MRI and X-ray CT. There are currently two circular-view PAT systems: multispectral optoacoustic tomography system (MOTS) [21, 50] and ring-shaped confocal photoacoustic computed tomography (RC-PACT) [51].
Figure 3a shows the schematic of whole-body MOTS. The system is built around a custom-made 64-element transducer array with 5 MHz central frequency. The array covers an angle of 172° around the object. Each element in the array is shaped to create a cylindrical focus at 40 mm. The theoretical resolution is estimated to be 150 μm in plane and 800 μm in elevation. The excitation laser beam is guided into a fiber bundle consisting of 630 fibers partitioned into 10 arms. The 10 arms are evenly positioned around the animal, creating a ring-shaped illumination pattern of 7 mm width. The animal is held inside a water-impenetrable membrane, which is optically and acoustically transparent. Figures 3b–3d show a stack of single-wavelength photoacoustic images from different parts of a mouse. The kidneys, spine, spleen, and brain can be identified. Due to the limited detection view, structures located on the other side of the array (top portion of the images) are not clear. The fiber optical illumination also degrades the light delivery efficiency.
Figure 3.

(a). Schematic drawing of the multispectral optoacoustic tomography system (MOTS). A curved array of wide-band and cylindrically focused ultrasound transducers enables parallel data acquisition. Optical fibers are used to homogeneously illuminate the object. (b)–(d). MOTS images of mouse anatomy taken at 750 nm. 1, kidneys; 2, spine; 3, spleen; 4, vena cava; 5, liver; and 6, brain. Reproduced with permission from ref. [50].
RC-PACT addressed these problems by using a full-ring transducer array and free-space light delivery [51]. The system was built around a custom-made 512-element full-ring transducer array with 5 MHz central frequency and 5 cm ring diameter [52]. Each element in the array is shaped into an arc to produce an axial focal depth of 19 mm within the imaging plane. The combined foci of all elements generate a central imaging region of 20 mm diameter and 1 mm thickness. Within this region, the system has 100–250 μm tangential (transverse) resolution and 100 μm axial resolution. The homogenized laser beam is first converted into a ring-shaped light by a conical lens and then projected around the animal body using an optical condenser. The light band has a thickness of 5 mm, and its diameter is determined by the cross-sectional diameter (~2 cm) of the animal. The oblique light incidence allows a weak focus inside the animal body and minimizes the surface photoacoustic signal in the detection plane. As can be seen in the inset of Figure 4a, the optical focal region overlaps with the acoustic focal plane. This confocal design improves the efficiency of detecting photoacoustic signals generated in deep tissues. The animal is supported by high strength thin monofilament lines (0.13 mm diameter), which has minimum optical and acoustic interferences.
Figure 4.

Schematic of the ring-shaped confocal photoacoustic computed tomography (RC-PACT) system. The dashed box shows a cross-sectional view of the confocal design. (b)–(e) are in vivo RC-PACT images of athymic mice acquired noninvasively at various anatomical locations: (b) liver, (c) kidneys, (d) bladder, and (e) brain. BL, bladder; BM, backbone muscle; CV, cortical vessels; EY, eyes; GI, GI tract; KN, kidney; LV, liver; PV, portal vein; SC, spinal cord; SP, spleen; and VC, vena cava. Reproduced with permission from ref. [51].
Figures 4(b)–4(d) are in vivo cross sectional images acquired noninvasively using the ring-shaped light illumination. To mitigate image distortion due to acoustic heterogeneities in the animal body, half-time image reconstruction was utilized to form these images [53]. Blood-rich organs, such as liver, spleen, spine, kidneys, and GI tracts are clearly visible. Detailed vascular structures within these organs are also visible, indicating that RC-PACT can be used for angiographic imaging. With the help of contrast agents, organs with little blood can also be imaged. Figure 4(d) shows a bladder image, which was acquired 30 min after tail vein administration of IRDye800, a near-infrared dye.
By removing the conical lens and optical condenser, the system is converted into a top illumination system, which can be used for brain imaging [54, 55]. Figure 4(e) is an in vivo cortical vessel image acquired noninvasively using such a configuration. Mouse embryos [35] and newborn mice [20] can also be imaged using top illumination. The imaging speed of the RC-PACT system is 1.6 s per frame, limited by the 64-channel data acquisition (DAQ) system. Image reconstruction algorithms based on sparsely sampled data have been developed to address that issue [56, 57].
C. Spherical-view PAT
Compared to planar- and circular-view PAT, a spherical-view PAT system can provide nearly isotropic spatial resolution and is ideal for volumetric imaging. Figure 5a is a schematic of a photoacoustic whole-body tomography system with a hemispherical detection view [19]. The detector array consists of 128 ultrasonic transducer elements laid out in a spiral pattern on the hemispherical surface, with a 100 mm radius of curvature (Figure 5b). Each element has a central frequency of 5 MHz and a diameter of 3 mm. The detector bowl is mounted on a rotational stage capable of exact readout of the bowl's angular position. The spiral pattern ensures the elements' positions are uniformly distributed over the hemispherical surface after a 360 degree rotation (Figure 5c). The spatial resolution of the system was measured to be 400 μm at its central frequency [58]. Photoacoustic excitation was performed by an OPO laser tunable from 680 nm to 950 nm. The light passed through a clear aperture at the bottom of the detector bowl to illuminate the object. Before the experiment, an acoustically and optical transparent sample tray was mounted above the detector bowl and the animal was placed on the tray with the body partially immersed in water. Figure 5d is a MAP image of a mouse scan [19]. The kidney and spine can be clearly identified in the image.
Figure 5.

(a) Schematic of the photoacoustic scanner, showing the laser beam entering the bottom of the detector bowl and illuminating a mouse partially immersed in water and suspended above the bowl by a transparent tray. A beam splitter allows a portion of the laser beam to be monitored by a spectrometer for detection of laser power and wavelength. (b) The 128 radial projections captured by the detector geometry when data is collected for a single bowl angular position. (c) The increased density of projections available as the bowl is rotated through 360 degrees. (d) MAP image of mouse abdominal section. Reproduced with permission from ref. [19].
In another design, Reinecke et al. modified their original photoacoustic whole-body tomography system [59] and combined photoacoustic, thermoacoustic, and ultrasound imaging into one setup (Figure 6a) [60]. Figure 6b is a drawing of the 3D transducer array used for photoacoustic and thermoacoustic imaging. The custom-made array consists of 128 elements laid out on a cylindrical surface with 40 mm radius of curvature. Each element (1.8 mm × 2.0 mm) has a central frequency of 5 MHz and a bandwidth of more than 80%. It can be noticed that there are more elements located near the midpoint of the array. This design ensures a nearly uniform distribution of elements on the spherical surface after a full 360 degree rotation (Figure 6c). An OPO laser tunable from 680 to 950 nm was used as the photoacoustic light source. The laser light was coupled into an optical fiber bundle and then split into two beams (green lines, Figure 6a) that converged at the center of the imaging volume. Thermoacoustic excitation was delivered through two microwave waveguides mounted on the opposite sides of the water tank. The microwave source operated at 434 MHz, with a repetition rate of 10,000 Hz and pulse duration of 200 ns. The delivered microwave power was estimated to be 4 mJ per pulse. B-mode ultrasound imaging was performed by an 8 MHz linear ultrasound array with 128 elements. Volumetric ultrasound images were obtained by translating the animal in elevation. Figure 6d shows a co-registered MAP image combining three modalities. Each modality is represented by a different color. Due to the limited field of view, photoacoustic and thermoacoustic experiments were performed through four sections covering a span of 10 mm in each section. The kidneys and spine can be clearly identified in the fused image. To avoid motion artifacts, the experiment was performed on a scarified mouse.
Figure 6.

(a) Schematic drawing of the tri-modal imaging system and a photograph of the animal holder. (b) Drawing of the 3D detector for photoacoustic and thermoacoustic imaging. (c) The angular coverage as the target is rotated 360 degrees. (d) Three co-registered modalities are combined in a MAP image. Each modality is represented by a different color: green is ultrasound, red is photoacoustic tomography, and blue is thermoacoustic tomography. PCT, photoacoustic computed tomography; TCT, thermoacoustic computed tomography; and US, ultrasound B-mode imaging. Reproduced with permission from ref. [60].
With a larger arc-shaped transducer array (65 mm radius of curvature) and a different animal mounting scheme, Brecht et al. developed a spherical view PAT system capable of in vivo whole-body imaging [18]. The photoacoustic signals are detected by a 64-element transducer array with 3.5 MHz central frequency and greater than 80% bandwidth. Each element in the array has a square dimension of 2 mm and is evenly distributed along the arc. This design results in a higher density of detector elements toward the poles of the reconstruction sphere. To account for that, photoacoustic signals are normalized according to the detector density before image reconstruction [18]. Optical illumination is provided by two fiber bundles facing the object from opposite directions (Figure 7a). The animal is mounted on a custom-made mouse holder consisting of two hollow cylinders connected with fiberglass rods. The upper portion of the holder creates a diving bell for the mouse to breathe freely in the water tank. The pretensioned fiberglass rods allow the animal to be held in place with minimum movement. For a complete volumetric scan, the animal rotated 360 degrees in 150 steps. This step size ensures even detector spacing in the equatorial and meridianal directions. The spatial resolution of the system is 500 μm.
Figure 7.

(a) Picture of a mouse during a scan, showing the placement of the mouse and illumination with respect to the array of wideband ultrasonic transducers. (b) Three-dimensional photoacoustic volume of a female nude mouse. (c) Three-dimensional photoacoustic volume of a male nude mouse. Reproduced with permission from ref. [18].
Figure 7b shows a photoacoustic image of a mouse acquired at 755 nm excitation wavelength. The inferior vena cava and its bifurcation into the femoral veins can be clearly seen. Additionally, the left and right kidneys, the spleen, and a partial lobe of the liver can also be easily identified. A volumetric image from another mouse is shown in Figure 7c. In this experiment, the spine was positioned at the center of the rotation, where the sensitivity and resolution of the probe are the highest. Therefore, the spine structures can be clearly identified in the image.
IV. Imaging Applications
A. Glucose metabolism imaging
In preclinical and clinical cancer staging and treatment planning, simultaneous imaging of both glucose metabolism and anatomy plays an important role. Currently, it can be done only by dual modalities, such as PET-MRI and PET-CT, which are not only costly but also low-resolution. Additionally, due to ionizing radiation, longitudinal monitoring of the same subject is usually not feasible. Using RC-PACT, Chatni et al. reported the first high resolution imaging of both anatomy and glucose metabolism in a single modality [14]. While anatomical images were produced by the endogenous hemoglobin contrast, tumor glucose metabolism was imaged using IRDye800-2DG [61], a near-infrared fluorophore-labeled glucose analog.
The experiment was first performed on a mouse bearing a skin tumor, and the photoacoustic images were confirmed with fluorescence imaging. To demonstrate the depth imaging capability of RC-PACT, Chatni et al. also imaged two mice with orthotopically implanted 786-O kidney tumor cells. Following the control experiment, 200 μL of (0.4 mM) IRDye800-2DG was administered through the tail veins, and the mice were imaged after 24 hours. This 24-hour time window ensured that unbound IRDye800-2DG was excreted by the kidneys and bladder. Figure 8a shows representative anatomical cross-sections of the two mice. In both mice, the cancerous kidneys (left) are much larger than healthy kidneys (right). After spectral separation, the absolute concentrations of HbT (Figure 8b) and IRDye800-2DG (Figure 8c) were estimated according to the HbT concentration (2.3 mM) in the vena cava. In Figure 8c, a threshold, equaling the mean IRDye800-2DG concentration in the healthy kidney, was applied to account for non-specific IRDye800-2DG uptake due to the kidneys being the excretory route. The tumor-to-normal tissue contrast for IRDye800-2DG uptake was calculated to be 3.3 at the most metabolically active site in the tumor. The same spectral separation method was also applied on the control RC-PACT images acquired from the same mice before dye injection. As expected, no significant IRDye800-2DG uptake was observed. This observation further confirms the results in Figure 8c. Using a different fluorescent dye, 2NBDG, which has a smaller molecular size, the system also demonstrated imaging of brain metabolism in vivo [62].
Figure 8.

In vivo RC-PACT images of orthotopically implanted 786-O kidney tumors. Top row: mouse 1. Bottom row: mouse 2. (a) Anatomical images acquired at 776 nm. (b) HbT images overlaid on the anatomical images. (c) IRDye800-2DG images overlaid on the anatomical images. CK, cancerous kidney; HK, healthy kidney; HM, hypermetabolic. Reproduced with permission from ref. [14].
B. Deep tissue imaging of fluorescent proteins
In the past few years, genetically encoded fluorescent proteins (FPs) have revolutionized many areas of biology and medical research. FPs can be produced by living cells and tissues, eliminating the need for exogenous delivery of contrast agents. FPs also have strong optical absorption, which allows them to be used in photoacoustic imaging. The first in vivo photoacoustic imaging of FPs was reported in 2009 by Razansky et al. [16]. The study was, however, performed on small and nearly transparent organisms, and did not demonstrate the full advantage of photoacoustic imaging. In 2012, Filonov et al. reported the first deep-tissue photoacoustic imaging of FPs in a live mouse [17]. The FP used in their study was a phytochrome-based near-infrared fluorescent protein (iRFP), with excitation and emission maxima at 690 nm and 713 nm, respectively [63]. The near-infrared absorption characteristics allow deep tissue imaging.
iRFP was transfected into MTLn3 adenocarcinoma cells and injected into the mammary fat pad of female SCID/NCr mice. Three weeks after injection, experiments were performed using the RC-PACT (Figure 4) and the Deep-PAMac (Figure 1) systems. RC-PACT could image the entire cross section of the mouse body, while Deep-PAMac provided 3D volumetric images in a smaller field of view. The imaging results are shown in Figure 9. For each system, three wavelengths were used to spectrally resolve iRFP and blood. In RC-PACT images (Figure 9b), the position and size of the tumor in the axial cross-section matched well with those in the photograph (Figure 9a), and the tumor can be clearly visualized in the spectrally separated image. Deep-PAMac results were maximum amplitude projected in three orthogonal planes (Figure 9c and 9d). Multi-depth imaging was simulated by overlaying multiple slices of chicken tissues. iRFP could be visualized at a depth up to 4 mm, with 280 μm lateral and 75 μm axial spatial resolution (Figure 9d).
Figure 9.

In vivo RC-PACT and Deep-PAMac imaging of mouse mammary gland tumor. (a). Photograph of the mouse with the three-week-old tumor xenograft growing in the mammary pad (yellow arrow). (b). RC-PACT images of the tumor shown in the mouse cross section. The three images on the left were taken at different wavelengths (indicated); the right-most image is a spectrally separated one, with the tumor in blue and the blood in red. The spectrally resolved iRFP signal is normalized to the spectrally resolved signal for blood. The black dashed line shows the mouse body borders. Deep-PAMac MAP images of the tumor and surrounding major blood vessels, taken without (c) and with (d) 4 mm thick chicken breast tissue overlay. The three left images on each panel were taken at different wavelengths (indicated), and the images on each of the right-most panels are spectrally separated MAP images with orthogonal orientations. Again, the tumor is labeled blue, the blood is labeled red, and the spectrally resolved iRFP signal is normalized to the spectrally resolved blood signal. The tumor position is indicated by the green arrow. Reproduced with permission from ref. [17].
C. Studying long-term biodistribution of optical contrast agents
With the broader use of nanoparticles in biomedical research, their long-term toxicity and biological distribution have drawn increasing interest. Currently, the biodistribution can be studied only by sacrificing multiple animals at different time points and then slicing the tissue to identify the state of the particular particle [2]. The development of photoacoustic whole-body imaging allows researchers to follow particles' biological progress noninvasively in a live animal. Using the 3D photoacoustic tomography system in Figure 7a, Su et al. monitored the distribution of gold nanorods in mice over a period of 190 hours [64]. The gold nanorods used in the study had an optical absorption peak around 765 nm and an average size of 220 nm. Before injection, control experiments were performed at 765 nm and 1064 nm wavelengths. The mouse was then injected with 400 μl of nanorod solution (19 mg of Au per kg of body mass), and photoacoustic experiments were repeated at 1, 24, 48, and 192 hours following the injection. For images acquired at 765 nm (Figure 10a), enhancements in photoacoustic intensity can be clearly seen in the areas of spleen and spine. The overall image intensity is also much higher than that of the pre-injection image. Surprisingly, enhancement in image intensity was also observed in the 1064 nm images (Figure 10b), and the signal reached its maximum two days after injection. This finding is possibly due to the change in optical properties of nanorods upon interaction with biological components of blood. Such an interaction may broaden the plasmon resonance peak and shift it toward the infrared region [64]. The relative changes in image intensity are shown in Figures 10c and 10d. A quick increase followed by a much slower decline was observed in most organs, indicating slow excretion rates for the nanorods.
Figure 10.

Three-dimensional photoacoustic images reconstructed from a mouse before and after intravenous injection of gold nanorods. (a) and (b) are dorsoventral images acquired at 765 nm and 1064 nm, respectively. (c) and (d) show changes of the averaged brightness inside the segmented parts of the photoacoustic images acquired at 765 nm and 1064 nm, respectively. Reproduced with permission from ref. [64].
D. Video-rate cross-sectional imaging
An advantage of cross-sectional whole-body imaging systems is their fast imaging speed. When the number of data acquisition channels matches that of the ultrasonic array elements, real-time imaging can be achieved at the laser's pulse repetition rate. Using the half-ring photoacoustic tomography system shown in Figure 3, Buehler et al. imaged the perfusion of Indocyanine Green (ICG) in a mouse kidney in real-time [21]. A female, eight-week-old CD1 mouse, anesthetized with a mixture of ketamine and xylazine, was used in the experiment. After the mouse was mounted on the imaging platform, 300 nmol ICG was administrated through the tail vein. Video-rate imaging was then performed at the laser's pulse repetition rate (10 Hz) without averaging. Figure 11 shows a time series of images acquired in real-time after ICG injection. From the differential image (Figure 11b), the first appearance of ICG is clearly visible at 16s after injection. Gradual spread of the dye into the kidneys can be observed in the subsequent slices. The vascular structure was also enhanced in the image by the presence of ICG.
Figure 11.
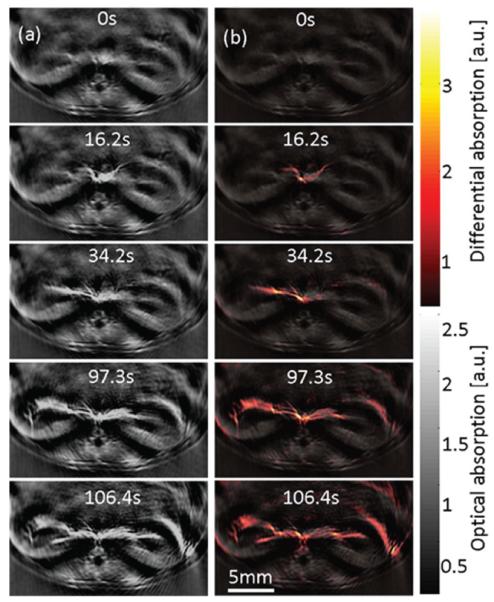
(a) Cross-sectional photoacoustic images at different time points of the kidneys of a female CD1 mouse illuminated at 800 nm after injection of 300 nmol of ICG. (b) Superposition of the absorption difference and the single wavelength image acquired before injection. Reproduced with permission from ref. [21].
In another study, Buehler et al. developed a three-dimensional video-rate imaging system using a 256-element array [65]. The array elements were laid out in multiple half-rings, all facing the center of imaging region. Each element (4×4 mm2) was unfocused and has a central frequency of 3.3 MHz. Due to the limited field of view (10×10×10 mm3), the system has thus far been used to image only newborn mice.
V. Summary
Since the first demonstration of small-animal whole-body PAT in 2003 [59], the field has been growing rapidly. Multiple PAT imaging systems with different detection and light illumination schemes have been developed. Some of these systems are also commercially available. While promising whole-body images have been acquired, more work needs to be completed to further improve the performance of the technique.
In terms of imaging speed, the current bottlenecks are the laser's pulse repetition rate and the number of data acquisition channels. With state-of-the-art multi-channel DAQ systems, cross-sectional imaging systems can achieve a frame rate that equals the lasers' pulse repetition rate. For volumetric imaging, even with the latest hardware, it is still extremely challenging to capture fast dynamics, such as the uptake of contrast agents and the mouse heartbeat. In this regard, image reconstruction algorithms dealing with sparse sampling of the detecting aperture are a promising solution [56, 57]. For real-time reconstruction and visualization of photoacoustic images during high-speed data acquisition, the bottleneck is the computational power of the system's central processing unit (CPU). By performing imaging reconstruction on graphic processing units (GPU) [66–68] or field-programmable gate arrays (FPGA) [69], real-time cross-sectional and volumetric image visualization have been achieved.
Quantitative whole-body imaging also faces challenges because the photoacoustic amplitude is proportional to the product of the local light fluence and the optical absorption coefficient (Eq. 1). Therefore, optical heterogeneities in the body need to be taken into account in spectral photoacoustic studies. The simple linear spectral inversion only works in special cases, when the absorber of interest has an absorption spectrum distinct from those of surround tissues [70]. Functional imaging of blood oxygenation does not satisfy that assumption, as the two forms of hemoglobin have similar absorption values in the near-infrared region. To address this issue, PAT has been combined with other optical modalities, such as diffuse optical tomography [71, 72], to improve the accuracy of recovering absorption coefficients. Advanced spectral separation algorithms [73-75] have also been developed.
As with optical heterogeneities, acoustic heterogeneities, such as variations in the speed of sound (SOS) and the presence of acoustic reflectors, also need to be considered. In a full-view whole-body imaging system, the half-time image reconstruction algorithm [76] is a promising method to mitigate artifacts caused by acoustic heterogeneities. Integrated PAT and ultrasound tomography (UST) systems have also been developed [77–80]. UST measures the tissue's acoustic properties, which can be used to inform PAT image reconstruction [78, 81]. PAT reconstruction algorithms accounting for specific acoustic properties, such as SOS and attenuation, have been proposed [27, 78].
Nevertheless, encouraging PAT small-animal whole-body images have already been reported, and addressing the aforementioned challenges will only further improve the capability of whole-body PAT imaging. With its unique combination of optical absorption sensitivity and ultrasonic imaging depth and resolution scalability [9], PAT has great potential for small-animal whole-body imaging.
Acknowledgments
The authors appreciate Prof. James Ballard's close reading of the manuscript. This work was sponsored in part by National Institutes of Health grants DP1 EB016986 (NIH Director's Pioneer Award), R01 EB016963, R01 EB008085, R01 CA134539, U54 CA136398, R01 EB010049, R01 CA157277, and R01 CA159959. L.W. has a financial interest in Microphotoacoustics, Inc. and Endra, Inc., which, however, did not support this work.
References
- [1].Kiessling F, Pichler BJ. Small Animal Imaging: Basics and Practical Guide. Springer Verlag; 2010. [Google Scholar]
- [2].Baker M. Whole-animal imaging: The whole picture. Nature. 2010;463:977–980. doi: 10.1038/463977a. [DOI] [PubMed] [Google Scholar]
- [3].Benveniste H, Blackband S. MR microscopy and high resolution small animal MRI: applications in neuroscience research. Progress in Neurobiology. 2002;67:393–420. doi: 10.1016/s0301-0082(02)00020-5. [DOI] [PubMed] [Google Scholar]
- [4].Brenner DJ, Hall EJ. Computed Tomography - An Increasing Source of Radiation Exposure. New England Journal of Medicine. 2007;357:2277–2284. doi: 10.1056/NEJMra072149. [DOI] [PubMed] [Google Scholar]
- [5].Greco A, Mancini M, Gargiulo S, Gramanzini M, Claudio PP, Brunetti A, Salvatore A. Ultrasound Biomicroscopy in Small Animal Research: Applications in Molecular and Preclinical Imaging. Journal of Biomedicine and Biotechnology. 2012:14. doi: 10.1155/2012/519238. [DOI] [PMC free article] [PubMed] [Google Scholar]
- [6].Yang M, Baranov E, Jiang P, Sun F-X, Li X-M, Li L, Hasegawa S, Bouvet M, Al-Tuwaijri M, Chishima T, Shimada H, Moossa AR, Penman S, Hoffman RM. Whole-body optical imaging of green fluorescent protein-expressing tumors and metastases. Proceedings of the National Academy of Sciences. 2000 Feb 1;97:1206–1211. doi: 10.1073/pnas.97.3.1206. 2000. [DOI] [PMC free article] [PubMed] [Google Scholar]
- [7].Leblond F, Davis SC, Valdes PA, Pogue BW. Pre-clinical whole-body fluorescence imaging: Review of instruments, methods and applications. Journal of Photochemistry and Photobiology B: Biology. 2010;98:77–94. doi: 10.1016/j.jphotobiol.2009.11.007. [DOI] [PMC free article] [PubMed] [Google Scholar]
- [8].Wang LV. Multiscale photoacoustic microscopy and computed tomography. Nature Photonics. 2009 Sep;3:503–509. doi: 10.1038/nphoton.2009.157. [DOI] [PMC free article] [PubMed] [Google Scholar]
- [9].Wang LV, Hu S. Photoacoustic Tomography: In Vivo Imaging from Organelles to Organs. Science. 2012 Mar 23;335:1458–1462. doi: 10.1126/science.1216210. 2012. [DOI] [PMC free article] [PubMed] [Google Scholar]
- [10].Zhang HF, Maslov K, Stoica G, Wang LV. Functional photoacoustic microscopy for high-resolution and noninvasive in vivo imaging. Nat Biotech. 2006;24:848–851. doi: 10.1038/nbt1220. [DOI] [PubMed] [Google Scholar]
- [11].Fang H, Maslov K, Wang LV. Photoacoustic Doppler Effect from Flowing Small Light-Absorbing Particles. Physical Review Letters. 2007;99:184501. doi: 10.1103/PhysRevLett.99.184501. [DOI] [PubMed] [Google Scholar]
- [12].Yao J, Maslov KI, Shi Y, Taber LA, Wang LV. In vivo photoacoustic imaging of transverse blood flow by using Doppler broadening of bandwidth. Opt. Lett. 2010;35:1419–1421. doi: 10.1364/OL.35.001419. [DOI] [PMC free article] [PubMed] [Google Scholar]
- [13].Yao J, Maslov KI, Zhang Y, Xia Y, Wang LV. Label-free oxygen-metabolic photoacoustic microscopy in vivo. Journal of Biomedical Optics. 2011;16:076003. doi: 10.1117/1.3594786. [DOI] [PMC free article] [PubMed] [Google Scholar]
- [14].Chatni MR, Xia J, Sohn R, Maslov K, Guo Z, Zhang Y, Wang K, Xia Y, Anastasio M, Arbeit J, Wang LV. Tumor glucose metabolism imaged in vivo in small animals with whole-body photoacoustic computed tomography. Journal of Biomedical Optics. 2012;17:076012. doi: 10.1117/1.JBO.17.7.076012. [DOI] [PMC free article] [PubMed] [Google Scholar]
- [15].Wu L, Cai X, Nelson K, Xing W, Xia J, Zhang R, Stacy A, Luderer M, Lanza G, Wang L, Shen B, Pan D. A green synthesis of carbon nanoparticles from honey and their use in real-time photoacoustic imaging. Nano Research. 2013:1–14. doi: 10.1007/s12274-013-0308-8. 2013/04/12. [DOI] [PMC free article] [PubMed] [Google Scholar]
- [16].Razansky D, Distel M, Vinegoni C, Ma R, Perrimon N, Koster RW, Ntziachristos V. Multispectral opto-acoustic tomography of deep-seated fluorescent proteins in vivo. Nat Photon. 2009;3:412–417. [Google Scholar]
- [17].Filonov GS, Krumholz A, Xia J, Yao J, Wang LV, Verkhusha VV. Deep-Tissue Photoacoustic Tomography of a Genetically Encoded Near-Infrared Fluorescent Probe. Angewandte Chemie International Edition. 2012;51:1448–1451. doi: 10.1002/anie.201107026. [DOI] [PMC free article] [PubMed] [Google Scholar]
- [18].Brecht H-P, Su R, Fronheiser M, Ermilov SA, Conjusteau A, Oraevsky AA. Whole-body three-dimensional optoacoustic tomography system for small animals. Journal of Biomedical Optics. 2009;14:064007–8. doi: 10.1117/1.3259361. [DOI] [PMC free article] [PubMed] [Google Scholar]
- [19].Lam RB, Kruger RA, Reinecke DR, DelRio SP, Thornton MM, Picot PA, Morgan TG. Dynamic optical angiography of mouse anatomy using radial projections. Proceedings of SPIE.2010. p. 756405. [Google Scholar]
- [20].Xia J, Guo Z, Aguirre A, Zhu Q, Wang LV. Small animal whole body imaging using a photoacoustic full ring array system. Proceedings of SPIE.2011. p. 789911. [Google Scholar]
- [21].Buehler A, Herzog E, Razansky D, Ntziachristos V. Video rate optoacoustic tomography of mouse kidney perfusion. Opt. Lett. 2010;35:2475–2477. doi: 10.1364/OL.35.002475. [DOI] [PubMed] [Google Scholar]
- [22].Xia J, Wang L. Photoacoustic Tomography of the Brain. In: Madsen SJ, editor. Optical Methods and Instrumentation in Brain Imaging and Therapy. Vol. 3. Springer; New York: 2013. pp. 137–156. [Google Scholar]
- [23].Hu S, Wang LV. Neurovascular photoacoustic tomography. Frontiers in Neuroenergetics. 2010;2 doi: 10.3389/fnene.2010.00010. 2010-June-17. [DOI] [PMC free article] [PubMed] [Google Scholar]
- [24].Wang LV. Tutorial on Photoacoustic Microscopy and Computed Tomography. Selected Topics in Quantum Electronics, IEEE Journal of. 2008;14:171–179. [Google Scholar]
- [25].Xu M, Wang LV. Universal back-projection algorithm for photoacoustic computed tomography. Physical Review E. 2005;71:016706. doi: 10.1103/PhysRevE.71.016706. [DOI] [PubMed] [Google Scholar]
- [26].Burgholzer P, Matt GJ, Haltmeier M, Paltauf G. n. Exact and approximative imaging methods for photoacoustic tomography using an arbitrary detection surface. Physical Review E. 2007;75:046706. doi: 10.1103/PhysRevE.75.046706. [DOI] [PubMed] [Google Scholar]
- [27].Cox BT, Beard PC. Fast calculation of pulsed photoacoustic fields in fluids using k-space methods. Journal of the Acoustical Society of America. 2005;117:3616–3627. doi: 10.1121/1.1920227. [DOI] [PubMed] [Google Scholar]
- [28].Rosenthal A, Ntziachristos V, Razansky D. Model-based optoacoustic inversion with arbitrary-shape detectors. Medical Physics. 2011 Jul;38:4285–4295. doi: 10.1118/1.3589141. [DOI] [PubMed] [Google Scholar]
- [29].Xu MH, Wang LHV. Photoacoustic imaging in biomedicine. Review of Scientific Instruments. 2006 Apr;77:22. [Google Scholar]
- [30].Mark A, Peter K, Leonid K. Photoacoustic Imaging and Spectroscopy. CRC Press; 2009. On Reconstruction Formulas and Algorithms for the Thermoacoustic Tomography; pp. 89–101. [Google Scholar]
- [31].Xu Y, Wang LV. Time Reversal and Its Application to Tomography with Diffracting Sources. Physical Review Letters. 2004;92:033902. doi: 10.1103/PhysRevLett.92.033902. [DOI] [PubMed] [Google Scholar]
- [32].Yulia H, Peter K, Linh N. Reconstruction and time reversal in thermoacoustic tomography in acoustically homogeneous and inhomogeneous media. Inverse Problems. 2008;24:055006. [Google Scholar]
- [33].Treeby BE, Cox BT. k-Wave: MATLAB toolbox for the simulation and reconstruction of photoacoustic wave fields. Journal of Biomedical Optics. 2010 Mar-Apr;15 doi: 10.1117/1.3360308. [DOI] [PubMed] [Google Scholar]
- [34].Wang K, Ermilov SA, Su R, Brecht HP, Oraevsky AA, Anastasio MA. An Imaging Model Incorporating Ultrasonic Transducer Properties for Three-Dimensional Optoacoustic Tomography. Ieee Transactions on Medical Imaging. 2011 Feb;30:203–214. doi: 10.1109/TMI.2010.2072514. [DOI] [PMC free article] [PubMed] [Google Scholar]
- [35].Xia J, Guo Z, Maslov K, Aguirre A, Zhu Q, Percival C, Wang LV. Three-dimensional photoacoustic tomography based on the focal-line concept. Journal of Biomedical Optics. 2011;16:090505. doi: 10.1117/1.3625576. [DOI] [PMC free article] [PubMed] [Google Scholar]
- [36].Wang K, Su R, Oraevsky AA, Anastasio MA. Investigation of iterative image reconstruction in three-dimensional optoacoustic tomography. Physics in Medicine and Biology. 2012 Sep;57:5399–5423. doi: 10.1088/0031-9155/57/17/5399. [DOI] [PMC free article] [PubMed] [Google Scholar]
- [37].Ku G, Wang XD, Stoica G, Wang LHV. Multiple-bandwidth photoacoustic tomography. Physics in Medicine and Biology. 2004 Apr;49:1329–1338. doi: 10.1088/0031-9155/49/7/018. [DOI] [PubMed] [Google Scholar]
- [38].Rosenthal A, Ntziachristos V, Razansky D. Optoacoustic Methods for Frequency Calibration of Ultrasonic Sensors. Ieee Transactions on Ultrasonics Ferroelectrics and Frequency Control. 2011 Feb;58:316–326. doi: 10.1109/TUFFC.2011.1809. [DOI] [PubMed] [Google Scholar]
- [39].Song KH, Wang LV. Deep reflection-mode photoacoustic imaging of biological tissue. Journal of Biomedical Optics. 2007;12:060503. doi: 10.1117/1.2818045. [DOI] [PubMed] [Google Scholar]
- [40].Song KH, Wang LV. Noninvasive photoacoustic imaging of the thoracic cavity and the kidney in small and large animals. Medical Physics. 2008;35:4524–4529. doi: 10.1118/1.2977534. [DOI] [PMC free article] [PubMed] [Google Scholar]
- [41].Li M-L, Zhang HF, Maslov K, Stoica G, Wang LV. Improved in vivo photoacoustic microscopy based on a virtual-detector concept. Opt. Lett. 2006;31:474–476. doi: 10.1364/ol.31.000474. [DOI] [PubMed] [Google Scholar]
- [42].Laufer J, Norris F, Cleary J, Zhang E, Treeby B, Cox B, Johnson P, Scambler P, Lythgoe M, Beard P. In vivo photoacoustic imaging of mouse embryos. Journal of Biomedical Optics. 2012;17:061220–1. doi: 10.1117/1.JBO.17.6.061220. [DOI] [PubMed] [Google Scholar]
- [43].Xu M. Photoacoustic Imaging and Spectroscopy. CRC Press; 2009. Analysis of Spatial Resolution in Photoacoustic Tomography; pp. 47–60. vol. null. [Google Scholar]
- [44].Needles A, Heinmiller A, Sun J, Theodoropoulos C, Bates D, Hirson D, Yin M, Foster FS. Development and initial application of a fully integrated photoacoustic micro-ultrasound system. Ultrasonics, Ferroelectrics and Frequency Control, IEEE Transactions on. 2013;60 doi: 10.1109/TUFFC.2013.2646. [DOI] [PubMed] [Google Scholar]
- [45].Erpelding TN, Kim C, Pramanik M, Jankovic L, Maslov K, Guo Z, Margenthaler JA, Pashley MD, Wang LV. Sentinel Lymph Nodes in the Rat: Noninvasive Photoacoustic and US Imaging with a Clinical US System1. Radiology. 2010 Jul 1;256:102–110. doi: 10.1148/radiol.10091772. 2010. [DOI] [PMC free article] [PubMed] [Google Scholar]
- [46].Wang Y, Erpelding TN, Jankovic L, Guo Z, Robert J-L, David G, Wang LV. In vivo three-dimensional photoacoustic imaging based on a clinical matrix array ultrasound probe. Journal of Biomedical Optics. 2012;17:061208–1. doi: 10.1117/1.JBO.17.6.061208. [DOI] [PMC free article] [PubMed] [Google Scholar]
- [47].Leonardo GM, Ragnar O, Daniel RB, Russell SW. Real-time photoacoustic and ultrasound imaging: a simple solution for clinical ultrasound systems with linear arrays. Physics in Medicine and Biology. 2013;58:N1. doi: 10.1088/0031-9155/58/1/N1. [DOI] [PubMed] [Google Scholar]
- [48].Gateau J, Caballero MAA, Dima A, Ntziachristos V. Three-dimensional optoacoustic tomography using a conventional ultrasound linear detector array: Whole-body tomographic system for small animals. Medical Physics. 2013;40:013302. doi: 10.1118/1.4770292. [DOI] [PubMed] [Google Scholar]
- [49].Wang X, Fowlkes JB, Cannata JM, Hu C, Carson PL. Photoacoustic Imaging With a Commercial Ultrasound System and a Custom Probe. Ultrasound in Medicine & Biology. 2011;37:484–492. doi: 10.1016/j.ultrasmedbio.2010.12.005. [DOI] [PMC free article] [PubMed] [Google Scholar]
- [50].Razansky D, Buehler A, Ntziachristos V. Volumetric real-time multispectral optoacoustic tomography of biomarkers. Nat. Protocols. 2011;6:1121–1129. doi: 10.1038/nprot.2011.351. [DOI] [PubMed] [Google Scholar]
- [51].Xia J, Chatni M, Maslov K, Guo Z, Wang K, Anastasio M, Wang LV. Whole-body ring-shaped confocal photoacoustic computed tomography of small animals in vivo. Journal of Biomedical Optics. 2012;17:050506. doi: 10.1117/1.JBO.17.5.050506. [DOI] [PMC free article] [PubMed] [Google Scholar]
- [52].Gamelin J, Maurudis A, Aguirre A, Huang F, Guo P, Wang LV, Zhu Q. A real-time photoacoustic tomography system for small animals. Opt. Express. 2009;17:10489–10498. doi: 10.1364/oe.17.010489. [DOI] [PMC free article] [PubMed] [Google Scholar]
- [53].Anastasio MA, Zhang J, Pan X, Ku G, Wang LV. Mitigating artifacts via half-time reconstruction in thermoacoustic tomography. 2005:263–270. doi: 10.1109/tmi.2004.839682. [DOI] [PubMed] [Google Scholar]
- [54].Li C, Aguirre A, Gamelin J, Maurudis A, Zhu Q, Wang LV. Real-time photoacoustic tomography of cortical hemodynamics in small animals. Journal of Biomedical Optics. 2010;15:010509-1-3. doi: 10.1117/1.3302807. [DOI] [PMC free article] [PubMed] [Google Scholar]
- [55].Xia J, Chatni M, Maslov K, Wang LV. Anatomical and metabolic small-animal whole-body imaging using ring-shaped confocal photoacoustic computed tomography. Proceedings of SPIE; 2013. 85810K-85810K. [DOI] [PMC free article] [PubMed] [Google Scholar]
- [56].Guo Z, Li C, Song L, Wang LV. Compressed sensing in photoacoustic tomography in vivo. Journal of Biomedical Optics. 2010;15:021311. doi: 10.1117/1.3381187. [DOI] [PMC free article] [PubMed] [Google Scholar]
- [57].Gamelin JK, Aguirre A, Zhu Q. Fast, limited-data photoacoustic imaging for multiplexed systems using a frequency-domain estimation technique. Medical Physics. 2011;38:1503–1518. doi: 10.1118/1.3533669. [DOI] [PMC free article] [PubMed] [Google Scholar]
- [58].Kruger R, Reinecke D, Kruger G, Thornton M, Picot P, Morgan T, Stantz K, Mistretta C. HYPR-spectral photoacoustic CT for preclinical imaging. Proceedings of SPIE.2009. p. 71770F. [Google Scholar]
- [59].Kruger RA, Kiser WL, Reinecke DR, Kruger GA, Miller KD. Thermoacoustic Molecular Imaging of Small Animals. Molecular Imaging. 2003;2:113–123. doi: 10.1162/15353500200303109. [DOI] [PubMed] [Google Scholar]
- [60].Reinecke DR, Kruger RA, Lam RB, DelRio SP. Co-registered photoacoustic, thermoacoustic, and ultrasound mouse imaging. Proceedings of SPIE. 2010;7564:756420–9. [Google Scholar]
- [61].Kovar JL, Volcheck W, Sevick-Muraca E, Simpson MA, Olive DM. Characterization and performance of a near-infrared 2-deoxyglucose optical imaging agent for mouse cancer models. Analytical Biochemistry. 2009;384:254–262. doi: 10.1016/j.ab.2008.09.050. [DOI] [PMC free article] [PubMed] [Google Scholar]
- [62].Yao J, Xia J, Maslov KI, Nasiriavanaki M, Tsytsarev V, Demchenko AV, Wang LV. Noninvasive photoacoustic computed tomography of mouse brain metabolism in vivo. NeuroImage. 2013;64:257–266. doi: 10.1016/j.neuroimage.2012.08.054. [DOI] [PMC free article] [PubMed] [Google Scholar]
- [63].Filonov GS, Piatkevich KD, Ting L-M, Zhang J, Kim K, Verkhusha VV. Bright and stable near-infrared fluorescent protein for in vivo imaging. Nat Biotech. 2011;29:757–761. doi: 10.1038/nbt.1918. [DOI] [PMC free article] [PubMed] [Google Scholar]
- [64].Su R, Ermilov SA, Liopo AV, Oraevsky AA. Three-dimensional optoacoustic imaging as a new noninvasive technique to study long-term biodistribution of optical contrast agents in small animal models. Journal of Biomedical Optics. 2012;17:101506–1. doi: 10.1117/1.JBO.17.10.101506. [DOI] [PMC free article] [PubMed] [Google Scholar]
- [65].Buehler A, Deán-Ben XL, Claussen J, Ntziachristos V, Razansky D. Three-dimensional optoacoustic tomography at video rate. Opt. Express. 2012;20:22712–22719. doi: 10.1364/OE.20.022712. [DOI] [PubMed] [Google Scholar]
- [66].Ozbek A, Deán-Ben XL, Razansky D. Realtime parallel back-projection algorithm for three-dimensional optoacoustic imaging devices. 2013:88000I–88000I. [Google Scholar]
- [67].Yuan J, Xu G, Yu Y, Zhou Y, Carson PL, Wang X, Liu X. Real-time photoacoustic and ultrasound dual-modality imaging system facilitated with graphics processing unit and code parallel optimization. Journal of Biomedical Optics. 2013;18:086001–086001. doi: 10.1117/1.JBO.18.8.086001. [DOI] [PMC free article] [PubMed] [Google Scholar]
- [68].Dean Ben X, Oezbek A, Razansky D. Volumetric real-time tracking of peripheral human vasculature with GPU-accelerated three-dimensional optoacoustic tomography. Medical Imaging, IEEE Transactions on. 2013;PP:1–1. doi: 10.1109/TMI.2013.2272079. [DOI] [PubMed] [Google Scholar]
- [69].Alqasemi U, Hai L, Aguirre A, Quing Z. FPGA-based reconfigurable processor for ultrafast interlaced ultrasound and photoacoustic imaging. Ultrasonics, Ferroelectrics and Frequency Control, IEEE Transactions on. 2012;59:1344–1353. doi: 10.1109/TUFFC.2012.2335. [DOI] [PMC free article] [PubMed] [Google Scholar]
- [70].Beard P, Arridge S, Cox B, Laufer J. Photoacoustic Imaging and Spectroscopy. CRC Press; 2009. Quantitative Photoacoustic Imaging; pp. 121–143. [Google Scholar]
- [71].Bauer AQ, Nothdurft RE, Erpelding TN, Wang LV, Culver JP. Quantitative photoacoustic imaging: correcting for heterogeneous light fluence distributions using diffuse optical tomography. Journal of Biomedical Optics. 2011;16:096016. doi: 10.1117/1.3626212. [DOI] [PMC free article] [PubMed] [Google Scholar]
- [72].Li XQ, Xi L, Jiang RX, Yao L, Jiang HB. Integrated diffuse optical tomography and photoacoustic tomography: phantom validations. Biomedical Optics Express. 2011 Aug;2:2348–2353. doi: 10.1364/BOE.2.002348. [DOI] [PMC free article] [PubMed] [Google Scholar]
- [73].Guo Z, Favazza C, Garcia-Uribe A, Wang LV. Quantitative photoacoustic microscopy of optical absorption coefficients from acoustic spectra in the optical diffusive regime. Journal of Biomedical Optics. 2012;17:066011–1. doi: 10.1117/1.JBO.17.6.066011. [DOI] [PMC free article] [PubMed] [Google Scholar]
- [74].Laufer J, Delpy D, Elwell C, Beard P. Quantitative spatially resolved measurement of tissue chromophore concentrations using photoacoustic spectroscopy: application to the measurement of blood oxygenation and haemoglobin concentration. Physics in Medicine and Biology. 2007 Jan;52:141–168. doi: 10.1088/0031-9155/52/1/010. [DOI] [PubMed] [Google Scholar]
- [75].Xia J, Danielli A, Liu Y, Wang L, Maslov K, Wang LV. Calibration-free quantification of absolute oxygen saturation based on the dynamics of photoacoustic signals. Opt. Lett. 2013;38:2800–2803. doi: 10.1364/OL.38.002800. [DOI] [PMC free article] [PubMed] [Google Scholar]
- [76].Anastasio MA, Zhang J, Pan XC, Zou Y, Ku G, Wang LHV. Half-time image reconstruction in thermoacoustic tomography. Ieee Transactions on Medical Imaging. 2005 Feb;24:199–210. doi: 10.1109/tmi.2004.839682. [DOI] [PubMed] [Google Scholar]
- [77].Jin X, Wang LV. Thermoacoustic tomography with correction for acoustic speed variations. Physics in Medicine and Biology. 2006;51:6437. doi: 10.1088/0031-9155/51/24/010. [DOI] [PubMed] [Google Scholar]
- [78].Jose J, Willemink RGH, Steenbergen W, Slump CH, Leeuwen T. G. v., Manohar S. Speed-of-sound compensated photoacoustic tomography for accurate imaging. Medical Physics. 2012;39:7262–7271. doi: 10.1118/1.4764911. [DOI] [PubMed] [Google Scholar]
- [79].Jose J, Willemink RGH, Resink S, Piras D, van Hespen JCG, Slump CH, Steenbergen W, van Leeuwen TG, Manohar S. Passive element enriched photoacoustic computed tomography (PER PACT) for simultaneous imaging of acoustic propagation properties and light absorption. Opt. Express. 2011;19:2093–2104. doi: 10.1364/OE.19.002093. [DOI] [PubMed] [Google Scholar]
- [80].Xia J, Huang C, Maslov K, Anastasio MA, Wang LV. Enhancement of photoacoustic tomography by ultrasonic computed tomography based on optical excitation of elements of a full-ring transducer array. Opt. Lett. 2013;38:3140–3143. doi: 10.1364/OL.38.003140. [DOI] [PMC free article] [PubMed] [Google Scholar]
- [81].Huang C, Nie L, Schoonover RW, Wang LV, Anastasio MA. Photoacoustic computed tomography correcting for heterogeneity and attenuation. Journal of Biomedical Optics. 2012;17:061211–1. doi: 10.1117/1.JBO.17.6.061211. [DOI] [PMC free article] [PubMed] [Google Scholar]