

Abstract
A key question for the understanding of photosynthetic water oxidation is whether the four oxidizing equivalents necessary to oxidize water to dioxygen are accumulated on the four Mn ions of the oxygen-evolving complex (OEC), or whether some ligand-centered oxidations take place before the formation and release of dioxygen during the S3 → [S4] → S0 transition. Progress in instrumentation and flash sample preparation allowed us to apply Mn Kβ X-ray emission spectroscopy (Kβ XES) to this problem for the first time. The Kβ XES results, in combination with Mn X-ray absorption near-edge structure (XANES) and electron paramagnetic resonance (EPR) data obtained from the same set of samples, show that the S2 → S3 transition, in contrast to the S0 → S1 and S1 → S2 transitions, does not involve a Mn-centered oxidation. On the basis of new structural data from the S3-state, manganese μ-oxo bridge radical formation is proposed for the S2 → S3 transition, and three possible mechanisms for the O–O bond formation are presented.
Introduction
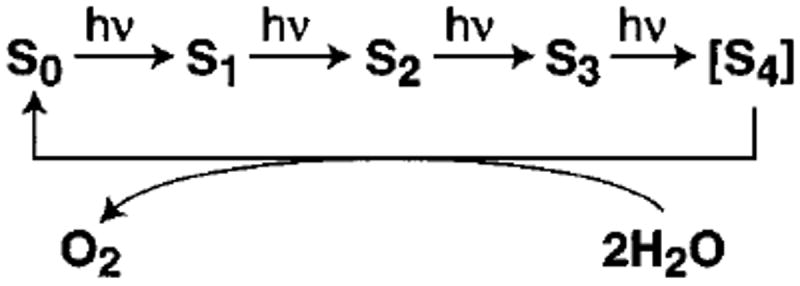
Most life on earth is critically dependent on the presence of dioxygen in the atmosphere. Almost all of this dioxygen has been generated through photosynthetic oxygen evolution by the oxygen-evolving complex (OEC) in photosystem II (PS II).1-3 PS II is a ~500 kDa multi-subunit membrane-bound protein complex whose primary function is to generate charge separation across the membrane using the energy present in photons of sunlight. The energy from this charge separation is then used to oxidize water to dioxygen in the OEC, and eventually to generate ATP and NADPH. The OEC contains four Mn atoms and two essential cofactors, Ca2+ and Cl−. Using the energy from the light-induced charge separation in the PS II reaction center, the OEC couples the 4-electron chemistry of water oxidation with the 1-electron photochemistry of the reaction center by sequentially storing oxidizing equivalents in a series of S-states Si (i = 0–4), where i denotes the number of oxidizing equivalents stored (Scheme 1).4 Once four oxidizing equivalents have been stored (S4), the OEC evolves dioxygen. This accumulation process avoids the release of harmful water oxidation intermediates such as superoxide or peroxide.
Scheme 1.
The mechanism by which the OEC generates dioxygen from water has been the subject of intense study. Several possible mechanisms for this reaction have been proposed;5-16 however, some key mechanistic questions are still unresolved. Knowledge of the structures of the Mn cluster and the oxidation states of Mn and other components of the OEC as it advances through the S-states is crucial to understanding the mechanism of water oxidation. In the absence of a high-resolution X-ray crystal structure of PS II, the primary spectroscopic tool for structural analysis of the S-states has been extended X-ray absorption fine structure (EXAFS) spectroscopy. On the basis of EXAFS data, the Mn cluster has been proposed to be a cluster consisting of at least two di-μ-oxo bridged Mn moieties and one mono-μ-oxo bridge Mn moiety.17,18 However, the EXAFS data provide few constraints on how these motifs are arranged in the OEC; thus, several possible topological models exist.16,19,20
EXAFS data reveal that the structure of the Mn cluster is not static; instead, distance changes are observed during some S-state transitions. The EXAFS spectra of the dark-stable S1 state show two to three 2.7 Å Mn–Mn distances and one 3.3 Å Mn–Mn distance, characteristic of two to three di-μ-oxo bridges and one mono-μ-oxo bridge, respectively.19,21 Advancement to the S2 state does not change the EXAFS spectrum; however, in the S0 state one of the 2.7 Å distances increases in length by 0.1–0.2 Å, and the 2.7 Å distances increase in the S3 state to 2.8 and 3.0 Å, indicating changes in the di-μ-oxo bridges.14,22-24
Several different spectroscopic methods have been used to address the oxidation states of Mn as a function of S-state. Electron paramagnetic resonance (EPR) spectroscopy has shown that the S0 and S2 states are paramagnetic, exhibiting multiline EPR signals,25-29 and that the S1 state has a parallel polarization EPR signal.30-33 This suggests that Mn is oxidized during the S0 → S1 and S1 → S2 transitions. Other EPR studies of the power-saturation behavior of a redox-active tyrosine in photosystem II, YDox, which is sensitive to the presence of relaxing centers such as the Mn cluster, show that the half-saturation power P1/2 changes during the S0 → S1 and S1 → S2 transitions, but remains unchanged during the S2 → S3 transition.34 This led to the suggestion that, unlike the S0 → S1 and S1 → S2 transitions, the S2 → S3 transition proceeds without Mn oxidation. A direct pulsed electron spin–echo measurement of the YDox T1 relaxation time, which has intrinsic and dipolar contributions, shows the same trends with S-state as the continuous-wave EPR measurements.35 Nuclear magnetic resonance proton relaxation enhancement (NMR-PRE) measurements, which measure the increased relaxation rate of the bulk water due to rapid exchange with water bound to a transition metal such as Mn, also led to the same conclusion, in particular with regard to the S2 → S3 transition not involving Mn oxidation.36 In addition, UV absorption difference spectroscopy has been used to address this question. By measuring small changes in absorbance between S-states, difference spectra are obtained which have been interpreted by some groups to suggest that Mn is oxidized on each S-state transition, contrary to the conclusions from other methods.37-39 However, the interpretation of these UV absorption difference spectra to derive insight about Mn oxidation is not straightforward.40,41
X-ray spectroscopic techniques are ideally suited to address questions about oxidation state, because the element in question, Mn, can be selectively probed with essentially no interference from other cofactors or the protein matrix. X-ray absorption near-edge structure (XANES) spectroscopy is the most well-known of these techniques and has been extensively used in the field of metalloproteins to investigate the oxidation states of redox-active metals in metalloprotein active sites.42-51 The principal component in XANES spectra is a 1s → 4p absorption edge in Mn. The pioneering application of XANES to PS II was performed by Goodin et al. in the early 1980s.46 This study, which was extremely difficult because of the low Mn concentration in PS II samples (≤ 1 mM), showed that the Mn K-edge from the S2 state is shifted to higher energy relative to the Mn K-edge studies from the S1 state. Dramatic improvements in detector technology and cryostat cooling capabilities have made XANES experiments routine for most concentrated metallo-proteins, and the collection of XANES spectra from dilute, single-flash saturable PS II samples is now achievable. Three different groups have investigated the oxidation states of Mn for the S0, S1, S2, and S3 states using XANES on single-flash saturable PS II samples. On the basis of shifts in the absorption edge, or lack thereof, Roelofs et al. proposed that Mn is oxidized during the S0 → S1 and S1 → S2 transitions, but is not oxidized during the S2 → S3 transition.49 In contrast, Ono et al.52 and Iuzzolino et al.53 interpret their XANES results to indicate that Mn is oxidized during each S-state transition, although one group (Ono et al.) reported no independent S-state determination for their samples and the other group (Iuzzolino et al.) had significant S-state inhomogeneity in their samples (for details, see Appendix).
The conflicting results in the literature concerning the S2 → S3 transition, some of which support and some of which disagree with Mn oxidation occurring during this transition, have led to two different types of proposed O2 evolution mechanisms, with one type8,10-12,15,16 incorporating the oxidation of ligand or substrate in the S3 state, and the other type9,13,54 invoking Mn oxidation during the S2 → S3 transition. As expected, fundamental differences in the chemistry of O–O bond formation and O2 evolution exist between the two types of mechanisms. Clearly, if the nature of the S2 → S3 transition is unambiguously identified, it will narrow the range of possible mechanisms for O2 evolution, leading to a clearer understanding of this important process.
By the application of an independent X-ray spectroscopic technique, Kβ X-ray emission spectroscopy (Kβ XES), we provide a new approach to contribute to the resolution of the true nature of the S2 → S3 transition. It has been known for over 60 years that Kβ XES is sensitive to the number of unpaired 3d electrons of the fluorescing atom.55-58 Due to improvements in instrumentation, it has recently been possible to apply this technique to dilute, biologically relevant samples such as PS II.59,60 Kβ XES monitors the Mn 3p → 1s fluorescence, which is sensitive to spin state, and therefore oxidation state (vide infra), through a 3p–3d exchange interaction.58 This is an indicator of oxidation-state sensitivity that is different from XANES, which is sensitive to oxidation state through 1s core-hole shielding effects.42 In this paper, we report on the investigation of the oxidation states of Mn in each of the intermediate S-states (S0 through S3) using Kβ XES and XANES spectroscopy on the same sets of samples that have been characterized by EPR, and provide strong evidence that Mn is oxidized on the S0 → S1 and S1 → S2 transitions, while ligand/substrate oxidation occurs during the S2 → S3 transition in lieu of a Mn-centered oxidation. By combining these data with structural information from EXAFS spectroscopy, three possible mechanisms for O–O bond formation by the OEC are proposed.
Materials and Methods
PS II membranes were prepared from fresh spinach leaves by a 2 min incubation of the isolated thylakoids with the detergent Triton X-100.61,62 The samples were then resuspended to a chlorophyll (Chl) concentration of 9.5 mg Chl/mL in a 30% (v/v) glycerol buffer (pH 6.5, 50 mM MES, 15 mM NaCl, 5 mM MgCl2, 5 mM CaCl2) and stored as aliquots at −80 °C until used. Inductively coupled plasma/atomic emission spectroscopy (ICP/AES) and flash-induced oxygen evolution were used to calculate a ratio of 4.3 ± 0.2 Mn/RC for the preparation used in this study (for details, see Supporting Information).
To prepare samples for the X-ray experiments, a frequency-doubled Nd:YAG laser system (Spectra-Physics PRO 230-10, 800 mJ/pulse at 532 nm, 9 ns pulse width) was used to illuminate PS II samples from both sides simultaneously. This setup allowed us to double the sample concentration used in earlier studies49,52 while still maintaining flash saturation. The laser was operated continuously at 10 Hz, and flashes were selected using an external shutter (model LSTX-Y3, nm Laser Products, Inc.).
Before flash illumination, 1 mM of recrystallized PPBQ, an exogenous electron acceptor of PS II, was added at 21 °C from a 50 mM stock solution in dimethyl sulfoxide and mixed. Lexan sample holders (22 × 3.2 × 0.8 mm3 inner dimensions) were evenly filled with 40 μL aliquots of PS II at 4 °C under dim green light and then used for flash illumination.
All samples were enriched in the S1YDox state (except for “no preflash”, NPF, samples) with one preflash followed by a 30 min dark-adaptation at 21 °C. This preflash procedure oxidizes the fast electron donor YD and thereby minimizes S-state scrambling due to the back-reaction with the S2 and S3 states between the flashes in the subsequent flash train. The samples were then illuminated with 0 to 6 flashes (“0F” to “6F” samples) at 1 Hz frequency. After the last flash, each sample was frozen immediately (<1 s) in liquid nitrogen to trap its S-state composition. Three sets of >35 samples each were prepared and used within 10 days for the experiments. The dimensions of the Lexan sample holders allowed us to measure EPR spectra of every sample that was later used for X-ray experiments.
To verify that the laser flash illumination procedure did not damage the PS II samples, Mn(II) EPR spectra were collected for several 6F samples; they showed that almost no Mn(II) (<1.5%) was released by seven laser flashes. For further confirmation, four of the 6F samples were dark-adapted for 40 min at room temperature after quantitation of their S2-state multiline EPR signal amplitudes, and were then advanced to the S2 state by continuous illumination at 190 K. The resulting normalized S2-state multiline EPR signal amplitudes were identical to those obtained from the 1F samples.
After all S2 EPR multiline signal and X-ray measurements were completed, the Mn content of each sample was quantitated by releasing the bound Mn as Mn(II) using the external reductant NH2OH. Ten microliters of a freshly prepared 1.0 M NH2OH solution was layered onto the surface of each sample, and the samples were allowed to incubate at room temperature for 30 min. The Mn(II) six-line EPR spectrum ( for 55Mn, 100% natural abundance) was then measured for each sample using the parameters described below.
EPR spectra were collected on a Varian E-109 spectrometer with an E-102 microwave bridge and stored using Labview running on a Macintosh G3 computer. Samples were maintained at cryogenic temperatures using an Air Products Heli-tran liquid helium cryostat. Spectrometer conditions for Mn(II) spectra were as follows: 3300 ± 1000 G scan range, 16 000 gain, 10 μW microwave power, 20 K temperature, 32 G modulation amplitude, 100 kHz modulation frequency, 2 min/scan, 0.25 s time constant. The Mn(II) six-line EPR signal amplitudes were determined using the low-field peak-to-trough measurements for the 2nd, 3rd, and 6th hyperfine lines.
XANES spectra were recorded on beamline 7-3 at SSRL (Stanford Synchrotron Radiation Laboratory) essentially as in Roelofs et al.49 An incident X-ray beam of 1 × 11 mm2 dimension with a flux of approximately 3.5 × 10¹⁰ photons/s was used for the XANES experiments. Three vertical positions of 1 mm height each were used for each sample, and only 2 or 3 scans were collected at each separate position to minimize and monitor radiation damage. A third scan at each position was taken for fewer than 25% of the XANES samples. The samples were protected with a shutter from the beam at all times unless a measurement was in progress. For the XANES spectra, 41–49 scans (2–3 scans per position, 3 positions per sample) were averaged per flash number for the 0F–3F spectra, and 11–13 scans (2–3 scans per position, 3 positions per sample) were averaged per flash number for the 4F–6F spectra. Second derivatives between 6535 and 6575 eV were calculated for each point by fitting a cubic polynomial to a range of ±3 eV around that point and computing the 2nd derivative of the polynomial. For additional experimental details, see Supporting Information.
Kβ emission spectra were recorded on beamline 10-2 at SSRL using a crystal array spectrometer with ≤ 1 eV energy resolution.60 The PS II samples were positioned with an angle of 15° between the surface of the sample and the incident X-ray beam and were kept in an Oxford CF1208 cryostat at a temperature of 10 ± 1 K under an ambient pressure He atmosphere. An incident X-ray beam (10.45 keV) of 1 × 4 mm2 dimension and a flux of approximately 7 × 10¹¹ photons/s (~10× higher energy absorption per unit of sample volume than for XANES) were used.
The crystal array monochromator contained eight 8.9 cm diameter spherically curved Si(440) crystals mounted on a movable table; the crystals were placed in an arc at a radial distance r = 85 cm from the sample. An energy-resolving Ge detector was mounted on a movable platform positioned below the sample and cryostat in an approximate Rowland circle geometry. Bragg diffraction from the crystals allowed the detection of X-ray fluorescence from PS II at specific wavelengths of the broadband X-ray fluorescence spectrum. By moving the crystals and Ge detector vertically, the Bragg angle between the X-ray fluorescence and the Si crystal normal could be changed, thereby changing the wavelength of detection.
The samples were protected with a fast pneumatic shutter from X-ray exposure during all spectrometer movements. To minimize and quantitate the effect of photoreduction, the following scan protocol was used. The Kβ1,3 main peak (6483.6–6497.3 eV) was initially scanned twice (5 s/point, 6 min scans, ~0.2 eV step size) and was then measured a third time after the Kβ′ region (6467.4–6483.6 eV, 19.5 min scan) and the high energy region (6496.5–6510.9 eV, 11 min scan) were collected. Thirty-three to thirty-nine separate scans (3 positions per sample, 11–13 separate samples) per flash number were collected for the first Kβ1,3 scans (shown in Figure 5B). The total number of counts from all of the first Kβ1,3 scans at all three positions was 8100–9000 counts per flash number. Similar counts were obtained from the second Kβ1,3 scans; however, fewer of the third Kβ1,3 scans were collected, and only 2400–3600 counts were obtained. Only the data from the first Kβ1,3 scans at each position were used for the spectra shown in Figure 5B. To reduce contributions from systematic errors, all of the Kβ spectra shown in this paper were collected in the same experimental run. The calibration of the instrument was checked periodically throughout the run with a MnF2 sample and was found to be invariant.
Figure 5.
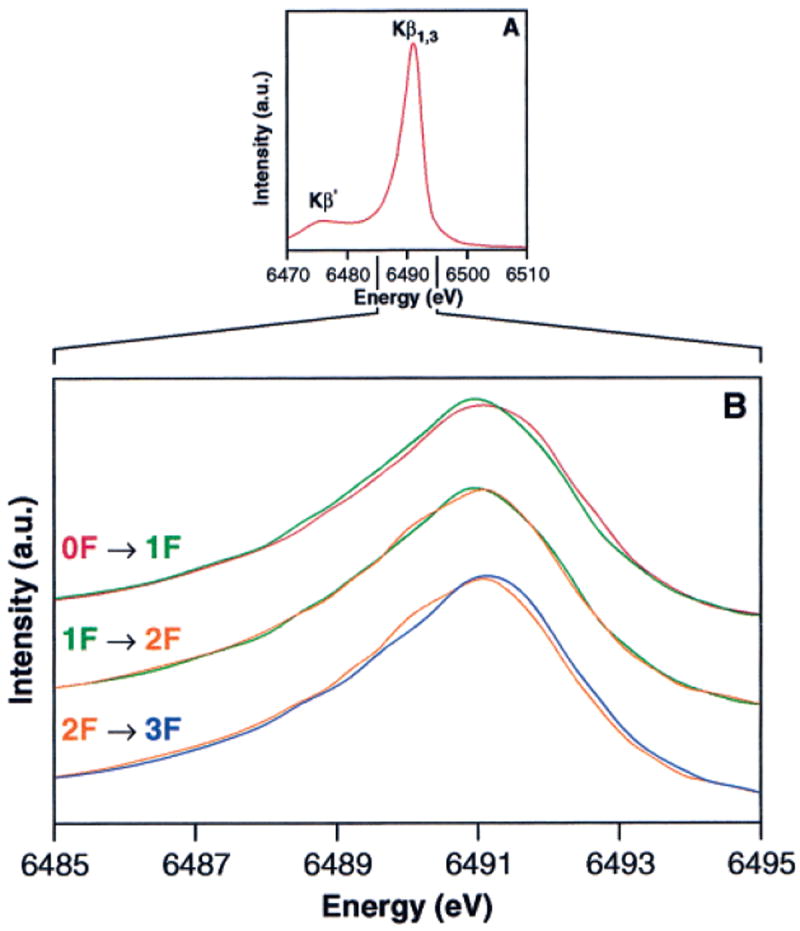
Kβ emission spectra of PS II flash samples. (A) The composite Kβ emission spectrum from 15 individual 0F PS II samples. This spectrum has been reconstructed from piecewise scans of the high-energy tail, Kβ1,3, and Kβ′ regions on each sample, as explained in the Materials and Methods section. (B) Overplots of the Kβ1,3 emission spectra of the 0F, 1F, 2F, and 3F PS II samples. The spectra were normalized as described in the Materials and Methods section. The sum spectra of the first Kβ1,3 emission scans (6 min scan time each) at each sample position are shown. The magnitude of the first-moment shift for Mn2(III)O3 → Mn(IV)O2 (shown in Figure 4) is significantly larger than the first-moment shift for the S1 → S2 transition, where only 1 Mn out of 4 is being oxidized.
The following data reduction was performed on the raw Kβ emission spectra of PS II: (a) A linear background (less than 10% of the peak intensity of ~9000 counts) arising from Compton scattering and other fluorescence emission (mostly Fe Kα) was subtracted. The linear background was chosen so as to align the PS II data with those of highly concentrated Mn oxides in the low (<6470 eV) and high (>6505 eV) energy regions. The fluorescence intensities in these low and high energy regions are invariant with oxidation state (see Figure 4). (b) The individual data points were binned (step size varied from 0.1 to 0.24 eV) into groups of 9 or 5 points in the tails and 2 points in the Kβ1,3 peak.63 (c) The spectra were splined onto a grid of 0.1 eV energy steps to facilitate the calculation of 1st-moment (〈E〉) values. (d) The spectra were then normalized by assigning the integrated area from 6467.9 to 6510.4 eV to be 1; this had no effect on the 1st-moment value. The 1st-moment values were calculated between 6485 and 6495 eV using the formula shown in eq 1:
| (1) |
where Ej and Ij are the energies and fluorescence intensities, respectively, of the jth point. This is a different quantitation method than the method used in Bergmann et al.,59 which assigned the position of the Kβ1,3 feature as the top of the Kβ1,3 peak. Although the observed shifts are smaller, the 1st-moment method is better suited for very small shifts than the method used in Bergmann et al.59 because the statistics from the entire Kβ1,3 peak (6485–6495 eV) are used for the calculation of the 1st moment.
Figure 4.
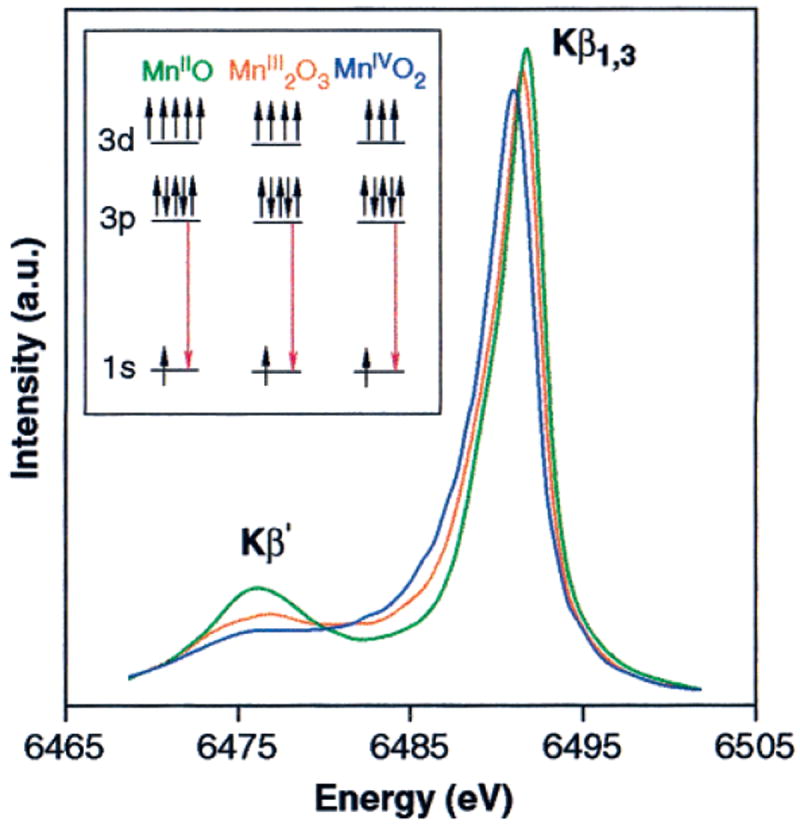
Kβ emission spectra of Mn oxides. This figure shows the changes in the Kβ emission spectrum due to Mn oxidation. The inset shows a pictorial representation of the Kβ fluorescence transition for each of the oxides. The spectra were normalized by the integrated area under the spectra, as described in the Materials and Methods section.
Results
EPR
Characterization of the samples using EPR spectroscopy is a critical aspect of these experiments, because it is the only way to determine S-state composition as a function of flash number for the same samples that are subsequently used in the X-ray experiments. Starting from dark-adapted samples, the S2-state multiline EPR signal is maximal after 1 flash and oscillates with a period of four as a function of flash number; thus the S2-state multiline EPR signal can be used to characterize the S-state distribution of samples given 0 to 6 flashes. The S2-state multiline EPR signal was measured on each of 109 separate samples given no preflashes (NPF) or given 0, 1, 2, 3 4, 5, or 6 flashes.
Figure 1A shows the difference spectra (sample minus buffer) obtained by averaging all samples of a given flash number. These spectra are normalized according to the total Mn content of each sample (see the Materials and Methods section). A deep period-four oscillation is observed with maxima on the first and fifth flashes, indicating that there is very little dephasing of S-state advancement with flashes and an initial S-state population of almost 100% S1. The signal-to-noise ratio of these average spectra allows a reliable quantitation of even the small S2-state multiline EPR signal amplitudes in the 0F, 3F, and 4F samples. This can be seen by the comparison to the EPR spectrum of the NPF sample, which has no S2-state multiline EPR signal. For each spectrum shown in Figure 1A, the four designated S2-state multiline EPR signal peaks were quantitated (see the Materials and Methods section); the results are shown as the solid line in Figure 1B, with the 1F value normalized to 100%. In addition, the S2-state multiline EPR signal quantitations for each sample are shown as filled circles in Figure 1B.
Figure 1.
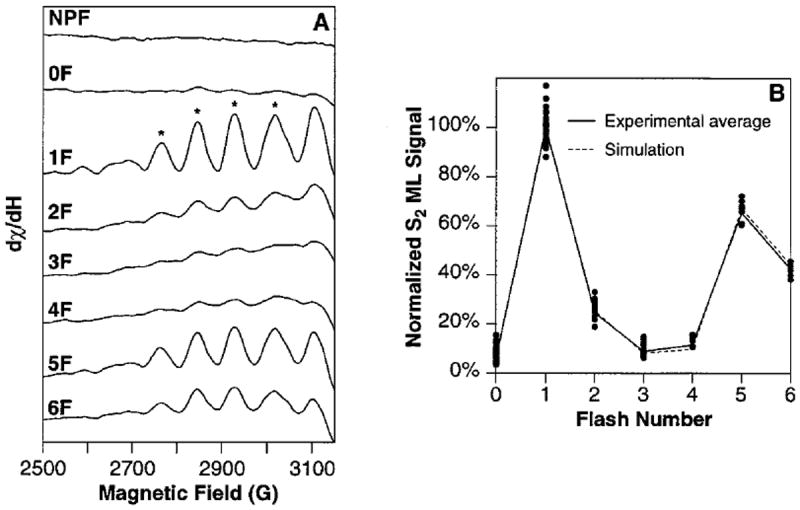
S2-state multiline EPR signal oscillation pattern. (A) EPR difference spectra (flash sample minus buffer spectrum) of the low-field side of the S2 multiline. The spectra shown are the average of all samples used in this study. Spectra from 2, 23, 23, 18, 19, 9, 7, and 8 samples were averaged for the NPF, 0F, 1F, 2F, 3F, 4F, 5F, and 6F spectra, respectively. They are normalized to their total Mn contents, which were determined as described in the Materials and Methods section. The sloping baseline that is apparent at high field is due to a flash-induced background signal in the Lexan sample holders. This signal was shown in flashed empty sample holders to be a very broad EPR signal with no hyperfine structure. Thus, it does not affect the quantitations of the S2-state multiline EPR signal hyperfine peaks. (B) The S2-state multiline EPR signal amplitudes obtained from the designated peaks in Figure 1A are shown as a function of flash number (solid line). The data points are measurements on the spectra from individual samples and are normalized to the Mn content in each sample (see the Materials and Methods section). The best fit to the S2-state multiline EPR signal oscillation pattern (fit no. 4 in Table 1) is shown as a dashed line. All S2-state multiline EPR signal amplitudes were normalized to the average 1F S2-state multiline EPR signal amplitude. Spectrometer conditions: 2800 ± 500 G scan range, 25 000 or 40 000 gain, 30 mW microwave power, 9 K temperature, 32 G modulation amplitude, 100 kHz modulation frequency, 2 min/scan, 2 or 4 scans per sample, 0.25 s time constant, 9.26 GHz microwave frequency. MLS amplitudes were determined from the low-field and high-field peak-to-trough measurements for each designated peak.
Due to factors such as redox equilibria between the cofactors in PS II,64 it is inevitable that some dephasing occurs while the OEC is advanced through the various S-states. The original Kok model explains this by assuming two parameters: the miss probability (α) accounts for the percentage of centers that do not advance in each flash and the double-hit probability (β) describes the percentage of centers that make two turnovers in a single flash (Si → Si+2).4,65 Double hits are caused by the long (~100 μs) tail of the 3–5 μs Xe flashlamp pulses commonly used;66 the rates of S-state turnovers are in most cases limited by the QA− → QB or QA− → QB− electron transfers, which are on the same time scale as the tail of the Xe flashlamp pulse. The short (9 ns) Gaussian-shaped pulses from Nd:YAG lasers do not have these tails, making double hits negligible for laser flash illumination. According to the Kok model, a sample that is initially 100% in the S1 state will have an S-state distribution of α % S1, (100 − α − β) % S2, and β % S3 population after the first flash. This analysis can be extended for subsequent flashes to the point where the complete S-state distribution as a function of flash number can be easily derived if the quantities α and β are known. We have used this model to calculate the S-state population for each flash number and have compared the calculated S2-state values to the measured amplitudes shown in Figure 1B. Using a Microsoft Excel spreadsheet and a least-squares minimization routine, the error between the calculated and measured S2-state populations was minimized using α and β as adjustable parameters.
A systematic approach has been used to extract a reliable S-state distribution from our S2-state multiline EPR signal oscillation pattern. The results from applying the original Kok model to the experimental data in Figure 1B are shown as fit no. 1 in Table 1. The value of β was set to 0 for this fit based on the short pulse width of the Nd:YAG laser pulses (vide supra). A noticeable improvement in the fit, shown in fit no. 2, is obtained by varying the initial S2-state percentage in addition to α. This is justified because there is a discernible (6.2%) S2-state multiline EPR signal for the 0F samples due to the presence of PPBQ during the preflash treatment. Exogenous quinones such as PPBQ are known to extend the S2- and S3-state lifetimes by minimizing recombination reactions with the acceptor side, and are necessary to obtain deep S2-state multiline EPR signal oscillation patterns in isolated PS II membranes.67,68 Because Lexan sample holders, which allowed the EPR and X-ray spectroscopy to be performed on the same samples, and not EPR tubes were used to hold the PS II samples, PPBQ could not be added and mixed into each sample after the preflash and was therefore added to the entire PS II aliquot before the preflash treatment. The possibility of double hits was also considered; but, as expected (vide supra), the inclusion of double hits, shown in fit no. 3, does not significantly improve the fit quality.
Table 2.
S-State Composition of Samples Given 0 to 6 Flashesa
| S0 | S1 | S2 | S3 | |
|---|---|---|---|---|
| 0F | 0.0 ± 0.0 | 94.3 ± 2.9 | 5.7 ± 2.9 | 0.0 ± 0.0 |
| 1F | 0.0 ± 0.0 | 10.2 ± 0.9 | 84.7 ± 2.6 | 5.1 ± 1.7 |
| 2F | 4.5 ± 0.6 | 1.6 ± 0.6 | 21.5 ± 3.5 | 72.4 ± 4.8 |
| 3F | 65.2 ± 5.0 | 4.6 ± 0.4 | 7.0 ± 3.0 | 23.2 ± 1.2 |
| 4F | 27.7 ± 1.3 | 59.0 ± 3.9 | 8.3 ± 1.1 | 5.0 ± 0.5 |
| 5F | 7.5 ± 1.1 | 31.5 ± 1.7 | 56.8 ± 1.8 | 4.2 ± 1.0 |
| 6F | 4.6 ± 1.0 | 10.5 ± 1.8 | 37.6 ± 3.8 | 47.3 ± 4.7 |
The numbers were calculated using fit no. 4 in Table 1. The maximum error in S-state populations is obtained from fits to a “least-damped” and a “most-damped” oscillation pattern, which were obtained using the high or low ends of the standard deviations calculated from the individual data points in Figure 1B. The “least damped” pattern used the following standard deviations: 0F, low; 1F, high; 2F, low; 3F, low; 4F, low; 5F, high; 6F, low. The “most damped” pattern used the following standard deviations: 0F, high; 1F, low; 2F, high; 3F, high; 4F, high; 5F, low; 6F, high.
However, none of these 3 fits properly accounts for the small but significant S2-state multiline EPR signal amplitudes for the 3F and 4F samples. It is therefore necessary to use “extended Kok models”, whereby additional dephasing parameters are used to explain the 3F and 4F S2-state multiline EPR signal amplitudes. Several phenomena aside from α and β can lead to dephasing of S-state advancement. One possibility is the initial presence of some reduced tyrosine YD, which can rapidly recombine with the S2 and S3 states during the time between the flashes, oxidizing YD to YD ox and reducing the Mn cluster.69 However, the preflash protocol that was used converts YD to YD ox in nearly all centers, as shown by a lack of an increase in the YD ox EPR signal with increasing flash number (data not shown); thus, this reaction cannot account for the observed S2-state multiline EPR signal amplitudes in the 3F and 4F samples. Another scenario concerns the presence of a certain percentage of acceptor-impaired centers. It has been shown that, even in whole plant leaves, in some PS II centers the acceptor-side quinone QA− is oxidized with a t1/2 of 2–3 s and that full recovery takes up to 100 s;70,71 thus these centers are effectively blocked from multiple turnovers with a flash frequency of 1 Hz. In addition, much higher S2-state multiline EPR signal amplitudes are observed for the 3F and 4F samples in the absence of PPBQ (data not shown); thus, it is reasonable to consider acceptor-side limitations. For simplicity,72 we modeled this as a variable percentage of centers which advance with the normal miss parameter α for the first flash, but cannot advance on any subsequent flashes; thus, the miss parameter for these centers for subsequent flashes is 100%. Fit no. 4 in Table 1 shows that including these “impaired centers” as a fit parameter significantly improves the fit. The dashed line in Figure 1B represents our best fit to the data, fit no. 4, with a 10.8% miss parameter, 5.7% of the centers initially in the S2 state, and 4.7% impaired centers. To obtain maximal error limits, similar fits were made to a ‘“most damped” pattern and a ‘least damped’ pattern that were constructed using the respective higher and lower ends of the standard deviations from the individual S2-state multiline EPR signal measurements shown in Figure 1B (see Table 2 for details).
Table 1.
Fits to the S2 Multiline EPR Signal Oscillation Patterna
| fit no. | α, % | initial S2, % | I.C., % | β, % | fit error | fit quality |
|---|---|---|---|---|---|---|
| 1 | 11.4 | 197 | 33 | |||
| 2 | 11.7 | 7.9 | 64 | 13 | ||
| 3 | 11.6 | 6.7 | 1.5 | 42 | 11 | |
| 4 | 10.8 | 5.7 | 4.7 | 10.5 | 3 |
The S2 multiline EPR signal oscillation pattern shown as a solid line in Figure 1B was fit with an (extended) Kok model: α and β are the miss and double-hit parameters, respectively, and I.C. gives the percentage of “impaired centers” (see Results for details). The fit error and fit quality were calculated as follows: Fit error = Σ(residual2) and fit quality = (fit error)/(7 – no. of free parameters).
Using the fit parameters from fit no. 4, the S-state distributions of samples given 0, 1, 2, 3, 4, 5, and 6 flashes have been calculated and are shown in Table 2. As expected, the 0F, 1F, 2F, and 3F samples are predominantly in the S1, S2, S3, and S0 states, respectively, and the deep S2-state multiline EPR signal oscillation pattern that was obtained contributes to a fairly high S-state purity for the 0F–3F samples. The information in Table 2 is necessary to extract pure S-state X-ray spectra from the measured X-ray spectra of samples given 0–3 flashes. It should be emphasized that the S-state distributions calculated from fit no. 2 (the standard Kok model) are well within the maximum error limits shown in Table 2, indicating that, while the inclusion of impaired centers improves the fit to the S2-state multiline EPR signal oscillation data, under our conditions, they have a negligible effect on the overall S-state distributions and the resulting pure S-state spectra.
XANES
The XANES spectra from samples given 0–3 flashes are shown in the upper portion of Figure 2A. The edge shift that is apparent between the 0F and 1F spectra indicates that Mn oxidation occurs during the S1 → S2 transition. However, it is less clear that there is a significant shift between the 1F and 2F spectra, which suggests that Mn is not oxidized as the OEC proceeds from the S2 to the S3 state. As expected, the edge position shifts to lower energy between the 2F and 3F spectra, reflecting mainly the S3 → [S4] → S0 transition. However, due to 23% of the centers being in the S3 state in the 3F spectra, the edge position is at a higher energy than would be expected for the pure S0 state.
Figure 2.
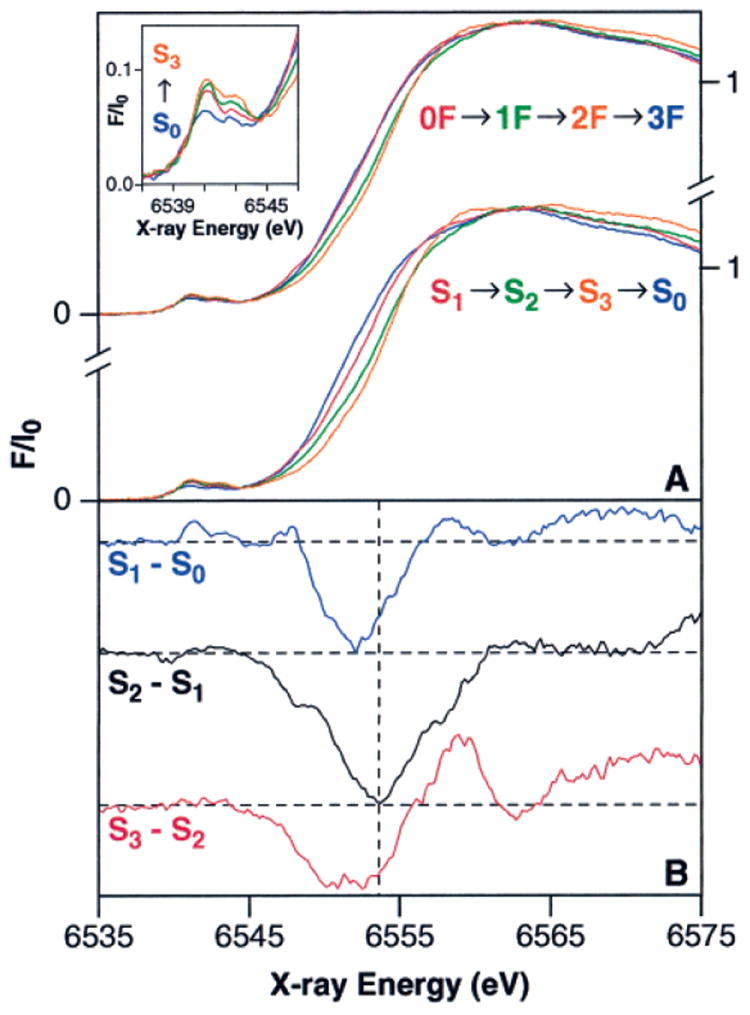
Mn K-edge XANES spectra of flash-illuminated PS II samples. (A) Pure S-state spectra (bottom) were obtained from the flash spectra (top) by deconvolution using the inverse of the S-state distribution matrix in Table 2, as described in the text. The pre-edge region (principally a 1s → 3d transition) for the S0–S3 states is shown in the inset. (B) S-state XANES difference spectra. The spectra are multiplied by a factor of 5 and are vertically offset for clarity. The horizontal dashed lines show the zero value for each difference spectrum.
Using the known S-state distributions shown in Table 2 for the flash samples, the flash spectra can be deconvoluted to obtain the pure S-state spectra as follows. The S-state distributions in Table 2 describe the flash spectra as a linear combination of pure S-state spectra, as shown in eq 2. By multiplying both
| (2) |
sides of eq 2 by the inverse of the S-state distribution matrix M, pure S-state spectra can be obtained from flash spectra. Using this approach, the XANES spectra given 0–3 flashes, shown in the upper portion of Figure 2A, were deconvoluted into the pure S-state spectra, shown in the lower portion of Figure 2A. It is clear from these pure S-state spectra that the edge position shifts to higher energy during both the S0 → S1 and S1 → S2 transitions, confirming our previous conclusions that Mn oxidation occurs during both of these S-state transitions.22,46,49 However, the S2- and S3-state XANES spectra show a much smaller edge shift than the S1 → S2 transition, as well as a change in the shape of the edge between the S2 and S3 states. The S-state difference spectra (Figure 2B) show these differences prominently. The fact that the shape and position of the S3 – S2 difference spectrum is unlike that of the S2 – S1 or S1 – S0 difference spectrum indicates that the chemistry of the S2 → S3 transition is not the same as the S0 → S1 and S1 → S2 transitions, where Mn oxidation is thought to occur on each step. One possible explanation for this is that a species other than Mn is oxidized during the S2 → S3 transition. However, it is difficult to confirm this hypothesis based solely on XANES difference spectra (as shown in Visser et al.73) or based on visual comparisons between the spectra as shown in Figure 2A. Instead, an analysis method that has been proven through comparisons to model complexes, such as the 2nd-derivative method (vide infra), should be used to derive insight into oxidation-state changes.
Further information about edge shape and position can be obtained by taking the 2nd derivative of the XANES spectrum.17,18,43,45,46,74-80 Figure 3 shows the 2nd derivatives of the pure S-state spectra from Figure 2A compared to the 2nd derivatives for each flash sample. The spectra of the individual flash samples, shown in Figure 3A, demonstrate the reproducibility achieved in this experiment. In addition, the S-state homogeneity of the flash samples (see Table 2) is reflected in the similarity between the 2nd derivatives of the experimentally obtained flash-sample spectra (Figure 3A) and the deconvoluted S-state spectra (Figure 3B). The edge positions for each of the S-states have been quantitated by measuring the inflection point energy (IPE), given by the zero-crossing of the 2nd derivative; the results are shown in Table 3. Extensive model compound studies have shown that, without exception in our study of more than 13 sets of compounds, when Mn is oxidized by one electron in a set of Mn model compounds with similar ligands, the IPE shifts 1–2 eV to higher energy upon Mn oxidation, regardless of nuclearity.17,73 Thus, the shifts in the IPE values of 2.1(±0.15) eV and 1.1(±0.05) eV during the S0 → S1 and S1 → S2 transitions, respectively, confirm that Mn oxidation occurs during each of these transitions. However, the IPE shift for the S2 → S3 transition is only 0.3(±0.05) eV, confirming under improved conditions the earlier results of Roelofs et al.,49 and providing strong evidence that a Mn-based oxidation does not occur during this transition.81 It is noteworthy that a comparison of the IPE values from the 2nd derivatives of the 1st and 2nd XANES scans for each flash number shows no change within experimental error (<0.1 eV); therefore, X-ray photoreduction did not affect the XANES experiments (data not shown).
Figure 3.
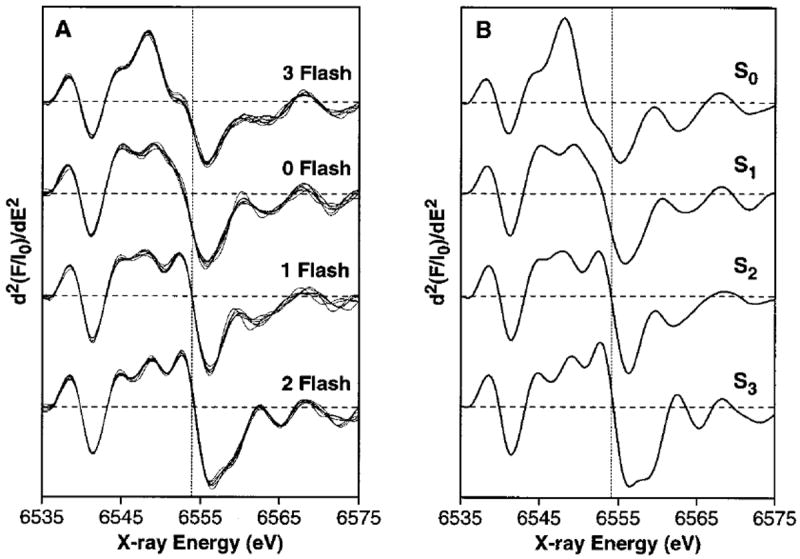
2nd derivatives of Mn K-edge XANES spectra. (A) Samples given 0, 1, 2, or 3 flashes. The individual 2nd-derivative spectra from 7, 6, 7, and 7 samples given 0, 1, 2, or 3 flashes, respectively, are shown. The dashed vertical line marks the average inflection point energy for the 1F spectra. The individual edge spectra from which these 2nd derivatives were calculated were used to generate the composite XANES flash spectra shown in the upper portion of Figure 2A. (B) Deconvoluted S-state spectra. These spectra are the 2nd derivatives of the S-state XANES edge spectra shown in the lower portion of Figure 2A. The dashed vertical line is at the inflection point energy for the S2-state spectrum. Because of the high S-state purity of the flashed samples, the deconvoluted S-state spectra are quite similar to the experimentally obtained flash spectra shown in part A of this figure.
Table 3.
Second-Derivative Inflection Point Energy (IPE) Values for the S0, S1, S2, and S3 Statesa
| 2nd-derivative IPE values | |
|---|---|
| S0 | 6550.8 ± 0.1 |
| S1 | 6552.9 ± 0.1 |
| S2 | 6554.0 ± 0.1 |
| S3 | 6554.3 ± 0.1 |
The numbers were calculated using fit no. 4 in Table 1. The maximum IPE error shown above is obtained by calculating S-state distributions from fits to a “least-damped” and a “most-damped” oscillation pattern, and then using those S-state distribution matrices to deconvolute the flash spectra in Figure 2A into pure S-state spectra.
The inset of Figure 2A shows the pre-edge (1s → 3d) transitions for each of the S-states S0, S1, S2, and S3. This formally dipole-forbidden transition contains information about the oxidation state and geometry42 of Mn in the OEC. Analysis of these features in mononuclear metalloproteins with Fe at the active site47,82-87 and Fe model complexes88,89 has proven useful in determining the coordination number and oxidation state of Fe. The pre-edge region in the inset of Figure 2A shows changes with S-state; the most prominent change occurs between the S0 and S1 states. It also shows the quality of the XANES spectra from this experiment. The analysis of the pre-edge region is complicated by the tetranuclear nature of the Mn cluster; the majority of such studies to date have dealt with mononuclear systems, and some studies have been done on homovalent binuclear complexes. Further investigations of the pre-edge region from PS II and Mn model compounds will aid in interpretation of the 1s → 3d features in Mn model compounds and metalloenzymes.
Kβ Emission Spectroscopy
Shown in Figure 4 are the Kβ emission spectra of Mn(IV)O2, Mn2(III)O3, and Mn(II)O, which illustrate the features of Kβ emission spectra and their sensitivity to the oxidation states of Mn. Although a more detailed analysis of these spectra requires the use of ligand-field multiplet calculations,58 a qualitative understanding of the spectra can be obtained without these calculations. The Kβ emission spectra in Figure 4 consist of two main features: the Kβ′ peak at ~6475 eV and the Kβ1,3 peak at ~6490 eV. The separation of these two features is due to the exchange interaction of the unpaired 3d electrons with the 3p hole in the final state of the 3p → 1s fluorescence transition.90,91 The spin of the unpaired 3d valence electrons can be either parallel (Kβ′) or antiparallel (Kβ1,3) to the hole in the 3p level. Furthermore, the Kβ features are broadened by the finite lifetimes for the initial and final states as well as spin–orbit and multiplet splittings. In the case of the Kβ′ line, the final-state lifetime is much shorter compared to the Kβ1,3 line and hence the structure is broader and has a smaller peak intensity.92
As the oxidation state of Mn increases from Mn(II) to Mn(III) to Mn(IV), fewer unpaired 3d valence electrons are available to interact with the 3p hole; thus, the magnitude of the 3p–3d exchange interaction becomes smaller, leading to a decrease in the Kβ′–Kβ1,3 splitting.93 The consequence is that, if one focuses only on the more intense Kβ1,3 emission peak, it shifts to lower energy as Mn is oxidized.94
The shifts in the Kβ1,3 emission peaks can be quantitated using a 1st-moment analysis described in eq 1, which in essence calculates the “center of mass” of the Kβ1,3 spectrum along the energy axis within the integration limits used. As Mn is oxidized from Mn(II) to Mn(III) in the oxide series, the 1st moments (〈E〉) shift to lower energy by 0.30 eV. The Mn(III) → Mn(IV) 〈E〉 shift of 0.33 eV is similar. It should be emphasized that these shifts are much larger than those expected for PS II, because each of the Mn atoms in the oxide samples is changing oxidation state. However, in PS II maximally 1 out of 4 Mn atoms in the OEC is oxidized during each S-state transition (except S3 → [S4] → S0).
The composite Kβ emission spectrum from 15 individual 0F samples is shown in Figure 5A. This spectrum has been reconstructed from piecewise scans of the high-energy tail, Kβ1,3, and Kβ′ regions on each sample, as explained in the Materials and Methods section. Figure 5B shows the main Kβ1,3 emission peak for the 0F, 1F, 2F, and 3F samples. Only the first 6-min Kβ1,3 emission scan of each position was used for these spectra, which are the average of 33–39 separate scans (3 positions per sample, 11–13 separate samples) per flash number. It is evident that the Kβ1,3 emission peak shifts to lower energy for the 1F sample relative to the 0F sample, reflecting the Mn oxidation that occurs during the S1 → S2 transition. However, there is no clear shift between the 1F and 2F samples, which is again suggestive that Mn is not oxidized during the S2 → S3 transition. The large shift in the opposite direction (to higher energy) between the 2F and 3F spectrum is expected, because Mn is reduced during the S3 → [S4] → S0 transition. The flash spectra have been deconvoluted to generate pure S-state spectra as described earlier, and the calculated Kβ1,3 emission spectra for the S0, S1, S2, and S3 states are shown in Figure 6. The pure S-state Kβ1,3 emission spectra are quite similar to the Kβ1,3 emission spectra from the flash samples shown in Figure 5B due to the high degree of S-state purity of the flash samples. On the basis of the spectra shown in Figure 6, the 1st-moment shift observed for the S1 → S2 transition, where 1 Mn out of 4 is oxidized, is 0.06 eV. In contrast, the 1st-moment shift for the S2 → S3 transition is only 0.02 eV.95
Figure 6.
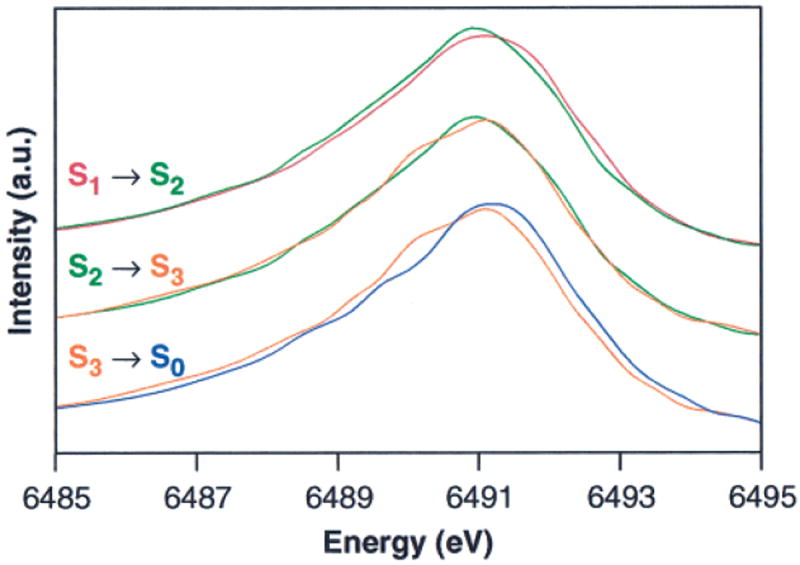
Overplots of the normalized (area under the peak) Kβ1,3 emission spectra of PS II samples in the S0, S1, S2, and S3 states. These spectra were generated by deconvoluting the flash spectra shown in Figure 5B, as described in the text.
The changes in the Kβ1,3 emission spectra can also be visualized as difference spectra. This was done by smoothing the pure S-state spectra (shown in Figure 6) by fitting a cubic polynomial of 3 eV width around each point, and then performing the subtractions to generate the S-state difference spectra shown in Figure 7. The derivative-shaped S1 − S0 and S2 − S1 difference spectra show that the Kβ1,3 peak shifts to lower energy during both the S0 → S1 and S1 → S2 transitions. This reinforces the earlier conclusions that Mn oxidation occurs during both of these transitions. However, the derivative-shaped feature is noticeably absent in the S3 − S2 difference spectrum, thus providing compelling evidence that the S2 → S3 transition proceeds without Mn oxidation.
Figure 7.
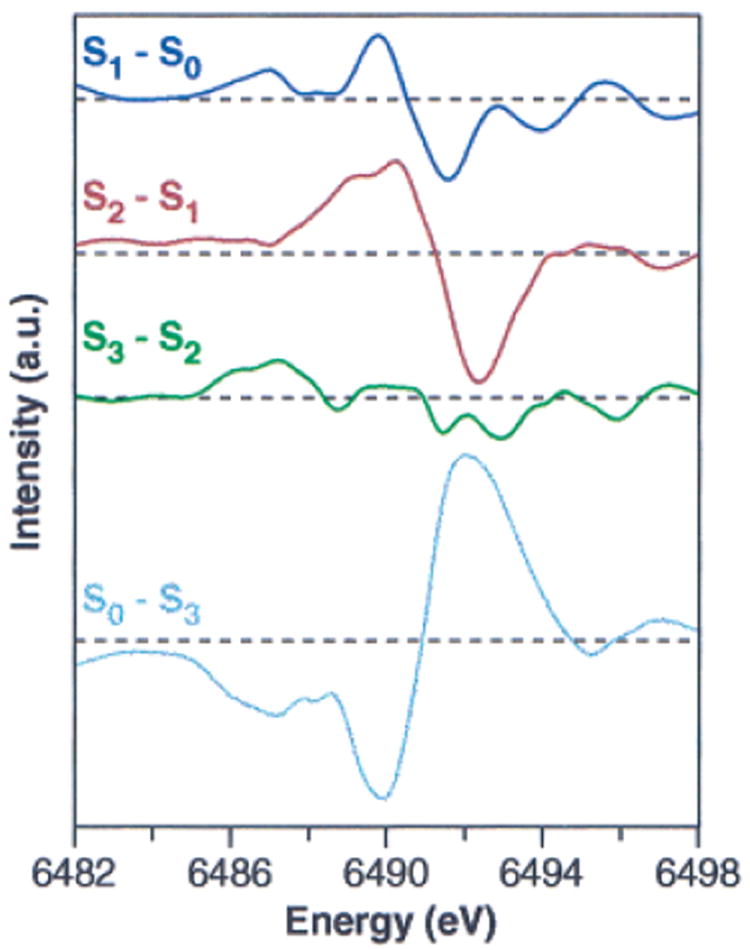
Kβ emission difference spectra of PS II. The Kβ emission spectra from Figure 6 were smoothed by fitting a cubic polynomial of 3 eV width to each point, and were then subtracted to generate the spectra shown.
The Mn Kβ XES experiment was performed three different times, although only the results from the third experiment are presented in this paper. This is because, of the three sets, the third set of samples was the most completely characterized by EPR, XANES, and Kβ XES spectroscopies. In all three instances, the 〈E〉 shift for the S2 → S3 transition was at least three times smaller than the 〈E〉 shift for the S1 → S2 transition. The 〈E〉 shift for the S0 → S1 transition was equal to or greater than that seen for the S1 → S2 transition in two experiments and less than that seen for the S1 → S2 transition in one experiment. This variation may be related to the fact that the S0-state spectrum is the most difficult S-state spectrum to obtain through deconvolution. This also shows that it can be a disadvantage to condense all of the spectral information present in the Kβ1,3 emission spectrum into a single number. It is more informative to rely on the Kβ1,3 difference spectra from Figure 7. They clearly show that distinct differences are present between the S0-state and S1-state spectra, as well as between the S1-state and S2-state spectra. However, these differences are not present between the S2-state and S3-state spectra.
The Kβ XES protocol was carefully designed to minimize and examine the effects of radiation damage to the samples. As described in the Materials and Methods section, three Kβ1,3 emission scans were taken at each sample position; only the first Kβ1,3 emission scans from each sample position were used in the spectra shown in Figure 6. Figure 8 shows the 1st-moment values for the 0F, 1F, 2F, and 3F samples as a function of X-ray exposure time. The dashed lines show the fits to the data points for each flash number assuming 1st-order kinetics for the photoreduction process. The fits show the relative radiation damage susceptibility for each flash number, as well as an extrapolated “zero exposure time” moment for each flash number which is also shown in Figure 9. Figure 8 shows that the radiation damage rate for the 2F samples is significantly less than that of the 0F, 1F, or 3F samples. This finding excludes the possibility that the extremely small 〈E〉 shift between the 1F and 2F samples could be caused by a faster photoreduction of the S3 state compared to the S2 state.
Figure 8.
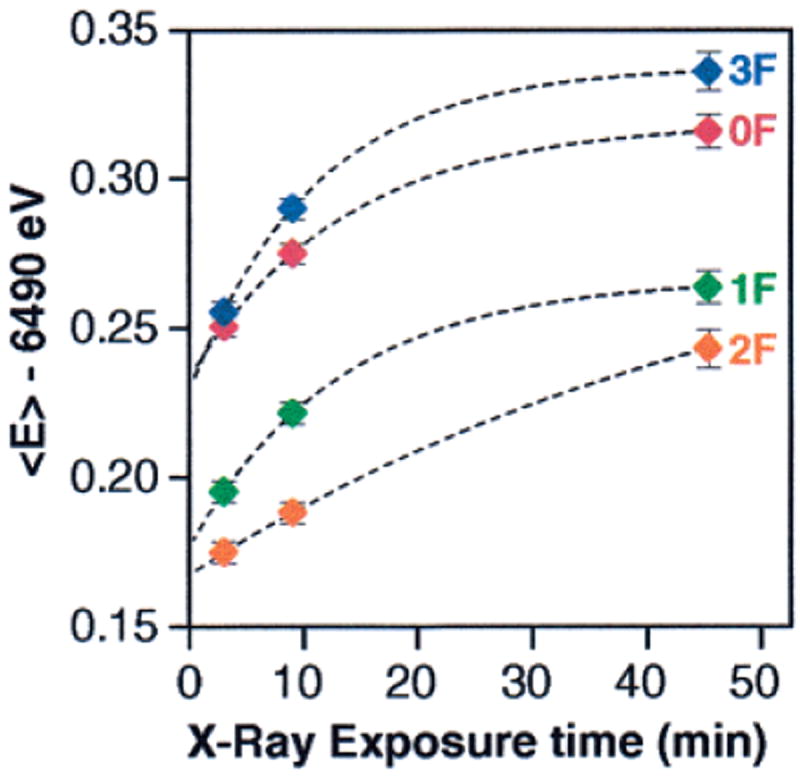
First moments of the Kβ1,3 peaks of the PS II flash samples as a function of average X-ray exposure time. The 1st moments were calculated for the energy range shown in Figure 5B. Symbols are the data points and the dashed lines are first-order fits. The error bars reflect the statistical error for each measurement and are based on the total number of counts.
Figure 9.
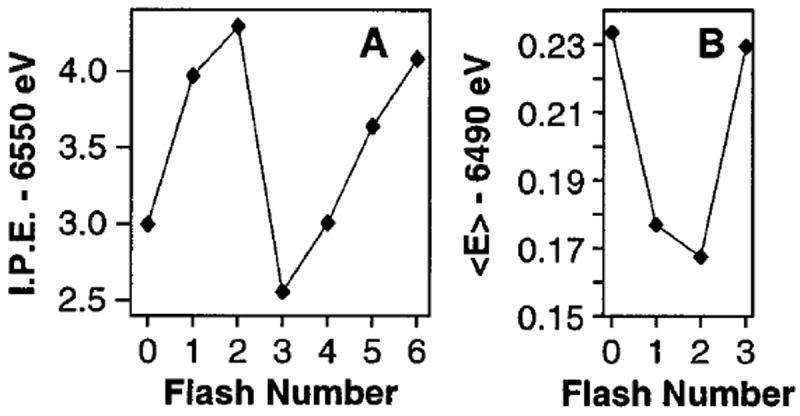
(A) Oscillation of XANES inflection point energies (I.P. E.) of the 0F to 6F samples. (B) Oscillation of first moments (〈E〉) of the Kβ emission spectra from the 0F to 3F samples (4F to 6F were not collected). The extrapolated 〈E〉 values for zero X-ray exposure time from Figure 8 are shown.
Discussion
Oxidation States of the Mn Cluster Based on XANES Spectroscopy and Kβ Emission Spectroscopy
XANES spectroscopy has been widely used for nearly 25 years to address the oxidation states of redox-active metals in metalloprotein active sites.42-51 In addition to XANES, this work applies Kβ XES for the first time to single-flash saturable concentrations (~150 μM Mn) of PS II, thus providing an important independent determination of the Mn redox states in each of the accessible S-states of the OEC in PS II.
By combining the information available from the XANES spectra (Figures 2 and 3) with the Kβ emission spectra (Figures 6 and 7) and literature data, the presence or absence of Mn oxidation during each S-state transition will be addressed in more detail, and oxidation states for the four Mn ions in each S-state, S0, S1, S2, and S3, will be proposed.
S1 → S2 Transition
As detailed in the Results section, the Mn K-edge XANES spectra and the Kβ1,3 emission spectra confirm the presence of Mn oxidation during the S1 → S2 transition, consistent with earlier XANES studies.46,49,53 This conclusion is corroborated by several other spectroscopic studies34-39,46,49 and is also confirmed by EPR spectroscopic measurements (see Introduction). In addition, simulations of the EPR signals from the S2 state also provide insight into the absolute Mn oxidation states in the S2 state. S2-state EPR multiline signal simulations by Hasegawa et al.96,97 and 55Mn ENDOR spectroscopy on the S2 state by Britt and co-workers98,99 are most consistent with the oxidation states of Mn4(III,IV3); however, simulations by Zheng et al.100 are most consistent with Mn4(III3,IV) as the oxidation states of Mn in the S2 state.
If the S2 state is proposed to be either in the Mn4(III,IV3) or the Mn4(III3,IV) oxidation states, then the oxidation states of Mn in the S1 state must be either Mn4(III2,IV2) or Mn4(III4), which are both one-electron reductions from the oxidation-state proposals for the S2 state. Although the oxidation state of Mn4(III4) for the S1 state has been suggested by a few groups,100,101 the 2nd derivative of the XANES spectrum for the S1 state shows that its edge shape is unlike the edge shape observed for Mn(III) complexes; when the 2nd-derivative XANES spectrum for the S1 state is fit using Mn(III) and Mn(IV) model compounds, it cannot be fit well using only Mn(III) model compounds.18,102 Furthermore, inspection of the only available set of tetranuclear Mn complexes with all O ligation, four distorted Mn4 (III3,IV) cubanes, shows XANES IPE values at ~6551 eV for these complexes,20 consistent with the S0-state XANES IPE of 6550.8 eV and lower than the S1-state XANES IPE of 6552.9 eV. Thus, this is also consistent with the conclusion that the oxidation states of Mn in the S1 state are Mn4(III2,IV2), not Mn4(III4).
In addition, a reductant treatment of PS II core particles with hydroquinone (a two-electron reductant) leads predominantly to the formation of the S−1 state, which is two electrons reduced relative to the S1 state. The XANES spectrum from samples in the S−1 state is best fit with a Mn4(II2,IV2) oxidation state.102 This is further supported by the stability of the S−3 state.15,103 An oxidation-state assignment of Mn4(III2,IV2) is also consistent with recent Kβ XES experiments on the S1 state. In fitting the Kβ1,3 emission spectrum for the S1 state, Bergmann et al.59 found that the best fit to the experimental data was obtained using equal amounts of the Kβ1,3 emission spectra from Mn(III) and Mn(IV) model compounds; the fit was significantly worse if only Mn(III) or only Mn(IV) was used for the fit.59
It is therefore most likely that the oxidation states for Mn are Mn4(III2,IV2) in the S1 state and Mn4(III,IV3) in the S2 state. The oxidation of Mn(III) to Mn(IV) during this transition is reflected in the 1.1 eV shift in the XANES IPE value (Table 3) and the shift of −0.06 eV in the 1st moment of the Kβ emission spectra (Figure 6). The S2 − S1 difference spectra shown in Figure 2 (XANES) and Figure 7 (Kβ XES) also confirm that Mn is oxidized during this transition. Thus, the observed changes in the IPE and 1st-moment values during the S1 → S2 transition, as well as the corresponding difference spectra, provide an internal standard for a Mn(III) → Mn(IV) oxidation within the OEC.
S0 → S1 Transition
The Mn K-edge XANES spectra for these S-states, displayed in Figure 2A, and the 2nd derivatives (Figure 3B) show a clear shift of 2.1 eV (as determined by the 2nd-derivative IPE values) in the XANES edge position during the S0 → S1 transition. In addition, the S1 − S0 Kβ XES difference spectrum, shown in Figure 7, is derivative-shaped, which is indicative of Mn oxidation during this transition. Because the S1 state has Mn oxidation states of Mn4(III2,IV2), as detailed above, the changes in the X-ray spectroscopic data could be due to either a Mn(II) → Mn(III) oxidation or a Mn(III) → Mn(IV) oxidation.
The finding that the S1 − S0 XANES difference spectrum (Figure 2B) is somewhat different from the S2 − S1 difference spectrum suggests that the S0 → S1 transition most likely reflects a Mn(II) → Mn(III) oxidation. The S1 − S0 XANES difference spectrum shown in Figure 2B contains positive features in the 6545–6565 eV range, unlike the S2 − S1 XANES difference spectrum. This includes the pre-edge region, which shows that the S0-state XANES spectrum has a lower pre-edge intensity than the S1-state XANES spectrum (also seen in the inset in Figure 2A). The shape of the XANES edge is different for the S0-state and S1-state spectra; this is shown in part by the peak at 6548 eV in the 2nd derivative of the S0-state XANES spectrum (Figure 3B). This is suggestive of the presence of Mn(II), based on comparison to the 2nd derivatives of Mn(II)-containing model compounds. The significantly larger shift in the 2nd-derivative IPE values for the S0 → S1 transition compared to the S1 → S2 transition is also indicative for a Mn(II) → Mn(III) oxidation. This is based on the finding that, for homologous sets of model compounds, the shifts in the IPE value for Mn(II) → Mn(III) oxidations are usually larger than those seen for Mn(III) → Mn(IV) oxidations. However, in agreement with Roelofs et al.,49 but in contrast to Iuzzolino et al.,53 no “Mn(II) shoulder” is observed in the pure S0 XANES spectrum (Figure 2A).
Other spectroscopic studies22,25-27,34-39 concur that Mn oxidation occurs during the S0 → S1 transition. In addition, one possible explanation of the greater spectral width of the S0-state EPR multiline signal compared to the S2-state EPR multiline signal is that Mn(II) is present in the S0 state, 25-27 which suggests a Mn(II) → Mn(III) oxidation for the S0 → S1 transition. The presence of Mn(II) in the S0 state may also explain why YD ox can oxidize the S0 state to the S1 state, but not the S1 state to the S2 state.67
The Kβ XES and XANES difference spectra, in addition to other spectroscopic data, are consistent with the assignment of the S0 → S1 transition as a Mn(II) → Mn(III) oxidation. Therefore, the oxidation states of Mn in the S0 state are proposed to be Mn4(II,III,IV2), which change upon Mn oxidation to Mn4(III2,IV2) in the S1 state, although the oxidation states of Mn4(III3,IV) for the S0 state cannot be unequivocally excluded.
S2 → S3 Transition
The most controversial S-state transition has been the S2 → S3 transition (see Introduction). Most debate has focused on whether this transition is a Mn-centered9,13,52-54 or ligand-centered8,11,12,14-16,49 oxidation. In addition, a redox isomerism between Mn and ligands has been proposed for the S3 state.10 If Mn were to be oxidized during the S2 → S3 transition, the oxidation would have to be a Mn(III) → Mn(IV) transition. A Mn(IV) → Mn(V) transition is unlikely to occur with Mn(III) still present in the complex given the proposed reactivity of the Mn(V) ion. Thus, it would be expected that the XANES and Kβ XES difference spectra, as well as the observed shifts in the XANES IPE values and the Kβ emission spectra 1st-moment values, would be essentially identical to the S1 → S2 transition, where a Mn(III) → Mn(IV) oxidation also occurs. However, as described below, the spectroscopic results for the S2 → S3 transition are completely different from those of the S1 → S2 transition.
The XANES results from Figures 2 and 3 provide strong support for a ligand-based oxidation of the OEC occurring during the S2 → S3 transition, based on the small (0.3 eV) shift in the XANES 2nd-derivative IPE values. This finding is consistent with earlier XANES studies by Roelofs et al.49 The fact that the S3 − S2 XANES difference spectrum is significantly different from the S2 − S1 difference spectrum (Figure 2B) is inconsistent with a Mn(III) → Mn(IV) oxidation occurring during the S2 → S3 transition. Instead, the S3 − S2 XANES difference spectrum shows how the shape of the XANES edge changes between the S2 and S3 states, which is consistent with a ligand-based oxidation (vide infra).
Changes in the XANES spectrum similar to those observed during the S2 → S3 transition are also observed in a different enzymatic system, galactose oxidase, as well as in model compounds that mimic its structure and reactivity. Galactose oxidase, a metalloenzyme with a mononuclear Cu active site, contains a phenoxyl radical coordinated to a CuII atom in its highest oxidation state.104 When monitored using XANES spectroscopy, the XANES edge was clearly shifted to higher energy between the CuI and CuII forms of the enzyme. However, comparison of the CuII and CuII−O• oxidation states showed that the edge shape was different and the edge position was in fact shifted to slightly lower energy.105 This trend is also seen in CuII–phenoxyl radical model complexes, where the CuII−O• complex has a different XANES edge shape from that of the corresponding CuII complex, but essentially the same edge position.79,106 In addition, DFT calculations support the formation of CuII−O• in both the enzyme and the model complexes.107
Therefore, based on the XANES data, it is reasonable to suggest that, as is formed in galactose oxidase, a ligand radical is formed in the S3 state in lieu of Mn oxidation; this will be denoted by Mn4(III,IV3)•. This interpretation is strongly reinforced by the Kβ emission spectra and Kβ XES difference spectra from Figures 6 and 7, respectively. The difference spectra clearly show that the derivative-shaped difference spectrum that is expected if Mn is oxidized, as in the S0 → S1 and S1 → S2 transitions, is absent in the S2 → S3 transition. In addition, the 〈E〉 value of 6490.157 eV for the S3 state argues against Mn oxidation during the S2 → S3 transition, because it is inconsistent with a Mn4(IV4) oxidation state, which is required for the S3 state if Mn is oxidized during the S2 → S3 transition. Comparison of the S3-state 〈E〉 value to the 〈E〉 values from 18 different mononuclear, binuclear, trinuclear, and tetranuclear Mn(IV) model compounds with different ligands, including Cl−, shows that the S3-state 〈E〉 value is higher than the 〈E〉 value for any of the Mn(IV) compounds studied (average 〈E〉 = 6490.00 eV, highest 〈E〉 = 6490.10 eV).108 It is difficult to explain this result unless Mn(III) is still present in the S3 state, which means that, based on the Mn4(III,IV3) redox states derived for the S2 state (vide supra), a Mn-based oxidation cannot occur during the S2 → S3 transition.
Effects of Structural Changes on the XANES and Kβ XES Data
This section will consider in detail whether structural changes and/or ligand rearrangements during the S2 → S3 transition could affect the detection of a Mn oxidation in the Kβ emission and XANES spectra. This is of particular interest due to the proposed structural changes during the S2 → S3 transition109,110 which were recently confirmed by direct distance measurements from EXAFS experiments.14 The detailed considerations described below show that it is unlikely that a structural change could mask the effects of Mn oxidation during the S2 → S3 transition in the OEC.
A recent paper by Visser et al.73 compares the XANES spectra from two Mn2(III,IV) binuclear complexes with different ratios of aromatic to nonaromatic ligands and different μ-oxo bridges. This comparison shows that drastic ligand rearrangements can affect the observed XANES edge shape and position to a greater degree than changes in oxidation state.
However, the Kβ XES results from the work of Visser et al.73 show that, while the previously mentioned Mn complexes have different XANES 2nd-derivative IPE values for complexes in the same Mn oxidation state, the Kβ XES 1st-moment values are essentially identical for the two different binuclear complexes in the same Mn oxidation state. This suggests that the Kβ XES 1st-moment values determined in this study should be essentially unaffected by any change in ligand environment that may occur in the OEC.
Could ligand rearrangement prevent the observation of a Mn-centered oxidation in the XANES spectra pertaining to the S2 → S3 transition? Several lines of evidence argue against this proposition. In Mn model compounds, dramatic ligand effects are seen when several aromatic ligands are substituted for aliphatic ligands and vice versa.73,111 This is because, with aromatic ligands, additional 1s → π* transitions are present just below the main 1s → 4p XANES transition;112 this shifts the XANES edge position to lower energy than is seen for complexes with aliphatic ligands. These 1s → π* transitions are absent with aliphatic ligands, because they have occupied, not unoccupied, π* ligand orbitals. The Mn cluster in PS II has very few aromatic ligands; therefore, the contribution of 1s → π* transitions to the PS II XANES spectra should be negligible. The possibility of tyrosine ligands to the Mn cluster has been ruled out by site-specific mutagenesis experiments;113 1–2 histidines, out of ~24 total ligands to Mn, are ligated to the Mn cluster in the S2 state.114-116 There is no evidence from EXAFS spectroscopy for the binding of more histidine ligands in the S3 state. If additional histidine binding occurred, histidine multiple-scattering features would appear in the Fourier trans-form of the S3-state EXAFS data; they are not present in the experimental spectra.14,117 Therefore, the effects of aromatic ligands do not need to be considered in interpreting the XANES spectra of the S-states of the OEC.
Another possible ligand substitution or rearrangement is that Cl−, an essential cofactor for oxygen evolution,118,119 could be bound in the S3 state and not in the S2 state. This is consistent with 35Cl NMR experiments by Preston et al.120 and UV absorbance experiments by Wincencjusz et al.121 which show that, in these preparations, Cl− is required for the S2 → S3 and S3 → [S4] → S0 transitions, but not for the S0 → S1 and S1 → S2 transitions. Further evidence comes from EXAFS spectroscopy experiments on oriented PS II membranes in the S3 state which show a Fourier peak at a distance of ~2.2 Å from Mn.122 On the basis of comparison to model compounds, this is consistent with Cl− binding to Mn in the S3 state.123 However, some experiments have been interpreted to suggest that Cl− binds to the Mn cluster prior to the formation of the S3 state.124-129
If Cl− were only to bind in the S3 state, its effect on the Mn K-edge XANES spectrum of PS II can be estimated by examining data from sets of Mn model compounds with and without Cl− bound. Pizarro et al.123 have examined sets of dimeric and trimeric Mn model complexes which are essentially identical except for the exchange of Cl− for oxygen-containing ligands. In the dimeric complex (two Cl− per two Mn), the edge shape changes somewhat when the Cl− ligands are replaced by an acetate bridge, but the 2nd-derivative IPE values are essentially unchanged. In the trimeric complex, which contains one Cl− per three Mn atoms, replacing Cl− with OH− causes even less of a change in the edge shape, and the 2nd-derivative IPE values are again quite similar. The effect on PS II is expected to be even less, because, if Cl− is bound to Mn in the S3 state, the ratio would most likely be one Cl− to four Mn. Thus, it is unlikely that Cl− binding in the S3 state could offset the effects of a hypothetical Mn oxidation during the S2 → S3 transition.
The most likely structural change occurring during the S2 → S3 transition is the modification of the di-μ-oxo bridges. This is based on EXAFS spectroscopic data from the S3 state that show the Mn–Mn distances changing from 2.7 Å in the S2 state to ~2.8 and 3.0 Å in the S3 state.14,24 Although the distance increase is not enough to justify a conversion from a di-μ-oxo to mono-μ-oxo motif (a 3.3–3.6 Å Mn–Mn distance would be necessary130), the effects of a modification of the di-μ-oxo bridges on the Mn K-edge XANES spectrum are well modeled by a series of Mn complexes in which the di-μ-oxo bridges of a dimeric Mn2(IV,IV) complex were successively protonated, which increased the Mn–Mn distance from 2.7 to 2.8 Å and 2.9 Å, respectively.131 These complexes showed some changes in edge shape, but almost no change in edge position (2nd-derivative IPE values of 6553.5, 6553.2, and 6553.3 eV for 0, 1, or 2 μ-oxo bridge protonations, respectively) due to di-μ-oxo bridge protonation. It is therefore unlikely that a hypothetical oxidation-state change during the S2 → S3 transition could be masked by the lengthening of the Mn–Mn distances in the S3 state, or any other plausible ligand substitutions or rearrangements. Therefore, we propose a ligand-centered oxidation for the S2 → S3 transition.
Summary of Mn Oxidation States in PS II
Figure 9 summarizes the Kβ XES and XANES flash patterns from the present study that lead to the conclusions about Mn oxidation states. Both spectroscopies show a clear shift in the spectra between the 0F and 1F samples, indicating the presence of Mn oxidation during the S1 → S2 transition. The small change between the 2F and 3F samples in both spectroscopies provides strong support for the S2 → S3 transition proceeding without a Mn-based oxidation. On the next transition, S3 → [S4] → S0, dioxygen is released, shifting the position of the 3F spectra to lower energy for XANES spectroscopy and higher energy for Kβ XES. These flash patterns are explained by the proposed oxidation states of the Mn cluster in the S0, S1, S2, and S3 states, as shown in Figure 10. Consistent with earlier proposals,8,49,132 these oxidation states are the following: S0, Mn4(II,III,IV2); S1, Mn4(III2,IV2); S2, Mn4(III,IV3); S3, Mn4(III,IV3)•.
Figure 10.
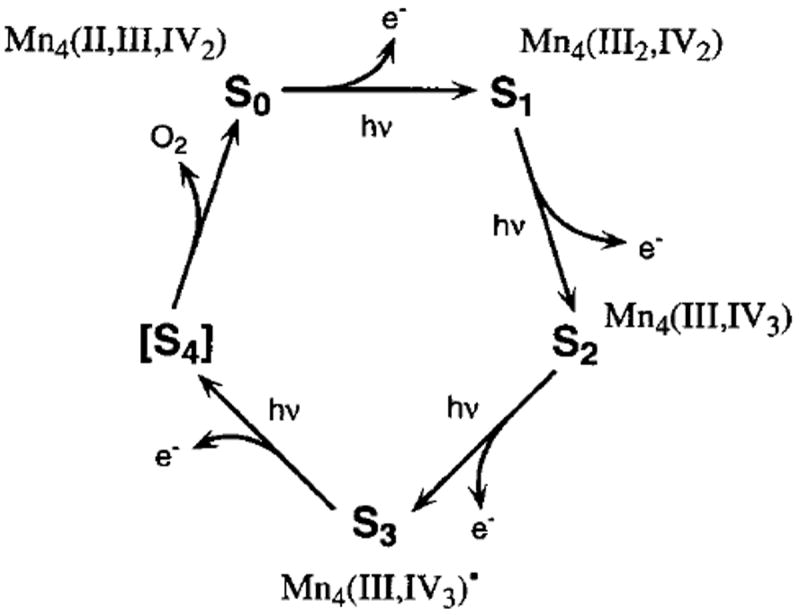
S-state scheme for oxygen evolution based on the proposal by Kok et al.4 The proposed oxidation states of Mn in each of the S-states S0–S3 based on the results from Kβ emission and XANES spectroscopy are shown. For the S3 state, it is proposed that the oxidizing equivalent is stored mainly on a direct ligand to Mn, most likely a μ-oxo bridge, and little of this spin density is present on Mn. The oxidation of a terminal ligand is less likely because of the observed lengthening of the Mn–Mn distances in the S3 state14 (see text).
Implications for the Mechanism of Photosynthetic Water Oxidation
Recent EXAFS data on the S3 state show a lengthening of the Mn–Mn distances relative to the S2 state, with one 2.7 Å di-μ-oxo bridged Mn–Mn distance increasing to 3.0 Å.14 To achieve a lengthening of Mn–Mn distances by 0.3 Å in di-μ-oxo bridged units, the bond strength of the μ-oxo bridges must be significantly decreased. This can be achieved by protonation or oxidation of the bridging oxygens. Protonation of both bridges is known to increase the di-μ-oxo Mn–Mn distance from 2.7 Å to ~2.9 Å.131 It is, however, very unlikely (and inconsistent with the external proton release pattern of PS II13,133) that protonation occurs when the complex becomes oxidized. Oxidation of one of the μ-oxo bridges is an even more drastic way to reduce the strength of the μ-oxo bridge than protonation, and would explain the experimentally determined 3.0 Å Mn–Mn distance in the S3 state. Consistent with our previous proposal,8,14 we conclude that a μ-oxo bridge becomes oxidized in the S3 state.
The presence of a radical in the S3 state is supported by recent studies by Ioannidis et al.134 comparing the reactivity of NO• toward the S2 and S3 states at 18 °C. These studies showed that the S3 state is reduced by NO• to the S1 state five times faster than the S2 state is reduced. This rate increase is especially significant given the 10–20× slower reactivity of other exogenous reductants in the S3 state.110 This is consistent with NO• acting as a radical trapping agent and the S3 state containing some radical character. The experiments with NO• also argue against a temperature-dependent redox equilibrium in the S3 state (see Supporting Information). DFT calculations by Per Siegbahn provide additional support for the presence of a radical in the S3 state.135 These calculations show that it is energetically unfavorable to oxidize Mn during the S2 → S3 transition relative to the formation of a ligand radical in the S3 state. Furthermore, this energetic preference only exists if the ligand radical is present as a μ-oxo bridge radical.
The data in this study are therefore best interpreted to show that a ligand-centered rather than a Mn-centered oxidation takes place during the S2 → S3 transition. On the basis of this result, the mechanistic proposals invoking a Mn oxidation during the S2 → S3 transition that were mentioned in the Introduction are highly unlikely.
The proposed μ-oxo bridge radical in the S3 state can be rationalized in the context of any of several possible models for the OEC. It is important to emphasize that the spatial arrangement of the Mn atoms in the OEC is not definitively known. We have stated for some time19 that several topological models (shown as A, E, F, and G in Figure 4 from DeRose et al.19) are considered equally possible on the basis of EXAFS data. Although one of the possible topological models is shown in Figure 11, similar mechanisms can be proposed using the other topological models, and should all be considered equally viable. Three different possibilities for the O–O bond formation in the S4 state are shown in Figure 11A-C: (A) Upon the S3 → S4 transition, the neighboring μ-oxo bridge also becomes oxidized and the O–O bond is formed between the two μ-oxo radicals (Figure 11A).8,14,16 (B) The O–O bond is formed between the μ-oxo bridge radical and either an unbound water molecule14,16 (Figure 11B) or a terminal water ligand. (C) In the S4-state, the μ-oxo bridge radical migrates to a terminal hydroxo group and forms the O–O bond with a second terminal Mn–O• that is formed by oxidation through YZ ox (Figure 11C).15 All three options for the S4 state generate O2, which is derived from inequivalent oxygen atoms in the S3 state, as shown by 16O/18O water-exchange measurements on the S3 state.136,137 In addition, a recent H216O/H218O FTIR experiment has shown the presence of an exchangeable di-μ-oxo-bridge in the S1 and S2 states138 and another recent H216O/H218O FTIR experiment has detected the presence of an asymmetrically hydrogen-bonded H2O molecule in the S1 and S2 states.139 Although the former result is consistent with options A and B in Figure 11 and the latter result is consistent with options B and C, it is not directly known at the present time whether either of the aforementioned species participate in oxygen evolution. The formation of a μ-oxo bridge radical in the S3 state in lieu of Mn oxidation could be viewed as the onset of water oxidation. Storing this radical on the μ-oxo bridge prevents premature O–O bond formation and possible release of reactive intermediates, which could damage the polypeptides of PS II.
Figure 11.
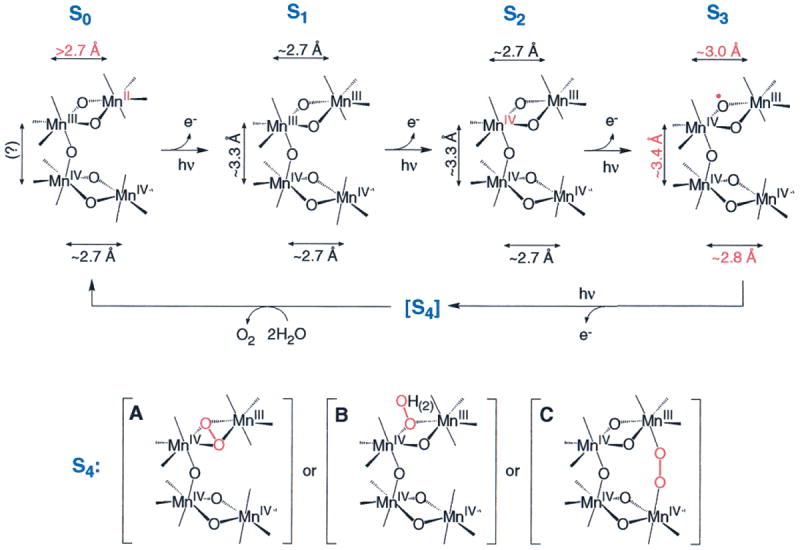
Summary of changes in Mn oxidation states and Mn–Mn distances during photosynthetic water oxidation. During the S0 → S1 transition, a Mn(II) → Mn(III) oxidation causes the decrease of the Mn–Mn distance. In the S1 → S2 transition, one Mn(III) is oxidized to Mn(IV), and the Mn–Mn distances do not change. During the S2 → S3 transition, a μ-oxo bridge is oxidized, which triggers the increase in Mn–Mn distances. In the S3 → [S4] → S0 transition, a short-lived peroxo intermediate is formed in the S4 state. Parts A, B, and C are 3 options for O–O bond formation in the S4 state (see text for details). The peroxo intermediate is further oxidized to O2, and two water molecules bind to regenerate the S0 state. For clarity, YZ, the cofactors Ca2+ and Cl−, and terminal Mn ligands are not shown. Mn–Mn distances were determined by EXAFS spectroscopy.8,23,117 As mentioned in DeRose et al.,19 Cinco et al.,20 and Robblee et al.,16 other possible topological models exist for the OEC; similar mechanisms that can be proposed for each of these alternative topological models should be considered equally viable.
Supplementary Material
Acknowledgments
This paper is dedicated to the memory of Mel Klein, who was the consummate role model as a mentor, scientist, colleague, and friend. This research was supported by the National Institutes of Health (GM-55302 to V.K.Y., GM-44891-5 and GM-48145 to S.P.C.) and the Director, Office of Science, Office of Basic Energy Sciences, Division of Energy Biosciences of the U.S. Department of Energy (DOE), under Contract DE-AC03-76SF00098. We thank Profs W. H. Armstrong, G. Brudvig, G. Christou, G. C. Dismukes, J.-J. Girerd, R. N. Mukherjee, V. L. Pecoraro, and K. Wieghardt for providing model compounds, Prof. G. Renger for the flash-induced oxygen evolution measurements, Dr. E. Anxolabéhère-Mallart for assistance with data collection at SSRL, and Dr. S. A. Mills for assistance in performing the ICP/AES measurements. Synchrotron radiation facilities were provided by the Stanford Synchrotron Radiation Laboratory (SSRL) which is operated by the Department of Energy, Office of Basic Energy Sciences. The SSRL Biotechnology Program is supported by the National Institutes of Health, National Center of Research Resources, Biomedical Technology Program, and by the Department of Energy, Office of Biological and Environmental Research. During his stay in Berkeley, J.M. was the recipient of a DFG Forschungsstipendium (Me 1629/1-1). He is now supported by a DFG Habilitationsstipendium (Me 1629/2-1) and a Sachbeihilfe (Me 1629/2-2). C.F. was the recipient of a fellowship from the Fundação de Amparo à Pesquisa do Estado de Sao Paulo.
Appendix
Comparison to Other XANES Studies
Much of the controversy surrounding the S2 → S3 transition is due to the conflicting results among earlier XANES studies of the S-states generated using single-flash turnover. The current XANES study represents a significant improvement in three important areas: (a) a high sample concentration was used, which resulted in a large improvement of the signal-to-noise ratio relative to earlier data, (b) due in part to laser flash illumination, a deep S2 EPR multiline oscillation with no double hits was achieved (this largely removes ambiguities in the deconvolution of the measured XANES spectra into the pure S-state XANES spectra), and (c) the radiation damage was monitored and minimized. Another difference between the studies is the way in which the data are analyzed; this is discussed in detail in the Supporting Information. We have used the 2nd-derivative method for determination of XANES edge energy positions based on the following criteria: (a) it is insensitive to linear background subtraction and normalization, (b) it has been used successfully by several groups for 25 years to determine the oxidation state of metal ions in metalloproteins and model complexes (see Results), and (c) in addition to the edge position, detailed information on the edge shape is provided.
For the following comparison of various XANES studies, it is very important to keep in mind that without an accurate determination of the S-state composition of the flash samples, no meaningful conclusions can be drawn about the Mn oxidation-state changes during the various S-state transitions. To achieve an accurate S-state deconvolution, the S2-state EPR multiline signal must be measured for all the samples used for the XANES experiments and a deep S2-state EPR multiline signal oscillation must be obtained. Otherwise, several different dephasing mechanisms can be invoked, each of which yields different S-state compositions for the flashed samples and different “pure” S-state spectra.
Ono et al. study52
This was the pioneering XANES study on flashed samples; unfortunately, no independent data on the S-state composition of the PS II samples were provided, which precludes a unique determination of the S-state XANES edge energies (vide supra). Among the four existing XANES studies, it is the only one in which the flash-sample XANES spectra (i.e. before deconvolution into pure S-states) show a Mn K-edge shift between the 1F and the 2F samples which is of approximately the same magnitude as the 0F to 1F shift. Because this study does not provide an independent characterization of the S-state composition of their samples, this behavior can be explained if the actual miss parameter is significantly larger than the reported miss parameter of 9%. A high miss factor in this study could be caused by (a) the low energy per pulse of the laser, i.e., nonsaturating illumination, (b) the absence of exogenous electron acceptors, such as PPBQ, and (c) a significantly higher YD content in the samples than the 25% that was assumed (up to 75% YD has been observed140,141). Furthermore, the pure S-state edge energies were determined by fitting the oscillation pattern of the half-height energies, not by deconvolution (or fitting) of the flash spectra. This is problematic, because the edge shapes are not the same for each S-state (see the lower portion of Figure 2A).
Roelofs et al. study49
Roelofs et al. observed IPE shifts between S-states similar to those reported here. As is the case in the present study, the S2-state multiline EPR signal oscillation pattern from Roelofs et al. showed a deep period four oscillation, which greatly reduced the error introduced by deconvolution. A possible concern about the data from Roelofs et al. is that the reported IPE values are consistently lower than those shown in Table 3 by approximately 0.5–0.7 eV for the S0, S2, and S3 states and by 1.2 eV for the S1 state. One hypothetical explanation of this discrepancy, as suggested by Iuzzolino et al.,53 is that the samples in the Roelofs et al. study had some free Mn(II) present. This possibility was tested by adding in fractional amounts of a Mn(II)(aq) XANES spectrum or a spectrum from a Mn(II)-containing model compound to the XANES spectra obtained in the present study. Neither of these scenarios reproduced the XANES spectra shown in Roelofs et al.; as expected, the 2nd derivatives of the simulated spectra showed an intense feature at 6545 eV which is absent in the Roelofs et al. data. Therefore, the lower XANES IPE values for the Roelofs et al. data cannot be attributed to the presence of Mn(II) in the samples. It is possible that either of two factors, differing cryoprotectant concentrations (50% glycerol in the Roelofs et al. data, 30% glycerol in the present study) or a small (<5% of the total signal) feature in the I0 spectrum of the Roelofs et al. data, contributed to the observed difference in the XANES IPE values. However, as shown in Figure 12, the XANES difference spectra from the work of Roelofs et al. are, aside from a lower signal-to-noise ratio, virtually identical to the difference spectra from the present study for each of the S-state transitions. Therefore, the study by Roelofs et al. provides strong support to the XANES spectra from the present study.
Figure 12.
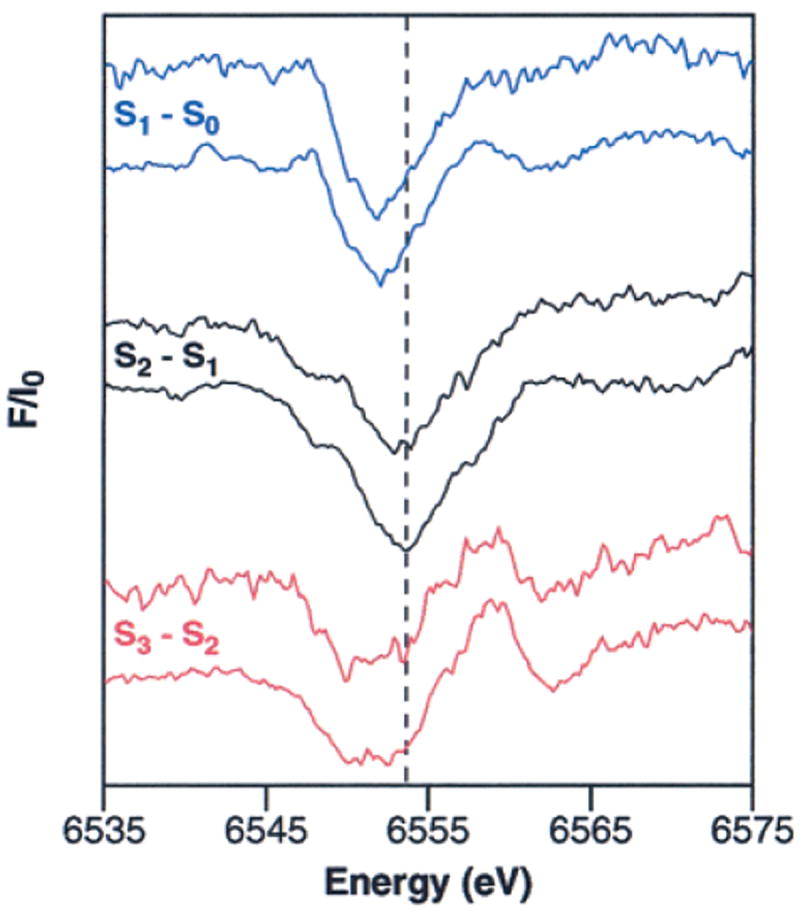
Comparison of Mn K-edge XANES difference spectra of PS II samples in the S0, S1, S2, and S3 states from the present study (also shown in Figure 2B) and from the work of Roelofs et al.49 In each set of XANES difference spectra, the difference spectrum from the work of Roelofs et al.49 is presented above the difference spectrum from the present study. The XANES difference spectra have been vertically offset for clarity.
Iuzzolino et al. study53
In contrast to the data from Ono et al.,52 the raw data from Iuzzolino et al. qualitatively agree well with the data from the present study and the data from Roelofs et al.49 In all three studies, a clear Mn K-edge shift is seen between the 0F and 1F spectra, while very little change in edge position is observed between the 1F and the 2F samples. In addition, the IPE of the 0F (S1) sample from Iuzzolino et al. is essentially identical to the IPE measured in the present study. However, after deconvolution, Iuzzolino et al. find that the shift between S2- and S3-state spectra is of the same size or even larger (depending on the analysis method) than the shift between the S1 and S2 states; the opposite is true in the current study. A reasonable explanation for this “after deconvolution” discrepancy is that Iuzzolino et al. have used a double-hit parameter, 11–15%, that is too large; typical values of 2–5% are found with similar Xe flash lamps.103,142 The edge position of the S3 state is especially sensitive to the double-hit parameter, because this factor determines what percentage of the S0 state is subtracted from the 2F spectrum. Because the S0 state has a far lower edge position than the S3 state, even a small error in the S0-state population of the 2F sample has a significant effect on the calculated S3-state edge position. This uncertainty does not exist when a Nd:YAG laser is used for flash illumination, because these laser pulses are too short (nanoseconds) to cause multiple turnovers. In addition, the S2-state multiline EPR signal oscillation patterns achieved by Iuzzolino et al. are quite damped; therefore, many different fits to the S2-state multiline EPR signal oscillation patterns can be invoked, which creates considerable uncertainty in the subsequently deconvoluted S-state spectra. As detailed in the Supporting Information, it can be shown that, if a different deconvolution is used, a significantly smaller edge shift for the S2 → S3 transition compared to the S1 → S2 transition is obtained for the Iuzzolino et al. data. Therefore, the differences between the conclusions from Iuzzolino et al. and those from the current study appear to be largely due to an incorrect deconvolution by Iuzzolino et al. of their fairly damped S2-state multiline EPR signal oscillation pattern and, to a smaller extent, the use of the integral method for edge energy determination (vide infra).
Comparison of Different Methods for XANES Edge Energy Determination
Previous studies have used three different methods to calculate XANES edge energy positions for each S-state of the OEC. Ono et al.52 used the energy at which the X-ray absorption is half its maximal value, known as the “half-height” method, in their study. To interpret changes in oxidation states with this method, the shape of the XANES spectrum should be unchanged during a comparison, which is not true for the S-state spectra (see Figure 2A). This method is also highly sensitive to noise in the data, because it is a measurement at a single point and is affected by uncertainty due to noise at the top of the edge. In addition, the spectral information present in the 2nd-derivative spectra is absent with the half-height method.
Roelofs et al.49 calculated the zero-crossing value of the 2nd derivative of the XANES spectrum (“2nd derivative” method) in their study. Although this method is sensitive to the width of the polynomial used for calculation of the 2nd derivative, several important advantages exist with this method: (a) it is insensitive to linear background subtraction and normalization, (b) it has been used successfully by several groups for 25 years to determine the oxidation state of metal ions in metalloproteins and model complexes (see Results), and (c) in addition to the edge position, detailed information on the edge shape is also provided. However, the width of the polynomial used for calculation of the 2nd derivative must be properly chosen to find an appropriate balance between the reduction of noise in the spectrum (at higher polynomial widths) and retention of spectral structure (at lower polynomial widths); the IPE value and shape of the spectrum are dependent on this choice, which is largely guided by analysis of model compound data. Roelofs et al. (and the current study) used a 6 eV width for the polynomial, which has successfully been used to analyze model compound data.17,73 Extensive model compound studies have shown that, without exception in our study of more than 13 sets of compounds, when Mn is oxidized by one electron in a set of Mn model compounds with similar ligands, the IPE shifts 1–2 eV to higher energy upon Mn oxidation, regardless of nuclearity. When the polynomial width is decreased to 3–4 eV, the noise envelope on the 2nd derivatives becomes significant, especially for the PS II data, making the IPE values unreliable.
Iuzzolino et al.53 used an “integral” method in which the 1st-moment is calculated on the absorption axis between a chosen set of limits, and the X-ray energy value corresponding to the calculated 1st-moment absorption value is reported. Although this method is superior to the half-height method in that the value reported attempts to take into account the shape of the edge, the calculated value is highly dependent on the arbitrary choice of limits, particularly if the shape of the XANES spectrum changes during the comparison (vide infra). In addition, errors in normalization and background removal affect the reported values, and the spectral information present in the 2nd-derivative spectra is absent with the integral method. In most cases, use of the integral method with homologous sets of Mn model compounds in different Mn oxidation states shows trends which are similar to those seen when the 2nd-derivative method is used (6 eV polynomial width). However, when Mn oxidation occurs in these complexes, the edge shape is essentially unchanged.
The 2nd-derivative method has been used in the current study and by Roelofs et al.,49 and the conclusions from the current study are unaffected if the polynomial width for the 2nd derivative is altered between 5 and 8 eV. In particular, the IPE shift for the S2 → S3 transition is always <40% of the IPE shift for the S1 → S2 transition. However, at lower polynomial widths, noise prevents a reliable determination of the edge energies, and at higher polynomial widths, too many 2nd-derivative features are lost. This relatively large insensitivity of the 2nd-derivative method toward the choice of the polynomial width lends support to the conclusions about the Mn oxidation states in PS II based on this procedure.
However, when the integral method is used, the changes in the shape of the XANES edge that occur during the S0 → S1 and S2 → S3 transitions are of concern. This is because the conclusions about oxidation-state changes, or lack thereof, are strongly dependent on a subjective choice of limits for the 1st-moment calculation for the XANES spectra of the OEC. Use of the same integration limits as Iuzzolino et al.,53 I = 0.15 to 1, gives the following results: S1 − S0, 0.4 eV; S2 − S1, 0.8 eV; and S3 − S2, 0.5 eV. However, integration limits of I = 0.15 to 0.7 give different results: S1 − S0, 0.5 eV; S2 − S1, 0.7 eV and S3 − S2, 0.7 eV; and continuing the integration to the top of the edge (I = 0.15 to T.O.E.) again produces different results: S1 − S0, 0.3 eV; S2 − S1, 0.9 eV; and S3 − S2, 0.3 eV.
A more intuitive understanding of why these trends change so dramatically is provided by the XANES difference spectra in Figure 2A. The choice of different integration limits selects for different regions of the spectra; this can leave out significant differences between S-states that are shown in the difference spectra. Furthermore, it is difficult to identify criteria to use that would recommend a particular choice of integration limits, because the use of any of the three integration limits above seems to show reasonable trends when applied to sets of Mn model complexes in which Mn is oxidized. Thus, because the conclusions from applying the integral method on XANES spectra in the current study are critically dependent on the choice of limits, this method cannot be used in this study to provide reliable conclusions about oxidation states of Mn in the OEC.
Footnotes
Supporting Information Available
Additional experimental details and alternative deconvolutions of the Iuzzolino et al. S2-state EPR multiline signal oscillation pattern (PDF). This material is available free of charge via the Internet at http://pubs.acs.org.
References
- 1.Debus RJ. Biochim Biophys Acta. 1992;1102:269–352. doi: 10.1016/0005-2728(92)90133-m. [DOI] [PubMed] [Google Scholar]
- 2.Britt RD. In: Oxygenic Photosynthesis: The Light Reactions. Ort DR, Yocum CF, editors. Vol. 4. Kluwer Academic Publishers; Dordrecht, The Netherlands: 1996. pp. 137–164. [Google Scholar]
- 3.Diner BA, Babcock GT. In: Oxygenic Photosynthesis: The Light Reactions. Ort DR, Yocum CF, editors. Vol. 4. Kluwer Academic Publishers; Dordrecht, The Netherlands: 1996. pp. 213–247. [Google Scholar]
- 4.Kok B, Forbush B, McGloin M. Photochem Photobiol. 1970;11:457–475. doi: 10.1111/j.1751-1097.1970.tb06017.x. [DOI] [PubMed] [Google Scholar]
- 5.Brudvig GW, Crabtree RH. Proc Natl Acad Sci U S A. 1986;83:4586–4588. doi: 10.1073/pnas.83.13.4586. [DOI] [PMC free article] [PubMed] [Google Scholar]
- 6.Christou G, Vincent JB. Biochim Biophys Acta. 1987;895:259–274. [PubMed] [Google Scholar]
- 7.Pecoraro VL. In: Manganese Redox Enzymes. Pecoraro VL, editor. VCH Publishers; New York: 1992. pp. 197–231. [Google Scholar]
- 8.Yachandra VK, Sauer K, Klein MP. Chem Rev. 1996;96:2927–2950. doi: 10.1021/cr950052k. [DOI] [PubMed] [Google Scholar]
- 9.Hoganson CW, Babcock GT. Science. 1997;277:1953–1956. doi: 10.1126/science.277.5334.1953. [DOI] [PubMed] [Google Scholar]
- 10.Renger G. Physiol Plant. 1997;100:828–841. [Google Scholar]
- 11.Siegbahn PEM, Crabtree RH. J Am Chem Soc. 1999;121:117–127. [Google Scholar]
- 12.Haumann M, Junge W. Biochim Biophys Acta. 1999;1411:86–91. doi: 10.1016/s0005-2728(99)00042-0. [DOI] [PubMed] [Google Scholar]
- 13.Schlodder E, Witt HT. J Biol Chem. 1999;274:30387–30392. doi: 10.1074/jbc.274.43.30387. [DOI] [PubMed] [Google Scholar]
- 14.Liang W, Roelofs TA, Cinco RM, Rompel A, Latimer MJ, Yu WO, Sauer K, Klein MP, Yachandra VK. J Am Chem Soc. 2000;122:3399–3412. doi: 10.1021/ja992501u. [DOI] [PMC free article] [PubMed] [Google Scholar]
- 15.Messinger J. Biochim Biophys Acta. 2000;1459:481–488. doi: 10.1016/s0005-2728(00)00187-0. [DOI] [PubMed] [Google Scholar]
- 16.Robblee JH, Cinco RM, Yachandra VK. Biochim Biophys Acta. 2001;1503:7–23. doi: 10.1016/s0005-2728(00)00217-6. [DOI] [PMC free article] [PubMed] [Google Scholar]
- 17.Sauer K, Yachandra VK, Britt RD, Klein MP. In: Manganese Redox Enzymes. Pecoraro VL, editor. VCH Publishers; New York: 1992. pp. 141–175. [Google Scholar]
- 18.Yachandra VK, DeRose VJ, Latimer MJ, Mukerji I, Sauer K, Klein MP. Science. 1993;260:675–679. doi: 10.1126/science.8480177. [DOI] [PubMed] [Google Scholar]
- 19.DeRose VJ, Mukerji I, Latimer MJ, Yachandra VK, Sauer K, Klein MP. J Am Chem Soc. 1994;116:5239–5249. [Google Scholar]
- 20.Cinco RM, Rompel A, Visser H, Aromí G, Christou G, Sauer K, Klein MP, Yachandra VK. Inorg Chem. 1999;38:5988–5998. doi: 10.1021/ic991003j. [DOI] [PMC free article] [PubMed] [Google Scholar]
- 21.Penner-Hahn JE, Fronko RM, Pecoraro VL, Yocum CF, Betts SD, Bowlby NR. J Am Chem Soc. 1990;112:2549–2557. [Google Scholar]
- 22.Guiles RD, Yachandra VK, McDermott AE, Cole JL, Dexheimer SL, Britt RD, Sauer K, Klein MP. Biochemistry. 1990;29:486–496. doi: 10.1021/bi00454a024. [DOI] [PubMed] [Google Scholar]
- 23.Messinger J, Robblee JH, Fernandez C, Cinco RM, Visser H, Bergmann U, Glatzel P, Cramer SP, Campbell KA, Peloquin JM, Britt RD, Sauer K, Yachandra VK, Klein MP. In: Photosynthesis: Mechanisms and Effects. Garab G, editor. Vol. 2. Kluwer Academic Publishers; Dordrecht, The Netherlands: 1998. pp. 1279–1282. [Google Scholar]
- 24.Liang W, Roelofs TA, Olsen GT, Latimer MJ, Cinco RM, Rompel A, Sauer K, Yachandra VK, Klein MP. In: Photosynthesis: from Light to Biosphere. Mathis P, editor. Vol. 2. Kluwer Academic Publishers; Dordrecht, The Netherlands: 1995. pp. 413–416. [Google Scholar]
- 25.Messinger J, Nugent JHA, Evans MCW. Biochemistry. 1997;36:11055–11060. doi: 10.1021/bi9711285. [DOI] [PubMed] [Google Scholar]
- 26.Messinger J, Robblee J, Yu WO, Sauer K, Yachandra VK, Klein MP. J Am Chem Soc. 1997;119:11349–11350. doi: 10.1021/ja972696a. [DOI] [PMC free article] [PubMed] [Google Scholar]
- 27.Åhrling KA, Peterson S, Styring S. Biochemistry. 1997;36:13148–13152. doi: 10.1021/bi971815w. [DOI] [PubMed] [Google Scholar]
- 28.Dismukes GC, Siderer Y. Proc Natl Acad Sci U S A. 1981;78:274–278. doi: 10.1073/pnas.78.1.274. [DOI] [PMC free article] [PubMed] [Google Scholar]
- 29.Hansson Ö, Andréasson L-E. Biochim Biophys Acta. 1982;679:261–268. [Google Scholar]
- 30.Dexheimer SL, Klein MP. J Am Chem Soc. 1992;114:2821–2826. [Google Scholar]
- 31.Yamauchi T, Mino H, Matsukawa T, Kawamori A, Ono T-a. Biochemistry. 1997;36:7520–7526. doi: 10.1021/bi962791g. [DOI] [PubMed] [Google Scholar]
- 32.Campbell KA, Peloquin JM, Pham DP, Debus RJ, Britt RD. J Am Chem Soc. 1998;120:447–448. [Google Scholar]
- 33.Campbell KA, Gregor W, Pham DP, Peloquin JM, Debus RJ, Britt RD. Biochemistry. 1998;37:5039–5045. doi: 10.1021/bi9800552. [DOI] [PubMed] [Google Scholar]
- 34.Styring SA, Rutherford AW. Biochemistry. 1988;27:4915–4923. [Google Scholar]
- 35.Evelo RG, Styring S, Rutherford AW, Hoff AJ. Biochim Biophys Acta. 1989;973:428–442. [Google Scholar]
- 36.Sharp RR. In: Manganese Redox Enzymes. Pecoraro VL, editor. VCH Publishers; New York: 1992. pp. 177–196. [Google Scholar]
- 37.Saygin Ö, Witt HT. Biochim Biophys Acta. 1987;893:452–469. [Google Scholar]
- 38.Kretschmann H, Dekker JP, Saygin Ö, Witt HT. Biochim Biophys Acta. 1988;932:358–361. [Google Scholar]
- 39.Dekker JP. In: Manganese Redox Enzymes. Pecoraro VL, editor. VCH Publishers; New York: 1992. pp. 85–103. [Google Scholar]
- 40.Lavergne J. Biochim Biophys Acta. 1987;894:91–107. [Google Scholar]
- 41.Renger G. Photosynthetica. 1987;21:203–224. [Google Scholar]
- 42.Shulman RG, Yafet Y, Eisenberger P, Blumberg WE. Proc Natl Acad Sci U S A. 1976;73:1384–1388. doi: 10.1073/pnas.73.5.1384. [DOI] [PMC free article] [PubMed] [Google Scholar]
- 43.Cramer SP, Eccles TK, Kutzler FW, Hodgson KO, Mortenson LE. J Am Chem Soc. 1976;98:1287–1288. doi: 10.1021/ja00421a053. [DOI] [PubMed] [Google Scholar]
- 44.Powers L, Blumberg WE, Chance B, Barlow CH, Leigh JS, Jr, Smith J, Yonetani T, Vik S, Peisach J. Biochim Biophys Acta. 1979;546:520–538. doi: 10.1016/0005-2728(79)90085-9. [DOI] [PubMed] [Google Scholar]
- 45.Kirby JA, Goodin DB, Wydrzynski T, Robertson AS, Klein MP. J Am Chem Soc. 1981;103:5537–5542. [Google Scholar]
- 46.Goodin DB, Yachandra VK, Britt RD, Sauer K, Klein MP. Biochim Biophys Acta. 1984;767:209–216. [Google Scholar]
- 47.Roe AL, Schneider DJ, Mayer RJ, Pyrz JW, Widom J, Que L., Jr J Am Chem Soc. 1984;106:1676–1681. [Google Scholar]
- 48.Kau LS, Spira-Solomon DJ, Penner-Hahn JE, Hodgson KO, Solomon EI. J Am Chem Soc. 1987;109:6433–6442. [Google Scholar]
- 49.Roelofs TA, Liang W, Latimer MJ, Cinco RM, Rompel A, Andrews JC, Sauer K, Yachandra VK, Klein M. Proc Natl Acad Sci U S A. 1996;93:3335–3340. doi: 10.1073/pnas.93.8.3335. [DOI] [PMC free article] [PubMed] [Google Scholar]
- 50.Stemmler TL, Sossong TM, Jr, Goldstein JI, Ash DE, Elgren TE, Kurtz DM, Penner-Hahn JE. Biochemistry. 1997;36:9847–9858. doi: 10.1021/bi9702795. [DOI] [PubMed] [Google Scholar]
- 51.Blackburn NJ, Rhames FC, Ralle M, Jaron S. JBIC, J Biol Inorg Chem. 2000;5:341–353. doi: 10.1007/pl00010663. [DOI] [PubMed] [Google Scholar]
- 52.Ono T-a, Noguchi T, Inoue Y, Kusunoki M, Matsushita T, Oyanagi H. Science. 1992;258:1335–1337. doi: 10.1126/science.258.5086.1335. [DOI] [PubMed] [Google Scholar]
- 53.Iuzzolino L, Dittmer J, Dörner W, Meyer-Klaucke W, Dau H. Biochemistry. 1998;37:17112–17119. doi: 10.1021/bi9817360. [DOI] [PubMed] [Google Scholar]
- 54.Limburg J, Szalai VA, Brudvig GW. J Chem Soc Dalton Trans. 1999:1353–1362. [Google Scholar]
- 55.Sanner VH. Ph D Thesis. Uppsala University; 1941. [Google Scholar]
- 56.Tsutsumi K. J Phys Soc Jpn. 1959;14:1696–1706. [Google Scholar]
- 57.Urch DS, Wood PR. X-ray Spectrom. 1978;7:9–11. [Google Scholar]
- 58.Peng G, de Groot FMF, Hämäläinen K, Moore JA, Wang X, Grush MM, Hastings JB, Siddons DP, Armstrong WH, Mullins OC, Cramer SP. J Am Chem Soc. 1994;116:2914–2920. [Google Scholar]
- 59.Bergmann U, Grush MM, Horne CR, DeMarois P, Penner-Hahn JE, Yocum CF, Wright DW, Dubé CE, Armstrong WH, Christou G, Eppley HJ, Cramer SP. J Phys Chem B. 1998;102:8350–8352. [Google Scholar]
- 60.Bergmann U, Cramer SP. SPIE Conference on Crystal and Multilayer Optics; San Diego, CA: SPIE; 1998. pp. 198–209. [Google Scholar]
- 61.Berthold DA, Babcock GT, Yocum CF. FEBS Lett. 1981;134:231–234. [Google Scholar]
- 62.Kuwabara T, Murata N. Plant Cell Physiol. 1982;23:533–539. [Google Scholar]
- 63.This procedure had essentially no effect (≤0.0007 eV) on the reported 〈E〉 shifts.
- 64.Shinkarev VP, Wraight CA. Proc Natl Acad Sci U S A. 1993;90:1834–1838. doi: 10.1073/pnas.90.5.1834. [DOI] [PMC free article] [PubMed] [Google Scholar]
- 65.Forbush B, Kok B, McGloin MP. Photochem Photobiol. 1971;14:307–321. doi: 10.1111/j.1751-1097.1970.tb06017.x. [DOI] [PubMed] [Google Scholar]
- 66.Jursinic P. Biochim Biophys Acta. 1981;635:38–52. doi: 10.1016/0005-2728(81)90005-0. [DOI] [PubMed] [Google Scholar]
- 67.Styring S, Rutherford AW. Biochemistry. 1987;26:2401–2405. [Google Scholar]
- 68.Styring S, Rutherford AW. Biochim Biophys Acta. 1988;933:378–387. [Google Scholar]
- 69.Vermaas WFJ, Renger G, Dohnt G. Biochim Biophys Acta. 1984;764:194–202. [Google Scholar]
- 70.Chylla RA, Garab G, Whitmarsh J. Biochim Biophys Acta. 1987;894:562–571. [Google Scholar]
- 71.Chylla RA, Whitmarsh J. Plant Physiol. 1989;90:765–772. doi: 10.1104/pp.90.2.765. [DOI] [PMC free article] [PubMed] [Google Scholar]
- 72.More complex fits taking reoxidation kinetics or miss factors smaller than 100% for the impaired centers into account were considered. However, these yielded almost identical fits with essentially the same S-state distributions for the various flash numbers (data not shown). Therefore, the increased number of parameters was not justified.
- 73.Visser H, Anxolabèhére-Mallart E, Bergmann U, Glatzel P, Robblee JH, Cramer SP, Girerd J-J, Sauer K, Klein MP, Yachandra VK. J Am Chem Soc. 2001 doi: 10.1021/ja004306h. in press. [DOI] [PMC free article] [PubMed] [Google Scholar]
- 74.Conradson SD, Burgess BK, Newton WE, McDonald JW, Rubinson JF, Gheller SF, Mortenson LE, Adams MWW, Mascharak PK, Armstrong WA, Holm RH. J Am Chem Soc. 1985;107:7935–7940. [Google Scholar]
- 75.McDermott AE, Yachandra VK, Guiles RD, Sauer K, Klein MP, Parrett KG, Golbeck JH. Biochemistry. 1989;28:8056–8059. doi: 10.1021/bi00446a013. [DOI] [PubMed] [Google Scholar]
- 76.Ryan DE, Grant KB, Nakanishi K, Frank P, Hodgson KO. Biochemistry. 1996;35:8651–8661. doi: 10.1021/bi952151y. [DOI] [PubMed] [Google Scholar]
- 77.Musgrave KB, Donahue JP, Lorber C, Holm RH, Hedman B, Hodgson KO. J Am Chem Soc. 1999;121:10297–10307. [Google Scholar]
- 78.Nivorozhkin AL, Segal BM, Musgrave KB, Kates SA, Hedman B, Hodgson KO, Holm RH. Inorg Chem. 2000;39:2306–2313. doi: 10.1021/ic990421l. [DOI] [PubMed] [Google Scholar]
- 79.DuBois JL, Mukherjee P, Stack TDP, Hedman B, Solomon EI, Hodgson KO. J Am Chem Soc. 2000;122:5775–5787. [Google Scholar]
- 80.DeBeer S, Randall DW, Nersissian AM, Valentine JS, Hedman B, Hodgson KO, Solomon EI. J Phys Chem B. 2000;104:10814–10819. [Google Scholar]
- 81.The numbers in parentheses show the uncertainties in the shifts of the IPE values which are due to deconvolution. They were calculated from the “most-damped” and “least-damped” oscillation patterns as described in Table 3.
- 82.True AE, Orville AM, Pearce LL, Lipscomb JD, Que L., Jr Biochemistry. 1990;29:10847–10854. doi: 10.1021/bi00500a019. [DOI] [PubMed] [Google Scholar]
- 83.True AE, Scarrow RC, Randall CR, Holz RC, Que L., Jr J Am Chem Soc. 1993;115:4246–4255. [Google Scholar]
- 84.Scarrow RC, Trimitsis MG, Buck CP, Grove GN, Cowling RA, Nelson MJ. Biochemistry. 1994;33:15023–15035. doi: 10.1021/bi00254a011. [DOI] [PubMed] [Google Scholar]
- 85.Pavlosky MA, Zhang Y, Westre TE, Gan Q-F, Pavel EG, Campochiaro C, Hedman B, Hodgson KO, Solomon EI. J Am Chem Soc. 1995;117:4316–4327. [Google Scholar]
- 86.Loeb KE, Zaleski JM, Westre TE, Guajardo RJ, Mascharak PK, Hedman B, Hodgson KO, Solomon EI. J Am Chem Soc. 1995;117:4545–4561. [Google Scholar]
- 87.Westre TE, Loeb KE, Zaleski JM, Hedman B, Hodgson KO, Solomon EI. J Am Chem Soc. 1995;117:1309–1313. [Google Scholar]
- 88.Randall CR, Shu L, Chiou Y-M, Hagen KS, Ito M, Kitajima N, Lachicotte RJ, Zang Y, Que L., Jr Inorg Chem. 1995;34:1036–1039. [Google Scholar]
- 89.Westre TE, Kennepohl P, DeWitt JG, Hedman B, Hodgson KO, Solomon EI. J Am Chem Soc. 1997;119:6297–6314. [Google Scholar]
- 90.Tsutsumi K, Nakamori H. J Phys Soc Jpn. 1968;25:1419–1424. [Google Scholar]
- 91.Tsutsumi K, Nakamori H, Ichikawa K. Phys Rev B: Condens Matter. 1976;13:929–933. [Google Scholar]
- 92.Taguchi M, Uozumi T, Kotani A. J Phys Soc Jpn. 1997;66:247–256. [Google Scholar]
- 93.In general, Kβ XES is sensitive to the spin state of the fluorescing atom, and not its oxidation state, because the magnitude of the 3p–3d exchange interaction is governed by the number of unpaired 3d electrons. However, for the situations relevant for PS II, i.e., Mn(II), Mn(III), and Mn(IV) ions in a high-spin configuration, the oxidation state is directly correlated to the spin state.
- 94.Whereas the Kβ emission spectrum is sensitive to oxidation state through a 3p–3d exchange interaction, the independent technique of XANES spectroscopy is sensitive to oxidation state through a different mechanism: core-hole shielding effects. This is why, upon Mn oxidation, Kβ1,3 emission spectra shift to lower energy, while XANES spectra shift to higher energy.
- 95.A maximum possible deconvolution error of ±0.0025 eV was calculated for the 〈E〉 values using the “most-damped” and “least-damped” oscillation patterns described in Table 2.
- 96.Hasegawa K, Kusunoki M, Inoue Y, Ono T-a. Biochemistry. 1998;37:9457–9465. doi: 10.1021/bi973057f. [DOI] [PubMed] [Google Scholar]
- 97.Hasegawa K, Ono T-a, Inoue Y, Kusunoki M. Chem Phys Lett. 1999;300:9–19. [Google Scholar]
- 98.Peloquin JM, Campbell KA, Randall DW, Evanchik MA, Pecoraro VL, Armstrong WH, Britt RD. J Am Chem Soc. 2000;122:10926–10942. [Google Scholar]
- 99.Britt RD, Peloquin JM, Campbell KA. Annu Rev Biophys Biomol Struct. 2000;29:463–495. doi: 10.1146/annurev.biophys.29.1.463. [DOI] [PubMed] [Google Scholar]
- 100.Zheng M, Dismukes GC. Inorg Chem. 1996;35:3307–3319. doi: 10.1021/ic9512340. [DOI] [PubMed] [Google Scholar]
- 101.Kuzek D, Pace RJ. Biochim Biophys Acta. 2001;1503:123–137. doi: 10.1016/s0005-2728(00)00218-8. [DOI] [PubMed] [Google Scholar]
- 102.Riggs PJ, Yocum CF, Penner-Hahn JE, Mei R. J Am Chem Soc. 1992;114:10650–10651. [Google Scholar]
- 103.Messinger J, Seaton G, Wydrzynski T, Wacker U, Renger G. Biochemistry. 1997;36:6862–6873. doi: 10.1021/bi962653r. [DOI] [PubMed] [Google Scholar]
- 104.Whittaker JW. In: Metalloenzymes Involving Amino acid Residue and Related Radicals. Sigel A, Sigel H, editors. Vol. 30. Marcel Dekker; New York: 1994. pp. 315–360. [Google Scholar]
- 105.Clark K, Penner-Hahn JE, Whittaker MM, Whittaker JW. J Am Chem Soc. 1990;112:6433–6434. [Google Scholar]
- 106.Wang Y, DuBois JL, Hedman B, Hodgson KO, Stack TDP. Science. 1998;279:537–540. doi: 10.1126/science.279.5350.537. [DOI] [PubMed] [Google Scholar]
- 107.Rothlisberger U, Carloni P, Doclo K, Parrinello M. JBIC, J Biol Inorg Chem. 2000;5:236–250. doi: 10.1007/s007750050368. [DOI] [PubMed] [Google Scholar]
- 108.Bergmann U. Personal communication [Google Scholar]
- 109.Boussac A, Rutherford AW, Styring S. Biochemistry. 1990;29:24–32. doi: 10.1021/bi00453a003. [DOI] [PubMed] [Google Scholar]
- 110.Messinger J, Wacker U, Renger G. Biochemistry. 1991;30:7852–7862. doi: 10.1021/bi00245a027. [DOI] [PubMed] [Google Scholar]
- 111.Sauer K, Guiles RD, McDermott AE, Cole JL, Yachandra VK, Zimmermann J-L, Klein MP, Dexheimer SL, Britt RD. Chem Scr. 1988;28A:87–91. [Google Scholar]
- 112.Huheey JE, Keiter EA, Keiter RL. Inorganic Chemistry: Principles of Structure and Reactivity. 4. HarperCollins Publishers; New York: 1993. [Google Scholar]
- 113.Chu H-A, Nguyen AP, Debus RJ. Biochemistry. 1995;34:5839–5858. doi: 10.1021/bi00017a016. [DOI] [PubMed] [Google Scholar]
- 114.DeRose VJ, Yachandra VK, McDermott AE, Britt RD, Sauer K, Klein MP. Biochemistry. 1991;30:1335–1341. doi: 10.1021/bi00219a025. [DOI] [PubMed] [Google Scholar]
- 115.Tang X-S, Diner BA, Larsen BS, Gilchrist ML, Jr, Lorigan GA, Britt RD. Proc Natl Acad Sci U S A. 1994;91:704–708. doi: 10.1073/pnas.91.2.704. [DOI] [PMC free article] [PubMed] [Google Scholar]
- 116.Debus RJ, Campbell KA, Peloquin JM, Pham DP, Britt RD. Biochemistry. 2000;39:470–478. doi: 10.1021/bi9917737. [DOI] [PubMed] [Google Scholar]
- 117.Cinco RM, Fernandez C, Messinger J, Robblee JH, Visser H, McFarlane KL, Bergmann U, Glatzel P, Cramer SP, Sauer K, Klein MP, Yachandra VK. In: Photosynthesis: Mechanisms and Effects. Garab G, editor. Vol. 2. Kluwer Academic Publishers; Dordrecht, The Netherlands: 1998. pp. 1273–1278. [Google Scholar]
- 118.Heath RL, Hind G. Biochim Biophys Acta. 1969;172:290–299. doi: 10.1016/0005-2728(69)90071-1. [DOI] [PubMed] [Google Scholar]
- 119.Izawa S, Heath RL, Hind G. Biochim Biophys Acta. 1969;180:388–398. doi: 10.1016/0005-2728(69)90123-6. [DOI] [PubMed] [Google Scholar]
- 120.Preston C, Pace RJ. Biochim Biophys Acta. 1985;810:388–391. [Google Scholar]
- 121.Wincencjusz H, van Gorkom HJ, Yocum CF. Biochemistry. 1997;36:3663–3670. doi: 10.1021/bi9626719. [DOI] [PubMed] [Google Scholar]
- 122.Fernandez C, Cinco RM, Robblee JH, Messinger J, Pizarro SA, Sauer K, Klein MP, Yachandra VK. In: Photosynthesis: Mechanisms and Effects. Garab G, editor. Vol. 2. Kluwer Academic Publishers; Dordrecht, The Netherlands: 1998. pp. 1399–1402. [Google Scholar]
- 123.Pizarro SA, Visser H, Pal S, Mukhopadhyay S, Mok HJ, Sauer K, Wieghardt K, Armstrong WH, Yachandra VK. doi: 10.1007/s00775-003-0520-1. Submitted for publication. [DOI] [PMC free article] [PubMed] [Google Scholar]
- 124.Casey JL, Sauer K. Biochim Biophys Acta. 1984;767:21–28. doi: 10.1016/0005-2728(84)90208-1. [DOI] [PubMed] [Google Scholar]
- 125.Yachandra VK, Guiles RD, Sauer K, Klein MP. Biochim Biophys Acta. 1986;850:333–342. [Google Scholar]
- 126.Ono T-a, Zimmermann J-L, Inoue Y, Rutherford AW. Biochim Biophys Acta. 1986;851:193–201. [Google Scholar]
- 127.Beck WF, Brudvig GW. Chem Scr. 1988;28A:93–98. [Google Scholar]
- 128.Lindberg K, Vänngård T, Andréasson L-E. Photosynth Res. 1993;38:401–408. doi: 10.1007/BF00046767. [DOI] [PubMed] [Google Scholar]
- 129.Lindberg K, Andréasson L-E. Biochemistry. 1996;35:14259–14267. doi: 10.1021/bi961244s. [DOI] [PubMed] [Google Scholar]
- 130.Larson EJ, Pecoraro VL. In: Manganese Redox Enzymes. Pecoraro VL, editor. VCH Publishers; New York: 1992. pp. 1–28. [Google Scholar]
- 131.Baldwin MJ, Stemmler TL, Riggs-Gelasco PJ, Kirk ML, Penner-Hahn JE, Pecoraro VL. J Am Chem Soc. 1994;116:11349–11356. [Google Scholar]
- 132.Klein MP, Sauer K, Yachandra VK. Photosynth Res. 1993;38:265–277. doi: 10.1007/BF00046751. [DOI] [PubMed] [Google Scholar]
- 133.Lavergne J, Junge W. Photosynth Res. 1993;38:279–296. doi: 10.1007/BF00046752. [DOI] [PubMed] [Google Scholar]
- 134.Ioannidis N, Schansker G, Barynin VV, Petrouleas V. JBIC, J Biol Inorg Chem. 2000;5:354–363. doi: 10.1007/pl00010664. [DOI] [PubMed] [Google Scholar]
- 135.Siegbahn PEM. Inorg Chem. 2000;39:2923–2935. doi: 10.1021/ic9911872. [DOI] [PubMed] [Google Scholar]
- 136.Messinger J, Badger M, Wydrzynski T. Proc Natl Acad Sci U S A. 1995;92:3209–3213. doi: 10.1073/pnas.92.8.3209. [DOI] [PMC free article] [PubMed] [Google Scholar]
- 137.Hillier W, Messinger J, Wydrzynski T. Biochemistry. 1998;37:16908–16914. doi: 10.1021/bi980756z. [DOI] [PubMed] [Google Scholar]
- 138.Chu H-A, Sackett H, Babcock GT. Biochemistry. 2000;39:14371–14376. doi: 10.1021/bi001751g. [DOI] [PubMed] [Google Scholar]
- 139.Noguchi T, Sugiura M. Biochemistry. 2000;39:10943–10949. doi: 10.1021/bi001040i. [DOI] [PubMed] [Google Scholar]
- 140.Messinger J, Renger G. FEBS Lett. 1990;277:141–146. doi: 10.1016/0014-5793(90)80829-8. [DOI] [PubMed] [Google Scholar]
- 141.Vass I, Deák Z, Jegerschöld C, Styring S. Biochim Biophys Acta. 1990;1018:41–46. [Google Scholar]
- 142.Messinger J, Schröder WP, Renger G. Biochemistry. 1993;32:7658–7668. doi: 10.1021/bi00081a009. [DOI] [PubMed] [Google Scholar]
Associated Data
This section collects any data citations, data availability statements, or supplementary materials included in this article.