

Abstract
During CNS development, oligodendrocytes, the myelinating glia of the CNS, progress through multiple transitory stages before terminating into fully mature cells. Oligodendrocyte differentiation and myelination is a tightly regulated process requiring extracellular signals to converge to elicit specific translational and transcriptional changes. Our lab has previously shown that the protein kinases, Akt and mammalian Target of Rapamycin (mTOR), are important regulators of CNS myelination in vivo. mTOR functions through two distinct complexes, mTOR complex 1 (mTORC1) and mTORC2, by binding to either Raptor or Rictor, respectively. To establish whether the impact of mTOR on CNS myelination results from unique functions of mTORC1 or mTORC2 during CNS myelination, we conditionally ablated either Raptor or Rictor in the oligodendrocyte lineage, in vivo. We show that Raptor (mTORC1) is a positive regulator of developmental CNS mouse myelination when mTORC2 is functional, whereas Rictor (mTORC2) ablation has a modest positive effect on oligodendrocyte differentiation, and very little effect on myelination, when mTORC1 is functional. Also, we show that loss of Raptor in oligodendrocytes results in differential dysmyelination in specific areas of the CNS, with the greatest impact on spinal cord myelination.
Keywords: mTOR, oligodendrocyte, Raptor, Rictor
Introduction
Oligodendrocytes are the myelinating glial cells that ensheath and provide trophic and metabolic support to axons in the CNS. During development, these glial cells transition through multiple developmental stages before maturing to fully differentiated, myelinating cells. Many different factors have been established as critical regulators of the differentiation program, but the specific mechanisms linking extracellular factors to changes in gene expression remain elusive.
Previously, we and others have identified specific protein kinases that bridge communication between the extracellular and intracellular environments, as active participants in regulating the oligodendrocyte program (Flores et al., 2008; Narayanan et al., 2009; Tyler et al., 2009; Fyffe-Maricich et al., 2011; Guardiola-Diaz et al., 2012; Ishii et al., 2012). The phosphatidylinositol 3′ kinase (PI3K) pathway is downstream of several growth factors that regulate oligodendrocyte and Schwann cell development (Sherman et al., 2012). Our laboratory established that Akt and mTOR, downstream of PI3K, are critical mediators of oligodendrocyte myelination in vivo (Flores et al., 2008; Narayanan et al., 2009), while the Wood laboratory demonstrated that mTOR regulates oligodendrocyte differentiation in vitro (Tyler et al., 2009). That study also highlighted unique roles for the different mTOR complexes in vitro. mTOR, a serine threonine protein kinase, exists in two functionally distinct complexes defined by free mTOR binding to rapamycin-activating protein to TOR (Raptor) or the rapamycin-insensitive companion to TOR (Rictor) to generate mTOR complex 1 (mTORC1) or mTORC2, respectively. Our earlier studies used an mTOR inhibitor, rapamycin, to block myelination, suggesting a significant role of mTORC1, since rapamycin was initially proposed as an mTORC1-specific inhibitor (Brown et al., 1994). However, rapamycin has now been shown to affect both complexes upon chronic exposure or at high doses (Sarbassov et al., 2006; Thoreen and Sabatini, 2009). Therefore, to understand more specifically the role of the individual complexes in vivo, we generated mice in which we conditionally ablated Raptor (mTORC1) or Rictor (mTORC2) in developing oligodendrocytes to study their independent effects on differentiation and myelination throughout CNS development.
In these studies, we have established that mTORC1 has a major role regulating oligodendrocyte differentiation, active myelination, and proper myelin compaction on large caliber axons in the CNS. We show that deletion of mTORC1 in oligodendrocytes in Raptor conditional knock-out mice resulted in developmental delay and dysmyelination that varies in severity between different regions of the CNS. In particular, while oligodendrocyte development is delayed in both spinal cord and corpus callosum, the delay recovers in the corpus callosum, while there is a continued loss of oligodendrocytes in the spinal cord as the animal ages. Less is known about mTORC2 function compared with mTORC1, and in our animal model of Rictor ablation in oligodendrocytes, we observed selective changes in myelin proteins and RNA expression in different regions of the CNS. However, this did not result in a dysmyelinating phenotype at the ultrastructural level. In the CNS, our data on the loss of either Raptor or Rictor indicated that mTORC1 is a positive regulator of spinal cord oligodendrocyte differentiation and myelin sheath thickness, whereas mTORC2 has a less clear role in these processes, but it may have a negative impact on initial oligodendrocyte differentiation.
Materials and Methods
Animals.
Mice of either sex that coexpressed Cre recombinase as a knock-in gene into the Cnp locus (CNPcre+/+; Lappe-Siefke et al., 2003) were crossed to mice carrying the floxed allele of Raptor (Raptorfl/fl; The Jackson Laboratory) (Sengupta et al., 2010). These crosses generated CNP-cre+/−; Raptorfl/fl animals, referred to as Raptor cKO animals. Mice expressing floxed Rictor alleles (Rictorfl/fl) (Shiota et al., 2006; Mutant Mouse Regional Resource Center, University of California, Davis, CA) were crossed with CNP-cre mice to create CNP-cre+/−; Rictorfl/fl mice, referred to as Rictor cKO animals. Littermate animals were used as controls, either Raptorfl/fl or Rictorfl/fl animals, respectively. Genotypes of all mice were determined by PCR analysis of tail genomic DNA using appropriate primers to detect the CNP-cre allele 5′ (GATGGGGCTTACTCTTGC; CATAGCCTGAAGAACGAGA). Recombination efficiency in oligodendrocytes in the CNP-cre mouse was determined by transgenic crosses to the ROSA reporter mouse (The Jackson Laboratory). Recombination was quantified by immunolabeling with antibodies against β-galactosidase (a gift from Dr. Tom Finger, University of Colorado, Aurora, CO) and Olig2, and counting oligodendrocytes that coexpressed both proteins (data not shown). All animal procedures were performed with the approval of the University of Colorado Institutional Animal Care and Use Committee.
Immunohistochemistry.
The following primary antibodies were used: mouse anti-MBP (Covance), rat anti-PLP/DM20 (clone AA3; Yamamura et al., 1991), mouse anti-MAG (Abcam), rabbit anti-MOG (Abcam), mouse anti-CNP (Sigma-Aldrich), mouse anti-CC1 (EMD Millipore), rabbit anti-Olig2 (a gift from Dr. Charles Stiles, Harvard University), mouse anti-Olig2 (Millipore), goat anti-Sox10 (Santa Cruz Biotechnology), rabbit anti-platelet-derived growth factor receptor α (PDGFRα; Santa Cruz Biotechnology), and guinea pig anti-NG2 (a gift from Dr. William Stallcup, Sanford-Burnham Medical Research Institute, La Jolla, CA). Tissue was fixed by intracardial perfusion with PBS followed by 4% paraformaldehyde. Tissues were dissected, postfixed overnight, and transferred to a cryoprotection solution (20% glycerol in 0.1 m Sorensen's buffer, pH 7.6). The immunohistochemistry protocol was adapted from Trapp et al. (1997). Cortex and cervical spinal cord were sectioned (30 μm) and stored at 4°C in cryostorage solution (30% ethylene glycol, 30% sucrose, and 1% PVP-40 in 0.1 m Sorenson's buffer). Sections were permeabilized with 0.3–10% Triton X-100 (depending on primary antibody combinations), blocked with 5% normal donkey serum (Jackson ImmunoResearch) and incubated with primary antibody for 1–3 d at 4°C. Tissue was washed in PBS and then incubated with the appropriate secondary antibody. For immunofluorescent detection, fluorescent-labeled secondary antibodies (Jackson ImmunoResearch) were used, incubated with tissue for 1 h at room temperature, washed with PBS, and coverslipped with Vectashield (Vector Laboratories).
Cell counts.
For oligodendrocyte lineage cell number in the corpus callosum, images were acquired to include only the corpus callosum at the midline. In the spinal cord, images were acquired to include only the dorsal columns from serial sections of cervical spinal cord. All oligodendrocyte lineage cells were counted in an entire section for the corpus callosum or area of interest for the spinal cord. Cells were counted blindly in the corpus callosum and spinal cord from three sections per animal and at least three animals per group, using ImageJ cell counting software. MATLAB software was used to count cells in some studies.
Statistical analysis.
For cell counts, the mean number of immunoreactive cells per animal was determined. Cells counted included total numbers of PDGFRα-positive, NG2-positive, CC1-positive, or Olig2-positive cells. Student's t test, unpaired, was used to calculate statistical significance and graphed using GraphPad (GraphPad Software). All t tests underwent false discovery rate (FDR) analysis; FDR is 0.05. Values given represent the means ± SEM.
Western blot.
Tissue isolated from the oligodendrocyte-enriched corpus callosum or from the entire spinal cord was dissected, snap frozen in liquid nitrogen, and stored at −80°C until lysis. Tissue was lysed with glass homogenizers in radioimmunoprecipitation assay buffer (Sigma-Aldrich) plus a phosphatase inhibitor cocktail (Calbiochem; Millipore) and protease inhibitor tablet (complete-mini; Roche), and centrifuged at 10,000 × g for 10 min at 4°C. The supernatant was collected and protein concentration was determined using the BCA protein Assay Kit (Thermo Fisher). The lysates were subjected to SDS-PAGE (4–20% gradient gel) and the proteins transferred to PVDF membranes. The membranes were blocked with 5% bovine serum albumin in TBS and then incubated with myelin (see above, Immunohistochemistry) or protein kinase (see Table 1) primary antibodies, and immunodetection was performed with the appropriate IRDye infrared secondary antibodies (LI-COR). Blots were scanned and quantified using an Odyssey Infrared imager (LI-COR). All signaling antibodies were purchased from Cell Signaling Technologies.
Table 1.
Cell Signaling antibody numbers
| Antibody | Catalog number |
|---|---|
| Phospho-Akt (Ser473) | 4060 |
| Phospho-Akt (Thr308) | 2965 |
| Akt (pan) | 4691 |
| Phospho-ERK 1/2 | 4370 |
| Pan ERK 1/2 | 4696 |
| Phospho-S6 Ribosomal Protein (Ser 235/236) | 4858 |
| Phospho-mTOR (Ser 2448) | 5536 |
| Phospho-mTOR (Ser 2448) Immunohistochemistry | 2976 |
| Phospho-mTOR (Ser 2481) | 2974 |
| mTOR (7C10) | 2983 |
| Phospho-Raptor (Ser792) | 2083 |
| Phospho-Rictor (Thr 1135) | 3806 |
| Raptor (24C12) | 2280 |
| Rictor | 2140 |
| 4EBP Sampler Kit | 9955 |
Electron microscopy.
For electron microscopy, animals were perfused with modified Karnovsky's fixative (2% paraformaldehyde/2.5% glutaraldehyde) in phosphate buffer, pH 7.4. The brain and spinal cord were removed and postfixed overnight in the same fixative. Corpus callosum was isolated from 1 mm coronal slices of brain between −0.94 and −2.18 of bregma (Franklin and Paxinos, 2008). Spinal cords were cut into 1 mm coronal sections through the cervical enlargement. All tissue was postfixed in 1% osmium tetroxide, dehydrated in graded acetone, and resin embedded in Embed 812 (Electron Microscopy Sciences) using a PELCO BioWave Pro tissue processor (Ted Pella). The corpus callosum pieces were oriented such that sections could be cut midline in a sagittal plane. Spinal cord pieces were oriented such that sections could be cut in a transverse plane. Ultrathin sections (80 nm) were mounted on copper grids and stained with uranyl acetate and lead citrate and viewed at 80 kV on a Tecnai G2 transmission electron microscope (FEI). Electron micrographs of the corpus callosum were imaged at midline and spinal cord images were obtained from the region of the dorsal columns.
g-ratio calculations.
g-ratios of myelinated fibers were calculated as the ratio of the diameter of the axon to the diameter of the myelinated fiber derived from measuring the respective perimeter using ImageJ software (http://rsb.info.nih.gov/ij/index.html; Narayanan et al., 2009). A minimum of 100 axons per condition was quantified, and samples were analyzed from three animals per condition.
RNA isolation and reverse transcription.
Animals were anesthetized and decapitated, tissue was removed, isolated, and snap frozen in liquid nitrogen. Tissue was stored at −80°C until extraction. Total RNA was extracted in TRIzol (Invitrogen) from microdissected corpus callosum or spinal cord using a Polytron PT3000 (Brinkmann). RNA (1 μg) was reverse transcribed to cDNA (Invitrogen). RNA integrity was evaluated on an RNA Nano Chip run on a Bioanalyzer 2100 (Agilent Technologies, Santa Clara CA). RNA integrity numbers (RIN) for all samples were 8.1–9.3. The synthesized cDNA was stored at −20°C until further use.
Quantification by quantitative PCR.
Quantitative PCR (qPCR) was performed on a Roche LightCycler 480 II Real Time PCR instrument, using Roche LightCycler Probes Master (Roche 04 707 494 001). PCR was performed with TaqMan Gene Expression Probe Mix with RNA-specific primers (see Table 2) and 10 ng of cDNA per reaction. All standard curve and validation reactions were performed in triplicate with no template control (NTC) reactions for all primer sets. All samples were run in duplicate. PCR cycling parameters were as manufacturer's protocol. Advanced relative quantitation was performed using the LC480 II data collection software release 1.5.0.39 SP4. Seven log10 dilutions of plasmid template for all reference genes were prepared and used; PCR efficiency for all reference gene probe sets ranged from 92.2 to 96.3% with all r2 values > 0.99. To avoid confounding technical variation, one standard curve sample for all reference genes was included on every plate. Geometric averaging of at least four reference genes (B2m, gapdh, Gusb, and Pkg1) was used to normalize all target gene transcripts. NTC reactions for all primer sets were >5 Cq from all control and unknown samples.
Table 2.
qPCR probes
| Gene | Probe |
|---|---|
| MBP | Mm01266402_m1 |
| CNP | Mm01306640_m1 |
| MOG | Mm00447824_m1 |
| MAG | Mm00487538_m1 |
| PLP | Mm00456892_m1 |
Results
Ablation of Raptor in spinal cord oligodendrocytes resulted in selective decreases in myelin proteins
To first assess if our animals had deficits, we investigated the impact of Raptor ablation on myelin proteins and mRNAs. Western blots and qPCR were performed on control Raptorfl/fl and Raptor cKO spinal cord samples at postnatal day 14 (P14; early myelination) and P29 (final stages of active myelination). At P14 there was a significant reduction in proteolipid protein (PLP), myelin basic protein (MBP), myelin oligodendrocyte glycoprotein (MOG), 2′3′ cyclic nucleotide 3′-phosphodiesterase (CNP) and myelin associated glycoprotein (MAG), with the greatest reduction in MBP and MOG (Fig. 1A,B, left). At P29, MBP, PLP and CNP remained reduced, but MAG was at control levels with MOG near control (Fig. 1B, right). In the Raptor cKO spinal cord, MBP was the most consistently reduced myelin protein, suggesting a particular impact of the loss of mTORC1 on MBP protein accumulation. In the accompanying study on the complete mTOR cKO animal, MBP protein expression was also dramatically reduced (Wahl et al., 2014). It should be noted that our cKO animals were CNP heterozygotes, which results in ∼50% reduction in CNP enzyme activity, and presumably RNA (Lappe-Siefke et al., 2003), and this may be the primary effect on CNP RNA and protein expression in these animals.
Figure 1.

Ablation of Raptor in spinal cord oligodendrocytes resulted in selective decreases in myelin proteins and RNA during oligodendrocyte development. A, B, Representative Western blot (A) and quantification (B) of myelin proteins from P14 (left) and P29 (right) spinal cord lysates of control floxed Raptor (fl/fl) and Raptor cKO (cKO) animals. Quantification by Odyssey analysis of n ≥ 3 blots from n ≥ 3 animals per group. C, qPCR analysis of myelin protein RNAs from P14 (left) and P29 (right) whole spinal cord lysates. Each value represents duplicate samples from n = 6 animals. Control animal values are set to 100% based on averaging the actual numerical values, and the Raptor cKO values are graphed as a percentage of control. Values are displayed as ±SEM (*p < 0.05, **p < 0.005, ***p < 0.001, ****p < 0.0001).
Ablation of Raptor in spinal cord oligodendrocytes resulted in altered myelin RNAs during oligodendrocyte development
Myelin RNA expression was quantified by qPCR for all myelin proteins examined (Fig. 1C). In P14 spinal cord, all myelin protein RNAs were significantly reduced, as were the myelin proteins at this age. Interestingly, the myelin RNA levels were all ∼50% of control (Fig. 1C), whereas MBP and MOG protein levels were far more reduced relative to control at this age (Fig. 1B, left). At P29, myelin RNA expression was still reduced relative to controls (Fig. 1C, right). However, only MOG and MAG RNAs were still significantly reduced. It should be noted that while MBP mRNA was somewhat reduced, MBP protein was barely detectable at P29 in Raptor cKO spinal cord.
Comparison of myelin protein expression relative to myelin RNA expression suggests an unexpectedly strong impact of Raptor cKO on myelin RNA expression in oligodendrocytes. Typically, mTORC1 (Raptor) is considered to impact protein translation, but only MBP protein was downregulated at both ages relative to its RNA expression. Thus, loss of mTORC1 appeared to reduce myelin RNAs ∼50%.
Ablation of Raptor in corpus callosum oligodendrocytes resulted in selective decreases in myelin proteins and RNAs
Because of known oligodendrocyte heterogeneity, the impact of Raptor deletion in oligodendrocytes was also studied in the corpus callosum. The corpus callosum was microdissected from P14 or P29 Raptor cKO and control animals, and lysates were analyzed by Western blot (Fig. 2A,B). PLP, MBP, and CNP were significantly reduced in the corpus callosum from P14 with no significant reduction in MOG or MAG. By P29, MBP protein was close to control levels, while PLP, MOG, CNP, and MAG proteins were statistically significantly reduced (Fig. 2B).
Figure 2.

Ablation of Raptor in corpus callosum oligodendrocytes resulted in selective decreases in myelin proteins RNAs. A, B, Western blot analysis and quantification of P14 (left) and P29 (right) oligodendrocyte-enriched corpus callosum lysates. Quantification by Odyssey analysis of n ≥ 3 blots from n = 3 animals. C, qPCR quantification of myelin RNAs at P14 (left) and P29 (right) in oligodendrocyte-enriched corpus callosum RNA samples. Each value represents duplicate samples from n = 6 animals. Values are expressed as ±SEM (*p < 0.05, **p < 0.005, ***p < 0.001, ****p < 0.0001).
As for spinal cord, microdissected corpus callosum RNA from P14 and P29 Raptor cKO and control animals was analyzed (Fig. 2C). At P14 PLP, MBP, and CNP RNAs were all significantly reduced in the Raptor cKO animals (Fig. 2C), which correlated to the reductions seen in the myelin proteins (Fig. 2B). However, although there was no reduction in MAG protein there was a small, but significant reduction in MAG RNA (Fig. 2C). At P29, the myelin RNAs in the corpus callosum of the Raptor cKO mice were all decreased compared with control levels, although the decrease in MAG was no longer significant (Fig. 2C). The reductions in protein expression were generally consistent with the losses in RNA for these samples. These data suggested that mTORC1 may have a particular role in transcriptional regulation in oligodendrocytes, in addition to its known role in protein translation. The impact of mTORC1 on oligodendrocyte RNA expression may be a major regulator of the overall oligodendrocyte differentiation program.
The most striking differences between the impact of Raptor loss in spinal cord and corpus callosum was the dramatic absence of MBP protein in Raptor cKO spinal cord. MBP was reduced at P14 in both regions, but it recovered to close to control levels in corpus callosum by P29. We therefore investigated oligodendrocyte differentiation in these animals.
Ablation of Raptor in spinal cord oligodendrocytes resulted in delayed maturation
To assess whether changes in oligodendrocyte protein and RNA expression resulted from an impact of Raptor on oligodendrocyte differentiation, the total number of oligodendrocytes and their differentiation into mature, myelinating oligodendrocytes was analyzed. Oligodendrocyte progenitors (NG2 proteoglycan-positive cells), mature oligodendrocytes (CC1-positive cells), and total oligodendrocyte number (Olig2-positive cells) were quantified at P14 and P29. The total number of oligodendrocytes (Olig2-positive cells) in Raptor cKO spinal cord was only slightly reduced at P14. Intriguingly, at P14, there was a significant increase in NG2-positive cells (Fig. 3A, left, B) with a reduction in the number of CC1-positive cells (Fig. 3A,B). When only the double-positive NG2/Olig2-positive or CC1-positive/Olig2-positive cells were quantified (Fig. 3B, right graph), the percentage of NG2/Olig2-positive cells for cKO mice was dramatically upregulated, relative to control, and CC1/Olig2-positive cells were reduced. This suggested that the loss of mTORC1 in these cells delayed oligodendrocyte progenitor cell (OPC) maturation. Reductions in Olig2-positive and CC1-positive cells remained at P29, although not statistically significant (Fig. 3C). By 2 months, however, there was a dramatic loss of total oligodendrocytes in the spinal cord, in particular the mature CC1-positive cells (Fig. 3D,E). Thus, in spinal cord, the loss of Raptor appears to lead eventually to significantly reduced numbers of myelinating oligodendrocytes.
Figure 3.
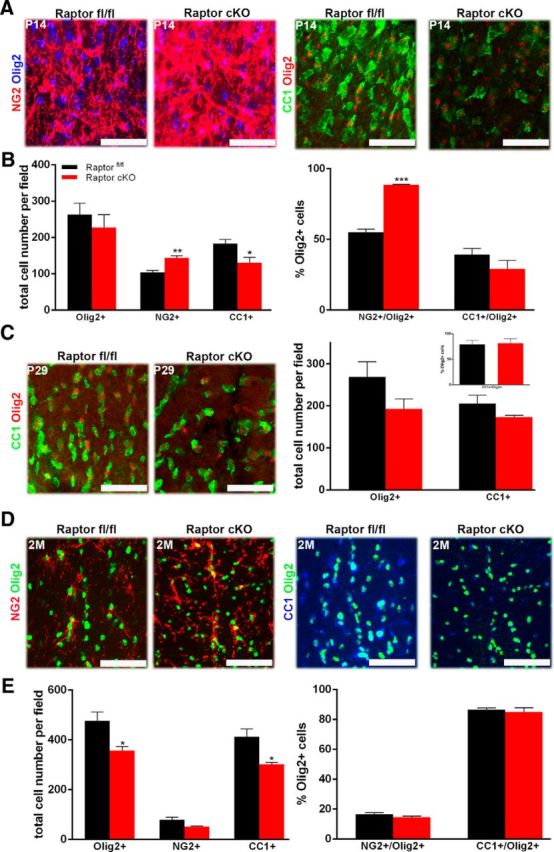
Ablation of Raptor in spinal cord oligodendrocytes resulted in delayed maturation. P14 and P29 spinal cord sections were analyzed for total oligodendrocytes, OPCs, and mature oligodendrocytes. OPCs: representative image (A, left) and quantification (B) of total oligodendrocytes (Olig2: blue) or OPCs (NG2:red) in the P14 cervical dorsal columns of Raptorfl/fl (black) and Raptor cKO (red) mice. Mature oligodendrocytes: comparable P14 sections (A, right) were also stained for total oligodendrocytes (Olig2:red) and mature oligodendrocytes (CC1:green). Quantification was from n ≥ 3 sections from n ≥ 3 animals. The left graph (B) represents the total number of Olig2-, NG2-, or CC1-positive cells per field. The right graph is the percentage of the total Olig2-positive cells that double labeled for NG2 or CC1. Since a small number of either NG2-positive or CC1-positive cells did not also express Olig2, they were not included in this quantification. C, P29 spinal cord sections were stained for Olig2 (red, all oligodendrocyte lineage cells) and CC1 (green, mature oligodendrocytes). Representative image (left) and quantification (right) of total oligodendrocytes and mature oligodendrocytes in the cervical dorsal columns of P29 Raptorfl/fl and Raptor cKO mice. The main graph represents the total number of Olig2-positive or CC1-positive cells. The inset graph demonstrated that the percentage of the total Olig2-positive cells that double labeled for CC1 was normal. Since a small number of CC1-positive cells did not also express Olig2, they were not included in this quantification. D, Representative images of 2 month (2M) Raptor cKO and Raptorfl/fl controls stained with NG2 (red), CC1 (blue), or Olig2 (green; top). E, Quantification showed that the total number of Olig2-positive cells and CC1-positive cells was significantly decreased in the Raptor cKO animals (bottom left), but the percentage of CC1 or NG2-positive/ Olig2-positive cells was not significantly different in the Raptor cKO animals compared with the control (bottom right). Quantification was from n ≥ 3 sections from n ≥ 3 animals. Scale bars, 50 μm. Values displayed as ±SEM (n = 4, *p < 0.05, **p < 0.005, ***p < 0.001).
Oligodendrocyte cell number and differentiation in Raptor cKO corpus callosum were also reduced
As in the spinal cord, the total number of oligodendrocytes and their differentiation state were quantified in the corpus callosum. In this tissue, the OPC number was more easily quantified by staining for the OPC marker PDGFRα rather than NG2, which was more useful in spinal cord. CC1-positive and Olig2-positive cells were quantified as in the spinal cord. In contrast to the spinal cord where there were increased OPCs at P14, there was a reduction in the total number of oligodendrocytes and of OPCs at P14 in corpus callosum. The percentage of oligodendrocyte-lineage cells in corpus callosum at this age that were OPCs was reduced, although not significantly different from controls (Fig. 4A, right graph). At P29, the reduction in the total number of oligodendrocytes persisted, and the relative percentage of CC1-positive mature oligodendrocytes was reduced (Fig. 4B, right graph). Thus, as in spinal cord, differentiation was delayed, and there was a reduction in the total oligodendrocyte population in the corpus callosum compared with the controls at P29 (Fig. 4B). Intriguingly, however, by 2 months, oligodendrocyte number and differentiation state in the Raptor cKO corpus callosum were indistinguishable from control animals (Fig. 4C,D). Thus, in contrast to spinal cord, where the loss of Raptor resulted eventually in the loss of total myelinating oligodendrocytes, the loss of Raptor in oligodendrocytes in the corpus callosum initially delayed differentiation, but oligodendrocyte number and differentiation recovered with time. Interestingly, in the collaborative study on mTOR cKO animals studied by Wahl et al. (2014), there were also greater effects on oligodendrocyte differentiation in spinal cord relative to corpus callosum.
Figure 4.
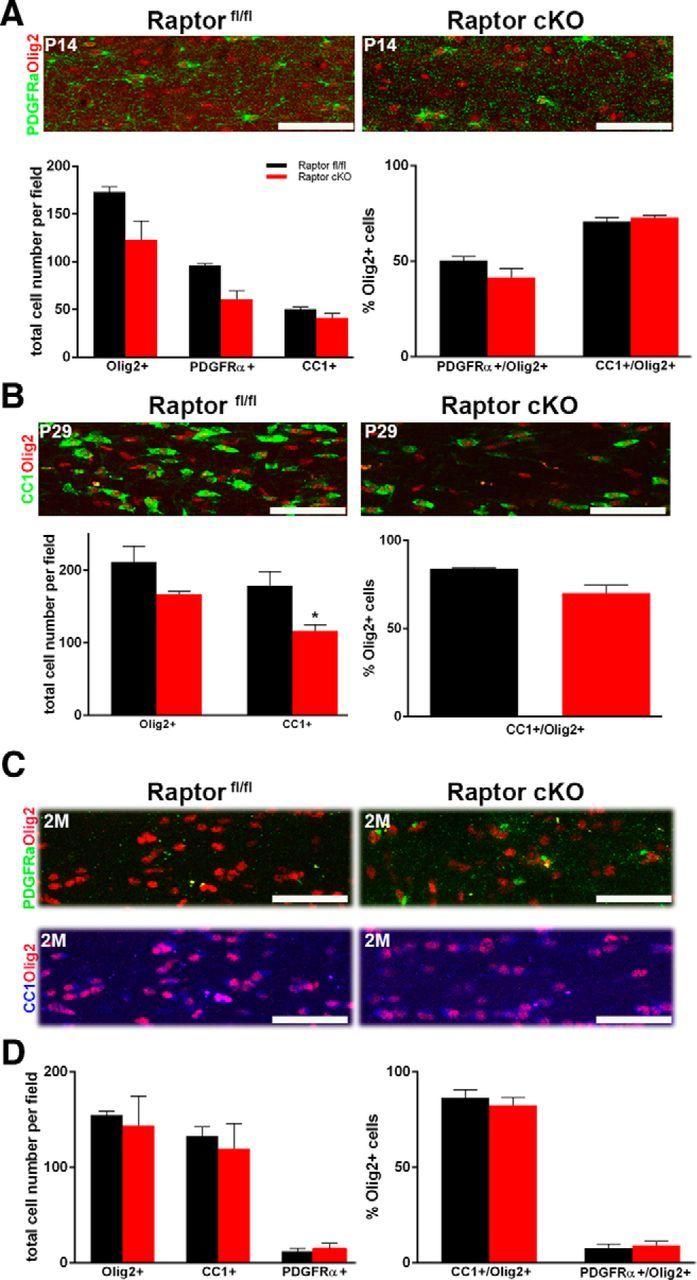
Ablation of Raptor in corpus callosum oligodendrocytes resulted in reduced oligodendrocyte number and delayed maturation. A, P14 corpus callosum sections were stained for Olig2 (red, all oligodendrocyte lineage cells) and PDGFRα (green, OPCs). Top is a representative image of the series that were quantified for total oligodendrocytes or OPCs in the P14 Raptorfl/fl (black) and Raptor cKO (red) animals. The left graph represents the total number of Olig2-positive or PDGFRα-positive cells. The right graph is the percentage of the total Olig2-positive cells that double labeled for PDGFRα. Since a small number of PDGFRα-positive cells did not also express Olig2, they were not included in this quantification. Quantification was from n ≥ 3 sections from n ≥ 3 animals. B, P29 spinal cord sections were stained for Olig2 (red, all oligodendrocyte lineage cells) and CC1 (green, mature oligodendrocytes). Representative image (top) and quantification (lower graph) of total oligodendrocytes and mature oligodendrocytes in the corpus callosum of P29 control Raptorfl/fl and Raptor cKO animals. The left graph represents the total number of Olig2-, or CC1-positive cells. The right graph is the percentage of the total Olig2-positive cells that double labeled for CC1. Since a small number of CC1-positive cells did not also express Olig2, they were not included in this quantification. C, Representative images of 2 month (2M) Raptor control and Raptor cKO corpus callosum stained with PDGFRα (green), CC1 (blue), and Olig2 (red; top). D, Quantification of total Olig2-, PDGFRα-, and CC1-positive cells showed a reduction, but was not significantly reduced. Quantification was from n ≥ 3 sections from n ≥ 3 animals. Scale bars, 50 μm. Values displayed as ±SEM (*p < 0.05, **p < 0.005).
Myelin sheath thickness was reduced in the spinal cord of Raptor cKO animals
Spinal cord myelin was analyzed by electron microscopy at P14, P29, and 2 months. In addition to the reduction in oligodendrocyte number in the Raptor cKO animals compared with controls (Fig. 3), the myelin sheath was thinner in the dorsal columns of the Raptor cKO mice (Fig. 5A). Quantitative analysis of g-ratios showed a significant reduction in myelin thickness (increased g-ratio) in the P14 spinal cord of the Raptor cKO animals (Fig. 5B). There was also essentially a doubling of the number of unmyelinated axons at P14, with a shift in distribution from small axons to those >1 μm. These data suggested that loss of Raptor in spinal cord oligodendrocytes resulted in less myelination of small axons, leaving more unmyelinated, and larger axons with thinner myelin. By P29, however, the normal number of axons was myelinated, including more small axons in Raptor cKO spinal cords (Fig. 5C), although axons with a diameter >3 μm had abnormal myelin compaction at this age (Fig. 5C,E). Myelin thickness on these larger axons could not be quantified for g-ratio due to the atypical myelin compaction (Fig. 5C,E). Thus, the myelinated axons clearly had thinner myelin (Fig. 5A, middle images), but the g-ratio presented is for the thinner axons, as it was not possible to quantify that accurately for the whole population of myelinated axons. However, at 2 months of age in the Raptor cKOs, while the reduction in myelin sheath thickness was still present, the compaction of the large caliber axons appeared to recover, relative to the control animals, as did the size distribution of myelinated axons (Fig. 5A,D). Thus, the excess myelin seen at P29 appeared to have been degraded and eliminated as the tissue matured. The impact of Raptor cKO on myelin ultrastructure in spinal cord is consistent with our earlier data that suggested delayed oligodendrocyte differentiation and production of myelin proteins and RNAs in this CNS region (Figs. 1, 3).
Figure 5.
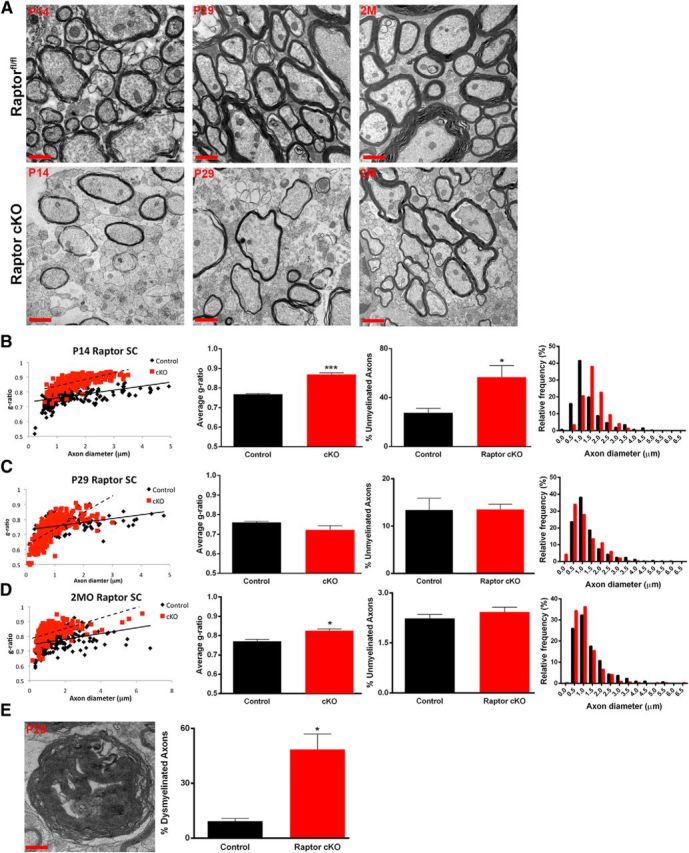
Myelin sheath thickness was reduced in the spinal cord of Raptor cKO animals. Electron micrographs from the dorsal column of the cervical enlargement of P14 (left), P29 (middle), and 2 month (2M; right) spinal cords of control floxed Raptor (top) or Raptor cKO (bottom) animals (A). Scatter plot and quantification of the g-ratio of the P14 (B), P29 (C), and 2 month (2MO; D) spinal cords of the floxed Raptor and Raptor cKO animals. On scatter plots (B–D, graph 1) black squares represent control samples; red squares represent cKO samples. Note increased g-ratio at P14 and 2 months (B, D; graph 2). Note increased numbers of unmyelinated axons at P14, which approaches control values with development (B–D, graph 3). The size distribution of myelinated axons was quantified and shown to be statistically significantly different (B–D, graph 4). Significant dysmyelination of large caliber axons was noted at P29 (E), which prevented an accurate g-ratio measurement for the P29 time point, where few large diameter axons could be analyzed for g-ratio (C, scatter plot, red squares). Large caliber axons with uncompacted myelin (dysmyelinated) at P29 were quantified (E, graph). The dysmyelination noted at P29 was not seen at 2 months of age, but compacted myelin was thinner than control. Scale bars: A, low-magnification images, 1 μm; E, high-magnification representation of the myelin sheath, 100 nm. Values are displayed as ±SEM (n = 3, *p < 0.05, **p < 0.005).
In contrast, in Raptor cKO corpus callosum, the myelin sheath appeared relatively normal
Myelin ultrastructure in the corpus callosum was determined by electron microscopy. In contrast to the Raptor cKO spinal cord, myelin sheath thickness was normal at P14, P29, and 2 months of age (Fig. 6A–C). At P14, at the midline, there were very few myelinated axons in control or Raptor cKO corpus callosum, and g-ratios were not quantified. At P29 and 2 months of age, there were similar numbers of myelinated axons, and relatively “normal” compacted myelin in the Raptor cKO mice. However, we did observe axonal pathologies and aberrant myelination in some micrographs (data not shown). Additionally, at 2 months, the ultrastructure of corpus callosum myelin in the Raptor cKO animals was very poorly defined relative to control. Thus, compared with control myelin that had the typical major dense line/intraperiod line appearance, myelin from the Raptor cKO corpus callosum had a very regular structure, but neither the major dense line nor the intraperiod line were easily identified (Fig. 6A, inset, right top and bottom). Though the myelin thickness may not be significantly changed, it is possible that there are ultrastructural disturbances of the major dense line and intraperiod line, resulting from the loss of MBP and PLP (Fig. 2).
Figure 6.
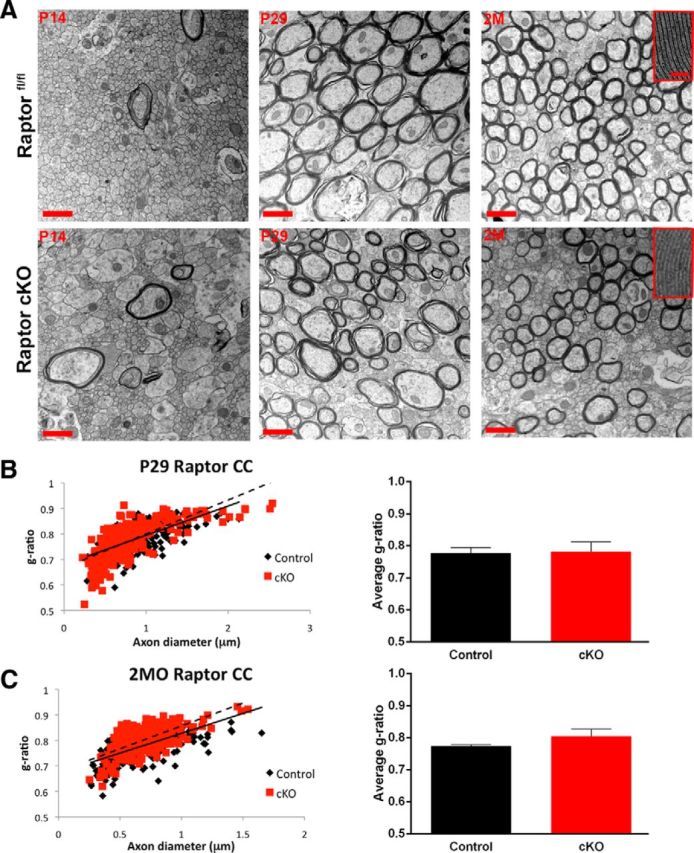
In contrast to spinal cord, in Raptor cKO corpus callosum, myelin sheath compaction was relatively normal. A, Electron micrographs in the corpus callosum of floxed Raptor (black) and Raptor cKO (red) mice at P14 (initiation of myelination), P29 (peak of active myelination), and 2 month (2M; myelin maintenance phase). B, Quantification of the g-ratio as a scatter plot with axonal diameter on the x-axis and the g-ratio on the y-axis for the P29 and 2 month floxed Raptor and Raptor cKO animals (B, C). At P14, there were few myelinated axons (large caliber) in either group. Note high-magnification images of myelin at P29, where there were subtle deficits in myelin compaction in the Raptor cKO mice, but there is not an overall reduction in myelin sheath thickness. At 2 months (2MO), the axonal caliber and myelin thickness was comparable between Raptorfl/fl and Raptor cKO mice (C). Scale bars: A, low-magnification images, 1 μm; high-magnification image insets, 100 nm. Values displayed as ±SEM (n = 3, *p < 0.05, **p < 0.005, ***p < 0.001).
Loss of mTORC2 had less impact on oligodendrocyte development than loss of mTORC1
Rictor conditional KO (Rictor cKO) mice were generated from Rictorfl/fl (control) and CNP Cre+/− crosses. In these mice, oligodendrocyte maturation was not reduced, despite a delay in expression of specific myelin proteins and mRNAs. In the spinal cord of the Rictor cKO animals at P14, as with Raptor cKO mice, MBP, PLP, MOG, and MAG proteins were significantly reduced. However, by P29, myelin protein expression was normal except for the continued significant reduction in MAG (Fig. 7A,B). Myelin RNA expression was consistent with the protein expression except for MBP at either age and MAG at P14, which were apparently translated less efficiently than expected, based on their mRNA expression levels (Fig. 7C). Interestingly, both CNP RNA and protein were at control levels, which was unexpected for CNP-Cre heterozygous animals that, as noted above, typically have reduced CNP (Lappe-Siefke et al., 2003).
Figure 7.

Loss of mTORC2 had less impact on oligodendrocyte development than loss of mTORC1. Representative Western blot (A) and quantification (B) of PLP, MBP, MOG, CNP, and MAG protein from P14 (B, left graph) and P29 (B, right graph) lysates isolated from whole spinal cord lysates of floxed Rictor (black) and Rictor cKO (red) animals. C, qPCR analysis RNA from whole spinal cord lysates from P14 and P29 floxed Rictor (black) and Rictor cKO (red) animals for myelin RNAs. D, Representative immunohistochemically stained sections (Olig2, blue; NG2, red; left) and quantification (right graphs) of cells in the dorsal columns of P14 Rictorfl/fl and Rictor cKO animals. The left graph represents the total number of Olig2-, NG2-, or CC1-positive cells. The right graph is the percentage of the total Olig2-positive cells that double labeled for NG2 or CC1. Since a small number of NG2-positive cells did not also express Olig2, they were not included in this quantification. E, Representative immunohistochemically stained sections (Olig2, red; CC1, green; left) and quantification (right graphs) of mature oligodendrocytes in the dorsal columns of P29 Rictorfl/fl and Rictor cKO spinal cord. The left graph represents the total number of Olig2-positive or CC1-positive cells. The right graph is the percentage of the total Olig2-positive cells that double labeled for CC1. Since a small number of CC1-positive cells did not also express Olig2, they were not included in this quantification. Scale bars, 75 μm. Values are displayed as ±SEM (n ≥ 3, *p < 0.05, **p < 0.005, ***p < 0.001, ****p < 0.0001).
In the P14 spinal cord of the Rictor cKO animals, there were close to normal numbers of Olig2-positive cells but a reduction in NG2-positive OPCs (Fig. 7D). The ratio of NG2-positive OPCs to total oligodendrocytes was reduced compared with control animals (Fig. 7D, right graph), with a moderate but not significant increase in CC1-positive cells (Fig. 7D). Interestingly, at P29 there were comparable numbers of total oligodendrocytes and of CC1-positive cells, relative to control, with an increase in the percentage of mature cells in the Rictor cKO spinal cord. These data suggest that there is no delay in oligodendrocyte maturation during active myelination in the spinal cord, but rather precocious maturation of oligodendrocytes in the absence of Rictor (Fig. 7E).
In Rictor cKO corpus callosum, myelin protein and RNA expression were also downregulated (Fig. 8A,B). At P14, only MBP and PLP protein were significantly reduced (Fig. 8B, left graph). By P29, PLP expression had recovered, but MBP remained reduced, and now MOG, CNP, and MAG proteins were reduced (Fig. 8B, right graph). The myelin RNAs were also reduced in the Rictor cKO corpus callosum to ∼50% of control at both P14 and P29 (Fig. 8C). The number of PDGFRα-positive cells, Olig2-positive cells, and the ratio of PDGFRα-positive/Olig2-positive cells were normal at P14 (Fig. 8D). Assessing oligodendrocyte differentiation, no significant differences were seen in the number of CC1-positive, Olig2-positive, or CC1-positive/Olig2-positive cells at P14 or P29 (Fig. 8E), suggesting that the cell population and its differentiation program were relatively normal, but their specific myelin gene expression and protein translation were reduced per cell.
Figure 8.

Selective myelin proteins and RNAs were impacted in the corpus callosum of Rictor cKO mice. Representative Western blots (A) and quantification (B) of myelin proteins from P14 (B, left graph) and P29 (B, right graph) oligodendrocyte-enriched corpus callosum lysates. qPCR analysis of the transcriptional profile for myelin RNAS in P14 (C, left graph) and P29 (C, right graph) corpus callosum lysates from Rictor cKO and control animals. D, Representative immunohistochemically stained sections (Olig2, red; PDGFRα, green; top) and quantification (lower graph) of cells in the corpus callosum of P14 floxed Rictor (black) and Rictor cKO (red) animals. The main graph represents the total number of Olig2-positive or PDGFRα-positive cells. E, Representative immunohistochemically stained sections (Olig2, red; CC1, green; top) and quantification (lower graphs) of cells in the corpus callosum of P29 Rictorfl/fl and Rictor cKO animals. The main graph represents the total number of Olig2-positive or CC1-positive cells. Scale bars, 200 μm. Values are displayed as ±SEM (n ≥ 3, *p < 0.05, **p < 0.005, ***p < 0.001, ****p < 0.0001).
The ultrastructure of the myelin sheath remained unperturbed when Rictor was ablated in the oligodendrocytes
Despite the reductions in myelin RNAs and proteins in both Rictor cKO spinal cord and corpus callosum, the myelin sheath thickness and integrity appeared comparable to control animals at P14, P29, and 2 months (Fig. 9A,B). There were no significant differences in the g-ratio of the Rictor cKO animals compared with the Rictorfl/fl controls (Fig. 9B,C,D). However, a statistically significant change in the distribution of myelinated axons was noted, in which there were fewer myelinated axons above 2 μm in Rictor cKO spinal cords at P29 (Fig. 9C) compared with controls. Comparable results were obtained in the corpus callosum (Fig. 9E,F,G).
Figure 9.
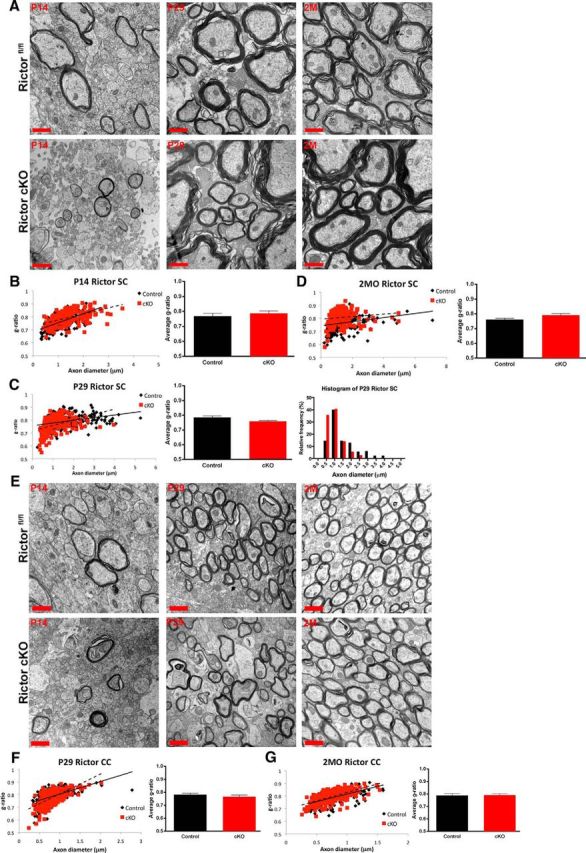
The ultrastructure of the myelin sheath was unperturbed when Rictor was ablated in the oligodendrocytes in spinal cord or corpus callosum. A, Electron micrographs of the dorsal columns (P14, left; P29, middle; 2 months (2M), right) cervical enlargements of the spinal cord. Quantification of the g-ratio of P14 (B), P29 (C), and 2month (2MO) tissue (D). Note that at P29 there is a significant increase in the frequency of small caliber axons in the Rictor cKO compared with control animals. Note no change in g-ratio at any age (bottom). E, Electron micrographs of P14, P29, and 2M tissue at the midline of the corpus callosum of floxed Rictor (black) and Rictor cKO (red) animals. F, G, Quantification of the g-ratio of P29 and 2MO. Scale bar, 1 μm. Values are displayed as ±SEM (n = 3).
Signaling changes in the CNS of Raptor and Rictor cKO mice
Spinal cord or corpus callosum-enriched samples were analyzed by Western blot and immunofluorescence for changes in signaling. In Raptor cKO spinal cord and corpus callosum, there were reductions in phosphorylated (p) Raptor, the downstream target of mTORC1, phosphorylated S6 ribosomal protein (pS6RP), and p4EBPs (Fig. 10C; see Tables 3 and 4 for quantification). These data validated efficient loss of Raptor protein in the spinal cord of the Raptor cKO animals. Additionally, there was also effective loss of Raptor mRNA quantified by qPCR (data not shown). While some changes seen on Western blot could be attributed to other CNS cells, immunohistochemical analysis of the P14 (Fig. 10A) and P29 (Fig. 10B) spinal cords demonstrated reduced pS6RP and/or pRaptor in Olig2-positive or Sox10-positive cells in the Raptor cKO mice and not in the Rictor cKO mice. Despite extensive effort, immunofluorescence for Rictor was unsuccessful with available antibodies, preventing analysis of cell-specific deletion in Rictor cKO mice, but it was clearly downregulated by Western blot (Fig. 10E,F, Tables 3, 4) and qPCR (data not shown). Unexpectedly, in the spinal cord and corpus callosum of the Rictor cKO mice, there was not a significant reduction in the known mTORC2 target, pAkt serine 473, except at P29 in corpus callosum. It was actually upregulated in Rictor cKO corpus callosum at P14. However, as noted above, this may represent expression in nonoligodendrocyte-lineage cells, particularly in dissected P14 corpus callosum, which is not as well delineated as in older tissue.
Figure 10.
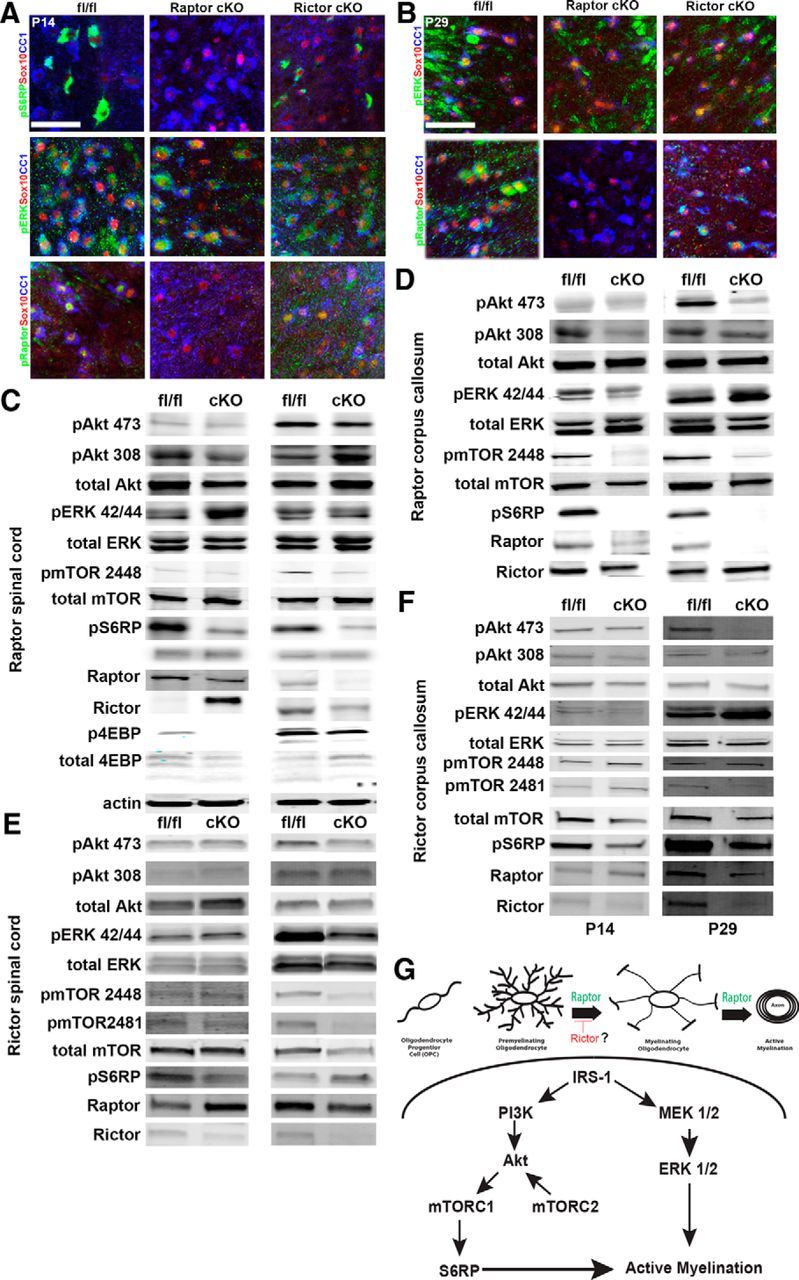
Signaling changes in Raptor and Rictor cKO CNS. Immunohistochemical localization of signaling proteins in oligodendrocytes in P14 (A) and P29 (B) spinal cord sections of floxed control (left), Raptor cKO (middle), and Rictor cKO (right) mice. Sections were analyzed for expression of pS6RP, pERK, or pRaptor in CC1-, Olig2-, or Sox10-positive cells (A, B). Representative Western blots of whole spinal cord or corpus callosum-enriched lysates of P14 and P29 Raptor (C, D) or Rictor (E, F) cKO mice. For significance of signaling proteins that were unchanged from controls or that were significantly decreased, see Tables 3, 4. Schematic of a proposed model for signaling mechanisms regulating myelination within the oligodendrocyte lineage (G). Scale bars: A, B, 50 μm.
Table 3.
Western blot quantification of Raptor fl/fl and cKO animal signaling proteins
| fl/fl % | Raptor spinal cord |
Raptor corpus callosum |
|||
|---|---|---|---|---|---|
| P14 (% control with p value) | P29 (% control with p value) | P14 (% control with p value) | P29 (% control with p value) | ||
| pAkt308/Akt | 100 | 30.83 ± 14.02** | 195.47 ± 70.30* | 197.35 ± 31.41* | 93.27 ± 20.92 |
| pAkt473/Akt | 100 | 105.45 ± 17.27 | 138.24 ± 27.48 | 95.44 ± 14.47 | 73.08 ± 4.05** |
| pERK/ERK | 100 | 195.91 ± 46.67 | 110.38 ± 16.46 | 218.206 ± 112.51 | 269.39 ± 19.61*** |
| pS6RP/β-actin | 100 | 52.15 ± 41.83 | 30.76 ± 3.83**** | 16.8 ± 43.17 | 47.68 ± 60.76 |
| pmTOR2448/mTOR | 100 | 80.19 ± 12.62 | 172.60 ± 48.91 | 82.01 ± 40.10 | 78.14 ± 41.33 |
| pRaptor/Raptor | 100 | 65.20 ± 22.51 | 47.40 ± 20.68* | 20.13 ± 22.56* | 17.20 ± 25.60 |
| pRictor/Rictor | 100 | 202.93 ± 33.95* | 46.5 ± 37.90 | 139.37 ± 112.85 | 71.50 ± 47.02 |
| P4EBP/4EBP | 100 | 45.56 ± 16.67* | 74.65 ± 37.75 | 98.40 ± 58.62 | 50.28 ± 2.40*** |
Lysates prepared from P14 and P29 whole spinal cord lysates or white matter-enriched regions of the corpus callosum (see Results). Values ±SEM, n = 3,
*p ≤ 0.05,
**p ≤ 0.005,
***p ≤ 0.001,
****p ≤ 0.0001.
Table 4.
Western blot quantification of Rictor fl/fl and cKO animal signaling proteins
| fl/fl % | Rictor spinal cord |
Rictor corpus callosum |
|||
|---|---|---|---|---|---|
| P14 (% control with p value) | P29 (% control with p value) | P14 (% control with p value) | P29 (% control with p value) | ||
| pAkt308/Akt | 100 | 81.47 ± 10.51 | 107.85 ± 20.08 | 101.68 ± 19.21 | 92.42 ± 6.76 |
| pAkt473/Akt | 100 | 83.84 ± 11.24 | 88.80 ± 13.02 | 123.79 ± 9.57* | 67.40 ± 14.45* |
| pERK/ERK | 100 | 175.00 ± 82.73 | 101.68 ± 19.21 | 88.61 ± 27.33 | 150.39 ± 88.90 |
| pS6RP/β-actin | 100 | 25.46 ± 0.18**** | 163.77 ± 22.98* | 24.56 ± 2.33**** | 68.54 ± 4.48** |
| pmTOR2448/mTOR | 100 | 63.43 ± 1.3**** | 83.56 ± 10.59 | 119.65 ± 12.71 | 60.95 ± 5.98** |
| pmTOR2481/mTOR | 100 | 42.19 ± 15.37** | 30.6 ± 6.65**** | 97.01 ± 11.93 | 111.01 ± 16.08 |
| Raptor/β-actin | 100 | 56.57 ± 8.26** | 108.30 ± 8.09 | 74.41 ± 14.33 | 97.78 ± 4.48 |
| Rictor/β-actin | 100 | 0.90 ± 0.43**** | 22.5 ± 5.71**** | 37.32 ± 2.77**** | 16.42 ± 4.31**** |
Lysates prepared from P14 and P29 whole spinal cord lysates or white matter-enriched regions of the corpus callosum (see Results). Values ±SEM, n = 3,
*p ≤ 0.05,
**p ≤ 0.005,
***p ≤ 0.001,
****p ≤ 0.0001.
Despite significant upregulation of phospho-Rictor at P14 in Raptor cKO spinal cord, there was no evidence of functional compensation by mTORC2 signaling in these mice. In both the spinal cord and corpus callosum of the Raptor cKO mice, mTORC2 signaling (pAkt473) was not upregulated, and was in fact downregulated at P29 in corpus callosum (Fig. 10; Tables 3, 4). On the other hand, pERK was upregulated in Raptor cKO spinal cord and corpus callosum, and it was clearly expressed at high levels in Sox10-positive oligodendrocytes in Raptor cKO mice (Fig. 10A).
Interestingly, in the spinal cord and corpus callosum of the Rictor cKO mice at P14, there were clear reductions in pS6RP, pmTOR2448, and total Raptor protein (Fig. 10E,F; Tables 3, 4). Thus, upregulation of the mTORC1 signaling pathway did not compensate for the loss of Rictor, and there may actually be a reduction of mTORC1 signaling in Rictor cKO mice. There was also no evidence that the ERK signaling pathway was compensating for the loss of Rictor and the downregulation of mTORC2 to regulate active myelination. Thus, either Rictor (mTORC2) has little impact on myelination, or we have not yet identified the compensating pathway. The data described above (Fig. 7) suggest that at least in spinal cord, it may be a negative regulator of initial oligodendrocyte differentiation. We propose a working model that depicts possible signaling mechanisms regulating myelination between the Akt/mTOR and ERK 1/2 signaling pathways (Fig. 10G). These data suggested that Akt/mTORC1/S6RP-mediated signaling is critical in regulating myelination, in particular in the spinal cord, that mTORC2 may act as a negative regulator of initial oligodendrocyte differentiation, and that ERK 1/2 signaling may be increased in the Raptor cKO mice, but not the Rictor cKO mice.
Discussion
Our studies demonstrated that mTORC1 was a positive mediator of oligodendrocyte differentiation and active myelination in the spinal cord. When Raptor, the functional mTORC1 component, was deleted in oligodendrocytes, its established downstream target, S6RP, was downregulated in oligodendrocytes in the white matter of the spinal cord and in the corpus callosum (Fig. 10). Ablation of Raptor resulted in decreased oligodendrocyte number, maturation, myelin sheath thickness, and compaction of large caliber axons at the peak of active myelination, exclusively in the spinal cord. The ultrastructural changes to the integrity of the myelin sheath, the downregulation of myelin protein and RNA, and the changes in oligodendrocyte number and differentiation program showed that mTORC1 is a key signaling mediator of myelination at both the translational and transcriptional level. mTORC2 function in oligodendrocyte differentiation and myelination is less clear. Our Rictor cKO animal had significant changes in selected myelin proteins and mRNAs, and a shift to reduced myelination of large axons, although myelin sheath thickness was not reduced. The intriguing aspect of the Rictor cKO mice was that there was precocious differentiation of oligodendrocytes in some regions. Together, these data suggest that Raptor (mTORC1) is a positive regulator of the later stages of oligodendrocyte differentiation and active myelination, while Rictor (mTORC2) may be a negative regulator of initial oligodendrocyte differentiation.
mTORC1 is classically known as a regulator of protein translation, but in these studies, the significant reduction in multiple myelin proteins likely resulted from the concomitant reduction in myelin RNAs. Intriguingly, the most downregulated myelin protein in spinal cord was MBP, which was expressed at far lower concentration than its reduced RNA would predict. Thus, MBP is the only protein for which mTORC1-dependent translation would be suggested. MBP is translated on ribosomes out in the myelin (Colman et al., 1982; Ainger et al., 1993, 1997; Carson et al., 1997). Far less MBP protein was present than MBP RNA in multiple regions and developmental stages (Figs. 1, 2, 7, 8). Since the MBP RNA was only 50% reduced at P14 and was not statistically significantly reduced at P29 in Raptor cKO spinal cord (Fig. 1), the fact that the protein was dramatically reduced in expression may indicate that the MBP RNA cannot be trafficked appropriately or efficiently translated locally. This would be consistent with studies in neurons demonstrating that mTORC1 regulates local translation of mRNAs (Schratt et al., 2004; Takei et al., 2004; Vickers and Wyllie, 2007).
In contrast to Raptor (mTORC1), Rictor was not essential for active myelination, and its impact was subtle. Thus, Rictor deletion slightly increased oligodendrocyte differentiation, and the increased CC1-positive cell number in the corpus callosum of the Rictor cKO mice at P14 and P29 is consistent with the concept that Rictor may be a negative regulator of mTORC1 during differentiation of the OPC to a myelinating oligodendrocyte. That interpretation would fit with our Western blot analysis that showed in the P14 Raptor cKO spinal cord samples that there was increased phosphorylated Rictor protein expression at the same time there was an increase in NG2-positive cells. (Figs. 3, 10).
As in these studies on Raptor/Rictor ablation in oligodendrocytes, it is not uncommon for tissue-specific ablation to show a more severe phenotype in Raptor versus Rictor loss. In skeletal muscle, it has been reported that Raptor but not Rictor ablation resulted in severe myopathy (Bentzinger et al., 2008). When assessing the role of the complete mTOR knock-out in this system, it was concluded that Raptor (mTORC1) signaling was critical for regulating oxidative muscle integrity while Rictor was dispensable (Risson et al., 2009). There appears to be interaction of the two pathways in other cells. mTORC1 activation of S6K can regulate mTORC2 signaling (Julien et al., 2010). However, to date, there are no data demonstrating regulation of mTORC1 by Rictor/mTORC2. Therefore, Raptor ablation could potentially dysregulate both mTORC1 and mTORC2 function, but not vice versa, and Rictor ablation would be expected to have a more selective impact in cells.
It is particularly intriguing that myelin appeared relatively normal in several regions in both Raptor/Rictor cKO mice despite major losses of myelin proteins. Only those samples that had very low levels of MBP had major myelin changes. This is consistent with myelin production in numerous myelin gene deletion mice. For example, the shiverer mouse, which has a deletion in the MBP gene and produces no MBP protein, produces essentially no myelin (Roach et al., 1985; Takahashi et al., 1985; Molineaux et al., 1986). This deletion is repaired by overexpression of the normal MBP gene, and as little as 25% of normal amounts of MBP are sufficient to “cure” the MBP deletion in shiverer mice and allow myelin accumulation (Popko et al., 1987; Shine et al., 1992). Thus, the presence of 25% or more MBP protein in Rictor cKO tissues (Figs. 7, 8) should be sufficient to allow myelin accumulation. In contrast, the full deletion of MAG, PLP, or CNP has surprisingly little impact on myelin production (Montag et al., 1994; Klugmann et al., 1997; Lappe-Siefke et al., 2003). These deletion mice all demonstrate long-term detrimental effects on axonal function, and clearly the myelin is altered, but actual production of the myelin is not prevented, even with the loss of one of the most abundant myelin proteins, PLP. This suggests that extensive redundancy is part of the CNS myelination program, and possibly because of the truly essential nature of myelin for normal brain function, loss of very few myelin proteins completely eliminates myelin accumulation.
Our studies suggest that while mTORC1 affects oligodendrocyte development, particularly in the spinal cord, it is not having a major impact on myelin protein translation, except as noted above for MBP. It is possible that its impact on myelin RNA expression in these cKO animals was through the translation of important oligodendrocyte transcription factors, and this will be an important area for further investigation. Increasing evidence indicates that mTORC1 impacts RNA expression in several ways. For example, it is known to regulate transcription of genes that impact cell metabolism (Cunningham et al., 2007). Importantly, Raptor has been shown to physically bind to and regulate how YY1 (another transcription factor important for oligodendrocytes) binds to gene promoters (Cunningham et al., 2007). Furthermore, its activation or downregulation in adipocytes regulates RNA expression for specific lipid synthesis enzymes (Chakrabarti et al., 2010), and adipose-specific knock-out of Raptor results in increased expression of RNAs encoding mitochondrial metabolic proteins (Polak et al., 2008). Thus, Raptor has been clearly shown to have mTORC1-dependent and -independent functions in other systems in which it regulates protein and gene expression.
In the analysis of myelination per se, both the mTOR cKO (Wahl et al., 2014) and Raptor cKO animals (Figs. 5, 6) displayed reduced myelin sheath thickness in the spinal cord but not in the corpus callosum. These data suggest that compensatory pathways may exist in the corpus callosum that regulate myelination independent of mTOR/mTORC1. Though we performed a thorough analysis of the myelin protein and mRNAs of the different regions, we have not yet investigated the role of lipid biogenesis in oligodendrocytes, essential for myelin membrane formation. Many lipid biosynthetic enzymes are regulated by mTORC1 and mTORC2 in other systems (Yecies et al., 2011; Ricoult and Manning, 2013), and the Wood laboratory has previously shown that there are a plethora of mTOR complex targets, including lipid enzymes, which are modulated upon pharmacological inhibition of mTOR in vitro (Tyler et al., 2011).
There is increasing evidence for regional heterogeneity of oligodendrocytes (Reynolds and Herschkowitz, 1987; Hardy et al., 1996; Riddle et al., 2006; Sypecka and Sarnowska, 2013). For example, the ablation of Fyn kinase results in differential impact on myelination in different areas of the CNS (Sperber et al., 2001). Spatial and/or temporal oligodendrocyte heterogeneity may be highlighted in our Raptor cKO animal model, in which we see different types of dysmyelination of two different areas of the CNS. The extensive loss of oligodendrocytes in the spinal cord of these mice clearly indicates a different mechanism for Raptor signaling in spinal cord oligodendrocytes, relative to corpus callosum. Such regional regulation may result from differences in the extracellular environment and the surrounding neurons and their axons, which could influence and modulate intrinsic oligodendrocyte signaling. In contrast, an intrinsically heterogeneous population of oligodendrocytes may use different signaling mechanisms to regulate myelination in different regions of the CNS. For example, recent studies suggest significant differences in the ability of gray matter oligodendrocytes to respond to environmental cues in white matter areas (Viganò et al., 2013). While our studies do not compare white and gray matter myelination, the extracellular environment and architecture of the corpus callosum is likely quite different from spinal cord tracts. Thus, some element of compensation must occur in corpus callosum oligodendrocytes to maintain the normal numbers of oligodendrocytes and enhance myelination in the absence of mTORC1.
One mechanism by which the impact of Raptor loss may be differentially regulated is through intracellular signaling. It has been shown in vivo in the spinal cord that ERK 1/2 MAPK signaling is not required for oligodendrocyte differentiation, but is necessary for regulating myelin sheath thickness during active myelination (Ishii et al., 2012). We hypothesize that while ERK 1/2 signaling increased somewhat in spinal cord, Raptor loss could not be fully compensated for by ERK 1/2, and therefore Raptor cKO animals had reduced myelin sheath thickness in spinal cord. In contrast, ERK 1/2 signaling was increased even more in corpus callosum, where the major impact of Raptor loss was delayed oligodendrocyte maturation, but eventually oligodendrocyte number and myelin thickness were not significantly different from controls.
Trying to resolve the potential unique functions of mTORC1 and mTORC2 in oligodendrocytes has been aided by our collaboration with the Wood laboratory. We used similar animal models to conditionally ablate mTOR, Raptor, or Rictor, and used the pooled results to distinguish unique functions for each complex throughout oligodendrocyte differentiation and myelination. Data from both of our laboratories suggested that while there might be a tight balance between mTORC1 and mTORC2 activity that regulates oligodendrocyte differentiation and myelination, the mTORC1 pathway was the more critical mTOR complex regulating oligodendrocyte differentiation and myelination. Our studies and those of Wahl et al. (2014) on the conditional mTOR deletion have strikingly similar phenotypes for spinal cord development. Thus, there was initially less myelination of small axons, more unmyelinated axons in general, and thinner myelin of larger axons, and even at 2 months, there was thinner myelin. These studies on either the mTOR deletion or Raptor deletion in oligodendrocytes suggest that mTOR, likely acting through mTORC1, is a positive regulator of oligodendrocyte differentiation in the spinal cord (Wahl et al., 2014; Fig. 3).
These studies have shown that mTOR signaling, and more specifically, signaling through mTORC1, was the more critical complex in regulating developmental oligodendrocyte differentiation and myelination in a region-specific manner. Both mTORC1 and mTORC2 modulated the oligodendrocyte program during development, but mTORC1 and mTORC2 do not functionally compensate for the loss of the other, and they have unique functions within the oligodendrocyte program.
Footnotes
This work is supported by the National Institute of Neurological Disorders and Stroke NS082203 to W.B.M. and T.L.W. and the National Research Service Award to J.T.A.
The authors declare no competing financial interests.
We thank Cecilia Culp, Katherine E. Saul, and Elizabeth Gould for technical assistance; Dorothy Dill for assistance with electron microscopy; Randall Wong for assistance with qRT-PCR; and Stacey E. Wahl and Lauren E. McLane for extensive discussions.
References
- Ainger K, Avossa D, Morgan F, Hill SJ, Barry C, Barbarese E, Carson JH. Transport and localization of exogenous myelin basic protein mRNA microinjected into oligodendrocytes. J Cell Biol. 1993;123:431–441. doi: 10.1083/jcb.123.2.431. [DOI] [PMC free article] [PubMed] [Google Scholar]
- Ainger K, Avossa D, Diana AS, Barry C, Barbarese E, Carson JH. Transport and localization elements in myelin basic protein mRNA. J Cell Biol. 1997;138:1077–1087. doi: 10.1083/jcb.138.5.1077. [DOI] [PMC free article] [PubMed] [Google Scholar]
- Bentzinger CF, Romanino K, Cloëtta D, Lin S, Mascarenhas JB, Oliveri F, Xia J, Casanova E, Costa CF, Brink M, Zorzato F, Hall MN, Rüegg MA. Skeletal muscle-specific ablation of raptor, but not of rictor, causes metabolic changes and results in muscle dystrophy. Cell Metab. 2008;8:411–424. doi: 10.1016/j.cmet.2008.10.002. [DOI] [PubMed] [Google Scholar]
- Brown EJ, Albers MW, Shin TB, Ichikawa K, Keith CT, Lane WS, Schreiber SL. A mammalian protein targeted by G1-arresting rapamycin-receptor complex. Nature. 1994;369:756–758. doi: 10.1038/369756a0. [DOI] [PubMed] [Google Scholar]
- Carson JH, Worboys K, Ainger K, Barbarese E. Translocation of myelin basic protein mRNA in oligodendrocytes requires microtubules and kinesin. Cell Motil Cytoskeleton. 1997;38:318–328. doi: 10.1002/(SICI)1097-0169(1997)38:4<318::AID-CM2>3.3.CO%3B2-C. [DOI] [PubMed] [Google Scholar]
- Chakrabarti P, English T, Shi J, Smas CM, Kandror KV. Mammalian target of rapamycin complex 1 suppresses lipolysis, stimulates lipogenesis, and promotes fat storage. Diabetes. 2010;59:775–781. doi: 10.2337/db09-1602. [DOI] [PMC free article] [PubMed] [Google Scholar]
- Colman DR, Kreibich G, Frey AB, Sabatini DD. Synthesis and incorporation of myelin polypeptides into CNS myelin. J Cell Biol. 1982;95:598–608. doi: 10.1083/jcb.95.2.598. [DOI] [PMC free article] [PubMed] [Google Scholar]
- Cunningham JT, Rodgers JT, Arlow DH, Vazquez F, Mootha VK, Puigserver P. mTOR controls mitochondrial oxidative function through a YY1-PGC-1alpha transcriptional complex. Nature. 2007;450:736–740. doi: 10.1038/nature06322. [DOI] [PubMed] [Google Scholar]
- Flores AI, Narayanan SP, Morse EN, Shick HE, Yin X, Kidd G, Avila RL, Kirschner DA, Macklin WB. Constitutively active Akt induces enhanced myelination in the CNS. J Neurosci. 2008;28:7174–7183. doi: 10.1523/JNEUROSCI.0150-08.2008. [DOI] [PMC free article] [PubMed] [Google Scholar]
- Franklin KB, Paxinos G. The mouse brain in stereotaxic coordinates. Ed 3. New York: Academic; 2008. [Google Scholar]
- Fyffe-Maricich SL, Karlo JC, Landreth GE, Miller RH. The ERK2 mitogen-activated protein kinase regulates the timing of oligodendrocyte differentiation. J Neurosci. 2011;31:843–850. doi: 10.1523/JNEUROSCI.3239-10.2011. [DOI] [PMC free article] [PubMed] [Google Scholar]
- Guardiola-Diaz HM, Ishii A, Bansal R. Erk1/2 MAPK and mTOR signaling sequentially regulates progression through distinct stages of oligodendrocyte differentiation. Glia. 2012;60:476–486. doi: 10.1002/glia.22281. [DOI] [PMC free article] [PubMed] [Google Scholar]
- Hardy RJ, Lazzarini RA, Colman DR, Friedrich VL., Jr Cytoplasmic and nuclear localization of myelin basic proteins reveals heterogeneity among oligodendrocytes. J Neurosci Res. 1996;46:246–257. doi: 10.1002/(SICI)1097-4547(19961015)46:2<246::AID-JNR13>3.0.CO%3B2-0. [DOI] [PubMed] [Google Scholar]
- Ishii A, Fyffe-Maricich SL, Furusho M, Miller RH, Bansal R. ERK1/ERK2 MAPK signaling is required to increase myelin thickness independent of oligodendrocyte differentiation and initiation of myelination. J Neurosci. 2012;32:8855–8864. doi: 10.1523/JNEUROSCI.0137-12.2012. [DOI] [PMC free article] [PubMed] [Google Scholar]
- Julien LA, Carriere A, Moreau J, Roux PP. mTORC1-activated S6K1 phosphorylates Rictor on threonine 1135 and regulates mTORC2 signaling. Mol Cell Biol. 2010;30:908–921. doi: 10.1128/MCB.00601-09. [DOI] [PMC free article] [PubMed] [Google Scholar]
- Klugmann M, Schwab MH, Pühlhofer A, Schneider A, Zimmermann F, Griffiths IR, Nave KA. Assembly of CNS myelin in the absence of proteolipid protein. Neuron. 1997;18:59–70. doi: 10.1016/S0896-6273(01)80046-5. [DOI] [PubMed] [Google Scholar]
- Lappe-Siefke C, Goebbels S, Gravel M, Nicksch E, Lee J, Braun PE, Griffiths IR, Nave KA. Disruption of Cnp1 uncouples oligodendroglial functions in axonal support and myelination. Nat Genet. 2003;33:366–374. doi: 10.1038/ng1095. [DOI] [PubMed] [Google Scholar]
- Molineaux SM, Engh H, de Ferra F, Hudson L, Lazzarini RA. Recombination within the myelin basic protein gene created the dysmyelinating shiverer mouse mutation. Proc Natl Acad Sci U S A. 1986;83:7542–7546. doi: 10.1073/pnas.83.19.7542. [DOI] [PMC free article] [PubMed] [Google Scholar]
- Montag D, Giese KP, Bartsch U, Martini R, Lang Y, Blüthmann H, Karthigasan J, Kirschner DA, Wintergerst ES, Nave KA, Zielasek J, Toyka KV, Lipp HP, Schachner M. Mice deficient for the myelin-associated glycoprotein show subtle abnormalities in myelin. Neuron. 1994;13:229–246. doi: 10.1016/0896-6273(94)90472-3. [DOI] [PubMed] [Google Scholar]
- Narayanan SP, Flores AI, Wang F, Macklin WB. Akt signals through the mammalian target of rapamycin pathway to regulate CNS myelination. J Neurosci. 2009;29:6860–6870. doi: 10.1523/JNEUROSCI.0232-09.2009. [DOI] [PMC free article] [PubMed] [Google Scholar]
- Polak P, Cybulski N, Feige JN, Auwerx J, Rüegg MA, Hall MN. Adipose-specific knockout of raptor results in lean mice with enhanced mitochondrial respiration. Cell Metab. 2008;8:399–410. doi: 10.1016/j.cmet.2008.09.003. [DOI] [PubMed] [Google Scholar]
- Popko B, Puckett C, Lai E, Shine HD, Readhead C, Takahashi N, Hunt SW, 3rd, Sidman RL, Hood L. Myelin deficient mice: expression of myelin basic protein and generation of mice with varying levels of myelin. Cell. 1987;48:713–721. doi: 10.1016/0092-8674(87)90249-2. [DOI] [PubMed] [Google Scholar]
- Reynolds R, Herschkowitz N. Oligodendroglial and astroglial heterogeneity in mouse primary central nervous system culture as demonstrated by differences in GABA and D-aspartate transport and immunocytochemistry. Brain Res. 1987;433:13–25. doi: 10.1016/0165-3806(87)90061-7. [DOI] [PubMed] [Google Scholar]
- Ricoult SJ, Manning BD. The multifaceted role of mTORC1 in the control of lipid metabolism. EMBO Rep. 2013;14:242–251. doi: 10.1038/embor.2013.5. [DOI] [PMC free article] [PubMed] [Google Scholar]
- Riddle A, Luo NL, Manese M, Beardsley DJ, Green L, Rorvik DA, Kelly KA, Barlow CH, Kelly JJ, Hohimer AR, Back SA. Spatial heterogeneity in oligodendrocyte lineage maturation and not cerebral blood flow predicts fetal ovine periventricular white matter injury. J Neurosci. 2006;26:3045–3055. doi: 10.1523/JNEUROSCI.5200-05.2006. [DOI] [PMC free article] [PubMed] [Google Scholar]
- Risson V, Mazelin L, Roceri M, Sanchez H, Moncollin V, Corneloup C, Richard-Bulteau H, Vignaud A, Baas D, Defour A, Freyssenet D, Tanti JF, Le-Marchand-Brustel Y, Ferrier B, Conjard-Duplany A, Romanino K, Bauché S, Hantaï D, Mueller M, Kozma SC, et al. Muscle inactivation of mTOR causes metabolic and dystrophin defects leading to severe myopathy. J Cell Biol. 2009;187:859–874. doi: 10.1083/jcb.200903131. [DOI] [PMC free article] [PubMed] [Google Scholar]
- Roach A, Takahashi N, Pravtcheva D, Ruddle F, Hood L. Chromosomal mapping of mouse myelin basic protein gene and structure and transcription of the partially deleted gene in shiverer mutant mice. Cell. 1985;42:149–155. doi: 10.1016/S0092-8674(85)80110-0. [DOI] [PubMed] [Google Scholar]
- Sarbassov DD, Ali SM, Sengupta S, Sheen JH, Hsu PP, Bagley AF, Markhard AL, Sabatini DM. Prolonged rapamycin treatment inhibits mTORC2 assembly and Akt/PKB. Mol Cell. 2006;22:159–168. doi: 10.1016/j.molcel.2006.03.029. [DOI] [PubMed] [Google Scholar]
- Schratt GM, Nigh EA, Chen WG, Hu L, Greenberg ME. BDNF regulates the translation of a select group of mRNAs by a mammalian target of rapamycin-phosphatidylinositol 3-kinase-dependent pathway during neuronal development. J Neurosci. 2004;24:7366–7377. doi: 10.1523/JNEUROSCI.1739-04.2004. [DOI] [PMC free article] [PubMed] [Google Scholar]
- Sengupta S, Peterson TR, Laplante M, Oh S, Sabatini DM. mTORC1 controls fasting-induced ketogenesis and its modulation by ageing. Nature. 2010;468:1100–1104. doi: 10.1038/nature09584. [DOI] [PubMed] [Google Scholar]
- Sherman DL, Krols M, Wu LM, Grove M, Nave KA, Gangloff YG, Brophy PJ. Arrest of myelination and reduced axon growth when Schwann cells lack mTOR. J Neurosci. 2012;32:1817–1825. doi: 10.1523/JNEUROSCI.4814-11.2012. [DOI] [PMC free article] [PubMed] [Google Scholar]
- Shine HD, Readhead C, Popko B, Hood L, Sidman RL. Morphometric analysis of normal, mutant, and transgenic CNS: correlation of myelin basic protein expression to myelinogenesis. J Neurochem. 1992;58:342–349. doi: 10.1111/j.1471-4159.1992.tb09316.x. [DOI] [PubMed] [Google Scholar]
- Shiota C, Woo JT, Lindner J, Shelton KD, Magnuson MA. Multiallelic disruption of the rictor gene in mice reveals that mTOR complex 2 is essential for fetal growth and viability. Dev Cell. 2006;11:583–589. doi: 10.1016/j.devcel.2006.08.013. [DOI] [PubMed] [Google Scholar]
- Sperber BR, Boyle-Walsh EA, Engleka MJ, Gadue P, Peterson AC, Stein PL, Scherer SS, McMorris FA. A unique role for Fyn in CNS myelination. J Neurosci. 2001;21:2039–2047. doi: 10.1523/JNEUROSCI.21-06-02039.2001. [DOI] [PMC free article] [PubMed] [Google Scholar]
- Sypecka J, Sarnowska A. Heterogeneity of local tissue microenvironment influences differentiation of oligodendroglial progenitors. Folia Neuropathol. 2013;51:103–110. doi: 10.5114/fn.2013.35952. [DOI] [PubMed] [Google Scholar]
- Takahashi N, Roach A, Teplow DB, Prusiner SB, Hood L. Cloning and characterization of the myelin basic protein gene from mouse: one gene can encode both 14 kd and 18.5 kd MBPs by alternate use of exons. Cell. 1985;42:139–148. doi: 10.1016/S0092-8674(85)80109-4. [DOI] [PubMed] [Google Scholar]
- Takei N, Inamura N, Kawamura M, Namba H, Hara K, Yonezawa K, Nawa H. Brain-derived neurotrophic factor induces mammalian target of rapamycin-dependent local activation of translation machinery and protein synthesis in neuronal dendrites. J Neurosci. 2004;24:9760–9769. doi: 10.1523/JNEUROSCI.1427-04.2004. [DOI] [PMC free article] [PubMed] [Google Scholar]
- Thoreen CC, Sabatini DM. Rapamycin inhibits mTORC1, but not completely. Autophagy. 2009;5:725–726. doi: 10.4161/auto.5.5.8504. [DOI] [PubMed] [Google Scholar]
- Trapp BD, Nishiyama A, Cheng D, Macklin W. Differentiation and death of premyelinating oligodendrocytes in developing rodent brain. J Cell Biol. 1997;137:459–468. doi: 10.1083/jcb.137.2.459. [DOI] [PMC free article] [PubMed] [Google Scholar]
- Tyler WA, Gangoli N, Gokina P, Kim HA, Covey M, Levison SW, Wood TL. Activation of the mammalian target of rapamycin (mTOR) is essential for oligodendrocyte differentiation. J Neurosci. 2009;29:6367–6378. doi: 10.1523/JNEUROSCI.0234-09.2009. [DOI] [PMC free article] [PubMed] [Google Scholar]
- Tyler WA, Jain MR, Cifelli SE, Li Q, Ku L, Feng Y, Li H, Wood TL. Proteomic identification of novel targets regulated by the mammalian target of rapamycin pathway during oligodendrocyte differentiation. Glia. 2011;59:1754–1769. doi: 10.1002/glia.21221. [DOI] [PMC free article] [PubMed] [Google Scholar]
- Vickers CA, Wyllie DJ. Late-phase, protein synthesis-dependent long-term potentiation in hippocampal CA1 pyramidal neurones with destabilized microtubule networks. Br J Pharmacol. 2007;151:1071–1077. doi: 10.1038/sj.bjp.0707314. [DOI] [PMC free article] [PubMed] [Google Scholar]
- Viganò F, Möbius W, Götz M, Dimou L. Transplantation reveals regional differences in oligodendrocyte differentiation in the adult brain. Nat Neurosci. 2013;16:1370–1372. doi: 10.1038/nn.3503. [DOI] [PubMed] [Google Scholar]
- Wahl SE, McLane LE, Bercury KK, Macklin WB, Wood TL. Mammalian target of rapamycin promotes oligodendrocyte differentiation, initiation and extent of CNS myelination. J Neurosci. 2014;34:4453–4465. doi: 10.1523/JNEUROSCI.4311-13.2014. [DOI] [PMC free article] [PubMed] [Google Scholar]
- Yamamura T, Konola JT, Wekerle H, Lees MB. Monoclonal antibodies against myelin proteolipid protein: identification and characterization of two major determinants. J Neurochem. 1991;57:1671–1680. doi: 10.1111/j.1471-4159.1991.tb06367.x. [DOI] [PubMed] [Google Scholar]
- Yecies JL, Zhang HH, Menon S, Liu S, Yecies D, Lipovsky AI, Gorgun C, Kwiatkowski DJ, Hotamisligil GS, Lee CH, Manning BD. Akt stimulates hepatic SREBP1c and lipogenesis through parallel mTORC1-dependent and independent pathways. Cell Metab. 2011;14:21–32. doi: 10.1016/j.cmet.2011.06.002. [DOI] [PMC free article] [PubMed] [Google Scholar]