Abstract
We designed and constructed an in vivo dosimetry system using plastic scintillation detectors (PSDs) to monitor dose to the rectal wall in patients undergoing intensity-modulated radiation therapy for prostate cancer. Five patients were enrolled in an Institutional Review Board–approved protocol for twice weekly in vivo dose monitoring with our system, resulting in a total of 142 in vivo dose measurements. PSDs were attached to the surface of endorectal balloons used for prostate immobilization to place the PSDs in contact with the rectal wall. Absorbed dose was measured in real time and the total measured dose was compared with the dose calculated by the treatment planning system on the daily CT image dataset. The mean difference between measured and calculated doses for the entire patient population was −0.4% (standard deviation 2.8%). The mean difference between daily measured and calculated doses for each patient ranged from −3.3% to 3.3% (standard deviation ranged from 5.6% to 7.1% for 4 patients and was 14.0% for the last, for whom optimal positioning of the detector was difficult owing to the patient’s large size). Patients tolerated the detectors well and the treatment workflow was not compromised. Overall, PSDs performed well as in vivo dosimeters, providing excellent accuracy, real-time measurement, and reusability.
I. Introduction
With the increasing complexity of radiation treatments, a commensurate increase in quality assurance procedures is important to ensure the safe and effective delivery of radiation to patients. An important aspect of a comprehensive quality assurance program is in vivo dosimetry (York et al 2005, Edwards and Mountford 2009, Mijnheer et al 2013, Tanderup et al 2013). Historically, in vivo dosimetry has been limited to skin dose measurements because only a few avenues have been available for internal in vivo dosimetry.
A fully developed internal in vivo dosimetry system would provide multiple benefits, including a direct verification of treatment and the ability to detect potential treatment variances immediately (e.g., incorrect plan delivery, incorrect monitor unit settings) and halt delivery to minimize deleterious effects. Internal in vivo dosimetry could also detect systematic errors over the course of treatment if, for example, the patient alignment used for treatment differed from the alignment used in simulation. Finally, in vivo dosimetry could provide measured data to supplement calculations for toxicity studies.
Relatively few detectors have been previously employed for in vivo dosimetry. Thermoluminescent dosimeters (TLDs) have been used because of their small size and tissue equivalence (Hsi et al 2013). However, thermoluminescent dosimeters can provide only a cumulative dose and require a complicated readout process with expensive specialized equipment (DeWerd et al 2009). As a result, the delivered dose is not known instantaneously, but rather with some delay after the treatment. Metal oxide semiconductor field effect transistors (MOSFETs) have also been used for internal in vivo dosimetry (Den et al 2012). They are capable of real-time measurement and are very small, providing excellent spatial resolution and perturbing the beam minimally. Unfortunately, MOSFETS have short lifespans and must be replaced relatively often. Furthermore, they require a number of corrections, are expensive, and possess poorer intrinsic precision than other detectors (Jornet et al 2004).
The plastic scintillation detector (PSD) is a good candidate for in vivo measurements. PSDs are extremely small, water-equivalent (eliminating the need for dose-to-water corrections and making them non-beam-perturbing detectors), and independent of angular, energy, and dose-rate effects (Beddar et al 1992a, Beddar et al 1992b). Furthermore, PSDs are capable of providing real-time data because they have a response time on the order of nanoseconds. Finally, PSDs are resistant to radiation damage and can be reused (Beddar et al 2006).
Substantial research has been directed toward developing PSDs for in vivo use. Archambault et al (2010) demonstrated the feasibility of using PSDs for real-time measurements, with better than 1% accuracy. Subsequently, Klein et al (2012) used PSDs to make real-time measurements of volumetric modulated arc therapy and intensity-modulated radiation therapy (IMRT) treatment plans delivered to an IMRT phantom and an anthropomorphic pelvis phantom. The difference between the measured dose and the expected dose was less than 1%.
We have built on these results to develop a fully functional in vivo dosimetry system using PSDs for use in patients undergoing treatment for prostate cancer. The purpose of this paper is to describe the real-time in vivo dosimetry system designed and constructed in our laboratory. Additionally, we will present the results generated by using this system to perform in vivo measurements of dose to the rectal wall in a small cohort of patients treated for prostate cancer with IMRT. Finally, we will compare the measured results with the treatment planning system (TPS)-generated calculations to demonstrate the accuracy of this system.
II. Methods and Materials
II.A Detector Design
Two millimeters of BCF-60 scintillating fiber 1 millimeter in diameter (Saint-Gobain Crystals, Hiram, OH) was optically coupled to Eksa GH-4001-P plastic optical fiber (Mitsubishi Rayon Corporation, Japan) with cyanoacrylate. BCF-60 was chosen for its high signal and spectral separation from signal-contaminating Cerenkov radiation (Beddar et al 1992c). The plastic optical fiber was chosen for its water equivalency and robustness compared with silica or glass fibers. Approximately 25 m of optical fiber extended between the scintillating fiber and an ST optical connector that interfaced with a panel in a black box containing a Luca S charge-coupled device (CCD) camera (Andor Technology, Belfast, Northern Ireland). This length of optical fiber allowed the CCD to be outside the treatment vault in the treatment console area. A dichroic mirror (model NT47-950; Edmund Optics Inc., Barrington, NJ) split the light delivered by the optical connector into 2 distinct spectra for decomposition via the chromatic removal technique (Fontbonne et al 2002, Frelin et al 2005, Archambault et al 2006).
The Luca S CCD camera was chosen specifically for its suitability for performing real-time measurement. The Luca S is extremely fast, and when operating in frame transfer mode, has a dead time less than 300 μs. Thus negligible signal (<0.1%) is lost to dead time. It is also extremely sensitive, capable of single photon detection. The detector elements are 10 × 10 μm2 each, and there are a total of 658×496 pixels for an imaging area of 6.58×4.96 mm. The average readout noise per pixel in frame transfer is 15 electrons. The signal (and thus the signal to noise ratio) depends on many factors such as the volume of scintillating fiber, the efficiency of the transmission of scintillation light, and the focusing of the camera. However, scintillating fibers are highly sensitive and when used in conjunction with the Luca S CCD high SNRs are easily achievable as a result (Archambault 2010).
Three ceramic fiducials were attached to the detector as surrogates to aid the visualization of the detectors on computed tomographic (CT) images. One fiducial was attached to the distal tip of the detector and the other 2 were attached on either side of the fiber proximal to the sensitive volume of the detector (Figure 1). A carbon spacer of known dimensions was used to separate the scintillator from the distal fiducial. Carbon was chosen because of its similarity to tissue.
Figure 1.
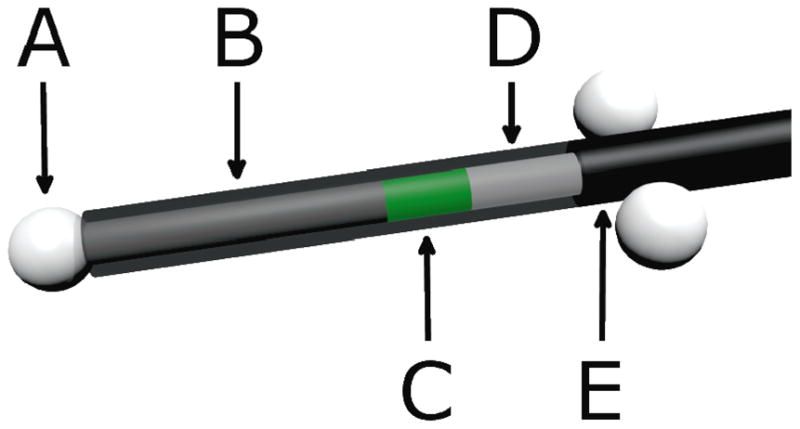
Scale model of an in vivo plastic scintillation detector. A) Ceramic fiducials of 2.3-mm diameter were used for visualization on daily computed tomographic images. B) A 7-mm-long carbon spacer provided separation between the scintillator and the distal fiducial to avoid potential dose shadows. C) Two millimeters of BCF-60 scintillating fiber was used. D) Plastic optical fiber transmitted emitted light to a photodetector. E) A polyethylene jacket prevented the admission of contaminating external light. The jacket covered the entire assembly, but is partially transparent here to reveal the inner components of the plastic scintillation detector.
All detectors were calibrated in a cobalt 60 beam using the chromatic removal technique for Cerenkov correction using 3 dose conditions (Archambault et al 2012).
II.B Protocol Design
This research was conducted in accordance with an Institutional Review Board–approved protocol. The protocol stipulated that patients must have been diagnosed with prostate cancer (either with an intact prostate or after prostatectomy) to be eligible. Furthermore, only patients undergoing radiation therapy with the concurrent use of an endorectal balloon for prostate immobilization were eligible. No radiation modality was specified. However, we enrolled only patients undergoing IMRT for consistency and relevance, considering the widespread use of IMRT.
The data presented here were collected from the first 5 patients enrolled in the protocol. The patients ranged in age from 62 to 70 years and were diagnosed with T1c, T2b, or T3c prostate cancer with no nodal or metastatic involvement. Four patients were treated with a course of radiation to the prostate, seminal vesicles, and lymph nodes collectively followed by a boost to the prostate alone. The fifth patient was treated with radiation only to the prostate. In vivo measurements were performed twice weekly for the duration of each patient’s course of treatment, barring extraneous circumstances (e.g., CT scanner not functional). Approximately 14 treatments were monitored with 2 in vivo PSDs for each patient, resulting in a total of 142 in vivo measurements.
Each in vivo fraction proceeded as follows. Prior to the patient’s arrival, the system was prepared for use by connecting the CCD camera to a laptop for data acquisition and cooling the CCD to an operating temperature of −20°C via a built-in peltier element. A patient-specific PSD duplex (i.e., 2 PSDs attached to one another) was taken into the treatment vault on a spool. The distal end of the detector duplex was mounted to an endorectal balloon. The spool was unrolled and the proximal ends of the PSD duplex connected to the CCD camera via ST connectors. Inside the vault, the treating therapists placed a latex sheath around the balloon and detectors. The sheath served to isolate the detector from direct contact with the rectal wall to facilitate reuse and to ensure that if a fiducial detached from the detector it would not remain in the patient.
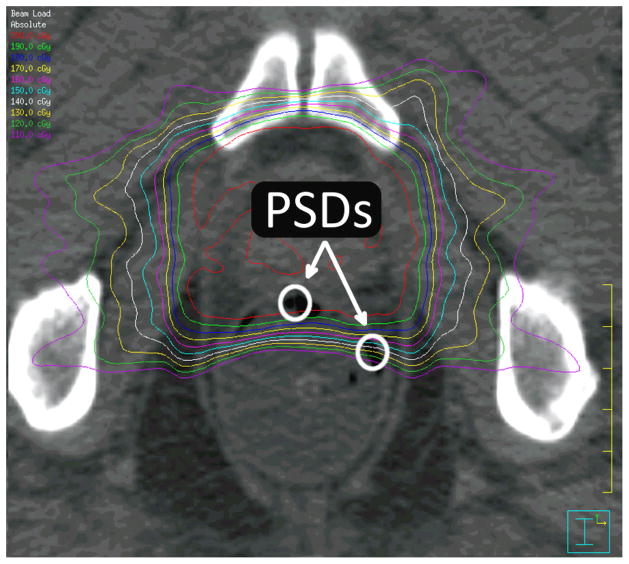
After the patient was positioned on the couch, the rectal balloon was inserted by the therapist, and the patient was aligned using external marks. During this alignment a series of background images was acquired by the CCD camera. The treatment couch was then rotated 180 degrees to obtain a CT scan using a CT-on-rails linear accelerator (Varian Medical System, Palo Alto, CA; GE Healthcare, United Kingdom), with a slice thickness of 2.5 mm. This slice thickness is standard for CT-on-rails measurements obtained from patients with prostate cancer at our institution. The CT scan allowed accurate localization of the detector within the patient, as described in section II.C. An example of a CT slice containing PSDs in vivo is displayed in Figure 2.
Figure 2.
Plastic scintillation detectors (PSDs) in vivo. The active volume of 2 PSDs is contained in this axial slice. Isodose lines are also displayed, starting at 200 cGy with intervals of 10 cGy for each successive isodose line.
After the CT scan, the patient was rotated back to the original position and then shifted using soft tissue alignment on the basis of the CT images. Megavoltage portal images were taken to confirm the isocenter position prior to turning the beam on, for consistency with non-protocol days on which the patients did not undergo a CT scan.
After the final port film was acquired, real-time data acquisition was initiated. The course of radiation was delivered normally, and after delivery of the final beam, the data acquisition was halted. The entire workflow is graphically summarized in Figure 3. The balloon was then removed by therapists, and the latex sheath was removed and the detectors were detached from the balloon. The balloon was then discarded and the PSD duplex was cleaned with medical-grade sanitary wipes.
Figure 3.
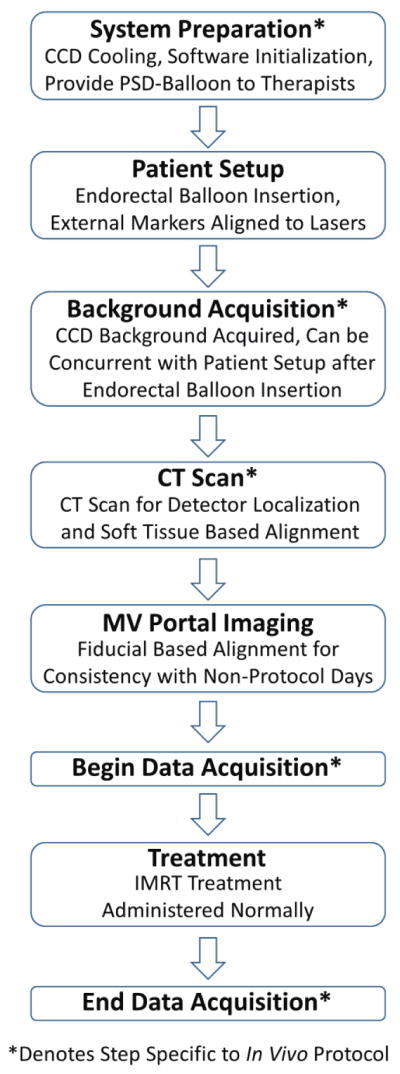
Workflow diagram of the in vivo protocol workflow for a treatment fraction. Steps that would not occur during routine prostate IMRT treatment are denoted with asterisks. Most of the in vivo specific steps can occur in parallel with the normal workflow such that it need not be altered. For example, system preparation can occur before the patient arrives while another patient is treated. The background acquisition can occur while the patient is aligned to external markers as long as the rectal balloon with detectors has already been inserted. The exception is the CT scan. However, some patient are aligned with soft tissue each fraction, rather than using MV portal images. For these patients the CT scan would be a routine part of treatment, and the in vivo workflow would not disrupt or alter the treatment workflow in any way.
Finally, each day that patient measurements were obtained, the PSDs were irradiated in a phantom using a simple fixed geometry to confirm that they were measuring dose as expected. This simple validation served to check for any damage or any change in response. The detectors were centered in a 10 × 10 cm2 field under 1.5 cm of tissue-equivalent bolus with 5 cm of acrylic back-scattering media and irradiated with 200 cGy. Any deviations >2% were considered indicative of damage or loss of functionality. In the rare case that such a deviation was observed, the detector was recalibrated.
II.C Imaging Methodology
To calculate the expected dose to the detector, we needed to accurately identify the location of the detector on the CT image dataset. However, because the PSD is a water-equivalent detector, this cannot be done directly (i.e., the PSD is indistinguishable from tissue). This was the motivation to use fiducials attached to the detector as surrogates for localizing the PSD.
The fiducials attached to the detector were used to contour a region of interest (ROI) corresponding to the detector’s active volume using a combination of manual input and scripting in the Pinnacle TPS (Philips Healthcare, Andover, MA), although the method is generalizable to any TPS with scripting capability. We assumed a rigid geometry between the 3 fiducials and the scintillating fiber. Operating under this assumption, it was straightforward to calculate the location of the scintillating fiber by providing the location of each fiducial to a script as a point of interest. A 1-mm-diameter ROI centered on the scintillating fiber was contoured on the slice containing the largest portion of the fiber, because the fiber was not guaranteed to reside solely on one slice. If consecutive slices each contained more than a third of the scintillating fiber, contouring was performed on both slices.
To validate this method and its assumptions, we constructed detectors with CT-opaque metal wire substituted for scintillators, and we attached the detectors to endorectal balloons and imaged them in an anthropomorphic prostate phantom. The above method was used to automatically contour the wire and the resultant ROI compared with the position of the center of the wire, providing a quantitative measure of the accuracy of this method. This experiment was repeated 10 times with independent setups, using 2 detectors each time.
II.D Data Acquisition
Data was acquired during each monitored treatment starting immediately after the final port film and continuing through the entire treatment. The data acquisition rate was set to 10 seconds (0.1 Hz)—that is, the CCD sequentially acquired 10-second integrations of the light output of the scintillator. Ten seconds was ideal because the longer integration time improved the signal-to-noise ratio of the measurements primarily by increasing the signal per image (the dominant noise was the readout noise of the CCD image, which was independent of integration times) while still allowing the temporal resolution necessary to distinguish between individual beams, the smallest portion of treatment for which dose information is easily retrievable from the Pinnacle TPS.
A temperature dependence correction factor was also applied to each detector. The correction factor was determined by performing repeated irradiations at varying temperatures, as described in Wootton et al (2012), and assuming an idealized body temperature of 37°C for all patients. Small variations from 37°C would have a negligible effect on the final measured dose.
To quantify the agreement between planned dose and measured dose, the location of each detector was first contoured on the daily CT image dataset. Then the beam parameters were imported from the patient’s treatment plan and used to calculate the dose distribution on the daily CT image dataset. Because the treatment couch rotated between the CT scanner (imaging) and the linac (treatment), the setup in the daily CT image dataset was identical to the setup used during treatment, with the exception of any patient movement occurring after the CT scan. The isocenter in the CT image was confirmed to be correct by comparing digitally reconstructed radiographs with daily port films. The expected dose for each detector was simply the mean dose in the corresponding ROI.
II.E Data Analysis
For each fraction, the percent difference between the measured and expected dose was calculated (relative to the calculated dose). For each patient, a mean difference, a standard deviation, and a 95% confidence interval of the mean were computed. The confidence interval was computed using the t-distribution with degrees of freedom equal to 1 less than the number of measurements. Finally, the mean of the mean differences was computed over all 5 patients, as well as a standard deviation and a 95% confidence interval. The confidence interval was again computed using a t-distribution, this time with 4 degrees of freedom (1 less than the number of patients).
Only 3 measurements were excluded from this analysis, owing to physical damage to the termination of the optical fiber at the CCD interface, resulting in severely compromised light transmission. The damage was revealed by visual inspection prompted by detectors failing the post-treatment validation. Aside from these 3 measurements, all 139 remaining data points were included in the analysis.
III. Results
III.A Imaging Methodology
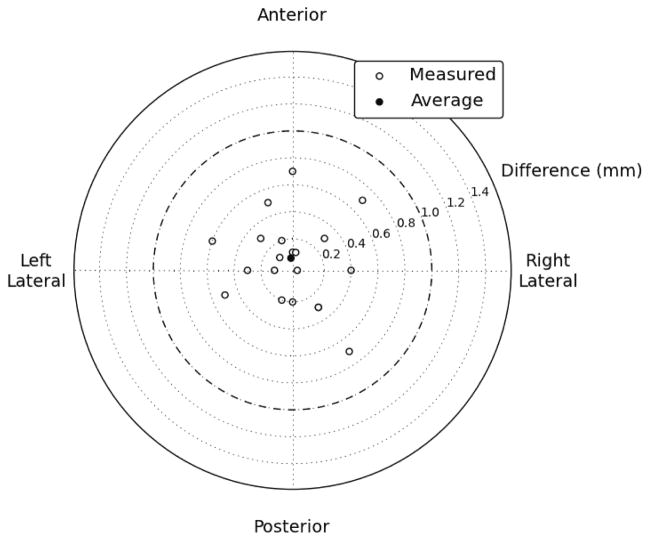
The mean difference between the center of the contours and the center of the wires in the axial plane in the phantom study was 0.1 mm in the anterior direction. The standard deviation of the differences was 0.4 mm, and 100% of the contours were within 0.7 mm of the wire. 65% of the contours were on the correct axial slice and 35% were one slice off (Figure 4).
Figure 4.
Axial discrepancies between script-contoured locations and actual locations. All 20 contoured locations were within 0.7 mm of their actual location, and the mean difference was 0.1 mm in the anterior direction.
III.B In Vivo Results
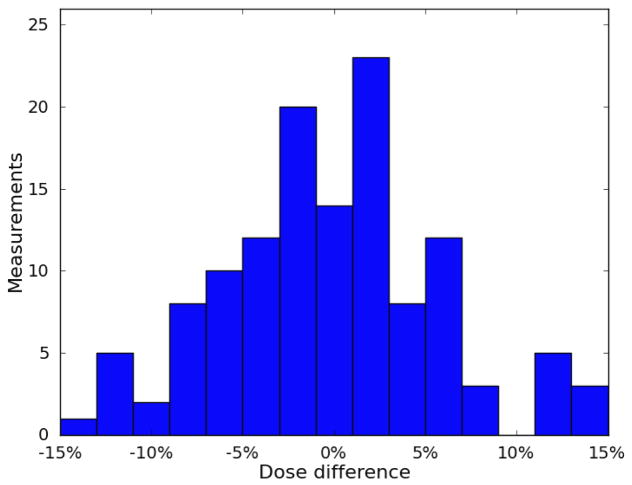
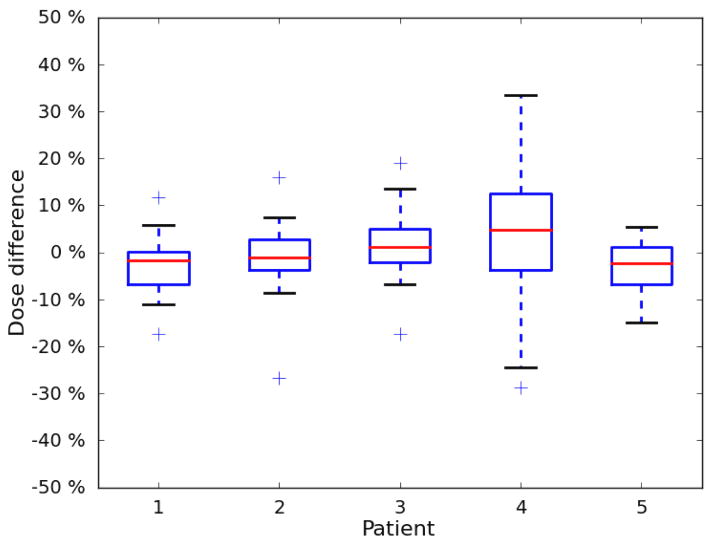
The results for each patient are listed in Table 1. The mean difference between measured and calculated dose ranged between −3.3% and 3.3%. For 4 of the 5 patients, the standard deviation was between 5.6% and 7.1%. The standard deviation for the fifth patient was 14.0%. Eighty-two percent of the measurements agreed with the Pinnacle TPS calculated dose to within 10%. The percent differences are plotted in a histogram shown in Figure 5, and the patient-specific results are plotted in a boxplot in Figure 6.
Table 1.
In vivo dosimetry results for each patient. The 95% confidence interval of the mean was computed using a t-distribution with (measurements − 1) degrees of freedom. Validation is the mean discrepancy between the known and measured dose delivered to the plastic scintillation detector during the detector’s performance validation after patient treatments.
| Patient | No. of measurements | Mean dose difference | 95% confidence interval | Standard deviation | Validation |
|---|---|---|---|---|---|
| 1 | 30 | −2.6% | −4.7%, −0.5% | 5.6% | −0.1% |
| 2 | 28 | −1.1% | −3.9%, +1.6% | 7.1% | 0.5% |
| 3 | 30 | 1.5% | −1.0%, 4.0% | 6.7% | 0.3% |
| 4 | 28 | 3.3% | −2.1%, 8.7% | 14.0% | 0.5% |
| 5 | 21 | −3.3% | −5.9%, −0.6% | 5.8% | −0.5% |
Figure 5.
Distribution of differences between measured dose and calculated dose. The distribution was centered near 0 and was mostly contained within ±10%.
Figure 6.
Boxplot of patient-specific results. The mean difference between measured dose and calculated dose was near 0 for all 5 patients. Patients 1–3 and 5 exhibited very similar distributions, and patient 4 exhibited a relatively larger spread.
When the patient-specific results were analyzed, the overall mean difference between measured dose and calculated dose was −0.4%. The standard deviation was 2.8% (standard deviation of the 5 mean differences). The 95% confidence interval of the mean extended from −3.9% to 3.0%.
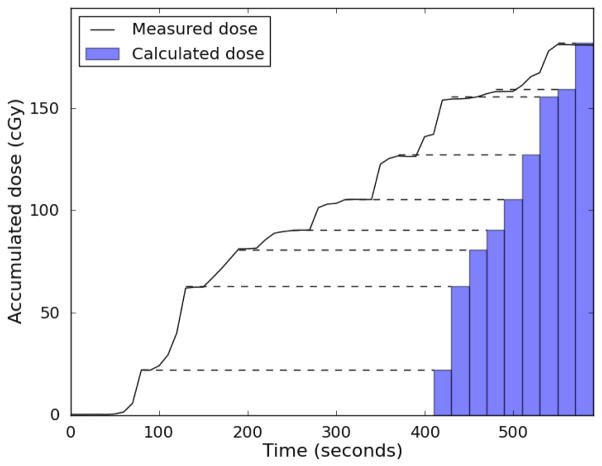
The temporal resolution of the system was consistently sufficient to identify dose from individual beams during treatment for comparison with the dose for each beam calculated by the Pinnacle TPS. This is demonstrated in Figure 7.
Figure 7.
PSD measured real-time dose. The accumulated dose measured by one of the plastic scintillation detector is plotted in black. The treatment planning system allows the cumulative dose-per-beam to be extracted (represented by blue bars at right), but not the cumulative dose as a function of time. Dashed lines between the measured dose and the bars are meant to facilitate comparison. Between beams when there is no radiation, the measured dose profile is flat. If the detector is measuring dose accurately, these plateaus in the dose profile should agree with the cumulative beam-by-beam dose. As can be seen, these plateaus agree excellently with the cumulative doses calculated by the treatment planning system, indicating good beam-by-beam agreement between the plastic scintillation detector and treatment planning system.
Each patient was questioned regarding the use of the probes, and 4 of the 5 patients reported not noticing any difference between the balloon with and without the detectors. The remaining patient reported that he noticed a difference but that it was tolerable. All patients tolerated the PSD attached to the balloon through the entirety of their treatment.
IV. Discussion
Our results demonstrate that PSDs can be successfully used to measure rectal wall dose in real time and in vivo during prostate IMRT. We have developed a simple, effective visualization methodology for locating these water-equivalent detectors on CT images and integrated the use of these detectors into normal clinical workflow.
The imaging methodology performed exceptionally well in the axial plane when tested in an anthropomorphic phantom. The detector active volume was identified with submillimeter accuracy and precision. However, the methodology exhibited reduced accuracy in the superior-inferior (SI) direction. This can be attributed to inherent limitations resulting from slice thickness; the location of the fiducials cannot be specified with precision better than the magnitude of the slice thickness. Smaller slices could be used to improve the localization of the detector in the SI direction. However, SI accuracy was deemed far less important than axial accuracy for this study because the dose gradient posterior to the prostate was steep in the anterior-posterior direction in the axial plane and essentially flat in the SI direction. Thus, the results presented were sufficient for our study.
This study is subject to statistical limitations. Ideally more patients should have been included in the study. However, owing to the large number of fractions monitored for each patient with in vivo dosimetry, this was not possible without greatly extending the time required to complete this study. Because of the limited number of patients, the results generated from the 5 patient mean differences theoretically may not be representative of the PSD system’s performance in the general population. However, few variables might affect how a detector performs for a given patient, given that this is an entirely physical process; that is, radiation transport is not affected by biological factors. A possible variable would be the magnitude of patient-specific intrafractional movement. The system would exhibit a loss of precision in patients prone to extreme intrafractional movement. Assuming this movement was not significant in any given direction, the accuracy should not be compromised. Given the highly similar performance of the system for 4 out of the 5 patients (Figure 6), we believe that our results are representative of the performance that could be expected from this type of detector system. The reasons for the erratic performance of the detector for the remaining patient are addressed below.
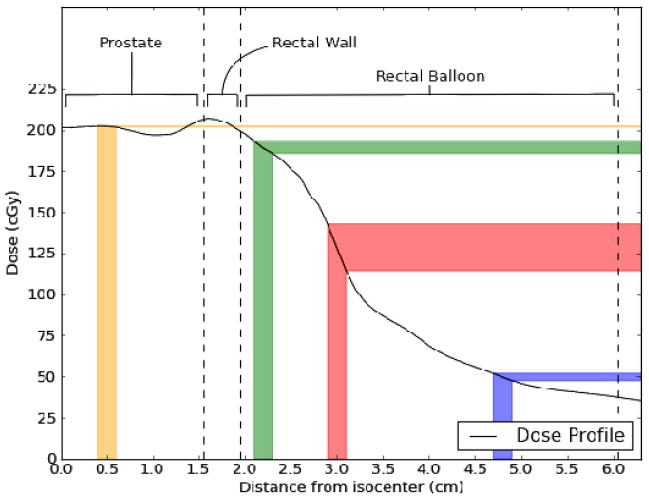
Our data indicate that most measurements that deviated largely from the calculated dose occurred when the PSDs were located either laterally or posteriorly in the rectum. This occurred as a result of twisting of the endorectal balloon as the balloon was inserted into the rectum. The reasons for the larger deviations are twofold. The first is the magnitude of the dose gradient. The dose gradient is relatively shallow in the anterior rectum owing to the need for complete coverage of the prostate, which is immediately adjacent to the rectum. However, because the rectum is an organ at risk, the dose decreases rapidly away from the prostate, resulting in a far steeper dose gradient in the anterior-posterior direction within the rectal balloon and at the lateral rectal walls (refer to Figure 2). This means that intrafractional motion will have a disproportionately large effect on the dose measured by laterally positioned detectors. The second reason is that the reference dose (the Pinnacle calculated dose) is lower for lateral and posterior measurements than for other measurements, inflating the percent difference (for example, an absolute discrepancy of 10 cGy is 5% relative to 200 cGy and 10% relative to 100 cGy). The combination of these 2 effects is illustrated in Figure 8. The position of the detector depends on the insertion of the balloon. Occasionally the balloon twisted during insertion. After insertion, it was not possible to adjust it without removing it because of the latex sheath. Removing the balloon and reinserting it to achieve better detector positioning was not considered worthwhile at the cost of causing the patient additional discomfort and extending the overall treatment time.
Figure 8.
Dose profile taken from patient data starting at the isocenter in the prostate and extending to the posterior rectal wall. Different regions of anatomy are labeled and demarcated by dashed lines. Uncertainties in the expected dose to be measured by a hypothetical detector with a positional uncertainty of ±1 mm are displayed as colored bars. At the anterior rectal wall (green), the positional uncertainty translates to an uncertainty in expected dose of ±2%. A laterally positioned detector (red) exhibits an uncertainty of ±11% owing to the steep gradient and lower absolute dose. A detector positioned posteriorly (blue), although in a shallow gradient, exhibits an expected dose uncertainty of ±4% owing to the very low absolute dose. Finally, a hypothetical detector positioned in the urethra (yellow) is completely unaffected by positional uncertainty (expected dose uncertainty of ±0.1%).
As mentioned previously, the system produced results characteristically different for one of the patients. There are several identifiable reasons for this, all of which relate to the patient’s size. This patient was obese, whereas the other 4 patients had average weight. This decreased the image quality of the CTs acquired for this patient (we measured the signal-to-noise ratio of the patient’s CT images to be roughly half that of the other patients), making detector localization more difficult. Additionally, because of the patient’s large size, the patient was truncated from the CT field of view. As a result, some tissue was missing from the image and artifacts were present where tissue was cut off (Figure 9). Finally, the balloon was twisted out of position in this patient far more often than in other patients. This subjected the PSD system to the gradient-related difficulties discussed in the previous paragraph with higher regularity, increasing the overall variability of the agreement between measured dose and calculated dose. We suspect that the patient’s size made correct insertion of the balloon more difficult or caused increased twisting of the balloon during insertion. We also at first considered increased intrafractional movement in this patient as a possibility, but literature indicates that the magnitude of intrafractional movement is unchanged or possibly decreased in obese patients relative to the general population (Butler et al 2012).
Figure 9.
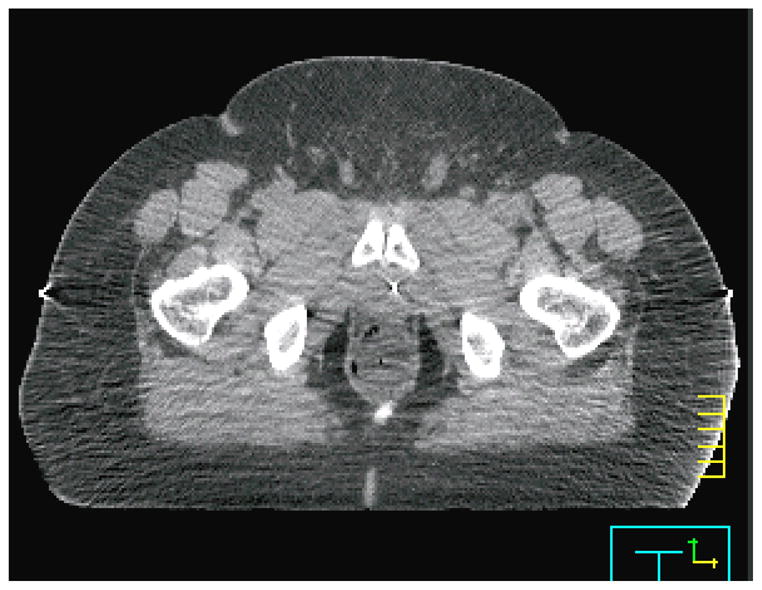
A computed tomographic scan from a patient for whom the plastic scintillation detector system exhibited poor precision. The image quality was compromised and patient tissue was truncated from the computed tomography field of view (at right). However, the primary source of the lost precision was the difficulty of placing the balloon correctly in this patient.
An important question is the feasibility of implementing this system in a clinical setting. The system was integrated easily into the treatment workflow. Therapists did not have to alter their procedure at all from that used for patients receiving CT-on-rails guided IMRT, save for stepping over the optical fiber and sheathing the balloon with latex. This suggests that clinical implementation is possible. Another important consideration is the feasibility of using this system without a CT-on-rails, because most institutions do not have CT-on-rail units. Two possibilities exist: either cone beam CT could be used or perhaps MV/kV orthogonal imaging could be used. For cone beam CT, it would be straightforward to adopt the methodology described here. Using portal imaging would be more difficult, but the success of Hsi et al (2013) using portal imaging to locate thermoluminescent detectors for in vivo dosimetry suggests that it is possible. More research along this avenue is warranted.
V. Conclusion
We have successfully used PSDs for in vivo dosimetry of the rectal wall of patients with prostate cancer undergoing IMRT, with good results. The accuracy (mean difference between measured and expected dose) was excellent, at −0.4%. The precision of the system was good for in vivo dosimetry, at 5.6% to 7.1% for 4 of the 5 patients. We have also presented a simple but effective method for localizing water-equivalent detectors in vivo. Overall, the PSD has proven to be an excellent detector for in vivo use, with promising future applications (e.g., in vivo dosimetry of stereotactic radiosurgery, volumetric modulated arc therapy).
Acknowledgments
LSW would like to thank the American Legion Auxiliary for their support through the American Legion Auxiliary Fellowship in Cancer Research. Additionally, the authors thank Radiadyne LLC for providing the rectal balloons for use in this study. This work was supported in part by the National Cancer Institute through an R01 grant (CA120198-01A2).
VII. References
- Archambault L, Beddar AS, Gingras L, Roy R, Beaulieu L. Measurement accuracy and Cerenkov removal for high performance, high spatial resolution scintillation dosimetry. Med Phys. 2006;33:128–35. doi: 10.1118/1.2138010. [DOI] [PubMed] [Google Scholar]
- Archambault L, Briere TM, Ponisch F, Beaulieu L, Kuban D, Lee AK, Beddar AS. Toward a real-time in vivo dosimetry system using plastic scintillation detectors. Int J Radiat Oncol Biol Phys. 2010;78:280–87. doi: 10.1016/j.ijrobp.2009.11.025. [DOI] [PMC free article] [PubMed] [Google Scholar]
- Archambault L, Therriault-Proulx F, Beddar S, Beaulieu L. A mathematical formalism for hyperspectral, multipoint plastic scintillation detectors. Phys Med Biol. 2012;57:7133–45. doi: 10.1088/0031-9155/57/21/7133. [DOI] [PubMed] [Google Scholar]
- Beddar AS, Mackie TR, Attix FH. Water-equivalent plastic scintillation detectors for high-energy beam dosimetry: I. Physical characteristics and theoretical considerations. Phys Med Biol. 1992a;37:1883–900. doi: 10.1088/0031-9155/37/10/006. [DOI] [PubMed] [Google Scholar]
- Beddar AS, Mackie TR, Attix FH. Water-equivalent plastic scintillation detector for high energy beam dosimetry: II. Properties and measurements. Phys Med Biol. 1992b;37:1901–13. doi: 10.1088/0031-9155/37/10/007. [DOI] [PubMed] [Google Scholar]
- Beddar AS, Mackie TR, Attix FH. Cerenkov light generated in optical fibres and other light pipes irradiated by electron beams. Phys Med Biol. 1992c;37:925–35. [Google Scholar]
- Beddar AS. Water equivalent plastic scintillation detectors in radiation therapy. Radiation Protection Dosimetry. 2006;120:1–6. doi: 10.1093/rpd/nci694. [DOI] [PubMed] [Google Scholar]
- Butler WM, Morris MN, Merric GS, Kurko BS, Murray BC. Effect of body mass index on intrafraction prostate displacement monitored by real-time electromagnetic tracking. Int J Radiat Oncol Biol Phys. 2012;84:e173–79. doi: 10.1016/j.ijrobp.2011.08.044. [DOI] [PubMed] [Google Scholar]
- Den RB, Nowak K, Buzurovic I, Cao J, Harrison AS, Yaacov LR, Dicker AP, Showalter TN. Implanted dosimeters identify radiation overdoses during IMRT for prostate cancer. Int J Radiat Oncol Biol Phys. 2012;83:e371–76. doi: 10.1016/j.ijrobp.2011.12.094. [DOI] [PubMed] [Google Scholar]
- DeWerd LA, Bartol LJ, Davis SD. Thermoluminescent dosimetry. In: Rogers D, Cygler J, editors. Chapter 24 in Clinical Dosimetry Measurements in Radiotherapy, Medical Physics Monograph #34; Proceedings of the AAPM Summer School 2009, Colorado Springs; Colorado. June 21–25; Madison, Wisconsin, USA: Medical Physics Publishing; 2009. pp. 815–840. [Google Scholar]
- Edwards CR, Mountford PJ. Characteristics of in vivo radiotherapy dosimetry. Br J Radiol. 2009;82:881–83. doi: 10.1259/bjr/32563777. [DOI] [PubMed] [Google Scholar]
- Fontbonne JM, Iltis G, Ban G, Battala A, Vernhes JC, Tillier J, Bellaize N, Le Brun C, Tamain B, Mercier K, Motin JC. Scintillation fiber dosimeter for radiation therapy accelerator. IEEE Trans Nucl Sci. 2002;49:2223–27. [Google Scholar]
- Frelin AM, Fontbonne JM, Ban G, Colin J, Labalme M, Batalla A, Isambert A, Vela A, Leroux T. Spectral discrimination of Cerenkov radiation in scintillating dosimeters. Med Phys. 2005;32:3000–06. doi: 10.1118/1.2008487. [DOI] [PubMed] [Google Scholar]
- Jornet N, Carrasco P, Jurado D, Ruiz A, Eudaldo T, Ribas M. Comparison study of MOSFET detectors and diodes for entrance in vivo dosimetry in 18 MV x-ray beams. Med Phys. 2004;31:2534–42. doi: 10.1118/1.1785452. [DOI] [PubMed] [Google Scholar]
- Hsi WC, Fagundes M, Zeidan O, Hug E, Schreuder N. Image-guided method for TLD-based in vivo rectal dose verification with endorectal balloon in proton therapy for prostate cancer. Med Phys. 2013;40:051715, 1–6. doi: 10.1118/1.4801901. [DOI] [PubMed] [Google Scholar]
- Klein DM, Briere TM, Kudchadker R, Archambault L, Beaulieu L, Lee AK, Beddar AS. In-phantom dose verification of prostate IMRT and VMAT deliveries using plastic scintillation detectors. Radiat Meas. 2012;47:921–29. doi: 10.1016/j.radmeas.2012.08.005. [DOI] [PMC free article] [PubMed] [Google Scholar]
- Mijnheer B, Beddar AS, Izewska J, Reft C. In vivo dosimetry in external beam radiotherapy. Med Phys. 2013;40:070903, 1–19. doi: 10.1118/1.4811216. [DOI] [PubMed] [Google Scholar]
- Tanderup J, Beddar AS, Andersen CE, Kertzscher G, Cygler JE. In vivo dosimetry in brachytherapy. Med Phys. 2013;40:070902, 1–15. doi: 10.1118/1.4810943. [DOI] [PubMed] [Google Scholar]
- Wootton LS, Beddar AS. Temperature dependence of BCF plastic scintillation detectors. Phys Med Biol. 2013;58:2955–67. doi: 10.1088/0031-9155/58/9/2955. [DOI] [PMC free article] [PubMed] [Google Scholar]
- York E, Alecu R, Ding L, Fontenla D, Kalend A, Kaurin D, Masterson-McGary ME, Marinello G, Matzen T, Saini A, Shi J, Simon W, Zhu TC, Zhu XR. Report of the American Association of Physicists in Medicine (AAPM) Task Group 62. Medical Physics Publishing; Madison, Wisconsin, USA: 2005. Diode in vivo dosimetry for patients receiving external beam radiation therapy. AAPM On-Line Report No. 87. [Google Scholar]


