

Abstract
Objective
This prospective observational study explored the association of hypertensive disorders of pregnancy and small-for-gestational age (SGA) with obstructive sleep apnea (OSA) as determined by screening measures for OSA and sleep studies.
Study Design
Two symptom-based screening questionnaires, the Berlin Questionnaire (BQ) and the Epworth Sleepiness Scale (ESS), were administered to enroll 1509 gravidae. Screen positive subjects were referred for polysomnography (PSG). The primary outcome was the occurrence of either gestational hypertension or preeclampsia. [a1]Generalized linear models (GLM) were used to estimate the relative risks of associations.
Results
1157 subjects were available for outcomes analysis. Screening positive on the BQ was positively associated with hypertensive disorders in GLM models (aRR=1.90, 95%CI 1.52–2.37).
Conclusion
In this large prospective trial, GLM modeling suggest that the BQ but not the ESS demonstrated significant association with measured adverse pregnancy outcomes, and specific items predicted these outcomes better than others. However, causative association of BQ with OSA cannot be assumed.
Keywords: Obesity, Obstructive Sleep Apnea, Preeclampsia, Sleep-Disordered Breathing
INTRODUCTION
The obesity epidemic persists, and maternal obesity is an ongoing contributor. Data from 2004–2005 revealed the prevalence of maternal obesity to be 20%; overall and this prevalence is projected to increase(1,2) Maternal obesity increases the risk of several adverse maternal and perinatal outcomes(3,4). Obesity is also a risk factor for obstructive sleep apnea (OSA), a condition of increased interest due to its seemingly intertwined relationship with not only obesity but possibly hypertensive disorders and fetal growth restriction(5–7).
OSA is characterized by recurrent cessation of respiratory airflow resulting from upper airway inspiratory collapse during sleep(8). It has been suggested that pregnant women may be predisposed to OSA, and OSA may contribute to adverse pregnancy outcomes(5–10). However, obesity has been posited to be a primary confounder in interpreting the available evidence on the risk of OSA to adverse pregnancy outcomes(10,11). Using a well-characterized prospective cohort of at-risk gravidae, we previously demonstrated in pregnancy that the relationship between OSA and obesity is likely inextricably linked in pregnancy, but that OSA potentially exerted an independent influence on outcomes(10). Limitations to our prior analysis included gravidae being recruited from a high-risk clinical population, as well as lack of confirmative diagnostic testing with polysomnography (PSG) among subjects(10).
In this current study, we sought to delineate the effect of OSA diagnosis and OSA symptoms (i.e., positive screening measures) on pregnancy outcomes in a population-based cohort of gravidae. We hypothesized that a diagnosis of OSA would be associated with gestational hypertension, preeclampsia, and small-for-gestational age after stratifying by obesity status. To accomplish these objectives, recruited subjects were screened for OSA as detailed below and perinatal outcomes were collected and compared.
MATERIALS AND METHODS
This study was performed in the Harris County Hospital District (now Harris Health System) between May 2010 and September 2012. The study was approved by the Institutional Review Board at Baylor College of Medicine and Harris County Hospital District and written informed consent was obtained. Gravidae presenting to two community clinics and one tertiary clinic were approached for enrollment. Consenting subjects were administered a questionnaire (in English or Spanish), which comprised the ESS, the BQ, and questions collecting basic demographic and health information. Women of all gestational ages were recruited. Inclusion criteria were gravidae of 18–50 years of age. Exclusion criteria were subjects with known sleep-disordered breathing, multi-fetal gestation, fatal fetal anomalies, and subjects with significant underlying pulmonary or cardiac comorbidities. As this study examined perinatal outcomes, enrolled subjects who ultimately terminated their pregnancy, miscarried, or delivered at a non-study site (NSS) were not included for outcomes analysis.
The self-administered questionnaire contained the Epworth Sleepiness Scale (ESS) and the Berlin Questionnaire (BQ). The ESS and BQ were chosen due to their frequent use in the obstetric OSA literature, and possibly the population(12–16). The ESS has been validated in the Spanish language and in Hispanic populations(17–19). At study initiation, neither questionnaire had been validated in a gravid population; a separate analysis of this study sought to assess the validity of these two questionnaires in pregnancy. We suspected that the BQ may perform poorly based upon the findings of our prior prospective trial on OSA in pregnancy and fetal heart rate monitoring wherein we found a sensitivity and specificity of 35.0% and 63.8% for BQ; however this study was not designed specifically to assess the predictive value of the BQ(16). While this current study was ongoing, the validity of ESS and BQ in pregnancy were demonstrated to be poor(13). Data from 2012 show that ESS has sensitivity of 36% and specificity of 77% in pregnancy: BQ has as sensitivity of 39% and a specificity of 68%(13).
The BQ questions were developed to elicit factors or behaviors that consistently predicted the presence of sleep-disordered breathing(20). In nonpregnant adults, it has a sensitivity of 86% and specificity of 77%(20). The ten questions are divided into three categories: snoring is queried with a header question and four follow-up questions, daytime sleepiness is queried with three questions and a follow-up question about sleeping while driving a motor vehicle, and medical risk factors are queried by asking about the presence of high blood pressure and obesity (by asking the height and weight)(20). A high risk or “screen positive” individual is reported to have at least two out of three symptom categories positive in the questionnaire(20). Responses to the height, weight, and high blood pressure (chronic hypertension) items on this questionnaire were confirmed by review of the medical record.
Regarding the ESS, in nonpregnant subjects, ESS has a sensitivity of 66–93.5% and specificity from 48–100%(21,22). The ESS consists of eight questions that evaluate the tendency to “doze off” in certain situations and is a subjective measure of sleepiness(21,23). The situations in the questions themselves range from highly soporific, such as “Lying down to rest in the afternoon when circumstances permit” to non-soporific, such as “In the car, while stopped for a few minutes in traffic”(23). The responses are on a scale of 0 to 3 signifying: 0=No chance of dozing off, 1=2=Moderate chance of dozing off, 3=High chance of dozing off. For this study, we considered a patient to screen positive for OSA with an ESS of 10 or higher.
Screen positive subjects were referred for attended PSG at the Harris County Hospital District Sleep Disorders Center. Due to resource constraints, diagnostic testing was only performed on subjects suspected of having OSA. As there are aspects of validity to each screening measure, all enrollees with evidence of this condition based on either ESS or BQ were classified as screening positive for OSA and were referred for an attended PSG (Figure 1)(16). Subjects were notified of their screen positive status via telephone call and letter. Referrals were performed via an order in the electronic medical record. Orders were also faxed and the Sleep Center was called to schedule studies. Due to limitations in completing PSGs, the protocol was amended to allow the use of a modified sleep-screening study to be performed inpatient if a screen positive patient was admitted to the antepartum service for any indication.
Figure 1.
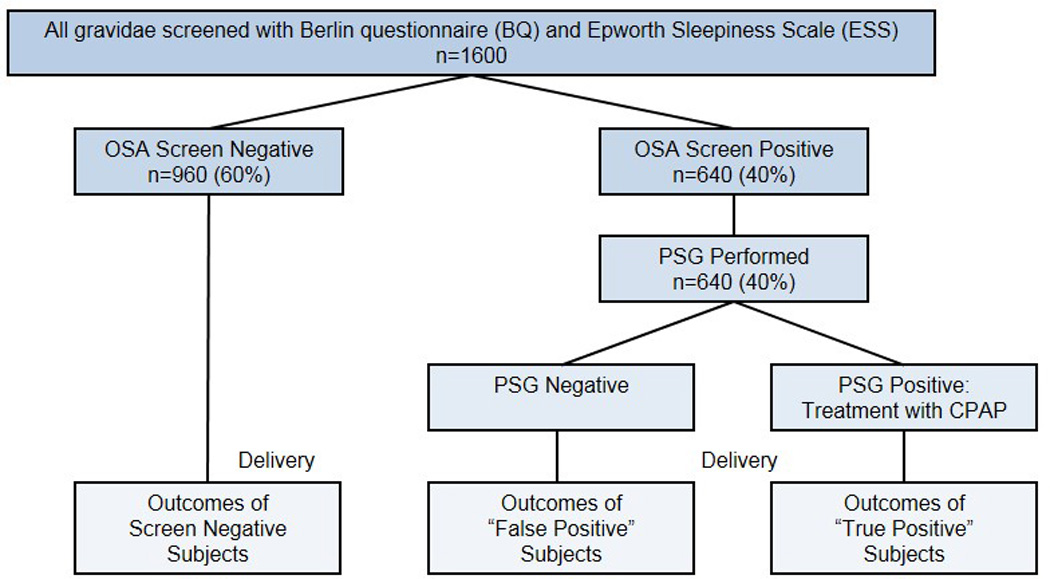
Study design. On enrollment, subjects would complete the Epworth and Berlin Questionnaire. To capture all possible cases of OSA, enrollees with evidence of OSA based upon either criterion were classified as screening positive for OSA and were referred for PSG. After delivery, outcomes would be compared.
Attended PSG testing was performed using a Carefusion Somnostar polysomnography system (Yorba Linda, California). Via this multi-channel system, the following variables were monitored continuously: electroencephalography, electrocardiography, electro-oculography, submental and leg electromyography, electrocardiography, heart rate monitoring, pulse-oximetery, nasal airflow, body-position and movements, and snoring. Attended PSG tests were administered by a certified technologist, and studies were reviewed by a physician, board certified in sleep medicine. OSA was diagnosed with Respiratory Disturbance Index (RDI) > 5 using attended PSG. Attended PSG was scored using the AASM Manual for the Scoring of Sleep and Associated Events, 2007(24).
The ResMed ApneaLink Plus (ResMed Corp, MAP Medizin Technologie GmbH, Poway, CA) is a type 3 unattended home sleep testing device (T3D) which generates a report with the AHI, among other variables. Compared to PSG, it has a sensitivity and specificity of 67.5 and 76.9 (for “home” or unmonitored use), using an AHI ≥ 5 considered diagnostic of OSA(25), as it was in this study. This device has not been validated in pregnancy, but has been used in prior obstetric studies as diagnostic(10,16,26). For the purposes of this study, T3D was performed in the hospital, not home, and was considered diagnostic. However, if a T3D was performed, the referral for PSG was not cancelled as PSG remains the standard for diagnosis.
Following delivery, each subject’s medical chart was reviewed and outcomes were extracted (K.M.A.1). Our primary outcome was the incidence of gestational hypertension or preeclampsia. Secondary outcomes included gestational diabetes and unscheduled cesarean delivery. The diagnosis of gestational hypertension, preeclampsia, and severe preeclampsia were consistent with the definitions by the American Congress of Obstetricians and Gynecologists at the time of the study (2010–2012)(27). Gestational hypertension was defined as a systolic blood pressure of 140 mmHg or higher or a diastolic blood pressure of 90 mm Hg or higher that occurs after 20 weeks of gestation in a woman with previously normal blood pressure without proteinuria. The criteria for preeclampsia was identical to the criteria for gestational hypertension with the exception that proteinuria of 0.3 g in a 24 hour period was required. Severe preeclampsia was diagnosed if any of the following were present: blood pressure of 160 mm Hg or higher or a diastolic blood pressure of 110 mm Hg or higher on two occasions at least 6 hours apart while on bed rest, proteinuria of 5 g in a 24 hour period or 3+ or greater on two random urine samples collected at least 4 hours apart, oliguria of less than 500 mL in 24 hours, cerebral or visual disturbances, pulmonary edema or cyanosis, epigastric or right upper quadrant pain, impaired liver function, thrombocytopenia, or fetal growth restriction(27). Similarly, the diagnosis of gestational diabetes was congruous with the definition by the American Congress of Obstetrics and Gynecology(28). Unscheduled cesarean deliveries included deliveries for labor dystocias, fetal heart rate tracing abnormalities, and suspected macrosomia. Unscheduled cesarean deliveries that were performed at a non-scheduled time, such as cases performed due to prior uterine surgery, malpresentation, placental location, fetal anomalies (precluding vaginal delivery), or infectious reasons, were not counted as unscheduled cases.
The neonatal outcome of greatest interest was the occurrence of SGA due to its prior association with snoring(29) and sleep disordered breathing(30). Other neonatal outcomes were birthweight ratio, preterm delivery, nursery level required, and LGA. Small-for-gestational age (SGA) was defined as <10th percentile(31). A second category of <5th percentile was also examined. Large-for-gestational age was defined as >90th percentile and a second category of >95th percentile was also examined. The occurrence of preterm birth, SGA, LGA, or level 2 or 3 nursery admission comprised the composite neonatal outcome. As a second means of representing birth weight, birth weight ratio was calculated in each case as birth weight divided by mean birth weight for gestation and is a previously validated measure of adjusting for gestational age in a study population(32).
Covariates considered in these analyses were maternal age, race/ethnicity, smoking, parity, gestational age, prepregnancy BMI, hypertension, and pregestational and gestational diabetes. Prepregnancy BMI categories were defined according to the National Institute of Health and the World Health Organization: normal weight 19 to 24.9, overweight 25 to 29.9, and obese >30 kg/m2 (33,34). BMI was calculated using height and weight data (kg/m2) that were collected during initial assessment. When prepregnancy weight was not known, the earliest available weight was used.
Our sample size estimation was based upon having adequate power to examine the relationship between OSA and maternal and neonatal outcomes described above, adjusted for the possible confounding influence of obesity. In our previous analysis of n=100 subjects, we found the screen positive rate for OSA to be 36% (by BQ alone) and overall OSA diagnosis positive rate of 20%. In this analysis, we found the incidence of preeclampsia to be 1.95-fold higher among women screening positive for OSA than among women screening negative (14.3% versus 7.3%)(10). In order to detect a similar increase in preeclampsia or gestational hypertension, we estimated that we would need a minimum of 243 OSA positive subjects. In order to arrive at this sample size, a minimum of 1100 subjects would need to be screened with PSG performed in 45% of subjects, which was our estimated screen positive rate after adding ESS to the estimated screen positive rate of 36% for BQ(10). This would ultimately give us three cohorts in which to follow outcomes: screen negative, screen positive/PSG negative (i.e.: false positive), and OSA positive. After 500 subjects were enrolled the protocol was amended; enrollment was increased to 1600 (increased by 500) as only 4 diagnostic PSGs had been completed (of 150 referred for PSG).
Descriptive findings of study sample characteristics and outcomes by OSA screening results from the BQ, ESS, and OSA diagnosis based on T3D or PSG are reported. Chi-squared testing or Fisher’s exact test were performed.
Generalized linear models (GLM) adjusted relative risks (aRRs) with 95% CIs were estimated to examine the relationships between screening OSA positive on the BQ, ESS, their individual items, and adverse maternal and neonatal outcomes. BMI and hypertension were added in models examining other BQ items and adverse maternal and neonatal outcomes to control for confounding. Stratified by BMI, additional GLM models and crude RRs (cRR) with 95% CIs were obtained among normal weight, overweight, and obese groups for associations between the BQ, BQ items, and adverse maternal and neonatal outcomes.
Fisher’s exact test was employed to examine differences in sample characteristics by OSA diagnosis from three-channel sleep screening or PSG. Statistical significance for all analyses was P < 0.05. Stata 10.0 (Stata Corporation, College Station, TX) and SPSS 13.0 (SPSS Incorporated, Chicago, IL) were used for analyses.
RESULTS
1617 questionnaires were completed and clinical information was analyzed for previously unidentified exclusion criteria (Figure 2). Subjects who subsequently terminated their pregnancy (n=1), miscarried (n=32) or who delivered at a NSS (n=319) had no perinatal outcomes available for analysis and were similarly excluded from outcomes analysis. As shown in Figure 2, subjects had perinatal outcomes available. Subjects that completed either the BQ or ESS were 1153.
Figure 2.
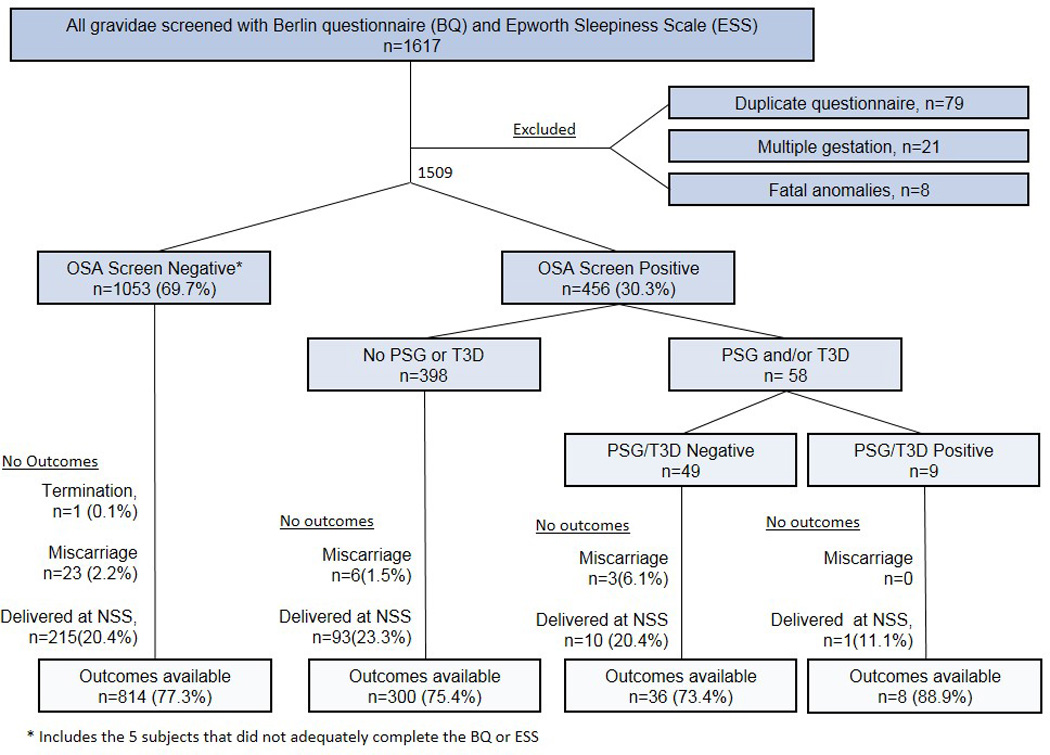
Enrollment and study flow. 1509 subjects were eligible for enrollment. Of those, 1048 screened negative on at least one of the measures and 5 did not adequately complete either screening measure. For the purposes of study design, they were treated as OSA Screen Negative as they did not test positive on either measure. Of the 456 subjects that screened positive on at least one measure, only 58 completed diagnostic testing via PSG or T3D. Additionally, subjects that had a termination of pregnancy or miscarried and subjects who delivered at a non-study site (NSS) did not have outcomes available for analysis, thus were excluded from outcomes analysis. The number and percent of subjects with outcomes available are shown.
As shown in Table 1, the majority of women were Hispanic (91.2%) and non-smokers (97.3%). Over three-fourths of the subjects were overweight (35.4%) or obese (42.1%). At baseline, screening positive for OSA was associated with non-Hispanic Race/Ethnicity, smoking, obesity, and hypertension. Specifically, only 27.2% of Hispanic gravidae screened positive for OSA compared to 59.9% of African/African Americans, 51.4% of Caucasians, and 37.6% of Other Races (Asian, Native American, Filipino, etc.). The majority of patients were screened in the second or third trimester; screening positive was not associated with the trimester of screening. Overall, the screen positive rate varied from 30.2% in the first trimester to 27.5% in the second trimester and 31.5% in the third trimester.
Table 1.
Study Group Characteristics (n 1157)
| Characteristic | % or mean | N | OSA Screen Negative on BQ and ESS |
OSA Screen Positive on BQ or ESS |
|
|---|---|---|---|---|---|
| Total | 100.0 | 1157 | % or mean | % or mean | p |
| Maternal age groups | |||||
| Maternal age, mean | 28.8 | 1157 | 28.7 | 29.0 | 0.51 |
| <20 | 6.4 | 74 | 5.8 | 7.9 | |
| 20–29 | 49.5 | 573 | 50.4 | 48.0 | |
| 30–39 | 39.6 | 458 | 39.9 | 38.4 | |
| 40–46 | 4.5 | 52 | 3.8 | 5.8 | 0.25 |
| Ethnicity/ Race | 1157 | ||||
| Hispanic | 91.2 | 1055 | 94.3 | 83.7 | |
| Non-Hispanic | 8.8 | 102 | 5.7 | 16.3 | <0.001 |
| -African-American | 6.5 | 75 | 3.7 | 13.1 | |
| -Caucasian | 0.5 | 6 | 0.4 | 0.9 | |
| -Other | 1.8 | 21 | 1.6 | 2.3 | |
| Smoking status | 1147 | ||||
| Non-smoker inpregnancy | 97.3 | 1116 | 98.5 | 94.5 | |
| Smoked during pregnancy | 2.7 | 31 | 1.5 | 5.5 | <0.001 |
| Gravidy and Parity | 1157 | ||||
| Gravidy, mean | 3.14 | 3.1 | 3.2 | 0.33 | |
| Parity, mean | 1.67 | 1.7 | 1.6 | 0.75 | |
| P0 | 22.7 | 263 | 21.4 | 26.2 | |
| P1 | 27.8 | 322 | 28.8 | 25.6 | |
| P>1 | 49.4 | 572 | 49.8 | 48.3 | 0.18 |
| Prepregnancy BMI | 1157 | ||||
| BMI Mean | 29.76 | 1157 | 28.8 | 31.9 | <0.001 |
| BMI< 25 | 22.6 | 261 | 25.3 | 16.3 | |
| BMI 25–30 | 35.4 | 409 | 39.6 | 25.1 | |
| BMI ≥ 30 | 42.1 | 487 | 35.1 | 58.4 | <0.001 |
| Gestational age at survey | |||||
| Gestational age at survey, mean | 24.71 | 1157 | 24.5 | 25.2 | 0.21 |
| 1st trimester | 11.9 | 138 | 11.9 | 12.2 | |
| 2nd trimester | 44.4 | 514 | 45.9 | 41.4 | |
| 3rd trimester | 43.6 | 505 | 42.3 | 46.2 | 0.39 |
| Pregestational diabetes | 5.3 | 61 | 5.31 | 5.24 | 0.95 |
| Chronic Hypertension | 5.3 | 61 | 3.8 | 8.7 | 0.001 |
Chi-square test performed for categorical variables, t-test for continuous variables
Overall, 15.5% (n 178 of 1152) of subjects screened positive on BQ and 19.0% (n 205 of 1081) screened positive on ESS. Overall, among women with outcomes available, 33.1% (n 383 of 1157) women screened positive on either the BQ or ESS. The adjusted relative risk of screening positive on BQ by BMI was 1.28 (95%CI 0.58–2.82, non-significant) and 9.03 (95%CI 4.68–17.39, significant) compared to normal weight gravidae for overweight and obese gravidae, respectively. Of women with outcomes available undergoing sleep testing, 18.2% (n 8 of 44) were diagnosed with OSA.
Table 2 illustrates the percentage distribution of adverse maternal and neonatal outcomes by OSA screening results. Unadjusted analyses indicate screening OSA positive on the BQ was associated with preeclampsia (p<0.001), and gestational hypertension or preeclampsia (pooled) (p<0.001). Screening positive on BQ was not associated with SGA; associations with other neonatal outcomes are shown. The ESS was not significantly associated with any examined outcomes. Average BW ratios were compared between the OSA screen negative and OSA screen positive groups. The average BW ratios were 0.96 (SD 0.13) and 0.97 (SD 0.15), respectively with no statistically significant difference between groups (p=0.19).
Table 2.
Perinatal outcomes by Berlin questionnaire and Epworth Sleepiness Scale (Unadjusted analysis.) (n 1153)
| Overall | BQ − | BQ + | ESS − | ESS + | BQ and ESS − | BQ or ESS + | ||||
|---|---|---|---|---|---|---|---|---|---|---|
| % | % | % | p | % | % | p | % | % | P | |
| Gestational diabetes | 21.7 | 21.4 | 23.6 | 0.51 | 21.5 | 22.0 | 0.88 | 21.5 | 21.5 | 0.98 |
| Hypertensive Disorders | ||||||||||
| Preeclampsia or GHTN (pooled) | 22.3 | 19.3 | 38.8 | <0.001 | 21.7 | 26.8 | 0.11 | 18.8 | 30.5 | <0.001 |
| Gestational hypertension | 10.1 | 9.9 | 11.2 | 0.57 | 9.6 | 11.2 | 0.48 | 9.4 | 10.8 | 0.50 |
| Pre-eclampsia | 14.2 | 11.4 | 29.8 | <0.001 | 14.2 | 17.6 | 0.22 | 11.3 | 21.8 | <0.001 |
| Severe pre-eclampsia | 9.3 | 7.8 | 17.4 | <0.001 | 9.1 | 11.2 | 0.36 | 7.7 | 13.4 | 0.003 |
| Unplanned cesarean delivery | 13.5 | 12.7 | 18.2 | 0.05 | 13.7 | 12.8 | 0.72 | 13.0 | 14.7 | 0.46 |
| Neonatal outcome | ||||||||||
| Composite Neonatal Outcome Present | 32.2 | 30.9 | 39.9 | 0.02 | 32.3 | 34.6 | 0.52 | 30.2 | 37.9 | 0.05 |
| Preterm delivery | 12.8 | 11.7 | 18.5 | 0.01 | 12.3 | 15.1 | 0.28 | 11.1 | 17.2 | 0.006 |
| Nursery level 2/3 | 16.8 | 15.7 | 22.9 | 0.02 | 16.9 | 17.4 | 0.86 | 15.2 | 21.2 | 0.01 |
| SGA < 10th percentile | 12.1 | 12.7 | 9.0 | 0.17 | 11.7 | 14.7 | 0.23 | 12.0 | 12.8 | 0.72 |
| SGA < 5th percentile | 6.2 | 6.5 | 4.5 | 0.31 | 5.7 | 8.8 | 0.10 | 6.0 | 7.0 | 0.51 |
| LGA>90th percentile | 5.8 | 4.8 | 11.2 | 0.001 | 6.1 | 5.4 | 0.72 | 5.3 | 7.6 | 0.14 |
| LGA>95th percentile | 3.6 | 2.9 | 7.3 | 0.003 | 3.8 | 3.4 | 0.82 | 3.1 | 5.0 | 0.14 |
Chi-squared test performed
Table 3 shows the relative risks of adverse maternal and neonatal outcomes and screening OSA positive on the BQ and its items adjusting for confounding. In the adjusted models for the BQ, it was associated with preeclampsia or GHTN (pooled) (aRR=1.90, 95% CI 1.52–2.37) and preeclampsia (aRR=2.45, 95% CI 1.84–3.26). Specific BQ items were also associated with perinatal outcomes as delineated in Table 3. Of note, BMI> 30 was similarly associated with gestational hypertension and preeclampsia (aRR=1.70 and 1.55 with 95% CI 1.18–2.46 and 1.16–2.07, respectively), yet a negative association was observed for BMI>30 and SGA <10th percentile (aRR=0.69, 95%CI 0.50–0.96). The BQ items regarding snoring that bothers others, feeling tired after sleeping, and feeling tired during waking time were not associated with any primary outcomes (data not shown). Feeling tired during waking time was inversely associated with gestational diabetes (aRR 0.67, 95%CI 0.49–0.92) (data not shown).
Table 3.
Adjusted relative risks of adverse maternal and neonatal outcomes and individual items of the Berlin Questionnaire, adjusted for confounding. (n 1153)
| Overall BQ | BQ + | Snore | Snore loud | Snore often | Snoring bothers others |
Nod off while driving |
Often nod off while driving |
High blood pressure |
BMI |
|---|---|---|---|---|---|---|---|---|---|
| BQ Item | aRR | aRR | aRR | aRR | aRR | aRR | aRR | aRR | aRR |
| 95% CI | (95% CI) | (95% CI) | (95% CI) | (95% CI) | (95% CI) | (95% CI) | (95% CI) | (95% CI) | |
| Gestational diabetes | ns | ns | ns | ns | ns | Ns | ns | ns |
1.48‡ 1.19–1.85 |
| Hypertensive Disorders | |||||||||
| Preeclampsia or GHTN (Pooled) |
1.90‡ 1.52–2.37 |
ns | ns | ns | ns |
1.70† 1.16–2.50 |
1.92* 1.14–3.24 |
2.90‡ 2.34–3.59 |
1.54‡ 1.24–1.92 |
| Gestational hypertension | ns |
0.59* 0.36–0.95 |
ns | ns | ns |
2.07* 1.12–3.81 |
ns | - |
1.70† 1.18–2.46 |
| Preeclampsia |
2.45‡ 1.84–3.26 |
ns |
1.62* 1.03–2.55 |
1.44* 1.05–1.98 |
1.45* 1.00–2.09 |
1.65* 1.02–2.68 |
2.25* 1.21–4.17 |
5.07‡ 3.92–6.55 |
1.55† 1.16–2.07 |
| Severe pre-eclampsia |
2.02‡ 1.37–2.99 |
ns | ns | ns | vns | Ns |
3.73‡ 1.75–7.98 |
7.54‡ 5.39–10.56 |
ns |
| Unplanned cesarean delivery | ns | ns | ns | ns | ns | Ns | ns | Ns |
1.52† 1.14–2.03 |
| Neonatal Outcomes | |||||||||
| Composite Neonatal Outcome | ns | ns | ns | ns | ns | ns | ns | ns |
2.04‡ 1.70–2.46 |
| Preterm delivery | ns | ns | ns | ns | ns | Ns | ns |
3.93‡ 2.86–5.39 |
ns |
| Nursery level 2/3 | ns | ns | ns | ns | ns | Ns | ns |
2.48‡ 1.84–3.36 |
ns |
| SGA < 10th percentile | ns | ns | ns | ns | ns | Ns | ns |
1.87* 1.13–3.08 |
0.69* 0.50–0.96 |
| SGA < 5th percentile | ns | ns | ns | ns | ns | Ns | ns | ns | ns |
| LGA>90th percentile |
2.19† 1.32–3.61 |
ns | ns | ns | ns | Ns | ns | ns |
2.68‡ 1.60–4.46 |
| LGA>95th percentile |
2.56† 1.36–4.80 |
2.15† 1.21–3.83 |
ns |
2.17* 1.10–4.28 |
ns | Ns | ns | ns |
2.66† 1.37–5.17 |
Generalized linear models adjusted for maternal age, ethnicity, smoking during pregnancy, parity, BMI (where appropriate), hypertension (where appropriate), gestational age at survey, pregestational diabetes, gestational diabetes (where appropriate). aRR=Adjusted Relative Risk. 95%CI=95% Confidence interval
P<0.05
P<0.01
P<0.001
ns=not significant, - = empty cell
Stratified by BMI, the association between screening positive for OSA and hypertensive disorders remained. These results are summarized in Table 4 and described in further detail in Supplemental Tables 1–3. Even among normal weight subjects (Table 4 and Supplemental Table 1, n 261), screening positive for OSA was associated with preeclampsia or gestational hypertension (pooled) with a cRR of 2.80 (95% CI 1.05–7.50) and an aRR of 2.70 (95%CI 1.06–6.83) after controlling for confounding variables. Among overweight subjects (Table 4 and Supplemental Table 2, n 409), screening positive on the BQ was associated with preeclampsia or gestational hypertension (pooled) (cRR 2.95, 95%CI 1.86–4.69, aRR 2.80, 95%CI 1.79–4.37) and also preeclampsia (cRR 4.41, 95%CI 2.57–7.57, aRR 3.87, 95%CI 2.41–6.24) and severe preeclampsia (cRR 6.16, 95% CI 3.28–11.55, aRR 4.97, 95%CI 2.89–8.54). Additionally, among obese subjects (Table 4 and Supplemental Table 3, n 487), screening positive on the BQ was associated with preeclampsia or gestational hypertension (pooled) with a cRR 1.46 (95% CI 1.10–1.92), aRR 1.35 (95%CI 1.03–1.77) and preeclampsia (cRR 1.90, 95%CI 1.33–2.73, aRR 1.78, 95% CI 1.23–2.56).
Table 4.
Summary of Supplemental Tables 1–3, which show the crude and adjusted relative risks of maternal and neonatal outcomes and individual items of the Berlin Questionnaire, stratified by obesity. In this table, the relative risks refer to the item with the highest correlation. The 95% confidence intervals, the exact question with the highest correlation, and other details are shown in Supplemental Tables 1–3. Items with less than five subjects per cell are not shown here but are shown in the supplemental tables.
| BQ+ | Snoring items | Fatigue items | Nodding off while driving items |
Hypertension | |
|---|---|---|---|---|---|
| Normal BMI (n 261) | |||||
| Preeclampsia or Gestational Hypertension (Pooled) | cRR=2.80* aRR=2.70* |
cRR=5.62‡ aRR=2.87* |
cRR=1.99* aRR=ns |
cRR=ns aRR=3.09* |
cRR=4.97‡ aRR=ns |
| Gestational Hypertension | cRR=ns aRR=ns |
cRR=5.58† aRR=ns |
cRR=3.07* aRR=4.31† |
cRR=3.69* aRR=3.95* |
NA NA |
| Preeclampsia | cRR=ns aRR=ns |
cRR=ns aRR=ns |
cRR=ns aRR=ns |
nRR=ns aRR=ns |
cRR=7.20‡ aRR=ns |
| Composite Neonatal Outcome | cRR=ns aRR=ns |
cRR=ns aRR=ns |
cRR=ns aRR=ns |
cRR=ns aRR=ns |
cRR=2.37‡ aRR= 2.55† |
| SGA<10th percentile | cRR=ns aRR=ns |
cRR=ns aRR=ns |
cRR=ns aRR=ns |
cRR=ns aRR=ns |
cRR=ns aRR=ns |
| Overweight BMI (n 409) | |||||
| Preeclampsia or Gestational Hypertension (Pooled) |
cRR=2.95‡ aRR=2.80‡ |
cRR=ns aRR=ns |
cRR=ns aRR=ns |
cRR=3.42† aRR=- |
cRR=4.47‡ aRR=3.71‡ |
| Gestational Hypertension | cRR=ns aRR=ns |
cRR=ns aRR=ns |
cRR=ns aRR=ns |
cRR=- aRR=- |
NA NA |
| Preeclampsia | cRR=4.41‡ aRR=3.87‡ |
cRR=3.38† aRR=ns |
cRR=ns aRR=ns |
cRR=5.35‡ aRR=- |
cRR=7.27‡ aRR=6.44‡ |
| Composite Neonatal Outcome | cRR=2.07† aRR=1.84† |
cRR=ns aRR=ns |
cRR=nsaRR=ns | cRR=3.60‡ aRR=ns |
cRR=2.61‡ aRR=2.32‡ |
| SGA<10th percentile | cRR=ns aRR=ns |
cRR=ns aRR=ns |
cRR=ns aRR=ns |
cRR=ns aRR=ns |
cRR= 2.46* aRR=ns |
| Obese BMI (n 487) | |||||
| Preeclampsia or Gestational Hypertension (Pooled) |
cRR=1.46† aRR=1.35* |
cRR=1.56‡ aRR=ns |
cRR=ns aRR=ns |
cRR=1.75† aRR=ns |
cRR=2.71‡ aRR=2.61‡ |
| Gestational Hypertension | cRR=ns aRR=ns |
cRR=ns aRR=ns |
cRR=ns aRR=ns |
cRR=ns aRR=ns |
NA |
| Preeclampsia | cRR=1.90‡ aRR=1.78† |
cRR=2.08‡ aRR=1.62* |
cRR=ns aRR=ns |
cRR=2.04† aRR=2.04† |
cRR=4.66‡ aRR=4.86‡ |
| Composite Neonatal Outcome | cRR=ns aRR=ns |
cRR=ns aRR=ns |
cRR=ns aRR=ns |
cRR=ns aRR=ns |
cRR=2.13‡ aRR=1.84‡ |
| SGA<10th percentile | cRR=ns aRR=ns |
cRR=ns aRR=0.43* |
cRR=ns aRR=ns |
cRR=ns aRR=ns |
cRR=2.34‡ aRR=2.15* |
Generalized linear models, unadjusted shown as cRR=Crude Relative Risk.
Generalized linear models adjusted for maternal age, race/ethnicity, smoking during pregnancy, parity, hypertension (where appropriate), gestational age at survey, pregestational diabetes, gestational diabetes (where appropriate) shown as aRR=Adjusted Relative Risk.
P<0.05
P<0.01
P<0.001
ns=not significant, - = empty cell
The relative risks of neither the primary outcome (preeclampsia or gestational hypertension) nor SGA were significantly associated with screening positive on the ESS after adjusting for confounding variables. (Supplemental Table 4.)
Analysis of screen negative versus false-positive and true positive gravidae was not performed due to the limited number of PSG/T3D (12.8% of the screen-positive subjects) which were ultimately performed. Table 5 shows the percentage distribution of women diagnosed with OSA (based upon positive PSG or T3D) among tested screen positive subjects by study characteristics, and OSA screening measures. The proportion of gravidae diagnosed with OSA (with outcomes available) was 18.2% (n=8) among those tested. There was a significant difference in the gestational age at the time of survey; more subjects who screened positive in the second trimester were diagnosed with OSA. As shown in Supplemental Table 5, positive OSA diagnosis was not associated with adverse maternal and neonatal outcomes compared to subjects who screened positive for OSA but tested negative.
Table 5.
Subject group characteristics of the screen positive gravidae undergoing testing (n 44)
| Total | T3D or PSG Negative |
T3D or PSG Positive | p | ||
|---|---|---|---|---|---|
| % | n | % | % | ||
| 100.0 | 44 | 81.8 | 18.2 | ||
| Maternal age groups | |||||
| <20 | 4.5 | 2 | 5.6 | 0.0 | |
| 20–29 | 45.5 | 20 | 50.0 | 25.0 | |
| 30–39 | 38.6 | 17 | 30.6 | 75.0 | |
| 40–46 | 11.4 | 5 | 13.9 | 0.0 | 0.16 |
| Ethnicity | |||||
| Hispanic | 72.7 | 32 | 66.7 | 100.0 | |
| African-American | 20.5 | 9 | 25.0 | 0.0 | |
| Caucasian | 2.3 | 1 | 2.8 | 0.0 | |
| Other | 4.5 | 2 | 5.6 | 0.0 | 0.38 |
| Smoking | |||||
| Did not smoke during pregnancy | 90.9 | 40 | 88.9 | 100.0 | |
| Smoked during pregnancy | 9.1 | 4 | 11.1 | 0.0 | 1.00 |
| Parity group | |||||
| P0 | 31.8 | 14 | 33.3 | 25.0 | |
| P1 | 18.2 | 8 | 16.7 | 25.0 | |
| P2+ | 50.0 | 22 | 50.0 | 50.0 | 0.77 |
| Body Mass Index (BMI) | |||||
| BMI<25 Normal | 13.6 | 6 | 13.9 | 12.5 | |
| BMI 25–30 Overweight | 29.5 | 13 | 33.3 | 12.5 | |
| BMI>30 Obese | 56.8 | 25 | 52.8 | 75.0 | 0.57 |
| Gestational age at survey | |||||
| 1st trimester | 13.6 | 6 | 11.1 | 25.0 | |
| 2nd trimester | 34.1 | 15 | 27.8 | 62.5 | |
| 3rd trimester | 52.3 | 23 | 61.1 | 12.5 | 0.03 |
| Gestational age at testing | |||||
| 1st trimester | 2.3 | 1 | 2.8 | 0 | |
| 2nd trimester | 15.9 | 7 | 13.9 | 25.0 | |
| 3rd trimester | 81.8 | 36 | 83.3 | 75.0 | 0.67 |
| Sleep disturbance measures | |||||
| BQ+ | 54.5 | 24 | 62.9 | 37.5 | 0.44 |
| ESS+ | 65.1 | 28 | 61.1 | 75.0 | 0.69 |
| Pregestional diabetes | 15.9 | 7 | 13.9 | 25.0 | 0.59 |
Fisher's exact test performed
DISCUSSION
Obesity is a risk factor for adverse perinatal outcomes. Obesity and OSA are inextricably linked in nonpregnant adults, and there is physiologic evidence that pregnancy may predispose to OSA, thus compounding the preexisting risk in obese gravidae(8,10,11,35). In this study, we sought to delineate the effect of OSA from obesity on perinatal outcomes and found that OSA was independently associated with adverse outcomes. We also sought to delineate the effect of OSA symptoms from OSA diagnosis by comparing the outcomes of false-positive subjects to subjects diagnosed with OSA; this analysis was not able to be fully realized due to low PSG completion.
Using both adjusted and unadjusted analyses, we found that screening positive for OSA on BQ was associated with hypertensive disorders across all BMI strata. Even among overweight and obese gravidae the cRR was 4.41 and 1.90 (aRR 3.87 and 1.78), respectively, thus screening positive for OSA compounds the already elevated risk of preeclampsia among these gravidae. Also notable is the risk of preeclampsia with screening positive on BQ among subjects with a normal prepregnancy weight, demonstrating that the risk of preeclampsia is increased with screening positive on BQ, even among normal weight gravidae. Individual items were also commonly associated with hypertensive disorders and neonatal outcomes, namely snoring and dozing off while driving. The association of hypertension with preeclampsia was expected.
ESS was not associated with any outcomes. This could be partly explained by the frequency of sleepiness in pregnancy, which may make this a poor screening symptom for OSA, and thereby less likely to be associated with outcomes. BQ was expected to have associations with outcomes based upon the snoring questions, given their prior association with hypertensive disorders(11,29,36). However, it was also expected to have associations with outcomes due to the inherent confounding by co-morbid conditions, namely BMI and HTN, which are components of the BQ.
These findings are consistent with many, but not all, prior studies which note an association between OSA diagnosis or screening OSA positive and preeclampsia(10,11,30,37,38). Many, however, concluded that obesity was either the primary contributor to the risk of preeclampsia or a significant confounder(8,10,11,35). Unlike many prior studies, this study rigorously adjusted for confounding variables, including BMI.
When compared with false-positive subjects, we found no association between OSA diagnosis by T3D/PSG and perinatal outcomes. However, only 45 of the 58 subjects who underwent testing had available outcomes. Additionally, given the overall low number of PSGs that were completed, the analysis of outcomes among subjects with testing was ultimately underpowered. While there was no association of the gestational age at survey and screening positive on the survey (Table 1), among those who screened positive and completed diagnostic testing, there was a significant difference in the gestational age at the time of survey and having a confirmed diagnosis of OSA (Table 5). Notably, the gestational age at the time of diagnostic testing was not associated with being diagnosed with OSA (Table 5). Together, this suggests that, if screening occurs, it may be most useful in the second trimester.
Strengths of this paper include its large sample size, prospective design, adjustment for confounding, and item-by-item analysis that adjusted for confounding as well. This study also faced the same resource limitations faced by practitioners in obtaining diagnostic testing, which may enhance its applicability to clinical practice. As screening seems to predict adverse outcomes and prior studies have demonstrated that treatment may decrease these outcomes(39), perhaps payers would ultimately benefit from coverage of attended PSG in pregnancy.
The main limitation of this study was the small number of subjects who completed attended PSG testing. Briefly, all 456 screen positive subjects were referred for PSG; due to sleep center availability, lack of insurance coverage, and subjects’ social obligations and needs, only 8 were completed. This prompted the use of the T3D as diagnostic of OSA, which has not been validated in pregnancy. Briefly, this T3D has a lower sensitivity at low levels of AHI, which are common in (non-pregnant) women, thus its use as a diagnostic tool in pregnancy may be limited(25,40,41). In this setting, the low sensitivity of T3D compared to PSG may have resulted in falsely negative “diagnostic” tests, compared to PSG. This may contribute to the lack of association between OSA “diagnosis” in this study and the primary outcome.
The Hispanic majority of this study is both a strength and a weakness. It adds to the overall limited existing literature on OSA in the Hispanic population. The impact of ethnicity on pregnancy outcomes in OSA is largely unknown; this study found that, even after controlling for ethnicity, screening positive for OSA was associated with outcomes. However, the Hispanic majority may limit the applicability of this study to populations with different demographics. Future research on OSA in pregnancy in the Hispanic population may be warranted.
Consistent with prior studies, the present investigation shows that obesity is a risk factor for screening positive for OSA, which was expected as obesity is a weighted component of the BQ. More importantly, the association between screening positive for OSA and adverse outcomes remains after controlling for obesity. As a point of caution, screening positive for OSA on BQ is not synonymous with a diagnosis of OSA; indeed, we and others have found that BQ poorly predicts OSA diagnosis among gravidae(10,13,16). However, even in the absence of an actual OSA diagnosis, our results suggest that the risk of adverse outcomes arises from the combination of habitus and symptoms, indicating a far more complex relationship which will require further study and the use of OSA screening measures adapted to pregnant women.
Supplementary Material
ACKNOWLEGEMENTS
Lata Casturi, RPGST at Baylor College of Medicine, for the use of the ResMed ApneaLink devices. Kjersti Aagaard, M.D., Ph.D. DP2 award DP21DP2OD001500-01 NIH Director New Innovator Award. The nurses and clinical staff at Casa de Amigos Health Center, Peoples Community Health Center, and Ben Taub General Hospital's Obstetrics Clinic and Antepartum Unit.
Financial Support:
Baylor College of Medicine Department of Obstetrics and Gynecology Resident Research Grant 2011–2012 (K.M.A.1, First author)
Footnotes
Disclosure Statement:
ResMed donated single-use nasal cannulas and oximeter sensors for this study. The authors report no other conflict of interest.
Paper Presentation Information:
This paper was previously presented as a poster at the Society of Maternal-Fetal Medicine’s 33rd Annual Meeting- The Pregnancy Meeting™, San Francisco, California, February 11–16, 2013. Abstract Number 670.
REFERENCES
- 1.Chu SY, Kim SY, Bish CL. Prepregnancy obesity prevalence in the United States, 2004–2005. Matern Child Heal. J. 2009;13(5):614–620. doi: 10.1007/s10995-008-0388-3. 2008/07/12 ed. [DOI] [PubMed] [Google Scholar]
- 2.Finkelstein EA, Khavjou OA, Thompson H, Trogdon JG, Pan L, Sherry B, et al. Obesity and severe obesity forecasts through 2030. Am J Prev Med. 2012;42(6):563–570. doi: 10.1016/j.amepre.2011.10.026. 2012/05/23 ed. [DOI] [PubMed] [Google Scholar]
- 3.ACOG Committee Opinion number 315, September 2005. Obesity in pregnancy. Obs. Gynecol. 2005;106(3):671–675. doi: 10.1097/00006250-200509000-00054. 2005/09/02 ed. [DOI] [PubMed] [Google Scholar]
- 4.Weiss JL, Malone FD, Emig D, Ball RH, Nyberg DA, Comstock CH, et al. Obesity, obstetric complications and cesarean delivery rate--a population-based screening study. Am J Obs. Gynecol. 2004;190(4):1091–1097. doi: 10.1016/j.ajog.2003.09.058. 2004/05/01 ed. [DOI] [PubMed] [Google Scholar]
- 5.Izci B, Riha RL, Martin SE, Vennelle M, Liston WA, Dundas KC, et al. The upper airway in pregnancy and pre-eclampsia. Am J Respir Crit Care Med. 2003;167(2):137–140. doi: 10.1164/rccm.200206-590OC. 2002/11/02 ed. [DOI] [PubMed] [Google Scholar]
- 6.Yinon D, Lowenstein L, Suraya S, Beloosesky R, Zmora O, Malhotra A, et al. Pre-eclampsia is associated with sleep-disordered breathing and endothelial dysfunction. Eur Respir J. 2006;27(2):328–333. doi: 10.1183/09031936.06.00010905. 2006/02/03 ed. [DOI] [PMC free article] [PubMed] [Google Scholar]
- 7.Sagheer F, Venkata C, Venkateshiah SB. A 26-year-old pregnant woman with fatigue and excessive daytime sleepiness. Moderate obstructive sleep apnea-hypopnea syndrome in pregnancy. [cited 2014 Jan 3];Chest [Internet] 2008 Sep;134(3):637–639. doi: 10.1378/chest.07-3046. Available from: http://www.ncbi.nlm.nih.gov/pubmed/18779199. [DOI] [PubMed] [Google Scholar]
- 8.Sahin FK, Koken G, Cosar E, Saylan F, Fidan F, Yilmazer M, et al. Obstructive sleep apnea in pregnancy and fetal outcome. [cited 2014 Jan 3];Int. J. Gynaecol. Obstet. [Internet] 2008 Feb;100(2):141–146. doi: 10.1016/j.ijgo.2007.08.012. Available from: http://www.ncbi.nlm.nih.gov/pubmed/17976624. [DOI] [PubMed] [Google Scholar]
- 9.Pilkington S, Carli F, Dakin MJ, Romney M, De Witt KA, Dore CJ, et al. Increase in Mallampati score during pregnancy. Br J Anaesth. 1995;74(6):638–642. doi: 10.1093/bja/74.6.638. 1995/06/01 ed. [DOI] [PubMed] [Google Scholar]
- 10.Olivarez SAA, Ferres M, Antony K, Mattewal A, Maheshwari B, Sangi-haghpeykar H, et al. Obstructive sleep apnea screening in pregnancy, perinatal outcomes, and impact of maternal obesity. Am J Perinatol. 2011;28(8):651–658. doi: 10.1055/s-0031-1276740. 2011/04/12 ed. [DOI] [PMC free article] [PubMed] [Google Scholar]
- 11.Louis JM, Auckley D, Sokol RJ, Mercer BM. Maternal and neonatal morbidities associated with obstructive sleep apnea complicating pregnancy. Am J Obs. Gynecol. 2010;202(3):e1–e5. doi: 10.1016/j.ajog.2009.10.867. 2009/12/17 ed 261. [DOI] [PubMed] [Google Scholar]
- 12.Loube DI, Poceta JS, Morales MC, Peacock MD, Mitler MM. Self-reported snoring in pregnancy. Association with fetal outcome. Chest. 1996;109(4):885–889. doi: 10.1378/chest.109.4.885. 1996/04/01 ed. [DOI] [PubMed] [Google Scholar]
- 13.Facco FL, Ouyang DW, Zee PC, Grobman Wa. Development of a pregnancy-specific screening tool for sleep apnea. J. Clin. Sleep Med. [Internet] 2012 Jan;8(4):389–394. doi: 10.5664/jcsm.2030. Available from: http://www.pubmedcentral.nih.gov/articlerender.fcgi?artid=3407257&tool=pmcentrez&rendertype=abstract. [DOI] [PMC free article] [PubMed] [Google Scholar]
- 14.Facco FL, Kramer J, Ho KH, Zee PC, Grobman WA. Sleep disturbances in pregnancy. Obs. Gynecol. 2010;115(1):77–83. doi: 10.1097/AOG.0b013e3181c4f8ec. 2009/12/23 ed. [DOI] [PubMed] [Google Scholar]
- 15.Pien GW, Fife D, Pack AI, Nkwuo JE, Schwab RJ. Changes in symptoms of sleep-disordered breathing during pregnancy. Sleep. 2005;28(10):1299–1305. doi: 10.1093/sleep/28.10.1299. 2005/11/22 ed. [DOI] [PubMed] [Google Scholar]
- 16.Olivarez SA, Maheshwari B, McCarthy M, Zacharias N, van den Veyver I, Casturi L, et al. Prospective trial on obstructive sleep apnea in pregnancy and fetal heart rate monitoring. Am J Obs. Gynecol. 2010;202(6):e1–e7. doi: 10.1016/j.ajog.2009.12.008. 2010/02/23 ed 552. [DOI] [PubMed] [Google Scholar]
- 17.Sandoval-Rincon M, Alcala-Lozano R, Herrera-Jimenez I, Jimenez-Genchi A. [Validation of the Epworth sleepiness scale in Mexican population] Gac Med Mex. 2013;149(4):409–416. 2013/09/04 ed. [PubMed] [Google Scholar]
- 18.Chica-Urzola HL, Escobar-Cordoba F, Eslava-Schmalbach J. [Validating the Epworth sleepiness scale] Rev Salud Publica. 2007;9(4):558–567. doi: 10.1590/s0124-00642007000400008. 2008/01/23 ed. [DOI] [PubMed] [Google Scholar]
- 19.Chiner E, Arriero JM, Signes-Costa J, Marco J, Fuentes I. [Validation of the Spanish version of the Epworth Sleepiness Scale in patients with a sleep apnea syndrome] Arch Bronconeumol. 1999;35(9):422–427. doi: 10.1016/s0300-2896(15)30037-5. 1999/12/22 ed. [DOI] [PubMed] [Google Scholar]
- 20.Netzer NC, Stoohs RA, Netzer CM, Clark K, Strohl KP. Using the Berlin Questionnaire to identify patients at risk for the sleep apnea syndrome. Ann. Intern. Med. 1999;131(7):485–491. doi: 10.7326/0003-4819-131-7-199910050-00002. [DOI] [PubMed] [Google Scholar]
- 21.Johns MW. Sensitivity and specificity of the multiple sleep latency test (MSLT), the maintenance of wakefulness test and the epworth sleepiness scale: failure of the MSLT as a gold standard. J Sleep Res. 2000;9(1):5–11. doi: 10.1046/j.1365-2869.2000.00177.x. 2000/03/25 ed. [DOI] [PubMed] [Google Scholar]
- 22.Rosenthal LD, Dolan DC. The Epworth sleepiness scale in the identification of obstructive sleep apnea. J Nerv Ment Dis. 2008;196(5):429–431. doi: 10.1097/NMD.0b013e31816ff3bf. 2008/05/15 ed. [DOI] [PubMed] [Google Scholar]
- 23.Johns MW. A new method for measuring daytime sleepiness: the Epworth sleepiness scale. Sleep. 1991;14(6):540–545. doi: 10.1093/sleep/14.6.540. 1991/12/01 ed. [DOI] [PubMed] [Google Scholar]
- 24.Iber C, Ancoli-Israel S, Chesson A, Quan SF. The AASM Manual for the Score of Sleep and Associated Events: Rules, Terminology, and Technical Specifications. 1st ed. Westchester, Illinois: American Academy of Sleep Medicine; 2007. [Google Scholar]
- 25.Oktay B, Rice TB, Atwood CW, Jr., Passero M, Jr., Gupta N, Givelber R, et al. Evaluation of a single-channel portable monitor for the diagnosis of obstructive sleep apnea. J Clin Sleep Med [Internet] doi: 10.5664/JCSM.1196. 2011/09/08 ed. 2011 Aug 15 [cited 2014 Jan 3]; 7(4)384–390. Available from: http://www.pubmedcentral.nih.gov/articlerender.fcgi?artid=3160740&tool=pmcentrez&rendertype=abstract. [DOI] [PMC free article] [PubMed]
- 26.Connolly G, Razak AR, Hayanga A, Russell A, McKenna P, McNicholas WT. Inspiratory flow limitation during sleep in pre-eclampsia: comparison with normal pregnant and nonpregnant women. Eur Respir J. 2001;18(4):672–676. doi: 10.1183/09031936.01.00053501. 2001/11/22 ed. [DOI] [PubMed] [Google Scholar]
- 27.ACOG practice bulletin. Diagnosis and management of preeclampsia and eclampsia. Number 33, January 2002. Obs. Gynecol. 2002;99(1):159–167. doi: 10.1016/s0029-7844(01)01747-1. 2005/09/24 ed. [DOI] [PubMed] [Google Scholar]
- 28.ACOG Practice Bulletin. Clinical management guidelines for obstetrician-gynecologists. Number 30, September 2001 (replaces Technical Bulletin Number 200, December 1994) Gestational diabetes. Obs. Gynecol. 2001;98(3):525–538. 2001/09/08 ed. [PubMed] [Google Scholar]
- 29.Franklin KA, Holmgren PA, Jonsson F, Poromaa N, Stenlund H, Svanborg E. Snoring, pregnancy-induced hypertension, and growth retardation of the fetus. Chest. 2000;117(1):137–141. doi: 10.1378/chest.117.1.137. 2000/01/13 ed. [DOI] [PubMed] [Google Scholar]
- 30.Chen YH, Kang JH, Lin CC, Wang IT, Keller JJ, Lin HC. Obstructive sleep apnea and the risk of adverse pregnancy outcomes. Am J Obs. Gynecol. 2012;206(2):e1–e5. doi: 10.1016/j.ajog.2011.09.006. 2011/10/18 ed 136. [DOI] [PubMed] [Google Scholar]
- 31.ACOG practice bulletin. Intrauterine growth restriction. Number 12, January 2000. Obs. Gynecol. 2000;95(1) [Google Scholar]
- 32.Sanderson DA, Wilcox MA, Johnson IR. The individualised birthweight ratio: a new method of identifying intrauterine growth retardation. Br J Obs. Gynaecol. 1994;101(4):310–314. doi: 10.1111/j.1471-0528.1994.tb13616.x. 1994/04/01 ed. [DOI] [PubMed] [Google Scholar]
- 33.Clinical Guidelines on the Identification, Evaluation, and Treatment of Overweight and Obesity in Adults--The Evidence Report. National Institutes of Health. Obes Res. 1998;6(Suppl 2):51S–209S. 1998/11/14 ed. [PubMed] [Google Scholar]
- 34.Obesity: preventing and managing the global epidemic. Report of a WHO consultation. World Heal. Organ Tech Rep Ser. 2000;894:i–xii. 1–253 2001/03/10 ed. [PubMed] [Google Scholar]
- 35.Guilleminault C, Palombini L, Poyares D, Takaoka S, Huynh NT, El-Sayed Y. Preeclampsia and nasal CPAP: part 1. Early intervention with nasal CPAP in pregnant women with risk-factors for pre-eclampsia: preliminary findings. Sleep Med. 2007;9(1):9–14. doi: 10.1016/j.sleep.2007.04.020. 2007/07/24 ed. [DOI] [PubMed] [Google Scholar]
- 36.O’Brien LM, Bullough AS, Owusu JT, Tremblay KA, Brincat CA, Chames MC, et al. Pregnancy-onset habitual snoring, gestational hypertension, and preeclampsia: prospective cohort study. Am J Obs. Gynecol. 2012;207(6):e1–e9. doi: 10.1016/j.ajog.2012.08.034. 2012/09/25 ed 487. [DOI] [PMC free article] [PubMed] [Google Scholar]
- 37.Louis J, Auckley D, Miladinovic B, Shepherd A, Mencin P, Kumar D, et al. Perinatal Outcomes Associated With Obstructive Sleep Apnea in Obese Pregnant Women. Obs. Gynecol. 2012 doi: 10.1097/AOG.0b013e31826eb9d8. 2012/09/26 ed. [DOI] [PMC free article] [PubMed] [Google Scholar]
- 38.Higgins N, Leong E, Park CS, Facco FL, McCarthy RJ, Wong CA. The Berlin Questionnaire for assessment of sleep disordered breathing risk in parturients and non-pregnant women. Int J Obs. Anesth. 2011;20(1):22–5. doi: 10.1016/j.ijoa.2010.09.010. 2010/12/03 ed. [DOI] [PubMed] [Google Scholar]
- 39.Poyares D, Guilleminault C, Hachul H, Fujita L, Takaoka S, Tufik S, et al. Pre-eclampsia and nasal CPAP: part 2. Hypertension during pregnancy, chronic snoring, and early nasal CPAP intervention. Sleep Med. 2007;9(1):15–21. doi: 10.1016/j.sleep.2007.04.019. 2007/07/24 ed. [DOI] [PubMed] [Google Scholar]
- 40.Antony KM, Agrawal A, Arndt ME, Murphy AM, Alapat PM, Guntupalli KK, et al. Obstructive Sleep Apnea in Pregnancy: Prevalence and Prediction. Submiss. to J. Perinatol. doi: 10.1038/jp.2014.48. [DOI] [PMC free article] [PubMed] [Google Scholar]
- 41.Ralls FM, Grigg-Damberger M. Roles of gender, age, race/ethnicity, and residential socioeconomics in obstructive sleep apnea syndromes. Curr Opin Pulm Med. 2012;18(6):568–73. doi: 10.1097/MCP.0b013e328358be05. 2012/09/20 ed. [DOI] [PubMed] [Google Scholar]
Associated Data
This section collects any data citations, data availability statements, or supplementary materials included in this article.