

Abstract
Contrast-enhanced ultrasound (US) imaging is potentially applicable to the clinical investigation of a wide variety of perfusion disorders. Quantitative analysis of perfusion is not widely performed, and is limited by the fact that data are acquired from a single tissue plane, a situation that is unlikely to accurately reflect global perfusion. Real-time perfusion information from a tissue volume in an experimental rabbit model of testicular torsion was obtained with a two-dimensional matrix phased array US transducer. Contrast-enhanced imaging was performed in 20 rabbits during intravenous infusion of the microbubble contrast agent Definity® before and after unilateral testicular torsion and contralateral orchiopexy. The degree of torsion was 0° in 4 (sham surgery), 180° in 4, 360° in 4, 540° in 4, and 720° in 4. An automated technique was developed to analyze the time history of US image intensity in experimental and control testes. Comparison of mean US intensity rate of change and of ratios between mean US intensity rate of change in experimental and control testes demonstrated good correlation with testicular perfusion and mean perfusion ratios obtained with radiolabeled microspheres, an accepted “gold standard”. This method is of potential utility in the clinical evaluation of testicular and other organ perfusion.
1. Introduction
Contrast-enhanced ultrasound (US) imaging is potentially applicable to the clinical investigation of a wide variety of perfusion disorders (Abramowicz, 2005; Charnley et al., 2009; Eyding et al., 2002; Kaufmann et al., 2007; Klauser et al., 2005; Lassau et al., 2007; Lencioni et al., 2007; Pallwein et al., 2007; Singh et al., 2008; Weber, 2009). Conventional techniques of contrast-enhanced harmonic US imaging are typically employed in the subjective assessment of organ perfusion. Quantitative analysis of perfusion is not widely performed, and is limited by the fact that data are acquired from a single tissue plane, a situation that is unlikely to accurately reflect global perfusion of the tissue or organ under consideration (Paltiel et al., 2006; Su et al., 2009; Thierman et al., 2006; Wei et al., 1998; Wei et al., 2001).
Diagnosis of testicular torsion currently relies on a qualitative determination of reduced testicular perfusion by color Doppler imaging and spectral analysis. Prior investigations have documented limitations of available techniques used to investigate testicular vascular disorders, especially in children, where testicular volumes are relatively small and normal blood flow rates are low (Eaton et al., 2005; Kalfa et al., 2004; Karmazyn et al., 2005; Nussbaum Blask et al., 2002). In particular, testicular torsion may be difficult to diagnose in the prepubertal population (Choyke, 2000). Prompt diagnosis of testicular torsion and surgical intervention are necessary in order to re-establish testicular perfusion as salvage rates are directly related to the duration of ischemia (Koh et al., 1995). Recent studies by Paltiel et al. (2006), and Thierman et al. (2006) have shown that both qualitative and quantitative analysis of perfusion information derived from 2D contrast-enhanced pulse inversion imaging in a rabbit model of testicular ischemia are superior to qualitative analysis of conventional color and power Doppler imaging.
The recent development of matrix phased array US transducers for three-dimensional (3D) imaging permits real-time interrogation of a tissue volume. To date, these transducers have been largely employed in the investigation of disorders of myocardial contractility and cardiac valvular disease (Pemberton et al., 2005; Salehian and Chan, 2005). However, dynamic imaging of a tissue volume during a constant infusion of contrast material offers a potential method for achieving 4D perfusion information. The goal of our study, therefore, was to exploit the rapid frame rates available with a 2D matrix phased array US transducer to obtain a real-time, volumetric assessment of testicular parenchymal perfusion in an experimental animal model of unilateral testicular torsion.
2. Materials and methods
2.1 Animal selection
The study was performed according to a protocol approved by the Animal Care and Use Committee of Children’s Hospital Boston, in accordance with the Guiding Principles for Research Involving Animals and Human Beings as adopted by The American Physiological Society, and conformed to guidelines issued by the National Institutes of Health for care of laboratory animals. Use of the rabbit in experimental models of testicular ischemia and torsion is well established (Paltiel et al., 2006; Thierman et al., 2006; Brown et al., 1997; Coley et al., 1996; Frush et al., 1995; O'Hara et al., 1996). Twenty adult male New Zealand white rabbits (Millbrook Breeding Labs, Amherst, MA) with a mean weight of 4.4 kg were studied.
2.2 Animal Preparation
General anesthesia was induced with Glycopyrrolate (American Reagent Laboratories, Inc., Shirley, NY) 0.04 mg/kg intramuscularly (IM), followed by Ketamine (Fort Dodge Animal Health, Overland Park, KS) 10 mg/kg intravenously (IV), and Acepromazine Maleate (Fort Dodge Animal Health, Overland Park, KS) 0.5 mg/kg IV. An endotracheal tube was placed to protect the airway (3-F cuffed tube, Teleflex Medical, Research Triangle Park, NC), and the animals placed on a ventilator. Anesthesia was maintained with 0.25–3% Isoflurane (Baxter, Deerfield, IL) mixed with oxygen and delivered via the trachea. A catheter was inserted into an ear vein for purposes of US contrast agent administration (BD Insyte™ Autoguard™, BD Medical, Sandy, UT). Straight catheters were inserted into the ascending aorta just above the aortic valve (3-F Morpheus® CT PICC, AngioDynamics, Queensbury, NY) for radiolabeled-microsphere injection and into one femoral artery (3-F; Cook, Bloomington, IN) for blood pressure monitoring and for obtaining reference blood samples. Heparin flushes were administered through the venous and arterial catheters. Ambient temperature was held constant. Heart rate, respiratory rate, and oxygen saturation were continuously monitored. For pain control prior to scrotal incision and testicular torsion, the rabbits received a bilateral spermatic cord block containing Bupivacaine (AstraZeneca, Wilmington, DE) 0.2 mg/kg and Lidocaine (Hospira, Inc., Lake Forest, IL) 1mg/kg.
2.3 Surgical Procedure
The rabbit fur overlying the scrotum was removed using a commercially available topical depilation agent (Nair™ or Veet®).
Following the baseline 3D US studies (see below), bilateral medial, ventral scrotal incisions were made under sterile conditions and the scrotal layers dissected to the tunica vaginalis. The testes were exposed, and unilateral torsion with contralateral orchiopexy was performed. The testes were then secured in place and the overlying scrotum closed. Rabbits underwent either unilateral 0° (sham surgery; n=4), 180 ° (n=4), 360° (n=4), 540° (n=4) or 720° (n=4) of spermatic cord torsion after which the postoperative 3D US studies were performed. Apart from the sham surgery group where neither testis underwent torsion, each of the remaining experimental groups consisted of two rabbits where the right testis underwent torsion and two rabbits where the left testis underwent torsion. The intra-aortic catheter was always placed via the groin opposite the torsive testis. In the sham surgery group, the intra-aortic inguinal catheter was located in the right groin in three rabbits, and in the left groin in one rabbit.
2.4 Contrast Agent Administration
The US contrast agent Definity® (Lantheus Medical Imaging, Inc., Billerica, MA) was used in the study. This contrast agent consists of a perflutren lipid-coated microsphere composed of octafluoropropane encapsulated in an outer lipid shell. The mean diameter of the microspheres ranges from 1.1–3.3 µm. One mL of contrast agent suspension contains a maximum of 1.2×10¹⁰ perflutren microspheres. 1.3 mL of contrast agent suspension was reconstituted with normal saline (0.9% NaCl solution) to yield a 20 mL solution. The contrast agent solution was placed in a plastic syringe that was connected to the ear vein catheter by means of an infusion pump (model 55-1111; Harvard Apparatus, South Natick, MA). Contrast was infused at a rate of 160 mL/hr for 2 minutes for both baseline and postoperative studies, resulting in a dose of approximately 0.35 mL of Definity® per study, and a total dose of 0.7 mL of Definity® per experimental animal. Between infusions, the syringe was gently rotated and inverted to re-suspend the contrast agent, which had a tendency to settle out of solution over time.
2.5 Image acquisition
Due to the current impossibility of performing microbubble destruction and reperfusion imaging simultaneously within a tissue volume with a 3D matrix phased array US transducer, we decided to investigate tissue perfusion during the contrast washin phase. Preliminary testing was performed to determine whether such changes were even detectable without harmonic imaging and without first destroying the US microbubbles. These qualitative observations and subsequent analysis of the data from these tests indicated that intensity rise as a function of time could consistently be detected by numeric analysis, even in cases where intensity change was not visually apparent on the US machine display.
3D contrast-enhanced US imaging was performed using an IU22 unit (Philips Medical Systems, Bothell, WA) and a 7-2 MHz matrix phased array transducer during the continuous IV infusion of Definity® at baseline and immediately postoperatively, as described above. Imaging was performed with the US probe fixed by means of a custom-built mechanical arm over the mid-transverse scrotum so as to include both testes within the field of view. The mechanical arm rested on a non-absorbing, agar-based standoff pad designed specifically for the study in order to provide coupling and to increase the distance between the probe and the testes (figure 1). Conventional gray-scale imaging was performed with the persistence turned off. The dynamic range was set automatically at +50 dB for every study and was not altered following contrast administration.
Figure 1.
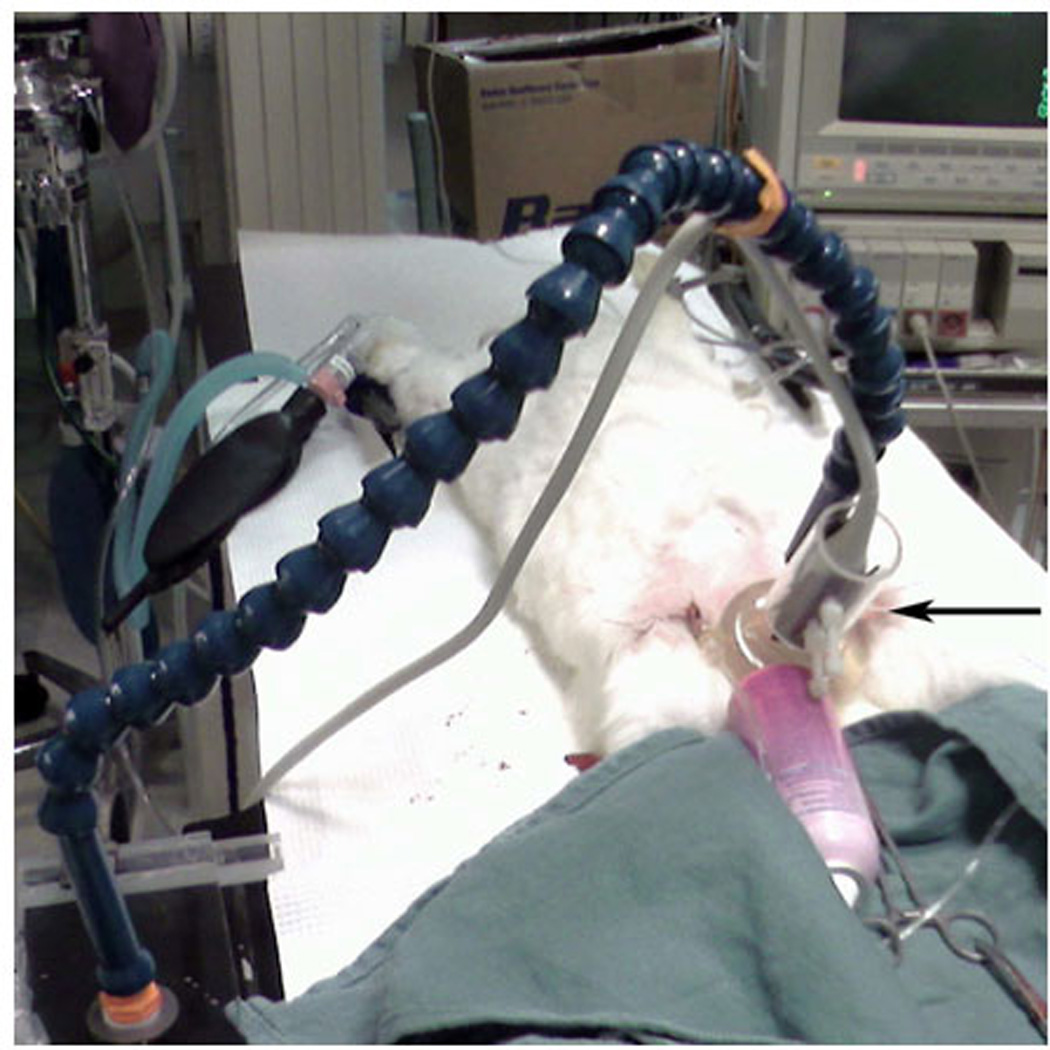
The 3D US transducer (black arrow) rests on a gel standoff pad that overlies the rabbit scrotum and is held in place by a mechanical arm.
At baseline and immediately postoperatively, an IV infusion of Definity® was established, delivering a constant infusion of contrast material over the entire imaging period. Volumetric data were acquired uniformly at 1-second sampling intervals over a two minute period during washin of contrast. We investigated the washin phase of contrast tissue enhancement since this approach was expected to yield meaningful data with respect to perfusion differences induced by varying degrees of obstruction of testicular arterial inflow and venous outflow. Unlike standard contrast infusion techniques that use pulse inversion imaging to maximize signal scattering from contrast material, the 3D mode did not have this capability. Furthermore, there was no possibility of delivering a burst of high-energy US pulses into the testicular tissue with the 3D probe to cause microbubble destruction. Given these limitations, we chose to time image acquisition to be simultaneous with contrast infusion. The resulting 4D dataset represented US spatial and temporal signal intensity, which was log-compressed by the Philips US system software using a standard frequency compounding method to decrease the dynamic range of the intensity data to fit 8 bit, 0–255 pixel values and to decrease speckle noise. All data were subsequently transferred to a personal computer for image processing and analysis.
2.6 Regional Perfusion Measurements
Reference testicular perfusion measurements were obtained using a radiolabeled microsphere technique (Heymann et al., 1977; Matsumoto et al., 1982). Immediately following US evaluation, radiolabeled microspheres were injected into the proximal ascending aorta and a reference arterial blood sample was obtained for subsequent determination of true testicular perfusion. A different radioisotope was used for the baseline (Ruthenium-103) and postoperative (Scandium-46) imaging sessions (PerkinElmer Life and Analytical Sciences, Billerica, MA). Each radioisotope has a unique photon energy and can therefore be measured independently. For every perfusion measurement, a 0.2 mL solution containing 10 µCi (0.74 MBq) of 15 µm diameter radiolabeled microspheres was injected into the ascending aortic catheter and flushed with approximately 5 mL of saline solution over a period of about 20 seconds. A reference blood sample was simultaneously removed from the femoral artery with a 5 mL syringe and withdrawal pump (model 55–1143; Harvard Apparatus, Holliston, MA) at a rate of 2.0 mL/min for 1.5 minutes. The withdrawal interval was measured with an electronic timer. At the conclusion of the experiment, each rabbit was sacrificed with an IV dose of pentobarbital (1 mL/4.5 kg). The testes were then removed and immediately sectioned for regional perfusion determination.
Each testis was used in its entirety for perfusion measurement by sectioning it longitudinally into four strips. The tissue and reference blood samples were weighed on a balance (model AB204; Mettler-Toledo, Greifensee, Switzerland). Radioactivity of the tissue and of the reference blood samples was measured in a deep-well gamma counter (Packard, Downers Grove, IL). Perfusion at each time point was determined by comparing counts for the appropriate radioisotope in the testicular tissue samples to counts in the reference blood samples. Regional perfusion measurements (expressed as [mL · g−1]/min of testicular tissue) for each tissue sample were determined. The perfusion measurements for the four individual tissue strips were averaged to obtain a mean baseline and postoperative perfusion measurement for each testis.
2.7 Image Processing
For numeric analysis, the DICOM files were imported into MATLAB® for processing. Images were converted from a raw 4D DICOM format into a 256 (width)×176 (height)×208 (depth)×120 (time) 4D matrix representing the three spatial dimensions and time. Width and height refer to the dimensions parallel to the transducer face. The 7-2 MHz matrix phased array transducer has a spatial resolution ranging from 0.22 to 0.27 mm axially×0.27 to 0.34 mm radially, depending upon the imaging field of view, which was set at maximum for all studies. The temporal resolution was 1 frame/sec.
Since data were acquired from the start of contrast infusion, the time history contained a reference period of several seconds prior to contrast arrival in the testicular tissues. The initial time volume was used as a background reference with all subsequent images subtracted by this reference. Because the pertinent information involved the net change in signal intensity as a function of time, and testicular motion was negligible from frame to frame in the cineloop, subtraction permitted small changes in the data to be more readily detected. Stepping through time, the algorithm calculated mean intensity over volumes containing the right and left testes, respectively. The volume was then divided in half in order to isolate the response from each testis. Justification of this simple method was based on the anatomical separation between the right and left testes, which is located at approximately the midline of each image.
The entire segmented testicular volume was selected as the region-of-interest (ROI) for the right or left testis, respectively. This approach to the selection of the ROI accomplished the goals of automating image processing by removing the subjective element inherent in an arbitrary selection of a smaller ROI (or multiple ROIs) within each testis. In addition, by assessing each testis in its entirety, we increased the chances of detecting focal zones of decreased perfusion.
2.8 Quantitative Image Analysis
Acquisition of volumetric data and the use of a constant IV infusion of US contrast in place of the more commonly employed bubble disruption in a single plane followed by replenishment merited an examination of the expected washin curve behavior. In the case of planar disruption, replenishment has been modeled in the form of a vascular network with blood flowing at varying velocities (Hudson et al., 2009). This configuration predicts a rapid flow period that saturates to a constant value after approximately 10 to 20 seconds. In the case of constant perfusion, a velocity distribution would also be expected, but with the additional complexity of a net increase in bubble density as a function of time due to the constant infusion. This increase would be expected to continue until the bubble outflow is in equilibrium with bubble inflow. This process has been observed to cause an approximately linear rise in contrast echo intensity over a period of about 2 to 3 minutes. A nonlinear signal would be expected in the first few seconds, due to a combination of the initial introduction of contrast into the imaging volume and the temporal density increase. However, as contrast fills the volume of interest, this curve would become approximately linear, with a slope proportional to blood flow. Under the assumption that the mass of tissue within the imaging volume is constant, it follows that the curve would likewise be proportional to the perfusion rate.
A linear least squares technique (Björck, 1996) was implemented to fit the initial rise-phase of the mean signal intensity for the right and left testicular volumes. Perfusion-fill curves are known to follow a cumulative distribution function (Foss, 1970), so this linear fit was understood to represent a first order Taylor approximation of the curve. The slope of the fit was then determined for each experiment, in order to correlate these values with the radiolabeled microsphere perfusion data. Image intensity was not calibrated to acoustic intensity and therefore recorded in terms of arbitrary units (au), such that the slope was calculated in au per second (au/s). The standard deviation of the residuals was used to assess error in the fit. In this process, the uncertainty in the curve was determined by calculating the maximum and minimum slopes that fit within one standard deviation from the curve using only vertical offsets.
Both the 3D contrast-enhanced US image intensity data and the radiolabeled microsphere perfusion data were further analyzed by subtracting the baseline values of each experiment from the post-operative values to assess change in the signal intensity rate-of-change relative to the baseline measurement (for US) and change in perfusion (for radiolabeled microspheres).
Since the 3D contrast-enhanced US image intensity data and the radiolabeled microsphere perfusion data are recorded in inherently different units of measurement, in addition to direct calculation of the image intensity slope described above, ratios comparing the mean testicular US signal intensity changes in the intervention (I) testis compared to the contralateral control (C) testis were also determined for both the baseline and postoperative studies. Uncertainty in the ratios was calculated by determining the standard deviation of the data. These ratios were then compared to the I/C testicular perfusion ratios obtained with radiolabeled microspheres.
Scatter plots were used to assess the linear correlation between all baseline and postoperative I/C testicular image intensity ratios obtained with 3D contrast-enhanced US and the perfusion ratios obtained with radiolabeled microspheres. To avoid potential bias caused by the large number of baseline points, all of which are ideally expected to have the same value, a second comparison was also considered, which was restricted solely to postoperative values. Agreement between the postoperative I/C ratios of both techniques was then further examined by plotting the results of each as a function of the degree of torsion.
3. Results
Data from 40 separate experiments were processed by the automated program. Representative imaging data from a mid-scrotal plane within a 3D volume is depicted in movie clip 1.
Processed images (figure 2) reflect the cumulative change in signal intensity
| (1) |
Figure 2.

At baseline, the cumulative change in signal intensity for both right (R) and left (L) testes depicted in movie clip 1 is comparable (a). After 720° of left-sided torsion there is a visually obvious decrease in cumulative signal intensity within the left testis compared to the right testis (b).
The graphical output of the MATLAB® program for a series of sample experiments depicting increasing degrees of unilateral testicular torsion is illustrated in figure 3.
Figure 3.


Mean US signal intensity over testicular volume is plotted against time in seconds at baseline (a), after unilateral sham surgery (b), and unilateral torsion of 180° (c), 360° (d), 540° (e), and 720° (f).
Baseline perfusion as measured by radiolabeled microspheres averaged 0.269 mL/g/min ± standard deviation (SD) 0.096 in the intervention testis and 0.269 mL/g/min ± SD 0.093 in the control testis. The baseline radiolabeled microsphere I/C testicular perfusion ratio ranged from 0.71 to 1.48 with a mean of 1.02 ± SD 0.191. These values were similar whether the intervention side was right or left. The corresponding baseline measurement of the US rate of intensity change (slope) averaged 0.106 ± SD 0.044 au/s in the intervention testis and 0.099 ± SD 0.043 au/s in the control testis. The baseline US slope ratios ranged from 0.70 to 1.84 with a mean of 1.08 ± SD 0.287. These values were similar whether the intervention side was right or left.
After unilateral testicular torsion, perfusion of the intervention testis as measured by radiolabeled microspheres decreased as the degree of occlusion increased, while perfusion of the control testis remained comparatively constant (table 1).
Table 1.
Mean Postoperative Radiolabeled Microsphere-Based Perfusion Measurements and Intervention/Control Testicular Perfusion Ratios According to Occlusion Level
| Occlusion Level |
No. of Animals |
Perfusion of Intervention Testis ([mL·g−1]/min) +/− SD |
Perfusion of Control Testis ([mL·g−1]/min) +/− SD |
Intervention/ Control Testis Ratio +/− SD |
|---|---|---|---|---|
| 0° (sham) | 4 | 0.299+/−0.215 | 0.315+/−0.166 | 0.925+/−0.342 |
| 180° | 4 | 0.254+/−0.058 | 0.300+/−0.060 | 0.858 +/−0.212 |
| 360° | 4 | 0.215+/−0.065 | 0.223+/−0.173 | 0.972+/−0.162 |
| 540° | 4 | 0.026+/−0.046 | 0.275+/−0.173 | 0.101+/−0.185 |
| 720° | 4 | 0.003+/−0.003 | 0.300+/−0.091 | 0.013+/−0.014 |
Although the postoperative I/C testicular radiolabeled microsphere perfusion ratio decreased as the severity of testicular torsion increased from milder levels of occlusion (i.e. ≤ 360°) to more severe occlusion (i.e. ≥ 540°, p < 0.0001), the perfusion ratios for 0°, 180° and 360° of torsion did not differ significantly (p ≥ 0.16). The corresponding US slope measurements of the intervention testis also generally decreased as a function of occlusion level, although the mildest level of occlusion (180°) was not significantly different from sham surgery (0°), while the US slope measurements of the control testis remained relatively constant. Mirroring the behavior of the postoperative I/C testicular radiolabeled microsphere perfusion ratio, the postoperative contrast-enhanced US I/C testicular signal intensity ratio decreased as the severity of testicular torsion increased from milder levels of occlusion (i.e. ≤ 360°) to more severe levels of occlusion (i.e. ≥ 540°). However, the postoperative US I/C testicular signal intensity ratios for 0°, 180° and 360° of torsion did not differ significantly, (p ≥0.19), nor did the ratios for 540° and 720° of torsion (table 2, p = 0.35).
Table 2.
Mean Postoperative Contrast-Enhanced 3D Ultrasound Intensity Change and Intervention/Control Testicular Intensity Ratios According to Occlusion Level
| Occlusion Level |
No. of Animals |
Intensity Change Intervention Testis (au/sec) +/− SD |
Intensity Change Control Testis (au/sec) +/− SD |
Intervention/ Control Testis Ratio +/− SD* |
|---|---|---|---|---|
| 0° (sham) | 4 | 0.097+/−0.039 | 0.107+/−0.734 | 1.032+/−0.286 |
| 180° | 4 | 0.139+/−0.083 | 0.124+/−0.069 | 1.160+/−0.292 |
| 360° | 4 | 0.085+/−0.092 | 0.092+/−0.091 | 1.300+/−0.493 |
| 540° | 4 | 0.014+/−0.017 | 0.081+/−0.080 | 0.171+/−0.221 |
| 720° | 4 | 0.023+/−0.021 | 0.121+/−0.112 | 0.211+/−0.043 |
I/C ratios were determined individually for each experiment, followed by calculation of the mean of the ratios for each level of occlusion
Trends in radiolabeled microsphere and 3D contrast-enhanced US imaging measures of testicular parenchymal signal intensity as a function of the degree of torsion are illustrated in figure 4. Inspection of these curves reveals a similar trend between the two measurement techniques.
Figure 4.


Rate of change in US image intensity as a function of degree of torsion (a) follows a trend resembling that of the radiolabeled microsphere measurements (b). The data for both graphs were plotted after subtracting the baseline from the intervention values for the US and the radiolabeled microsphere measurements, respectively.
A scatter plot of all of the 3D contrast-enhanced US I/C testicular signal intensity ratios versus all of the radiolabeled microsphere I/C perfusion ratios (i.e. both baseline and postoperative values) demonstrates a correlation coefficient of 0.79 (p < 0.0001, figure 5).
Figure 5.

Scatter plot of all baseline and all postoperative 3D contrast enhanced US I/C intensity rate of change ratios compared to all baseline and postoperative I/C radiolabeled microsphere testicular perfusion ratios.
A plot restricted to a comparison of postoperative 3D contrast-enhanced US I/C testicular signal intensity ratios versus the post-operative radiolabeled microsphere I/C testicular perfusion ratios reveals a correlation coefficient of 0.90 (p < 0.0001, figure 6).
Figure 6.
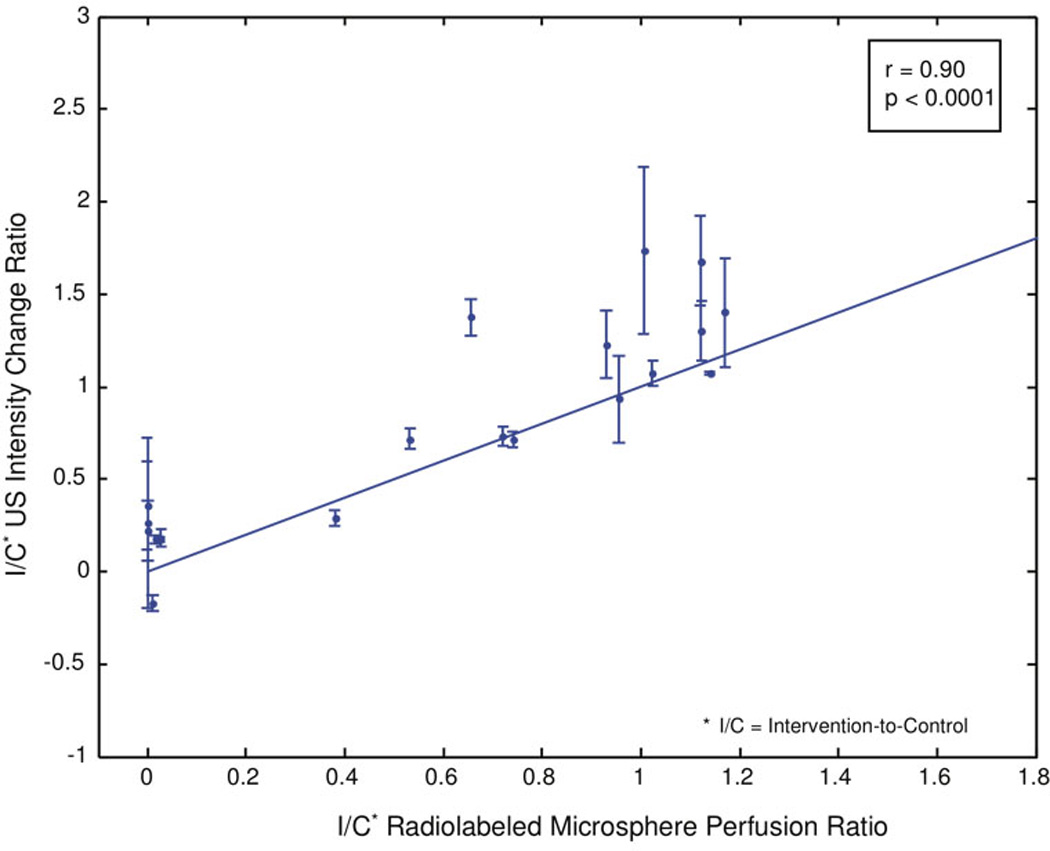
Scatter plot of postoperative 3D contrast-enhanced US I/C intensity rate of change ratios compared to all postoperative I/C radiolabeled microsphere perfusion ratios.
A scatter plot of all postoperative mean I/C ratios determined by both 3D contrast-enhanced US signal intensity and radiolabeled microsphere testicular perfusion measurements compared to the degree of testicular torsion shows good agreement between the two techniques for all levels of torsion (figure 7).
Figure 7.

Scatter plot of mean postoperative I/C contrast-enhanced US testicular signal intensity ratios and mean postoperative radiolabeled microsphere testicular perfusion ratios compared to the degree of testicular torsion.
4. Discussion
In the clinical setting of acute testicular pain, it is critical to accurately determine whether or not the symptomatic testis is ischemic. Large discrepancies in perfusion between the two testes on conventional US with Doppler evaluation do not usually pose a diagnostic dilemma, whereas more subtle differences may be diagnostically challenging. Clinical US diagnosis of testicular torsion relies on a purely subjective assessment of relative testicular perfusion. Since current clinical examination techniques are not always reliable, the potential contribution of a readily performed, accurate method for analysis of tissue perfusion is considerable.
Contrast-enhanced US imaging of testicular perfusion is an experimental technique not currently approved for clinical use in the United States. In an earlier study by Thierman et al. (2006), we investigated the use of two automated algorithms in the analysis of perfusion information derived from 2D contrast-enhanced pulse inversion image clips in a rabbit model of testicular ischemia. While these automated methods proved superior to qualitative image analysis by two readers in determining relative testicular perfusion, image analysis was restricted to data acquired from a single tissue plane, which is not necessarily representative of perfusion to the testis as a whole (Paltiel et al., 2006).
US transducers commonly used in clinical examination of the scrotum do not permit simultaneous acquisition of time-intensity data from multiple tissue planes. However, the 3D matrix phased array US transducer used in this study did permit the simultaneous acquisition of multiplanar testicular parenchymal signal intensity information. Data from multiple planes yields information about signal intensity change in the direction orthogonal to the image planes, and also provides an opportunity for more accurate alignment between the left and right testes for comparison purposes.
There were several limitations to this investigation: (1) the 3D transducer used in the study was not designed with volumetric contrast imaging capability in mind. Typical use of US contrast material with conventional 2D imaging involves the initial saturation of the bubbles in the relevant tissue, followed by destruction and rapid reperfusion back to the known initial saturation level. Images are generally acquired using a pulse inversion mode which is not available in 3D. Due to the current impossibility of performing microbubble destruction and reperfusion imaging simultaneously within a tissue volume, investigation of tissue perfusion was restricted to the contrast washin phase. Hence, measurement relied on subtle grayscale changes that were often not visible on the unprocessed images; (2) the geometry of the 3D transducer was not optimal for the performance of scrotal imaging; (3) the size difference between the US contrast agent microbubbles (approximately 15 µm) and the radiolabeled microspheres (approximately 1.1-3.3 µm) is not insubstantial, since vessels of a different order of magnitude are investigated with each technique. Furthermore, the radiolabeled microsphere method of perfusion measurement used as the “gold” standard in this study is itself subject to error. These facts, in turn, might explain some of the differences in the measurements obtained by the two techniques used in this investigation (Bassingthwaighte et al., 1987; Yen and Fung, 1978; Lindner et al., 2002); and (4) the automated system used compressed image data that necessarily resulted in limitation of the dynamic range such that the sensitivity to small signal intensity changes may have been compromised.
Neither US contrast nor radiolabeled microspheres permitted an accurate distinction between non-torsion and milder levels of testicular torsion (i.e. < 540 degrees). It has been well-documented in the literature that the severity of vascular compromise may vary significantly for a given degree of spermatic cord rotation for reasons that are not entirely clear, although anatomical variability may account for these differences (Bentley et al., 2004). This variability in ischemic response to testicular torsion is most apparent at lower degrees of testicular torsion, and has been observed in both experimental and clinical settings, in our previous work as well as in the work of others (Paltiel et al., 2006; Thierman et al., 2006; Frush et al., 1995; Bentley et al., 2004; Cassar et al., 2008; Hormann et al., 2004; Lee et al., 1996). Testicular torsion that results in a diminution but not complete cessation of flow to the symptomatic testis is generally referred to as “partial” or “incomplete” torsion. The degree of torsion in such cases is usually 360 degrees or less (Hormann et al., 2004; Lee et al., 1996). Both techniques employed in this study simply confirmed that testicular perfusion is variably compromised at lower degrees of torsion. As such, the US contrast measurements are an accurate reflection of testicular perfusion.
Although there was a positive correlation between the postoperative I/C contrast-enhanced US testicular signal intensity ratios and mean postoperative radiolabeled microsphere testicular perfusion ratios compared to the degree of testicular torsion when torsion was ≤ 540°, there was a negative correlation coefficient with a torsion level of 720° (figure 7). We believe that this negative correlation is a result of a systematic offset between the two ratios, i.e. the radiolabeled microsphere ratios trend toward zero, whereas the ultrasound contrast ratios never reach zero. A nonzero intensity change measurement might indicate that there is still a small amount of flow into the testis that the microsphere technique cannot detect, or it may simply be a background "speckle-like" artifact where contrast from outside the volume of interest manifests itself as a positive intensity within the imaging volume.
A potentially fruitful avenue for further investigation may lie in the analysis of change in US microbubble replenishment curve shape induced by varying degrees of testicular torsion. Potdevin et al. (2004) have shown in phantom experiments that the shape of the replenishment curve is substantially affected by the range of velocities within an ROI. Our preliminary analysis was based on an examination of a simple linear correlation between a 3D contrast-enhanced US microbubble intensity change and a radiolabeled microsphere perfusion measurement. This correlation was performed empirically, without regard to a precise model of anticipated testicular parenchymal perfusion. The US data generally agreed with the "gold standard" perfusion measurements acquired with radiolabeled microspheres. With both techniques, no significant change was observed between baseline and 180° of torsion, although rates of signal intensity change and radiolabeled microsphere perfusion values decreased with increasing levels of testicular torsion greater than 180°.
For a direct dimensionless comparison of the data, ratios of the I/C testicular measurements with each technique were linearly correlated. Our results suggest that a higher-order fit of the data might result in an even stronger correlation. However, additional data are required to better establish the relevance of this trend. Future work will investigate the underlying equations in order to better predict the relationship between US microbubble signal intensity and testicular parenchymal perfusion.
Of note, in clinical practice, the algorithm used in the current experiment could be implemented in real-time by the US imager, thereby eliminating the need to store and transfer data.
5. Conclusions
Changes in perfusion within a tissue volume can be detected and analyzed with real-time 3D acquisition of US contrast-enhanced images. 3D parenchymal signal intensity measurements are of potential utility in the diagnosis of gonadal torsion, ischemia and infarction of native viscera and organ transplants. Our preliminary data demonstrate good correlation of 3D contrast-enhanced testicular parenchymal US signal intensity measurements with tissue perfusion measurements obtained with radiolabeled microspheres. The results also suggest that a higher-order fit of the US data might result in an even stronger correlation.
Acknowledgements
The work of HJ Paltiel was supported in part by a CIMIT New Concept Award funded by U.S. Army Acquisition Activity, Cooperative Agreement W81XWH-09-2-0011, and by the loan of US equipment by Royal Philips Electronics. The work of GT Clement was supported in part by National Institutes of Health Grant U41 RR01970.
Footnotes
PACS codes:
43.35.Yb Ultrasonic instrumentation and measurement techniques
43.58.-e Acoustical measurements and instrumentation
43.60.-c Acoustic signal processing
43.60.Gk Space-time signal processing, other than matched field processing
43.80.Qf Medical diagnosis with acoustics
43.80.Vj Acoustical medical instrumentation and measurement techniques
87.57.N-Image analysis
87.63.D-Ultrasonography
87.63.dh Ultrasonographic imaging
87.85.Pq Biomedical imaging
Video Captions
Movie clip 1 (created with Final Cut Pro; exported as .avi files; codec used: Cinepak). (a) US microbubbles can be seen flowing into the right (R) and left (L) testicular parenchyma at baseline. (b) After 720° of left-sided torsion, there is a subtle qualitative decrease in the flow of US microbubbles into the left testis.
References
- Abramowicz JS. Ultrasonographic contrast media: has the time come in obstetrics and gynecology? J. Ultrasound Med. 2005;24:517–531. doi: 10.7863/jum.2005.24.4.517. [DOI] [PubMed] [Google Scholar]
- Bassingthwaighte JB, Malone MA, Moffett TC, King RB, Little SE, Link JM, Krohn KA. Validity of microsphere depositions for regional myocardial flows. Am J Physiol. 1987;253:H184–H193. doi: 10.1152/ajpheart.1987.253.1.H184. [DOI] [PMC free article] [PubMed] [Google Scholar]
- Bentley DF, Ricchiuti DJ, Nasrallah PF, McMahon DR. Spermatic cord torsion with preserved testis perfusion: initial anatomical observations. J. Urol. 2004;172:2373–2376. doi: 10.1097/01.ju.0000145527.08591.27. [DOI] [PubMed] [Google Scholar]
- Björck Å. Numerical methods for least squares problems. Philadelphia, PA: Society for Industrial and Applied Mathematics (SIAM); 1996. [Google Scholar]
- Brown JM, Taylor KJ, Alderman JL, Quedens-Case C, Greener Y. Contrast-enhanced ultrasonographic visualization of gonadal torsion. J. Ultrasound Med. 1997;16:309–316. [PubMed] [Google Scholar]
- Cassar S, Bhatt S, Paltiel HJ, Dogra VS. Role of spectral Doppler sonography in the evaluation of partial testicular torsion. J. Ultrasound Med. 2008;27:1629–1638. doi: 10.7863/jum.2008.27.11.1629. [DOI] [PubMed] [Google Scholar]
- Charnley N, Donaldson S, Price P. Imaging angiogenesis. Methods Mol. Biol. 2009;467:25–51. doi: 10.1007/978-1-59745-241-0_2. [DOI] [PubMed] [Google Scholar]
- Choyke PL. Dynamic contrast-enhanced MR imaging of the scrotum: reality check. Radiology. 2000;217:14–15. doi: 10.1148/radiology.217.1.r00oc4414. [DOI] [PubMed] [Google Scholar]
- Coley BD, Frush DP, Babcock DS, O'Hara SM, Lewis AG, Gelfand MJ, Bove KE, Sheldon CA. Acute testicular torsion: comparison of unenhanced and contrast-enhanced power Doppler, US, color Doppler US, and radionuclide imaging. Radiology. 1996;199:441–446. doi: 10.1148/radiology.199.2.8668791. [DOI] [PubMed] [Google Scholar]
- Eaton SH, Cendron MA, Estrada CR, Bauer SB, Borer JG, Cilento BG, Diamond DA, Retik AB, Peters CA. Intermittent testicular torsion: diagnostic features and management outcomes. J. Urol. 2005;174:1532–1535. doi: 10.1097/01.ju.0000177726.84913.cc. discussion 5. [DOI] [PubMed] [Google Scholar]
- Eyding J, Wilkening W, Postert T. Brain perfusion and ultrasonic imaging techniques. Eur. J. Ultrasound. 2002;16:91–104. doi: 10.1016/s0929-8266(02)00042-3. [DOI] [PubMed] [Google Scholar]
- Foss SD. A method of exponential curve fitting by numerical integration. Biometrics. 1970;26:815–821. [Google Scholar]
- Frush DP, Babcock DS, Lewis AG, Paltiel HJ, Rupich R, Bove KE, Sheldon CA. Comparison of color Doppler sonography and radionuclide imaging in different degrees of torsion in rabbit testes. Acad. Radiol. 1995;2:945–951. doi: 10.1016/s1076-6332(05)80693-2. [DOI] [PubMed] [Google Scholar]
- Heymann MA, Payne BD, Hoffman JI, Rudolph AM. Blood flow measurements with radionuclide-labeled particles. Prog. Cardiovasc. Dis. 1977;20:55–79. doi: 10.1016/s0033-0620(77)80005-4. [DOI] [PubMed] [Google Scholar]
- Hormann M, Balassy C, Philipp MO, Pumberger W. Imaging of the scrotum in children. Eur. Radiol. 2004;14:974–983. doi: 10.1007/s00330-004-2248-x. [DOI] [PubMed] [Google Scholar]
- Hudson JM, Karshafian R, Burns PN. Quantification of flow using ultrasound and microbubbles: a disruption replenishment model based on physical principles. Ultrasound Med. Biol. 2009;35:2007–2020. doi: 10.1016/j.ultrasmedbio.2009.06.1102. [DOI] [PubMed] [Google Scholar]
- Kalfa N, Veyrac C, Baud C, Couture A, Averous M, Galifer RB. Ultrasonography of the spermatic cord in children with testicular torsion: impact on the surgical strategy. J. Urol. 2004;172:1692–1695. doi: 10.1097/01.ju.0000138477.85710.69. discussion 5. [DOI] [PubMed] [Google Scholar]
- Karmazyn B, Steinberg R, Kornreich L, Freud E, Grozovski S, Schwarz M, Ziv N, Livne P. Clinical and sonographic criteria of acute scrotum in children: a retrospective study of 172 boys. Pediatr. Radiol. 2005;35:302–310. doi: 10.1007/s00247-004-1347-9. [DOI] [PubMed] [Google Scholar]
- Kaufmann BA, Wei K, Lindner JR. Contrast echocardiography. Curr. Probl. Cardiol. 2007;32:51–96. doi: 10.1016/j.cpcardiol.2006.10.004. [DOI] [PubMed] [Google Scholar]
- Klauser A, Demharter J, De Marchi A, Sureda D, Barile A, Masciocchi C, Faletti C, Schirmer M, Kleffel T, Bohndorf K. Contrast enhanced gray-scale sonography in assessment of joint vascularity in rheumatoid arthritis: results from the IACUS study group. Eur. Radiol. 2005;15:2404–2410. doi: 10.1007/s00330-005-2884-9. [DOI] [PubMed] [Google Scholar]
- Koh KB, Dublin N, Light T. Testicular torsion. Aust N. Z. J. Surg. 1995;65:645–646. doi: 10.1111/j.1445-2197.1995.tb00672.x. [DOI] [PubMed] [Google Scholar]
- Lassau N, Chami L, Benatsou B, Peronneau P, Roche A. Dynamic contrast-enhanced ultrasonography (DCE-US) with quantification of tumor perfusion: a new diagnostic tool to evaluate the early effects of antiangiogenic treatment. Eur. Radiol. 2007;17(Suppl 6):F89–F98. doi: 10.1007/s10406-007-0233-6. [DOI] [PubMed] [Google Scholar]
- Lee FT, Jr, Winter DB, Madsen FA, Zagzebski JA, Pozniak MA, Chosy SG, Scanlan KA. Conventional color Doppler velocity sonography versus color Doppler energy sonography for the diagnosis of acute experimental torsion of the spermatic cord. AJR. Am. J. Roentgenol. 1996;167:785–790. doi: 10.2214/ajr.167.3.8751701. [DOI] [PubMed] [Google Scholar]
- Lencioni R, Della Pina C, Crocetti L, Bozzi E, Cioni D. Clinical management of focal liver lesions: the key role of real-time contrast-enhanced US. Eur. Radiol. 2007;17(Suppl 6):F73–F79. doi: 10.1007/s10406-007-0231-8. [DOI] [PubMed] [Google Scholar]
- Lindner JR, Song J, Jayaweera AR, Sklenar J, Kaul S. Microvascular rheology of Definity microbubbles after intra-arterial and intravenous administration. J. Am. Soc. Echocardiogr. 2002;15:396–403. doi: 10.1067/mje.2002.117290. [DOI] [PubMed] [Google Scholar]
- Matsumoto M, Kimura K, Fujisawa A, Matsuyama T, Asai T, Uyama O, Yoneda S, Abe H. Regional blood flows measured in Mongolian gerbil by a modified microsphere method. Am. J. Physiol. 1982;242:H990–H995. doi: 10.1152/ajpheart.1982.242.6.H990. [DOI] [PubMed] [Google Scholar]
- Nussbaum Blask AR, Bulas D, Shalaby-Rana E, Rushton G, Shao C, Majd M. Color Doppler sonography and scintigraphy of the testis: a prospective, comparative analysis in children with acute scrotal pain. Pediatr. Emerg. Care. 2002;18:67–71. doi: 10.1097/00006565-200204000-00001. [DOI] [PubMed] [Google Scholar]
- O'Hara SM, Frush DP, Babcock DS, Lewis AG, Barr LL, Bukowski TP, Kline-Fath BM, Sheldon CA. Doppler contrast sonography for detecting reduced perfusion in experimental ischemia of prepubertal rabbit testes. Acad. Radiol. 1996;3:319–324. doi: 10.1016/s1076-6332(96)80249-2. [DOI] [PubMed] [Google Scholar]
- Pallwein L, Mitterberger M, Gradl J, Aigner F, Horninger W, Strasser H, Bartsch G, zur Nedden D, Frauscher F. Value of contrast-enhanced ultrasound and elastography in imaging of prostate cancer. Curr Opin Urol. 2007;17:39–47. doi: 10.1097/MOU.0b013e328011b85c. [DOI] [PubMed] [Google Scholar]
- Paltiel HJ, Kalish LA, Susaeta RA, Frauscher F, O'Kane PL, Freitas-Filho LG. Pulse-inversion US imaging of testicular ischemia: quantitative and qualitative analyses in a rabbit model. Radiology. 2006;239:718–729. doi: 10.1148/radiol.2393050210. [DOI] [PubMed] [Google Scholar]
- Pemberton J, Li X, Kenny A, Davies CH, Minette MS, Sahn DJ. Real-time 3-dimensional Doppler echocardiography for the assessment of stroke volume: an in vivo human study compared with standard 2-dimensional echocardiography. J. Am. Soc. Echocardiogr. 2005;18:1030–1036. doi: 10.1016/j.echo.2005.03.009. [DOI] [PubMed] [Google Scholar]
- Potdevin TC, Fowlkes JB, Moskalik AP, Carson PL. Analysis of refill curve shape in ultrasound contrast agent studies. Med. Phys. 2004;31:623–632. doi: 10.1118/1.1649534. [DOI] [PubMed] [Google Scholar]
- Salehian O, Chan KL. Impact of three-dimensional echocardiography in valvular heart disease. Curr. Opin. Cardiol. 2005;20:122–126. doi: 10.1097/01.hco.0000153453.52965.67. [DOI] [PubMed] [Google Scholar]
- Singh V, Saunders C, Wylie L, Bourke A. New diagnostic techniques for breast cancer detection. Future Oncol. 2008;4:501–513. doi: 10.2217/14796694.4.4.501. [DOI] [PubMed] [Google Scholar]
- Su HL, Qian YQ, Wei ZR, He JG, Li GQ, Zhang J, Zhou XD, Jing W. Real-time myocardial contrast echocardiography in rat: infusion versus bolus administration. Ultrasound Med. Biol. 2009;35:748–755. doi: 10.1016/j.ultrasmedbio.2008.09.018. [DOI] [PubMed] [Google Scholar]
- Thierman JS, Clement GT, Kalish LA, O'Kane PL, Frauscher F, Paltiel HJ. Automated sonographic evaluation of testicular perfusion. Phys. Med. Biol. 2006;51:3419–3432. doi: 10.1088/0031-9155/51/14/010. [DOI] [PubMed] [Google Scholar]
- Weber MA. Ultrasound in the inflammatory myopathies. Ann. N.Y. Acad. Sci. 2009;1154:159–170. doi: 10.1111/j.1749-6632.2009.04390.x. [DOI] [PubMed] [Google Scholar]
- Wei K, Jayaweera AR, Firoozan S, Linka A, Skyba DM, Kaul S. Quantification of myocardial blood flow with ultrasound-induced destruction of microbubbles administered as a constant venous infusion. Circulation. 1998;97:473–483. doi: 10.1161/01.cir.97.5.473. [DOI] [PubMed] [Google Scholar]
- Wei K, Le E, Bin JP, Coggins M, Thorpe J, Kaul S. Quantification of renal blood flow with contrast-enhanced ultrasound. J. Am. Coll. Cardiol. 2001;37:1135–1140. doi: 10.1016/s0735-1097(00)01210-9. [DOI] [PubMed] [Google Scholar]
- Yen RT, Fung YC. Effect of velocity of distribution on red cell distribution in capillary blood vessels. Am. J. Physiol. 1978;235:H251–H257. doi: 10.1152/ajpheart.1978.235.2.H251. [DOI] [PubMed] [Google Scholar]