Abstract
Aim of the Study:
The complex hospital environment requires special attention to ensure a healthy indoor air quality (IAQ) to protect patients and healthcare workers against hospital-acquired infections and occupational diseases. Poor hospital IAQ may cause outbreaks of building-related illness such as headaches, fatigue, eye, and skin irritations, and other symptoms. The general objective for this study was to assess IAQ inside a large University hospital at Al-Khobar City in the Eastern Province of Saudi Arabia.
Materials and Methods:
Different locations representing areas where most activities and tasks are performed were selected as sampling points for air pollutants in the selected hospital. In addition, several factors were studied to determine those that were most likely to affect the IAQ levels. The temperature and relative percent humidity of different air pollutants were measured simultaneously at each location.
Results:
The outdoor levels of all air pollutant levels, except volatile organic compounds (VOCs), were higher than the indoor levels which meant that the IAQ inside healthcare facilities (HCFs) were greatly affected by outdoor sources, particularly traffic. The highest levels of total suspended particulates (TSPs) and those less than 10 microns (PM10) inside the selected hospital were found at locations that are characterized with m4ore human activity.
Conclusions:
Levels of particulate matter (both PM10 and TSP) were higher than the Air Quality Guidelines (AQGs). The highest concentrations of the fungal species recorded were Cladosporium and Penicillium. Education of occupants of HCF on IAQ is critical. They must be informed about the sources and effects of contaminants and the proper operation of the ventilation system.
Keywords: Air pollutants, air quality guidelines, biological pollutants, hospital environment, indoor air quality, outdoor air pollution, traffic activity, university campuses
INTRODUCTION
The complex hospital environment requires special attention to ensure healthful indoor air quality (IAQ) to protect patients and healthcare workers against hospital-acquired (nosocomial) infections and occupational diseases. Poor hospital IAQ may cause outbreaks of building-related illness such as headaches, fatigue, eye, and skin irritations, and other symptoms.[1,2,3,4,5,6] The Air of indoor environments in healthcare facilities (HCFs) contains a variety of particles and gaseous contaminants such as carbon dioxide (CO2), carbon monoxide (CO), formaldehyde (CH2O), total volatile organic compounds (VOCs), respirable suspended particulates, radon, glutaraldehyde (C5H8O2), nitrous oxide (N2O), latex allergens, and total bacterial count.[1] These contaminants are commonly referred to as indoor air pollutants.[7,8,9,10,11,12,13]
Indoor pollutants, particularly particles, originate from both indoor and outdoor sources. The indoor sources include office equipment (such as printers, fax machines, and photocopiers), cleaning equipment and products, ventilation systems, and personal activities. Although smoking is considered an important source of indoor air pollution, most or all HCF are smoke-free. The outdoor sources include vehicle emissions, industrial, and construction activities. Toxicity of particulate matter (PM) depends greatly on their size, less than 10 or 2.5 microns (PM10 or PM2.5) considered especially dangerous since they can easily penetrate the lungs into the alveoli.[14,15,16,17,18,19,20,21,22,23]
Carbon monoxide (CO) is extremely toxic and combines with hemoglobin to form carboxyhaemoglobin (COHb), which reduces the oxygen supply to body tissues. At elevated levels, symptoms of exposure include headaches, decreased alertness, nausea, fatigue, rapid breathing, chest pain, confusion, and impaired judgment.[24,25,26,27]
The VOCs include a variety of chemicals, some of which have higher concentrations indoors than outdoors. Some VOCs at high concentrations can have acute and chronic health effects, while others pose some risk of cancer.[28]
Bioaerosols are airborne particles produced by living organisms. Such bioaerosols include pollen, seeds, bacteria, gram negative bacterial endotoxins, molds (fungi), algae, protozoans, flour, latex, and animal dander/waste products. Some bioaerosols are hazardous since they are infectious and/or produce allergens and toxins.[29] Methicillin-resistant Staphylococcus aureus (MRSA) has in the last 3 decades, evolved as one of the most important causes of hospital infections worldwide.[30,31]
The selected hospital in Al-Khobar City has more than 500 beds with about 62% average total bed occupation per year and an average of 9 days occupancy/bed/case with an average of 11779 inpatient/year. The total number of employees comprises 1577, with 507doctors, 481 nurses, 284 technicians, 244 allied health workers, 30 administrative employees, and 31 other workers. The hospital has three types of departments: Medical, diagnostic, and administrative. Sources of air pollution within the hospital include emissions of chemicals and microbial air pollutants from various sources such as medical and diagnostic departments, heating, ventilating, and air conditioning systems, personal and service vehicles on the premises of the hospital, renovations going on in the hospital itself and traffic outside the main building of the hospital. Outside, the hospital is surrounded by residential buildings on three sides, while on the fourth, there is a road for vehicular traffic.
The aim of this study was to assess IAQ levels inside a large hospital in Al-Khobar City, an example of large governmental hospitals in Saudi Arabia. This study will be considered an initial indicator for other similar facilities in the Kingdom of Saudi Arabia.
MATERIALS AND METHODS
Study design
Different locations where most activities and tasks are performed inside the hospital were selected as sampling points for air pollutants. These locations were the main entrance of the hospital, the burns unit, the labs (both chemistry and biology), the emergency department, the intensive care unit (ICU), the kitchen, the Outpatients Department (OPD), the Operation Room (OR), and the pediatric unit. In addition, three locations outside the hospital near the gate were selected at an elevation of about 1.5 m (the human breathing zone) to study outdoor air quality levels. Other factors studied included the type of activity carried out at each selected location inside the hospital, time of the day, and the effect of level of temperature and of percent relative humidity (RH) in the IAQ level inside the selected hospital.
Measurements of chemical air pollutants
Levels of total suspended particulate (TSP), particulate materials less than 10 Micron (PM10), CO, VOCs, sulfur dioxide (SO2), nitrogen dioxide (NO2), and biological pollutants were measured in this study at each location inside and outside the hospital. The temperatures and percent RH were recorded, simultaneously with the measurement of air pollutants using the Kestrel 4500 instrument.
Levels of the selected air pollutants were measured on 2 working days (Sunday and Tuesday) every week during the cold months (fall and winter) and the hot months (spring) of the academic year 2011-2012. The sampling procedure was conducted at two different times from 8 to 9 am and 10 to 11 am each day. The first period represented the most important rush hour traffic outside and activity within the hospital building, particularly at the gates and the car park. The other period represented a relatively quieter period of the day from the point of view of vehicular traffic.
Levels of all gaseous air pollutants were measured directly by the GrayWolf's DirectSense® mobile PC-based products, AdvancedSense™ meters, and Wolf Pack™ area monitor (2012), which combines the latest available electrochemical gas sensor technology with the advanced capability of mobile computing for simultaneous measurement of several gases, with a high sensitive detection limit starting from 0. Levels of VOCs were assessed by the EntryRAE PGM-3000 Multi-Gas Monitor (SKU RAE046-P111-100, 2006), which is used to monitor VOCs in the indoor and outdoor environment because of its detection range of 0-9.99 ppm. At each measuring point, several readings were taken for each pollutant in parts per million (ppm) (a reading every 10 min) with a total of 12 readings per day.
Samples of TSP were collected with a Hand-Held Battery Portable Air Sampler, while samples of PM10 were collected using the StaplexMiniVol® Tactical Air Sampler (TAS, Airmetrics manufactures), which was developed jointly by Airmetrics and the United States Environmental Protection Agency. The TSP sample was collected on 60 mm fiber glass filters carried in a filter holder assembly with a flow rate of 10 L/min, its level further determined gravimetrically in microgram of dust per cubic meter of air (μg/m3). At each measuring point, only one continuous sample was collected during each period because of the nature of technique and instruments used for collecting such air pollutants.
Measurements of biological air pollutants
Inside the selected hospital, samples of microbial air pollutants were collected from the ORs, pediatrics (ward, emergency clinic), burns unit, and ICU (pediatric, medical, and surgery) and outdoor samples were collected from each selected location once a week at 8-10 am to measure fungal spores.
The spore samples were collected with the Bio-culture bump one stage impaction sampler (Zefon Int. Inc.). The samples were collected on (Saburaud's Dextrose) agar surface at 1.2 m height (breathing zone) in the middle of each department at a flow rate of 100 L/min for a total period of ten min. The sampling plates were then incubated inverted for seven days at 28°C and the counting and primary identification for fungal spores then done.
Bacterial sampling was achieved with the Bio-culture pump. On Chromogenic MRSA agar (Oxoid) which is designed for the screening of Staphylococcus aureus resistance to methicillin. The α-glocosidase produced by Staphylococcus aureus cleaves to the chromogenic substrate and turns the Staphylococcus aureus colony blue. The cefoxitin inhibits the growth of Staphylococcus aureus sensitive to methicillin. Plates were incubated aerobically at 35 ± 2°C for 18-24 h.[32]
RESULTS
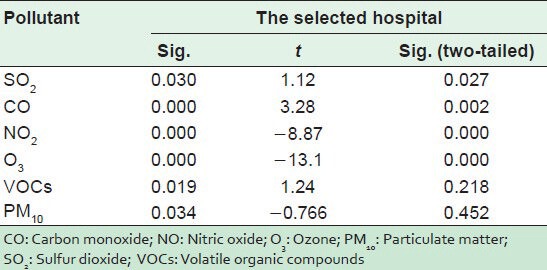
Figures 1 and 2 represent the average levels of PM10, TSP, CO, SO2, NO2, O3, and VOCs in the indoor and outdoor environments of the selected hospital. It is clear that outdoor levels of all air pollutant, except VOCs, were higher than the indoors levels. This means that the IAQ inside HCFs are greatly affected by the outdoors, particularly by the movement of traffic.[22] However, the indoor levels of VOCs were higher than those outdoors because the sources of these pollutant in the HCFs are the chemicals used for disinfecting and cleaning. Statistically, there were very strong significant differences for all pollutants (P < 0.05) as shown in Table 1.
Figure 1.
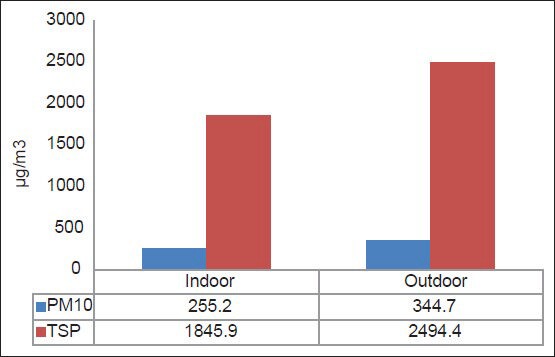
Average levels of PM10 and TSP inside and outside the selected hospital
Figure 2.
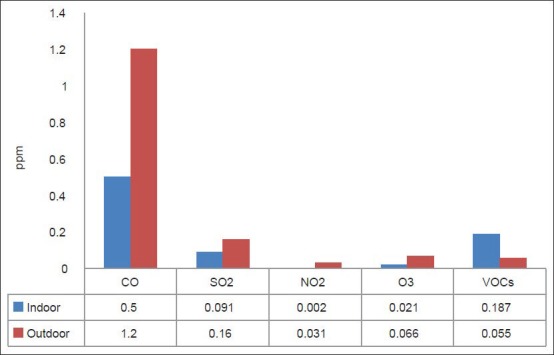
Average levels of gaseous pollutants inside and outside the selected hospital
Table 1.
T test values for inside and outside air pollutant levels
Figures 3 and 4 represent the average levels of selected pollutants at different locations in the selected hospital. It is evident that the highest levels of PM10 were found at locations characterized with the most human activity, which is considered a main source of PM in an indoor environment because of the excitation of PM from shoes, clothes, and ground to the air. These locations include the main entrance, the kitchen, and patient rooms.
Figure 3.
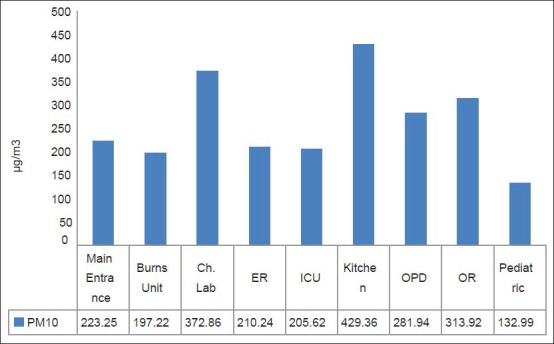
Average levels of PM10 at different departments inside the selected hospital
Figure 4.
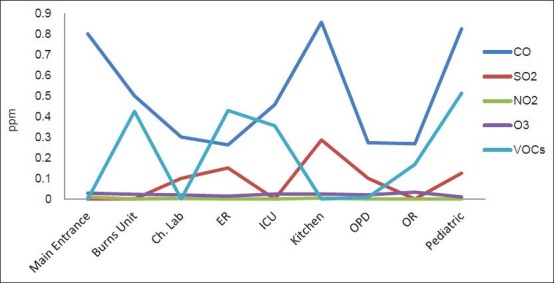
Average levels of gaseous pollutants at different departments inside the selected Hospital
The levels of gaseous pollutants differed from one location to another depending on their relation to the roads outside. For example, levels of CO were the highest in patient rooms because of their location and windows that were adjacent to the roads. The levels of VOCs were linked to locations where quick patient treatment is given, for instance in areas where vaccinations are given or burns treated with disinfectants, and where other cleaning materials are used. For this reason, the highest levels of this pollutant were obtained in the emergency room (ER), burns unit, men's facility, and the pediatric department.
To study the relation between temperature and levels of air pollution in the selected hospital, the Pearson correlation test was applied to the results of measured pollutants and the temperature taken at the same time [Table 2]. The Table indicates that there is a positive moderate correlation between the temperature inside the hospital and levels of O3, while there was a positive weak correlation for SO2 and VOCs and a moderate negative correlation for PM, CO, and NO2. The same Table shows that there is a statistically significant difference (P < 0.05) for CO, NO2, and O3.
Table 2.
Pearson correlation for air pollutant, temperature and humidity
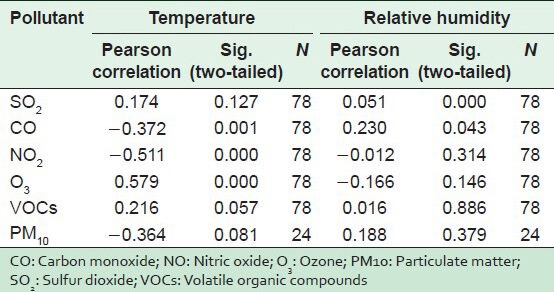
To study the relation between percent RH and the levels of air pollution in the selected hospital, the Pearson Correlation test was applied to the results of measured pollutants and the temperatures taken at the same time [Table 2]. The table shows a positive weak correlation between RH inside hospital and levels of SO2, PM, CO, and VOCs and a negative weak correlation for O3 and NO2. The same Table shows a statistically significant difference for CO and SO2 (P < 0.05).
Table 3 also depicts a comparison of the average levels of air pollutants in the selected hospital measured in this study with the Air Quality Guidelines (AQGs) proposed by different international agencies such as U.S. Environmental Protection Agency[33] and the World Health Organization.[34,35] The average levels and (guidelines) for CO, SO2, NO2, O3, and VOCs were 0.5 (9.0), 0.0908 (0.14), 0.00154 (0.05).,0211 (0.08), and 0.187 (0.24) ppm, respectively, while for PM10 and TSP, they were 255.2 (150) and 1845.9 (150) μg/m3, respectively. It is clear that levels of PM (both PM10 and TSP) were higher than the recommended values. The levels of the other pollutants were lower than the AQG. These results indicate the importance of taking precautions and control measures to prevent or reduce levels of dust in all sensitive indoor environments, particularly in HCFs.
Table 3.
Guidelines of indoor air quality and meteorological factors
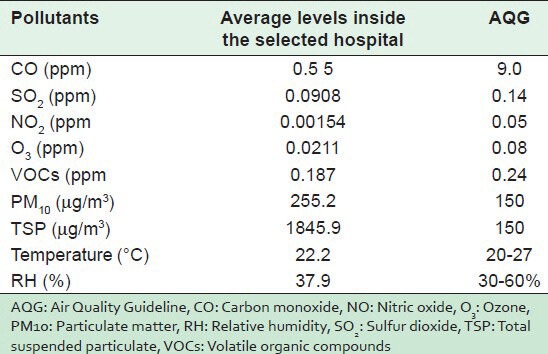
Figure 5 represents isolated fungal spore species concentrations inside and outside the selected hospital. The ER department showed the highest concentrations of different fungal species especially for Cladosporium mean ± Standard Deviation (STDEV) 4 ± 3.7469, Penicillium 4.0 ± 0.3464, and yeast -3.4 ± 1.249, with a total count of 9.6 ± 5.4, while the lowest total count was recorded in ICU (1.68 ± 1.3). However in relation to outdoors, the ER department still showed higher concentrations than outdoors (8.8 ± 3.9) as regards the total fungal spore concentration.
Figure 5.
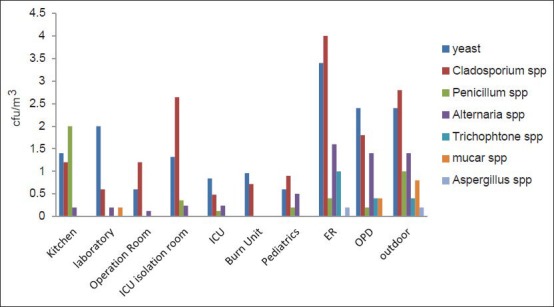
Isolated fungal spores species concentrations inside and outside the selected Hospital
The statistical analysis of results in Tables 4 and 5 shows a statistically significant difference between humidity and the fungal spore concentration on one side and between the occupant density and MRSA concentration on the other (P < 0.05). Figure 6 indicates the relationship between humidity and total fungal spore count (TFSC) in different areas of the selected hospital.
Table 4.
Fungal spore concentration in relation to humidity, temperature and occupant density
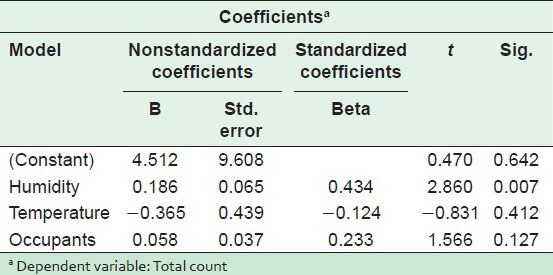
Table 5.
Methicillin-resistant Staphylococcus aureus concentration in relation to humidity, temperature and occupant density
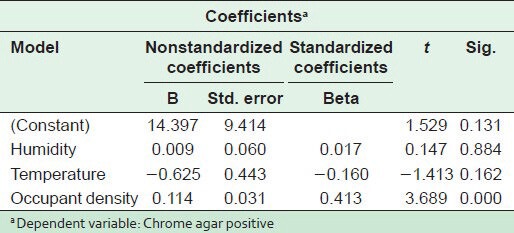
Figure 6.
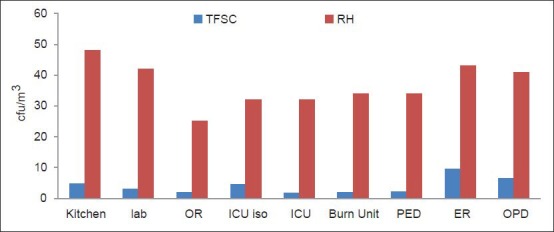
The relationship between humidity and TFSC at different departments in the selected Hospitals
Figure 7 presents the average level of chrome agar positive MRSA isolates in the indoor air of the selected hospital. The ER department had the highest concentrations, followed by the OPD, while the lowest value was recorded in the OR.
Figure 7.
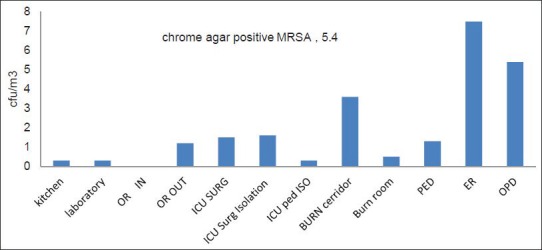
Chrome agar positive MRSA isolates in the indoor air inside the selected Hospital
DISCUSSION
Several factors including outdoor activity, the location of the activity in the healthcare facility, temperatures and percentage of the RH were studied in the survey. Air pollution that originates from the atmosphere outdoors from traffic and combustion processes that penetrate the indoor air is likely to be close or lower than what obtains outdoors.[36] Vehicular Pollution is predominant and contributes significantly to the problems of urban air quality. Recent evidence indicates that road traffic emissions are major source of air pollution in urban areas with subsequent adverse effect on human health.[37,38,39]
IAQ is also influenced by the indoor sources of pollution, including the characteristics of the building and the habits of the residents. Thus, levels of the indoor pollutants differ from one location to another according to the type and number of activities carried out in each location.
Temperature stratification is a common problem resulting from the fact that light warm air rises and heavier, cooler air sinks. When the ventilation system is not able to circulate the air properly, the temperature near the ceiling can be several degrees warmer or cooler than at floor level. Inside HCFs, the temperature is affected by factors such as the outside temperature and the efficiency of mechanical ventilation system in the hospital.[24] Room hygiene and thermal comfort levels are very much related to humidity levels. High humidity levels result in the absorption of moisture by the building materials to support microbial growth and increase the settling rate of aerosols. This is because the heavy droplets become dry and remain suspended in the air for longer periods. The American Society of Heating, Refrigeration, and Air-conditioning Engineers (ASHRAE) recommends acceptable ranges of temperature and percent relative humidity for comfort. In the winter, the range 20-24°C is acceptable temperature, and 30-60% is acceptable for RH, while in the summer, 23-27°C is an acceptable range of temperature, and the same for percent RH.[40,41] As shown in table 3, the average temperature and percent RH were within the recommended values which reflect an efficient system of ventilation in the hospital.
Nosocomial infections transmitted by the airborne route, especially fungal infection such as aspergillosis, are a major source of morbidity and mortality in immunocompromised patients. Bio-aerosols, of which fungal spores are one of the major types of microorganisms, can be present in all hospital environments, and may be transmitted through indoor and outdoor air, visitors, patients, and air conditioners.
The patterns of airborne fungi and MRSA and their concentrations in indoor air in the selected hospital were studied in this research. Regarding the TFSC, the ER department showed the highest concentrations of different fungal species especially for Cladosporium, Penicillium, and yeast. The same profile was detected outdoors which proves that the outdoors were the source of the indoor fungi as shown in Figure 5. These results were in accord with Sautour et al.,[42] who reported that Cladosporium was the dominant genus (55%), while in the clinical units it was Penicillium (23-25%). Moreover, Kim et al.,[43] reported that the predominant genera of airborne fungi identified in a general hospital were Cladosporium (30%) and Penicillium (20-25%).
All Chrome-agar positive colonies were tested by coagulase test to confirm the Staphylococcus aureus identity as MRSA. In the selected hospital, the highest isolation rate was at the ER department where it was 7.5 ± 6.51, followed by the OPD at 5.4 ± 6.51, followed by the burn reception area (corridor) at 3.6 ± 7.67. The lowest concentration was in the kitchen, laboratory, and pediatric intensive care isolation unit (0.3 ± 0.5). These results were in accord with Kim et al.[43] Mean concentrations of airborne bacteria and fungi were the highest in main lobby, followed by the surgical ward, ICU, and biomedical laboratory. The predominant genera of airborne bacteria identified in the general hospital were Staphylococcus spp. (50%).
Moreover, factors like humidity, temperature, and occupant density were tested against the concentration of airborne fungal spores and MRSA. The humidity affected the concentrations of airborne fungi at the surveyed hospital. The frequent use of doors, the high respiration activity by the large number of visitors, and patients and the leaks in the ventilation system in some old parts of the hospital, tended to increase the humidity and affect the number of airborne fungi [Figures 5 and 6]. These results accorded with Tang[44] who reported that the temperature and RH suitable for the growth of fungi were 26°Celsius and 50-60%, respectively.
Previous studies have shown that indoor air depends on several factors including the number of people present and their standard of hygiene, the quality of the hospital system, and the mechanical movement within the enclosed space. In poor overcrowded wards, the high number of patients confined to a small space results in a buildup of airborne microbes shed by the human bodies. In the present study [Figure 7], the number of occupants affected the number of isolated airborne microorganisms with regard to MRSA using impaction method. This was in accord with Tang et al.,[45] in the study at medical ICU at Chang Gung Memorial Hospital in northern Taiwan which found that patient visitation impacted on the indoor climate in the ICU environment.
Quantitative study of different hospital units showed that the children's and the female wards had the highest total bacterial count, followed by the bacteriology laboratory. The microbial counts recorded for the public hospital (Central Hospital) was higher than the private hospital (Faith Medical Center). The public hospital which is subsidized in order to give greater access to the poor in the society attracts more people than the private hospital, where the fees are high. These (patient) findings could be explained by many factors including the number of visitors for the children and female wards, which was far in excess of visitors in other hospital units. Substances brought from outside such as personal belongings, food and fruits, commonly found in children's and female wards are recognized as sources of hospital contamination. Humans and their activities affect concentrations of bacteria, which are transmitted through activities such as movement, talking, coughing, and sneezing.[46]
CONCLUSIONS AND RECOMMENDATION
Levels of PM (both PM10 and TSP) were higher than the AQG. The highest concentrations of different fungal species recorded were Cladosporium, followed by Penicillium. Education of occupants of HCFs on IAQ is critical. They should be provided with information on the sources and effects of contaminants and the proper operation of ventilation systems. In addition, the location of the healthcare facilities should be carefully selected, so that they are removed from any direct sources of noise or air pollution such as roads or industrial areas.
Footnotes
Source of Support: Nil
Conflict of Interest: None declared
REFERENCES
- 1.Leung M, Chan AH. Control and management of hospital indoor air quality. Med Sci Monit. 2006;12:SR17–23. [PubMed] [Google Scholar]
- 2.Germany: WHO; 2007. World Health Organization (WHO). Development of WHO guidelines for indoor air quality: Dampness and mould. [PubMed] [Google Scholar]
- 3.Spain: IFHE; 2008. International Federation of Hospital Engineering (IFHE). Indoor air quality in hospital environments. [Google Scholar]
- 4.Vazifeshenas Y, Sajadi H. Kuwait: Proceedings of the tenth international conference enhanced building operations; 2010. Enhancing residential building operation through its envelope; pp. 26–8. [Google Scholar]
- 5.Nakata Y, Kawasaki Y, Matsukawa K, Goto T, Niimi Y, Morita S. Pollution of the medical air at a university hospital in the metropolitan Tokyo area. J Clin Anesth. 2002;14:193–5. doi: 10.1016/s0952-8180(01)00383-x. [DOI] [PubMed] [Google Scholar]
- 6.Berne RM, Levy MN, Koeppen B, Stanton BA. Physiology. 4th ed. St Louis, Missouri: Mosby Publishers; 1998. [Google Scholar]
- 7.Leong ST, Muttamara S. Preliminary study of relationship between outdoor and indoor air pollutant concentrations at bangkok's major streets. Thammasa Int J Sc Tech. 2003;8:29–39. [Google Scholar]
- 8.Gusten J, Strindehag O. Experiences of measured taken to improve the air quality in schools. Air Infiltration Rev. 1995;16:5–8. [Google Scholar]
- 9.U.S. Environmental Protection Agency (EPA). Indoor air quality and student performance. [internet] 2013. [cited 2013 Jan 1]. Available from: http://www.neisd.net/env_health/documents/IAQandstudentperformance.pdf .
- 10.Nazaroff WW, Weschler CJ. Indoor air and the public good. Indoor Air. 2001;11:143–4. doi: 10.1034/j.1600-0668.2001.011003143.x. [DOI] [PubMed] [Google Scholar]
- 11.Denmark: WHO regional office for Europe; 2010. WHO. Guidelines for indoor air quality: Selected pollutants. [PubMed] [Google Scholar]
- 12.Geneva, Switzerland: WHO; 2002. WHO. The World Health Report 2002 -Reducing risks, promoting healthy life. [DOI] [PubMed] [Google Scholar]
- 13.Franklin PJ. Indoor air quality and respiratory health of children. Paediatr Respir Rev. 2007;8:281–6. doi: 10.1016/j.prrv.2007.08.007. [DOI] [PubMed] [Google Scholar]
- 14.Canada: The Minister of National Health and Welfare; 1995. Minister of National Health and Welfare. Indoor air quality in office buildings: A technical guide. [Google Scholar]
- 15.Lai AC, Ho YW. Spatial concentration variation of cooking emitted particles in a residential kitchen. Build Environ. 2008;43:871–6. [Google Scholar]
- 16.See SW, Balasubramanian R. Risk assessment of exposure to indoor aerosols associated with Chinese cooking. Environ Res. 2006;102:197–204. doi: 10.1016/j.envres.2005.12.013. [DOI] [PubMed] [Google Scholar]
- 17.Brunekreef B, Forsberg B. Epidemiological evidence of effects of coarse airborne particles on health. Eur Respir J. 2005;26:309–18. doi: 10.1183/09031936.05.00001805. [DOI] [PubMed] [Google Scholar]
- 18.Choudhury AH, Gordian ME, Morris SS. Associations between respiratory illness and PM10 air pollution. Arch Environ Health. 1997;52:113–7. doi: 10.1080/00039899709602873. [DOI] [PubMed] [Google Scholar]
- 19.Carlton AG, Turpin JB, Johnson W, Buckley BT, Simcik M, Eisenreich SJ, et al. Microanalysis methods for characterization of personal aerosol exposures. Aerosol Sci Technol. 1999;31:66–80. [Google Scholar]
- 20.Schwartz J. Air pollution and daily mortality: A review and meta analysis. Environ Res. 1994;64:36–52. doi: 10.1006/enrs.1994.1005. [DOI] [PubMed] [Google Scholar]
- 21.Dockery DW, Pope CA., 3rd Acute respiratory effects of particulate air pollution. Annu Rev Public Health. 1994;15:107–32. doi: 10.1146/annurev.pu.15.050194.000543. [DOI] [PubMed] [Google Scholar]
- 22.Dickey JH. Part VII. Air pollution: Overview of sources and health effects. Dis Mon. 2000;46:566–89. doi: 10.1016/s0011-5029(00)90024-5. [DOI] [PubMed] [Google Scholar]
- 23.Jaward FM, Meijer SN, Steinnes E, Thomas GO, Jones KC. Further studies on the latitudinal and temporal trends of persistent organic pollutants in Norwegian and UK background air. Environ Sci Technol. 2004;38:2523–30. doi: 10.1021/es035292t. [DOI] [PubMed] [Google Scholar]
- 24.Godish T. Boca Raton. 4th ed. Florida: Lewis Publishers; 2003. Air quality. [Google Scholar]
- 25.Brook RD, Franklin B, Cascio W, Hong Y, Howard G, Lipsett M, et al. ; Expert Panel on Population and Prevention Science of the American Heart Association. Air pollution and cardiovascular disease: A statement for healthcare professionals from the expert panel on population and prevention science of the American Heart Association. Circulation. 2004;109:2655–71. doi: 10.1161/01.CIR.0000128587.30041.C8. [DOI] [PubMed] [Google Scholar]
- 26.USA: U.S. Department of Labor, OSHA Publication No. 3430-04; 2011. Occupational Safety and Health Administration (OSHA). Indoor Air Quality in Commercial and Institutional Buildings. [Google Scholar]
- 27.Government of Canada HC. Exposure guidelines for residential indoor air quality. canada. [Last accessed on 2012 Dec 29]. Available from: http://www.hc-sc.gc.ca/ewh-semt/pubs/air/exposure-exposition/index-eng.php#a1 .
- 28.Loh MM, Levy JI, Spengler JD, Houseman EA, Bennett DH. Ranking cancer risk of organic hazardous air pollutants in the United States. Environ Health Perspect. 2007;115:1160–8. doi: 10.1289/ehp.9884. [DOI] [PMC free article] [PubMed] [Google Scholar]
- 29.Shinn EA, Griffin DW, Seba DB. Atmospheric transport of mold spores in clouds of desert dust. Arch Environ Health. 2003;58:498–504. [PubMed] [Google Scholar]
- 30.Burr ML. Health effects of indoor molds. Rev Environ Health. 2001;16:97–103. doi: 10.1515/reveh.2001.16.2.97. [DOI] [PubMed] [Google Scholar]
- 31.Baxter DM, Perkins JL, McGhee CR, Seltzer JM. A regional comparison of mold spore concentrations outdoors and inside “clean” and “mold contaminated” southern California buildings. J Occup Environ Hyg. 2005;2:8–18. doi: 10.1080/15459620590897523. [DOI] [PubMed] [Google Scholar]
- 32.Perry DJ, Davies A, Butterworth LA, Hopley ALJ, Nicholson A, Gould FK. Development and evaluation of a chromogenic agar medium for methicillin-resistant Staphylococcus aureus. Am Soc Mic. 2004;42:4519–23. doi: 10.1128/JCM.42.10.4519-4523.2004. [DOI] [PMC free article] [PubMed] [Google Scholar]
- 33.USA: Research Triangle Park, North Carolina, EPA 452/R-11-003; 2011. U.S. EPA. Policy Assessment for the Review of the Particulate Matter National Ambient Air Quality Standards. [Google Scholar]
- 34.Germany: WHO Regional Office for Europe; 2006. WHO. Development of WHO guidelines for indoor air quality: Bonn. [Google Scholar]
- 35.2nd ed. Copenhagen: WHO Regional Publications, European Series, No. 91; 2000. WHO. Guidelines for air quality for Europe. [Google Scholar]
- 36.Blondeau P, Iordache V, Poupard O, Genin D, Allard F. Relationship between outdoor and indoor air quality in eight French schools. Indoor Air. 2005;15:2–12. doi: 10.1111/j.1600-0668.2004.00263.x. [DOI] [PubMed] [Google Scholar]
- 37.Kassomeneos PA, Karakitisios SP, Pilidis GA. A methodology to estimate benzene concentrations in town through a traffic model. Sci Total Environ. 2005;347:272–81. doi: 10.1016/j.scitotenv.2004.12.056. [DOI] [PubMed] [Google Scholar]
- 38.Ingle ST, Wagh ND, Pachpande BG, Patel VS, Attrade SB. The influence of work place environment on lung function of shopkeeper working near National Highway in Jalgaon: A note. Transportation Res Part D. 2005;6:476–82. [Google Scholar]
- 39.Potoglou D, Kanaroglou SP. Carbon monoxide emissions from passenger vehicle: Predictive mapping with an application to Hamilton, Canada. Transportation Res Part D. 2005;10:97–109. [Google Scholar]
- 40.ASHRAE Handbook: HVAC Applications, Fundamentals. SI Edition. Atlanta: ASHRAE, Inc; 1999. American Society of Heating, Refrigerating and Air-Conditioning Engineers (ASHRAE). Health care facilities. [Google Scholar]
- 41.Atlanta: ASHRAE, Inc; 2001. ASHRAE. ANSI/ASHRAE Standard 62-2001 Ventilation for acceptable indoor air quality. [Google Scholar]
- 42.Sautour M, Sixt N, Dalle F, L’Ollivier C, Fourquenet V, Calinon C, et al. Profiles and seasonal distribution of airborne fungi in indoor and outdoor environments at a French hospital. Sci Total Environ. 2009;407:3766–71. doi: 10.1016/j.scitotenv.2009.02.024. [DOI] [PubMed] [Google Scholar]
- 43.Kim KY, Kim YS, Kim D. Distribution characteristics of airborne bacteria and fungi in the general hospitals of Korea. Ind Health. 2010;48:236–43. doi: 10.2486/indhealth.48.236. [DOI] [PubMed] [Google Scholar]
- 44.Tang JW. The effect of environmental parameters on the survival of airborne infectious agents. J R Soc Interface. 2009;6:S737–46. doi: 10.1098/rsif.2009.0227.focus. [DOI] [PMC free article] [PubMed] [Google Scholar]
- 45.Tang CS, Chung FF, Lin MC, Wan GH. Impact of patient visiting activities on indoor climate in a medical intensive care unit: A 1-year longitudinal study. Am J Infect Control. 2009;37:183–8. doi: 10.1016/j.ajic.2008.06.011. [DOI] [PubMed] [Google Scholar]
- 46.Ekhaise FO, Ighosewe OU, Ajakpovi OD. Hospital indoor airborne microflora in private and government owned hospitals in benin city, Nigeria. World J Med Sci. 2008;3:19–23. [Google Scholar]


