

Abstract
The Scale for the Assessment of Positive Symptoms (SAPS), the Scale for the Assessment of Negative Symptoms (SANS), and the Positive and Negative Syndrome Scale for Schizophrenia (PANSS) are the most widely used schizophrenia symptom rating scales, but despite their co-existence for 25 years no easily usable between-scale conversion mechanism exists. The aim of this study was to provide equations for between-scale symptom rating conversions. Two- hundred-and-five schizophrenia patients [mean age±SD=39.5±11.6), 156 males] were assessed with the SANS, SAPS, and PANSS. Pearson’s correlations between symptom scores from each of the scales were computed. Linear regression analyses, on data from 176 randomly selected patients, were performed to derive equations for converting ratings between the scales. Intraclass correlations, on data from the remaining 29 patients, not part of the regression analyses, were performed to determine rating conversion accuracy. Between-scale positive and negative symptom ratings were highly correlated. Intraclass correlations between the original positive and negative symptom ratings and those obtained via conversion of alternative ratings using the conversion equations were moderate to high (ICCs = 0.65 to 0.91). Regression-based equations may be useful for conversion between schizophrenia symptom severity as measured by the SANS/SAPS and PANSS, though additional validation is warranted. This study’s conversion equations, implemented at http::/converteasy.org, may aid in the comparison of medication efficacy studies, in meta- and mega-analyses examining symptoms as moderator variables, and in retrospective combination of symptom data in multi-center data sharing projects that need to pool symptom rating data when such data are obtained using different scales.
Keywords: schizophrenia, symptoms, Marder, conversion, meta, multi-center
1. Introduction
The Scale for the Assessment of Positive Symptoms [SAPS(Andreasen, 1984)], Scale for the Assessment of Negative Symptoms [SANS(Andreasen, 1983)], and the Positive And Negative Syndrome Scale [PANSS(Kay et al., 1987; Kay et al., 1989)] are the most widely used symptom rating scales in schizophrenia research. Yet, despite their co-existence for 25 years, no equations for the conversion of scores between the scales exist. Such equations can be useful when examining treatment efficacy across studies, when conducting meta- and mega-analyses, and when sharing data sets in which different symptom ratings scales were used.
Numerous factor analysis studies on schizophrenia symptom ratings confirm the existence of negative, positive and disorganized syndrome constructs for the SAPS/SANS (Arndt et al., 1991; Arndt et al., 1995) and the PANSS (Marder et al., 1997). Additionally, recent work confirmed a more complex five factor syndrome model of the PANSS, including positive, negative, disorganization, excitement, and emotional distress syndrome dimensions (van der Gaag et al., 2006), though it has been argued that further validation of these syndromes with other aspects of schizophrenia is warranted (Mortimer, 2007). Symptom constructs remain useful as they appear to have differential prediction value with regard to functioning in patients with schizophrenia (Ventura et al., 2009) as well as those at clinical-high-risk for psychosis (Fulford et al., 2013). Moreover, lack of adequate treatment for negative symptoms make them a clinically relevant investigation topic (Kirkpatrick et al., 2006).
Though the PANSS has several psychometric advances over other schizophrenia symptom rating scales –e.g., the PANSS has the same number of items for the positive and negative symptom dimensions, such that the preponderance of either of these symptoms can be assessed (Kay, 1990)– the NIMH consensus statement on negative symptoms suggests that the SANS is an appropriate scale for negative symptom measurement, while PANSS may also be used (Kirkpatrick et al., 2006). The SANS and SAPS include positive and negative symptom sub domains, respectively, as well as additional details such as the hallucination modality specified in the SAPS. Cursory review of the literature shows that either the PANSS or the SANS/SAPS are used across studies, complicating cross-study comparisons.
A few studies have examined how the SANS/SAPS and PANSS relate to each other (Lyne et al., 2011; Norman et al., 1996; Rabany et al., 2011). Norman and colleagues (Norman et al., 1996) reported higher between scale correlations when using the average of multiple raters (r=0.88-0.91) than when using scores from different raters (r=0.58-0.81); though no statistical comparisons were performed. Rabany and colleagues (Rabany et al., 2011) observed a moderate Spearman’s rank correlation between the PANSS-Negative subscale and the SANS (r=0.56) though they concluded that the scales measure similar constructs. Lyne and colleagues (2011) reported correlations between SAPS/SANS and PANSS in the range of 0.58-0.91 across studies (Lyne et al., 2011). Importantly, they described 3 methods for combining symptom scales in collaborative projects by: (1) comparing scale scores with external clinical outcome, (2) recoding global scores as categories of severity, and (3) creating remission criteria (Lyne et al., 2011); the latter possibly presenting advantages in outcome research (Mortimer, 2007). Though useful, the proposed methods result in the loss of much of the quantitative symptom rating information that is particularly important for the comparison of treatment efficacy and for using symptom severity as moderator variables in meta- or mega-analyses. To our knowledge, no study has examined the use of regression equations to convert symptom ratings from one scale to another; a method that has been successfully applied in motor rating scales in Parkinson’s Disease (Verbaan et al., 2011).
In Phase 3 of the Function Bioinformatics Research Network (FBIRN) multi-center imaging project, clinicians rated positive and negative symptoms using both SAPS/SANS and PANSS on all the patients with schizophrenia who participated in the study. In this report, we explore the feasibility of using regression equations for converting symptom ratings between scales. The aim of this study is to provide conversion equations and conversion score reliabilities for SAPS/SANS and PANSS ratings. The regression-based equations derived may facilitate the interpretation of treatment effects on symptom improvement across studies, symptom rating scale conversions in meta- and mega-analyses, as well as the sharing of retrospectively collected data sets.
2. Materials and Methods
2.1. Participants
Schizophrenia patients (n=205, mean age±SD=39.5.±11.6, 156 [76%] males), recruited from 7 sites, participated in Phase 3 of the Function Biomedical Informatics Research Network (FBIRN) fMRI study (Table 1). Schizophrenia diagnosis was confirmed by the Structured Clinical Interview for DSM-IV-TR Axis I Disorders (SCID-I/P(First et al., 2002)) and all patients were clinically stable on antipsychotic medication for at least two months. The study excluded patients with schizoaffective disorder, and schizophrenia patients with a history of major medical illness, contraindications for MRI, insufficient eyesight to see with normal acuity with MRI compatible corrective lenses, a history of drug dependence in the last 5 years or a current substance abuse disorder, an IQ less than 75, or significant extrapyramidal symptoms. Clinical severity assessments included the Scale for the Assessment of Positive Symptoms (SAPS(Andreasen, 1984)), the Scale for the Assessment of Negative Symptoms (SANS(Andreasen, 1983)), the Positive and Negative Syndrome Scale (PANSS(Kay et al., 1989)), the Premorbid Adjustment Scale (PAS(Cannon-Spoor et al., 1982)), the Calgary Depression Scale (CDS(Addington et al., 1990)), and the Clinical Global Impression (CGI(Guy, 1976)). Symptom ratings were based on the past month. Patients were also assessed with the Hollingstead Socioeconomic Status Scale (HSSS(Hollingstead, 1975)), the Edinburgh Handedness Questionnaire (EDQ(Oldfield, 1971)), the Fagerstrom-Lifetime Smoking Form (Fagerstrom, 1978), a basic demographics form, and the North American Adult Reading Test (NAART(Uttl, 2002)). The sample included 146 paranoid, 7 disorganized, 36 undifferentiated, and 16 residual subtype; 188 right-, 13 left-, and 4 bilateral-handed; and 4 American Indian or Alaskan Native, 22 Asian, 43 Black or African American, 3 Native Hawaiian or Pacific Islander, and 133 White patients. Ratings were standardized across sites through cross-site group training sessions with experienced clinical raters and by rating videotapes from several patients for comparisons with expert assessments.
Table 1.
Sample Demographics
| Schizophrenia Patients (n=205) |
|||
|---|---|---|---|
|
| |||
| Mean | SD | Range | |
| Age in Years | 39.5 | (11.6) | 18-62 |
| Age at Onset in Years | 21.8 | (7.5) | 6-49 |
| Duration of Illness in Years | 17.7 | (145) | 1-49 |
| NAART FSIQ | 103 | (9.5) | 80-124 |
| Subject Educationa | 3.3 | (0.9) | 2-5 |
| Highest Parental Educationa | 2.4 | (1.9) | 0-9 |
| PANSS Positive | 15.7 | (5.3) | 7-33 |
| PANSS Negative | 14.9 | (5.9) | 7-39 |
| PANSS General | 28.6 | (7.5) | 16-48 |
| PANSS Composite | 0.77 | (6.5) | −19-19 |
| PANSS Total | 59.1 | (15.4) | 32-107 |
| Marder Positive | 17.8 | (6.3) | 8-41 |
| Marder Negative | 14.6 | (6.4) | 7-38 |
| SANS | |||
| Flat Affect | 6.2 | (6.8) | 0-26 |
| Alogia | 2.4 | (3.2) | 0-16 |
| Apathy | 4.6 | (3.3) | 0-14 |
| Anhedonia | 7.0 | (5.1) | 0-19 |
| Attention | 2.7 | (2.4) | 0-9 |
| SANS (composite) Total | 23.0 | (14.6) | 0-70 |
| SANS (global) Summary | 7.8 | (4.7) | 0-74 |
| SAPS | |||
| Hallucinations | 6.0 | (6.1) | 0-27 |
| Delusions | 8.2 | (7.8) | 0-35 |
| Bizarre Behavior | 1.3 | (1.7) | 0-8 |
| Thought Disorder | 1.3 | (1.7) | 0-8 |
| SAPS (composite) Total | 16.8 | (14.2) | 0-74 |
| SAPS (global) Summary | 5.7 | (3.7) | 0-14 |
based on the Hollingstead Socioeconomic Status Scale (Hollingstead, 1975)
Written informed consent, including permission to share de-identified data between the centers and with the wider research community, approved by the University of California Irvine, the University of California Los Angeles, the University of California San Francisco, Duke University, University of North Carolina, University of New Mexico, University of Iowa, and University of Minnesota Institutional Review Boards, was obtained from all study participants.
2.2. Symptom Rating Scores
The following formulas calculated the negative and positive symptom scores: (1) SANS Total (Composite) score = sum(of SANS items 1-7, 9-12, 14-16, 18-21, and 23-24), (2) SAPS Total (Composite) score = sum(of SAPS items 1-6, 8-19, 21-24, and 26-33), (3) SANS (Global) Summary score = sum(of SANS items 8, 13, 17, 22, and 25, which include affective flattening, alogia, avolition, anhedonia, and attention global rating scores, respectively), (4) SAPS (Global) Summary score = sum(of SAPS items 7, 20, 25, and 34, which include hallucinations, delusions, bizarre behavior, and thought disorder global rating scores, respectively), (5) PANSS Positive = sum(of PANSS items 1-7), (6) PANSS Negative = sum(of PANSS items 8-15), (7) Marder Positive Symptom Factor Score (Marder Positive) = sum(of PANSS items 1, 3, 5-6, 14-15, 23, and 26), and (8) Marder Negative Symptom Factor Score (Marder Negative) = sum(of PANSS items 8-11 and 13). Note that the PANSS ratings that make up the Marder Factor scores are equally weighted as in the original publication (Marder et al., 1997). For additional descriptions of the SAPS, SANS, and PANSS see Supplement S1.
2.3. Statistical Analyses
Pearson’s correlations among positive and negative symptom scores were computed based on the overall sample (SAS PROC CORR, Statistical Analysis Software, Version 9.2, SAS Institute Inc., Cary, NC, USA). Regression analyses predicting the SAPS scores with the PANSS Positive score, SANS scores with PANSS Negative score, and SAPS and SANS Summary with their respective Global scores, as well as each of these scores with their corresponding Marder Symptom Factor scores, were performed on data from 176 patients randomly selected from the overall sample (SAS PROC MIXED, Statistical Analysis Software, Version 9.2, SAS Institute Inc., Cary, NC, USA). Intraclass correlations (ICCs; and their confidence intervals) between symptom rating scores and the same symptom scores predicted by alternative symptom rating scores, based on the regression equations, were computed on data from the remaining 29 patients, not part of the regression analyses. Based on estimates in the R ICC package, this sample size allows for determining significant ICCs larger than 0.54 (i.e., excluding 0 from their confidence intervals), while maintaining the largest possible sample to compute the regression equations. We computed one-way random, absolute agreement ICCs using the R (Version 2.7.0) irr package. ICCs can be interpreted as excellent (> 0.8), good (0.7 - 0.8), fair (0.5 - 0.7) or poor (< 0.5) (American Psychiatric Association, 2000). R-squared differences between the original regression model and the (validation) model predicting symptom ratings with predicted symptom scores are reported in a supplementary table S1.
3. Results
3.1. Correlations
The various positive and negative symptom scores derived from the PANSS, SANS, and SAPS, were highly correlated with each other (see Table 2).
Table 2.
Pearson’s Correlations between Symptom Ratings (N=205)
| PANSS Positive |
PANSS Negative |
SAPS (composite) Total |
SANS (composite) Total |
SAPS (global) Summary |
SANS (global) Summary |
Marder Positive |
Marder Negative |
|
|---|---|---|---|---|---|---|---|---|
| PANSS Positive |
1 | 0.32 | 0.71 | 0.30 | 0.78 | 0.34 | 0.92 | 0.29 |
| PANSS Negative |
1 | 0.25xs* | 0.84 | 0.34 | 0.82 | 0.32 | 0.93 | |
| SAPS (composite) Total |
1 | 0.30 | 0.74 | 0.24xs* | 0.71 | 0.25xs* | ||
| SANS (composite) Total |
1 | 0.34 | 0.92 | 0.29 | 0.85 | |||
| SAPS (global) Summary |
1 | 0.38 | 0.76 | 0.28 | ||||
| SANS (global) Summary |
1 | 0.33 | 0.81 | |||||
| Marder Positive |
1 | 0.29 | ||||||
| Marder Negative |
1 |
p<0.001. For all other correlations p<0.0001
3.2. Symptom Ratings Conversion Equations
The following sections present the equations to convert between the positive and negative symptom scores provided by the SAPS, SANS, and PANSS based on the linear regression analyses (see Figures 1 and 2 and Figures 1S-10S in Supplement S1 for associated regression plots). The equations are implemented at http://converteasy.org for use by the scientific community.
Figure 1.
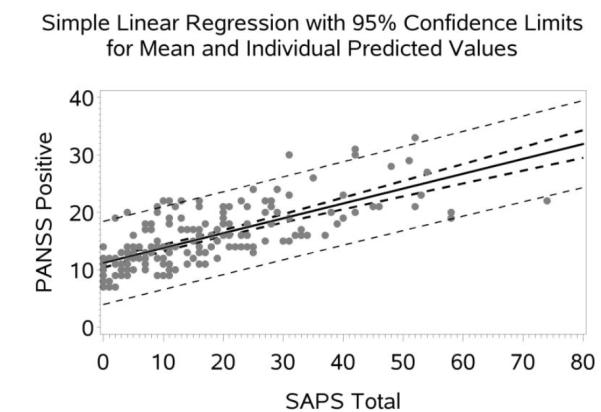
Scatter Plot with Regression line (95% CI) for PANSS Positive Predicted by SAPS Total.
Figure 2.

Scatter Plot with Regression line (95% CI) for PANSS Negative Predicted by SANS Total.
3.2.1. Positive Symptom Ratings Conversion Equations
3.2.1.1 Between SAPS and PANSS
SAPS [composite] Total score = −14.5359 + (2.3771 * PANSS Positive) (1)
PANSS Positive = 11.1886 + (0.2587 * SAPS [composite] Total score) (2)
SAPS [global] Summary score = −3.222 + (0.567 * PANSS Positive) (3)
PANSS Positive = 9.3264 + (1.1072 * SAPS [global] Summary score) (4)
3.2.1.2 Within SAPS
SAPS [composite] Total score = 0.2941 + (2.9298 * SAPS [global] Summary score) (5)
SAPS [global] Summary score = 2.3526 + (0.1932 * SAPS [composite] Total score) (6)
3.2.1.3 Between PANSS/SAPS and Marder
Marder Positive = 1.0747+ (1.0743 * PANSS Positive) (7) PANSS Positive = 1.783 + (0.7735 * Marder Positive) (8)
Marder Positive = 12.6431 + (0.3052 * SAPS [composite] Total score) (9)
SAPS [composite] Total score = −13.6542 + (1.7071 * Marder Positive) (10)
Marder Positive = 10.6275 + (1.2736 * SAPS [global] Summary score) (11)
SAPS [global] Summary score = −2.7599 + (0.4696 * Marder Positive) (12)
3.2.2. Negative Symptom Ratings Conversion Formulas
3.2.2.1 Between SANS and PANSS
SANS [composite] Total score = −8.376 + (2.1002 * PANSS Negative) (13)
PANSS Negative = 7.1196 + (0.3362 * SANS [composite] Total score) (14)
SANS [global] Summary score = −2.0671 + (0.665 * PANSS Negative) (15)
PANSS Negative = 6.7515 + (1.0287 * SANS [global] Summary score) (16)
3.2.2.2 Within SANS
SANS [composite] Total score = 0.565 + (2.8434* SANS [global] Summary score) (17)
SANS [global] Summary score = 1.0863 + (0.2943 * SANS [composite] Total score) (18)
3.2.2.3 Between PANSS/SAPS and Marder
Marder Negative = −0.6095 + (1.0209 * PANSS Negative) (19)
PANSS Negative = 2.6381 + (0.8373 * Marder Negative) (20)
Marder Negative = 5.9723 + (0.3758 * SANS [composite] Total score) (21)
SANS [composite] Total score = −5.4065 + (1.9319 * Marder Negative) (22)
Marder Negative = 5.8548 + (1.0209 * SANS [global] Summary score) (23)
SANS [global] Summary score = 2.6381 + (0.8373 * Marder Negative) (24)
3.3. Reliability of Predicted Ratings
Intra-class Correlations (95% CI) Between Measured and Predicted Symptom Ratings based on Conversion Formulas are in the range of 0.65-0.97 (see Table 3). The increase in mean squared prediction error between the original regression and the validation regression is on average 17% and 3% for the positive and negative symptoms, respectively (see Table 4 in Supplement S1).
Table 3.
Intra-class Correlations (95% CI) Between Measured and Predicted Symptom Ratings Obtained with Regression-Based Conversion Equations
| Predicted Symptom Rating | ICC (95% CI) N=29 |
|---|---|
| SAPS [composite] Total predicted by PANSS Positive* | 0.65 (0.37 - 0.82) |
| SAPS [global] Summary predicted by PANSS Positive | 0.72 (0.48 - 0.86) |
| SAPS [global] Summary predicted by SAPS [composite] Total score | 0.68 (0.43 - 0.84) |
| PANSS Positive predicted by Marder Positive | 0.97 (0.93 - 0.99) |
| SAPS [composite] Total predicted by Marder Positive | 0.65 (0.37 - 0.82) |
| SAPS [global] Summary predicted by Marder Positive | 0.66 (0.39 - 0.82) |
|
| |
| SANS [global] Summary predicted by SANS [composite] Total score | 0.91 (0.82 - 0.96) |
| SANS [composite] Total predicted by PANSS Negative | 0.82 (0.66 - 0.91) |
| SANS [global] Summary predicted by PANSS Negative | 0.78 (0.58 - 0.89) |
| PANSS Negative predicted by Marder Negative | 0.92 (0.84 - 0.96) |
| SANS [composite] Total predicted by Marder Negative | 0.66 (0.40 - 0.82) |
| SANS [global] Summary predicted by Marder Negative | 0.79 (0.61 -0.90) |
Note that the ICCs for the vice versa predictions (e.g., PANSS Positive predicted by SAPS [composite] Total are equivalent.
Discussion
The main findings from the study are that (1) the SANS and PANSS negative symptom ratings and SAPS and PANSS positive symptom ratings are highly correlated (r205=0.71-0.84) in our large sample of patients with schizophrenia and that (2) linear regression-based conversion formulas may be useful for converting symptom dimension scores between these widely used scales.
The observed high correlation between SANS and PANSS negative symptom ratings (r205=0.71-0.84) is consistent with prior findings of moderate to high correlations between these scales (Lyne et al., 2011; Rabany et al., 2011), in particular when mean or same rater ratings are used (Norman et al., 1996), and indicates that both scales measure largely similar constructs. The correlations between the SAPS and PANSS positive symptoms (r205=0.71-0.78) appear a little bit lower than those for the negative symptoms (r205=0.82-0.84), which could be due either to the inclusion of positive and disorganized symptom items in the SAPS (Andreasen and Olsen, 1982) not present in the PANSS or due to overall somewhat lower repeated measurement reliability for positive compared with negative symptoms, but see (Andreasen and Flaum, 1991).
The reliability estimates for the regression-based symptom conversions are in the fair to excellent range (ICC29=0.65-0.97). However, many of the confidence interval (CI) lower ends in the current study are in the poor range, likely due to the relatively small sample used for ICC computation because CI inversely relates to the square root of the number of subjects. The larger increases in mean squared prediction error between the original regression and the validation regression for the positive compared with the negative symptoms, suggests that the negative symptom conversion equations are highly predictive, while the positive symptom conversion equations could be improved (see Table 1S in Supplement S1). Compared to previously proposed methods (Lyne et al., 2011), the use of regression-based equations to convert symptom severity ratings between scales has the distinct advantage of conserving the quantitative nature of the symptom ratings. The conversion formulas are implemented at http://converteasy.org for ease of use by clinicians and researchers alike.
It is important to note that the formulas provided in this study are based on the classical scoring of the PANSS on a scale from 1-7. PANSS items should at least sometimes be scored between 0-6 instead of 1-7, in particular when percent change scores need to be calculated (Leucht et al., 2009; Thompson et al., 1994) and it has been argued that overall the PANSS should be rescaled (Leucht et al., 2010; Obermeier et al., 2010; Thompson et al., 1994); a similar rescaling has been argued for the Brief Psychiatric Rating Scale (Leucht et al., 2007; Thompson et al., 1994). In cases where the PANSS is scored from 0-6, 7 points should be added to the PANSS Positive subscore and to the PANSS Negative subscore prior to conversion to another symptom score using the formulas provided in this manuscript. Researchers must take care when conducting meta-analyses in this regard as the nature of PANSS scoring is often not carefully described in the existing research literature; for review see (Obermeier et al., 2011).
Though the study results are promising, caution is advised in using the reported equations due to the need for additional validation and a number of inherent study limitations: (1) the conversion equations were calculated for stable patients with moderate symptom severity and it is unclear to what extent the findings generalize to clinical samples vastly different from ours, such as patients with acute decompensation, including first-episode patients, and patients whose severity of pathology is at the extremes of the clinical spectrum; (2) some of the conversions have reliabilities (ICCs) in the fair range (0.50-0.70) and must obviously be used with caution; (3) the ICCs are based on a relatively small sample resulting in relatively large confidence intervals; (4) the ratings for each scale were performed by the same rater at each site, which might result in a stronger correlation between the scales and higher conversion reliabilities. Hence, further research is needed to determine the reliability of the conversion equations for studies where scales are rated by different raters (Norman et al., 1996); and (5) though raters were trained and their ratings compared with those from experts, formal inter-rater reliability was not assessed quantitatively at study onset. Further, in cases where the equations are employed to convert rating scale scores across different research projects, comparative analyses within the individual scales may assist in overall interpretation of results. Last, we advise against using the “homogenizing” effect of the conversion process for the pooling of studies that are heterogeneous in aspects other than their measurement scales.
Strengths of the study are that: (1) the SAPS, SANS, and PANSS symptom ratings occurred during the same session allowing for maximal consistency with regard to clinician ratings on the scales; (2) the symptom ratings were performed by highly-experienced raters who underwent joint training sessions at the onset of the study; (3) the symptom ratings were obtained from a relatively large community-based sample of patients with schizophrenia (n=205) recruited at 7 sites across the country; and (4) conversion reliability was assessed based on a subsample, independent of the one used to derive the regression equations.
In conclusion, the regression-based equations provided by this study may allow for conversion between schizophrenia symptom severity as measures by the SANS/SAPS and PANSS. Additional studies, preferably with large and diverse samples, should examine the generalizability of the findings to other schizophrenia populations, including first-episode, acute and more severely ill patients, and to instances where ratings are performed by different raters. The conversion formulas provided by this study, as well as those achieved in future studies, may aid in the comparison of medication efficacy studies, aid meta-analysis studies that plan to examine symptoms as moderator variables, and aid retrospective combination of symptom data in multi-center data sharing projects that need to pool symptom rating data from different rating scales.
Supplementary Material
Footnotes
Publisher's Disclaimer: This is a PDF file of an unedited manuscript that has been accepted for publication. As a service to our customers we are providing this early version of the manuscript. The manuscript will undergo copyediting, typesetting, and review of the resulting proof before it is published in its final citable form. Please note that during the production process errors may be discovered which could affect the content, and all legal disclaimers that apply to the journal pertain.
Previous Presentation
International Congress on Schizophrenia Research, Orlando, Florida, USA, April 23, 2013 Society of Biological Psychiatry, San Francisco, California, USA, May 17, 2013
Conflict of Interest
Dr. Preda consulted for Boehringer-Ingelheim. Dr. Bustillo consulted with Novartis and Otsuka Pharmaceuticals. Dr. Mathalon is a consultant for Bristol-Myers Squibb. The remaining authors declare no potential conflict of interest. Dr. Potkin has financial interests in Bristol-Myers Squibb, Eisai, Inc., Eli Lilly, Forest Laboratories, Genentech, Janssen Pharmaceutical, Lundbeck, Merck, Novartis, Organon, Pfizer, Roche, Sunovion, Takeda Pharmaceutical, Vanda Pharmaceutical, Novartis, Lundbeck, Merck, Sunovion and has received grant funding from Amgen, Baxter, Bristol-Myers Squibb, Cephalon, Inc., Eli Lilly, Forest Laboratories, Genentech, Janssen Pharmaceutical, Merck, Otsuka, Pfizer, Roche, Sunovion, Takeda Pharmaceutical, Vanda Pharmaceutical, NIAAA, NIBIB, NIH/NCRR, University of Southern California, UCSF, UCSD, Baylor College of Medicine.
Contributors
This study was designed by T.G.M. van Erp in collaboration with A. Preda and S.G. Potkin. Statistical analyses were conducted by T.G.M. van Erp. The first draft of the paper was written by T.G.M. van Erp, and all other co-authors commented and contributed to subsequent revisions. All authors approved the final manuscript.
References
- Addington D, Addington J, Schissel B. A depression rating scale for schizophrenics. Schizophr. Res. 1990;3(4):247–251. doi: 10.1016/0920-9964(90)90005-r. [DOI] [PubMed] [Google Scholar]
- American Psychiatric Association . Handbook of Psychiatric Measures. American Psychiatric Association; Washington, DC: 2000. [Google Scholar]
- Andreasen N. The scale for the assessment of negative symptoms (SANS) University of Iowa; Iowa City: 1983. [Google Scholar]
- Andreasen N. The scale for the assessment of positive symp-toms (SAPS) University of Iowa; Iowa City: 1984. [Google Scholar]
- Andreasen NC, Flaum M. Schizophrenia: the characteristic symptoms. Schizophr. Bull. 1991;17(1):27–49. doi: 10.1093/schbul/17.1.27. [DOI] [PubMed] [Google Scholar]
- Andreasen NC, Olsen S. Negative v positive schizophrenia. Definition and validation. Arch. Gen. Psychiatry. 1982;39(7):789–794. doi: 10.1001/archpsyc.1982.04290070025006. [DOI] [PubMed] [Google Scholar]
- Arndt S, Alliger RJ, Andreasen NC. The distinction of positive and negative symptoms. The failure of a two-dimensional model. Br. J. Psychiatry. 1991;158:317–322. doi: 10.1192/bjp.158.3.317. [DOI] [PubMed] [Google Scholar]
- Arndt S, Andreasen NC, Flaum M, Miller D, Nopoulos P. A longitudinal study of symptom dimensions in schizophrenia. Prediction and patterns of change. Arch. Gen. Psychiatry. 1995;52(5):352–360. doi: 10.1001/archpsyc.1995.03950170026004. [DOI] [PubMed] [Google Scholar]
- Cannon-Spoor HE, Potkin SG, Wyatt RJ. Measurement of premorbid adjustment in chronic schizophrenia. Schizophr. Bull. 1982;8(3):470–484. doi: 10.1093/schbul/8.3.470. [DOI] [PubMed] [Google Scholar]
- Fagerstrom KO. Measuring degree of physical dependence to tobacco smoking with reference to individualization of treatment. Addict. Behav. 1978;3(3-4):235–241. doi: 10.1016/0306-4603(78)90024-2. [DOI] [PubMed] [Google Scholar]
- First MB, Spitzer RL, Gibbon MG, Williams JBW. Structured Clinical Interview for DSM-IV-TR Axis I Disorders - Patient Edition (SCID-I/P, 11/2002 revision), New York. 2002.
- Fulford D, Niendam TA, Floyd EG, Carter CS, Mathalon DH, Vinogradov S, Stuart BK, Loewy RL. Symptom dimensions and functional impairment in early psychosis: more to the story than just negative symptoms. Schizophr. Res. 2013;147(1):125–131. doi: 10.1016/j.schres.2013.03.024. [DOI] [PMC free article] [PubMed] [Google Scholar]
- Guy W. Abnormal Involuntary Movement Scale (AIMS) In: ECDEU Assessment Manual for Psychopharmacology. U.S. Department of Health, Education, and Education and Welfare, Public Health Service, Alcohol, Drug Abuse and Mental Health Administration, editor. Rockville, MD: 1976. pp. 534–537. [Google Scholar]
- Hollingstead AB. Four factor index of social status. Yale University; New Haven, CT: 1975. [Google Scholar]
- Kay SR. Positive-negative symptom assessment in schizophrenia: psychometric issues and scale comparison. Psychiatr. Q. 1990;61(3):163–178. doi: 10.1007/BF01064966. [DOI] [PubMed] [Google Scholar]
- Kay SR, Fiszbein A, Opler LA. The positive and negative syndrome scale (PANSS) for schizophrenia. Schizophr. Bull. 1987;13(2):261–276. doi: 10.1093/schbul/13.2.261. [DOI] [PubMed] [Google Scholar]
- Kay SR, Opler LA, Lindenmayer JP. The Positive and Negative Syndrome Scale (PANSS): rationale and standardisation. Br. J. Psychiatry. 1989;(Suppl(7)):59–67. [PubMed] [Google Scholar]
- Kirkpatrick B, Fenton WS, Carpenter WT, Jr., Marder SR. The NIMH-MATRICS consensus statement on negative symptoms. Schizophr. Bull. 2006;32(2):214–219. doi: 10.1093/schbul/sbj053. [DOI] [PMC free article] [PubMed] [Google Scholar]
- Leucht S, Davis JM, Engel RR, Kane JM, Wagenpfeil S. Defining 'response' in antipsychotic drug trials: recommendations for the use of scale-derived cutoffs. Neuropsychopharmacology. 2007;32(9):1903–1910. doi: 10.1038/sj.npp.1301325. [DOI] [PubMed] [Google Scholar]
- Leucht S, Davis JM, Engel RR, Kissling W, Kane JM. Definitions of response and remission in schizophrenia: recommendations for their use and their presentation. Acta. Psychiatr. Scand. Suppl. 2009;438:7–14. doi: 10.1111/j.1600-0447.2008.01308.x. [DOI] [PubMed] [Google Scholar]
- Leucht S, Kissling W, Davis JM. The PANSS should be rescaled. Schizophr. Bull. 2010;36(3):461–462. doi: 10.1093/schbul/sbq016. [DOI] [PMC free article] [PubMed] [Google Scholar]
- Lyne JP, Kinsella A, O'Donoghue B. Can we combine symptom scales for collaborative research projects? J. Psychiatr. Res. 2011;46(2):233–238. doi: 10.1016/j.jpsychires.2011.10.002. [DOI] [PubMed] [Google Scholar]
- Marder SR, Davis JM, Chouinard G. The effects of risperidone on the five dimensions of schizophrenia derived by factor analysis: combined results of the North American trials. J. Clin. Psychiatry. 1997;58(12):538–546. doi: 10.4088/jcp.v58n1205. [DOI] [PubMed] [Google Scholar]
- Mortimer AM. Symptom rating scales and outcome in schizophrenia. Br. J. Psychiatry Suppl. 2007;50:s7–14. doi: 10.1192/bjp.191.50.s7. [DOI] [PubMed] [Google Scholar]
- Norman RM, Malla AK, Cortese L, Diaz F. A study of the interrelationship between and comparative interrater reliability of the SAPS, SANS and PANSS. Schizophr. Res. 1996;19(1):73–85. doi: 10.1016/0920-9964(95)00055-0. [DOI] [PubMed] [Google Scholar]
- Obermeier M, Mayr A, Schennach-Wolff R, Seemuller F, Moller HJ, Riedel M. Should the PANSS be rescaled? Schizophr. Bull. 2010;36(3):455–460. doi: 10.1093/schbul/sbp124. [DOI] [PMC free article] [PubMed] [Google Scholar]
- Obermeier M, Schennach-Wolff R, Meyer S, Moller HJ, Riedel M, Krause D, Seemuller F. Is the PANSS used correctly? a systematic review. BMC Psychiatry. 2011;11:113. doi: 10.1186/1471-244X-11-113. [DOI] [PMC free article] [PubMed] [Google Scholar]
- Oldfield RC. The assessment and analysis of handedness: the Edinburgh inventory. Neuropsychologia. 1971;9(1):97–113. doi: 10.1016/0028-3932(71)90067-4. [DOI] [PubMed] [Google Scholar]
- Rabany L, Weiser M, Werbeloff N, Levkovitz Y. Assessment of negative symptoms and depression in schizophrenia: revision of the SANS and how it relates to the PANSS and CDSS. Schizophr. Res. 2011;126(1-3):226–230. doi: 10.1016/j.schres.2010.09.023. [DOI] [PubMed] [Google Scholar]
- Thompson PA, Buckley PF, Meltzer HY. The brief psychiatric rating scale: effect of scaling system on clinical response assessment. J. Clin. Psychopharmacol. 1994;14(5):344–346. [PubMed] [Google Scholar]
- Uttl B. North American Adult Reading Test: age norms, reliability, and validity. J. Clin. Exp. Neuropsychol. 2002;24(8):1123–1137. doi: 10.1076/jcen.24.8.1123.8375. [DOI] [PubMed] [Google Scholar]
- van der Gaag M, Hoffman T, Remijsen M, Hijman R, de Haan L, van Meijel B, van Harten PN, Valmaggia L, de Hert M, Cuijpers A, Wiersma D. The five-factor model of the Positive and Negative Syndrome Scale II: a ten-fold cross-validation of a revised model. Schizophr. Res. 2006;85(1-3):280–287. doi: 10.1016/j.schres.2006.03.021. [DOI] [PubMed] [Google Scholar]
- Ventura J, Hellemann GS, Thames AD, Koellner V, Nuechterlein KH. Symptoms as mediators of the relationship between neurocognition and functional outcome in schizophrenia: a meta-analysis. Schizophr. Res. 2009;113(2-3):189–199. doi: 10.1016/j.schres.2009.03.035. [DOI] [PMC free article] [PubMed] [Google Scholar]
- Verbaan D, van Rooden SM, Benit CP, van Zwet EW, Marinus J, van Hilten JJ. SPES/SCOPA and MDS-UPDRS: formulas for converting scores of two motor scales in Parkinson's disease. Parkinsonism Relat. Disord. 2011;17(8):632–634. doi: 10.1016/j.parkreldis.2011.05.022. [DOI] [PubMed] [Google Scholar]
Associated Data
This section collects any data citations, data availability statements, or supplementary materials included in this article.