Abstract
Tumor cell proliferation, infiltration, migration, and neovascularization are known causes of treatment resistance in glioblastoma multiforme (GBM). The purpose of this study was to determine the effect of radiation on the growth characteristics of primary human GBM developed in a nude rat. Primary GBM cells grown from explanted GBM tissues were implanted orthotopically in nude rats. Tumor growth was confirmed by magnetic resonance imaging on day 77 (baseline) after implantation. The rats underwent irradiation to a dose of 50 Gy delivered subcuratively on day 84 postimplantation (n = 8), or underwent no radiation (n = 8). Brain tissues were obtained on day 112 (nonirradiated) or day 133 (irradiated). Immunohistochemistry was performed to determine tumor cell proliferation (Ki-67) and to assess the expression of infiltration marker (matrix metalloproteinase-2, MMP-2) and cell migration marker (CD44). Tumor neovascularization was assessed by microvessel density using von-Willebrand factor (vWF) staining. Magnetic resonance imaging showed well-developed, infiltrative tumors in 11 weeks postimplantation. The proportion of Ki-67-positive cells in tumors undergoing radiation was (71 ± 15)% compared with (25 ± 12)% in the nonirradiated group (P = 0.02). The number of MMP-2-positive areas and proportion of CD44-positive cells were also high in tumors receiving radiation, indicating great invasion and infiltration. Microvessel density analysis did not show a significant difference between nonirradiated and irradiated tumors. Taken together, we found that subcurative radiation significantly increased proliferation, invasion, and migration of primary GBM. Our study provides insights into possible mechanisms of treatment resistance following radiation therapy for GBM.
Keywords: Glioblastoma multiforme, radiation, treatment resistance, invasion
Glioblastoma multiforme (GBM) is one of the most aggressive primary brain tumors in humans, with a median survival of 12–15 months[1]. The current standard of care for GBM is surgical resection followed by radiation therapy combined with concurrent and adjuvant temozolomide[2]. Even with aggressive treatment, tumors recur in a majority of patients. Hence, there is an urgent need to develop new therapies to overcome treatment resistance in GBM.
A major consideration in developing new treatments is to identify the mechanisms that are being used by tumor cells to become resistant to applied therapies. Factors implicated in GBM recurrence include cancer stem cells[3], tumor microvascular endothelial cells[4], hypoxia[5]–[7], cell proliferation, infiltration[6],[8], and angiogenesis[9]. Numerous attempts have been made to decrease recurrence and improve survival in GBM patients. In addition to aggressive surgical resection[10], one strategy that has been tested is increasing the dose of radiation[11]–[13]. Increased dose intensity of temozolomide has also not shown improvement in survival[14]. Currently, novel targeted therapies, including antiangiogenic agents, are being evaluated in combination with standard treatment[15], but the results to date have not been encouraging[16],[17]. For the past several years, radiotherapy has been an integral part of adjuvant treatment in GBM. According to the latest Radiation Therapy Oncology Group (RTOG) guidelines, the initial treatment field includes postoperative peritumoral edema as seen on magnetic resonance imaging (MRI) plus 2 cm, followed by a boost field defined as a residual tumor plus 2 cm, prescribed to a total dose of 60 Gy[18]. Treatment effects are monitored by serial MRI, and two characteristic morphologic changes in the brain have been well documented[19],[20]. Pseudoprogression is seen as contrast enhancement on MRI, usually within 3 months after treatment, and generally exhibits spontaneous resolution. Radiation necrosis, however, is a less common but a more serious change. Usually found 3–12 months after treatment, radiation necrosis exhibits a characteristic histology but seldom shows spontaneous resolution. Although imaging changes have been well documented in GBM, the extent to which radiation affects malignant characteristics of the tumor has not been well documented. There has also been no clinically relevant primary human GBM animal model (with radiation) with which to understand the mechanisms of treatment resistance and tumor recurrence. Most relevant animal models have used glioma cell lines, which do not accurately represent the growth characteristics of primary GBM. In the present study, we set out to determine changes in malignant characteristics, including cell proliferation, migration, invasion, and neovascularization, following radiation in an animal model of primary human GBM.
Materials and Methods
The Institutional Animal Care and Use Committee of the Henry Ford Health System approved all experiments performed in this study. A separate institutional review board (IRB) approval was obtained for the use of primary human GBM cells in animal experiments.
Cell lines
Primary GBM cells were obtained from an explanted tumor sample from a patient using an IRB-approved protocol[21]. The tumor was dissociated, and the cells were grown as neurospheres in DMEM/F12 medium containing 2 mmol/L L-glutamine and supplemented with N-2 (Gibco Invitrogen Cell Culture, Grand Island, NY, USA), 0.05% bovine serum albumin, 25 µg/mL gentamicin, 50 units/mL penicillin G sodium, 50 µg/mL streptomycin sulfate, 20 ng/mL epidermal growth factor, and 20 ng/mL basic fibroblast growth factor (PeproTech, Rocky Hills, NJ, USA). After 1–3 weeks, multicellular floating neurospheres formed and were dissociated in Mg2+- and Ca2+-free PBS, harvested, and resuspended at a concentration of 8 × 10⁷ cells/mL in serum-free medium; 5 µL of the cell suspension was implanted into each rat brain. The main differences between established glioma cell lines (such as U251 or U87) and primary glioma neurospheres are that the primary glioma neurospheres grow slowly by invasion (rather than by displacement, like in U251 or U87) and recapitulate the salient characteristics of the primary GBM tumor[21].
Animals
Female nude rats (n = 20) weighing 150–200 g were obtained from Charles River Laboratories (Frederick, MD, USA) and used in these experiments. Twelve weeks after tumor implantation, 8 rats received radiation and 8 rats were used as control. Four rats were euthanized on day 77 to determine the baseline proliferation and neovascularization in tumors.
Tumor implantation
Rats were anesthetized with 100 mg/kg ketamine and 15 mg/kg xylazine via intraperitoneal injection. The surgical zone was swabbed with betadine solution and the animals' eyes were coated with Lacri-lube. The rats were immobilized in a small animal stereotactic device (Stoelting Co, CA, USA). After draping, a 1-cm incision was made 2 mm to the right of the midline and 1 mm retro-orbitally. The skull was exposed with cotton-tip applicators and an HP-4 dental drill bit was used with a micromanipulator to drill a hole 3 mm to the right of the bregma, taking care not to penetrate the dura. A #2701 10 µL Hamilton syringe with a 26-gauge needle containing 4 × 10⁵ tumor cells in 5 µL was lowered to a depth of 3.5 mm, and then raised to a depth of 2.5 mm. The GBM cells were injected slowly at a rate of 0.5 µL/30 s until the entire volume was injected. The neurospheres were dissociated before the injection in order to maintain an identical number of cells administered into each rat. Tumor growth was confirmed with an MRI scan 11 weeks after implantation.
Irradiation
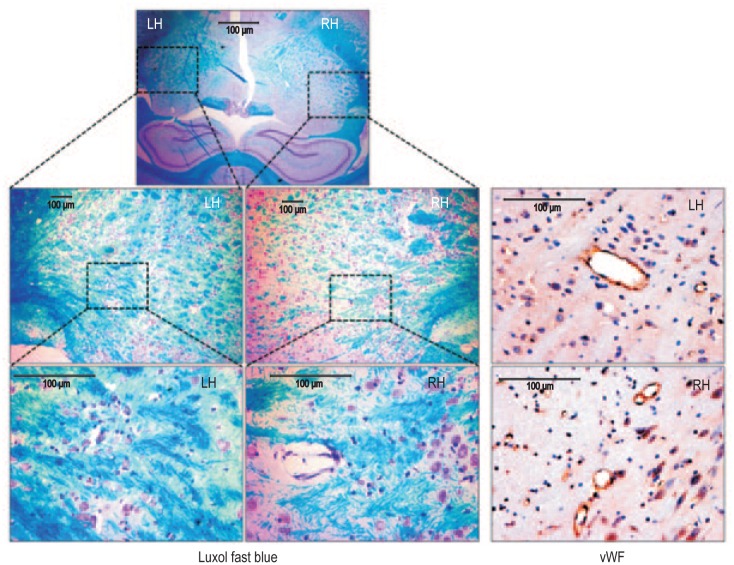
On day 84 following tumor cell implantation, eight rats received irradiation. MRI scans indicated the tumor diameter was about 4–6 mm on day 77. These rats were anesthetized using 100 mg/kg of ketamine and 10 mg/kg of xylazine via intraperitoneal injection, and then restrained in a stereotactic head holder. The chosen site of irradiation was 3 mm right from bregma (at the center of the tumor implantation site). The rats were irradiated stereotactically using a single, collimated dorso-ventral beam of 6 MV X-rays (BrainLab, Feldkirchen, Germany) to a dose of 50 Gy in single fraction, with 1.5-mm thick bolus material placement, so that 95%–100% of the central axis dose was delivered to the target volume[22]. The volume of brain irradiated was a cylindrical radius of 3 mm at the 80% isodose line. The dose rate was 6 Gy/min using a 75-cm source-to-skin surface distance. Based on our previous experience and publications, a dose of 50 Gy in single fraction induces radiation necrosis in the normal brain within 6–8 weeks[23]. Figure 1 shows demyelination (Luxol fast blue staining) and vascularity [von-Willebrand factor (vWF)–positive vessels] in the normal brain following irradiation to a dose of 50 Gy. Similar changes are expected in the surrounding brain tissue and tumor (such as necrosis) following a dose of 50 Gy radiation encompassing the entire tumor area. As our aim was to determine the growth characteristics of residual tumor cells, the tumor volume irradiated was designed to allow viable tumor cells outside the high-dose region (subcurative radiation).
Figure 1. Changes in the normal brain of a nude rat following irradiation.
Nude rats, 6-8 weeks old, received 50 Gy irradiation to the right hemisphere (RH) at 3 mm right and 1 mm anterior to bregma as described in the Methods section. Eight weeks following irradiation, rats were euthanized, the brain tissues were collected, and paraffin blocks were prepared. Tissue sections were stained with Luxol fast blue (LFB) for myelination and von-Willebrand factor (vWF) for vascularization. LFB staining shows obvious demyelination in the irradiated RH compared with the nonirradiated left hemisphere (LH) at both 10× (middle panel) and 40× (lower panel) magnification. vWF staining at the corresponding sites showed increased number of vessels, indicating radiation-induced angiogenesis in the irradiated brain compared to that of contralateral nonirradiated brain.
MRI
An appropriate state of anesthesia was obtained with isoflurane (3% for induction, 0.7%–1.5% for maintenance in a 2:1 mixture of N2:O2). Anesthetized rats were placed in a 7 Tesla, 20-cm bore superconducting magnet (Magnex Scientific, Abingdon, England) interfaced to a Bruker Advance console (Bellerica, MA, USA). A 12-cm self-shielded gradient set with maximum gradients of 45 gauss/cm was used. Radiofrequency pulses were applied by a 7.5-cm diameter saddle coil actively decoupled from the 3.2-cm diameter surface receive coil positioned over the center line of the rat skull. Stereotaxic ear bars were used to minimize movement during the imaging procedure. Rectal temperature was maintained at 37.0°C using a feedback controlled water bath. After positioning using a triplanar fast low angle shot (FLASH) sequence, T2-weighted MRI scans were performed. T2-weighted images were obtained using standard, two-dimensional Fourier transformation (2DFT), multislice (13–15), multiecho (6 echoes) MRI. A series of four sets of images (13–15 slices for each set) were obtained using echo times (TEs) of 20, 40, 60, and 80 ms and a repetition time (TR) of 3,000 ms. The images were produced using 32 mm field of view (FOV), 1-mm slice thickness, 256 × 256 matrix, and number of excitation (NEX) of 2. MR images were used to determine the tumor size and detect signs of necrosis. Edematous or liquifactive areas usually show high signal intensity on T2-weighted images, but hemorrhagic necrosis appears as low signal intensity areas. All rats underwent MRI on the day of euthanasia.
Immunohistochemistry
Nonirradiated rats were euthanized on day 112 after tumor implantation. Irradiated rats were euthanized on day 133 (7 weeks after irradiation) using 150–200 mg/kg of pentobarbital by intravenous or intraperitoneal injection. Following euthanasia, all rats were then perfused with 100 mL of saline and 100 mL of 3% paraformaldehyde for histologic analysis. During this study, the nonirradiated rats expired by day 120 due to tumor regrowth. However, due to radiation-induced growth delay, rats with irradiated tumors failed to succumb. For this reason, irradiated tumors were allowed an addition three weeks to grow compared to nonirradiated tumors. The whole brain tissue was collected and fixed in 4% paraformaldehyde and 3% sucrose for 48 h and then transferred to 4% paraformaldehyde and 30% sucrose solution. The fixed brain tissue was placed in a coronal rat brain matrix (Activational Systems Inc., Warren, MI, USA) and cut into 2-mm blocks. Blocks grossly containing tumor were processed and paraffin embedded. The embedded blocks were cut into serial 6-µm sections for histology. Immunohistochemistry using Ki-67 antibody (Millipore, MA, USA) was used to assess the proliferation status of the tumor cells. Sections were also stained with matrix metalloproteinase-2 (MMP-2) (Lab Vision Corporation, Fremont, CA, USA) and CD44 (Abcam, Cambridge, MA, USA) antibodies to assess for tumor infiltration and migration. Tumor neovascularization was assessed using vWF (Dako, Carpinteria, CA, USA) staining. Vascular endothelium was also visualized by FITC tagged-tomato lectin immunofluorescence (Sigma, St Louis, MO, USA). Factors related to neovascularization, such as vascular endothelial growth factor (VEGF) (Lab vision Corporation, Fremont, CA, USA), stromal cell-derived factor (SDF)–1α (Millipore, MA, USA), and hypoxia-inducible factor (HIF)–1α (Lab vision Corporation, Fremont, CA, USA) were also assessed using respective antibodies.
Quantitative analysis of Ki-67
Five regions of the tumor were microphotographed: center, right, left, top, and bottom at 40× magnifications. The Ki-67-positive cells were identified by dark brown on diaminobenzidine (DAB) stain. All positive and negative cells were counted using a cell counter pen; the total cell number counted varied from 915 to 2,600 based on tumor size. The percentage of cells positive for Ki-67 was calculated for baseline, nonirradiated, and irradiated groups.
Evaluation of CD44-positive cells
Studies have indicated CD44 to be a surrogate marker for treatment-resistant cells[24]. Distance between CD44-positive cells and the margin of the main tumor mass was calculated using low magnification (4× to 10×) images of the tumor section. An average distance of 10 cells from the margin of the tumor mass on each section was determined using software supplied by the vendor (SPOT Imaging Solutions, Sterling Heights, MI, USA) for the microscope. The average distance between the migratory cells and the tumor margin was determined for both nonirradiated and irradiated tumors.
Quantification of MMP-2, SDF-1α, and HIF-1α expression
At least three tumors were analyzed per group (baseline, non-irradiated, and irradiated). Five regions of the tumor were micro-photographed: center, right, left, top, and bottom at 40× magnification. All pictures were saved as red-green-blue format and the size of the pictures were maintained at 3 cm × 2.25 cm with a resolution of 150 pixels/cm. MMP-2 is a secretory protein and therefore detectable in both the intracellular and extracellular space. The area (mm2) of positive MMP-2 expression was measured using a plug-in called “threshold color” from ImageJ software[25]. The plug-in allowed us to segment the images based on color. Although SDF-1α is a secretory protein, most of the SDF-1α expression was localized within the cytoplasm. Our staining showed a limited number of cells with increased expression of SDF-1α. Therefore, we used a densitometry technique for analysis using ImageJ software. Each picture was divided into four quadrants and a small region of interest (ROI) of 20 random points was measured. A total of 80 optical points were quantified per photograph, making a grand total of 400 points for each section of the tumor. All positive points were subtracted from a white background for normalization. All the points (optical density) were averaged for each group and statistically analyzed. HIF-1α expression is mostly nuclear, which led us to quantify positive cells. All positive cells were quantified per microphotograph, averaged, and statistically analyzed.
Evaluation of microvessel density (MVD)
Slides stained with vWF were used to quantify MVD. Each tube-like structure for vWF was considered a microvessel. Five “hot spots” (areas with highest vessel concentration) from each slide were identified, and vWF-positive areas were counted by two independent observers. The total histologic area was noted, and MVD was calculated as previously described[26] for baseline, irradiated, and non-irradiated groups.
Statistical analysis
Comparison among the irradiated, nonirradiated, and baseline groups were done by using multiway analysis of variance followed by PLSD post hoc test. All data are presented as mean ± standard deviation. A P value of less than 0.05 was considered significant for each group comparison.
Results
Tumor necrosis detected by MRI
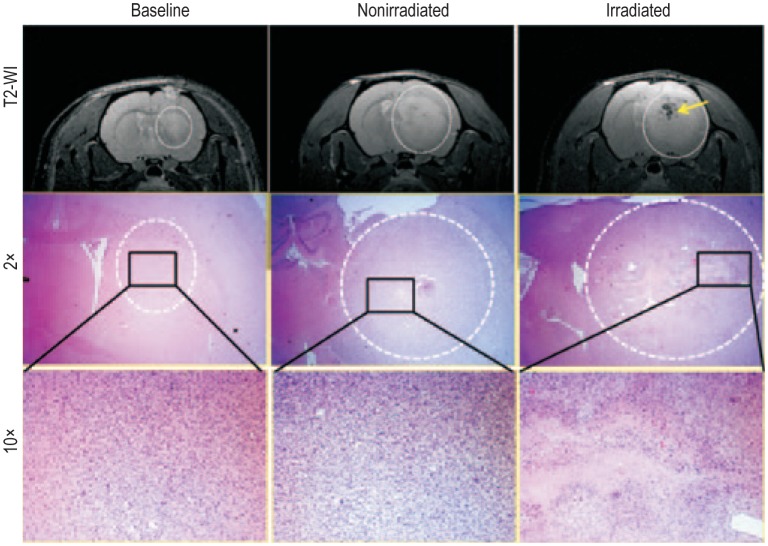
On day 77, all tumors measured approximately 4–6 mm in longitudinal diameter. T2-weighted images showed large tumors in all rats with or without irradiation (Figure 2). Due to the additional three weeks of growth allowed for the irradiated group of rats and possible residual tumor cells after radiation, we expected no changes in tumor size between the groups. However, signs of hemorrhagic necrosis (low signal intensity areas on T2-weighted image) and areas of peripheral high signal intensities were observed in irradiated tumors (Figure 2). The MRI findings were also confirmed by hematoxylin-eosin (HE) staining of corresponding tumor areas, which showed areas of necrosis in irradiated tumors but no definite necrosis in baseline or nonirradiated tumors (Figure 2).
Figure 2. Irradiation induced changes on magnetic resonance imaging (MRI) and histology.
MRI and corresponding histology images show rat brains bearing primary glioblastoma multiforme (GBM) on day 77 (baseline), day 112 (nonirradiated), and day 133 (irradiated). Upper panel: a T2-weighted MR image shows a baseline tumor on day 77; a nonirradiated rat shows a well-developed tumor on day 112; and an irradiated rat shows a well-developed tumor with radiation necrosis (yellow arrow) on day 133. Middle panel (2× magnification) and lower panel (10× magnification): representative hematoxylin-eosin (HE) staining of the corresponding areas of the tumors indicating necrosis following irradiation.
Subcurative radiation enhanced the proliferation of GBM cells
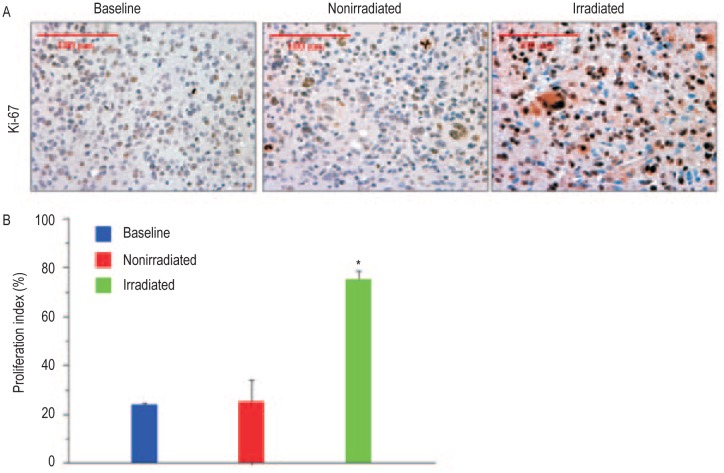
There was an increase in proliferation as indicated by a higher proportion of Ki-67-positive cells in tumors receiving radiation compared with tumors that received no radiation or at baseline. As shown in Figure 3, quantitative analysis revealed that the average Ki-67 labeling before radiation (baseline, day 77) was (24 ± 1)%, which increased to (71 ± 15)% following irradiation (day 133), compared with (25 ± 12)% in the nonirradiation group (day 112) (P < 0.05).
Figure 3. Subcurative irradiation increases proliferation of viable tumor cells.
A, representative images of tumor sections stained for Ki-67 expression in baseline, non-irradiated, and irradiated tumors (40× magnification). B, graphic representation of Ki-67 expression indicates a significant increase (* P < 0.05) in the proliferation in the irradiated tumors.
Subcurative radiation increased infiltration and migration of GBM cells
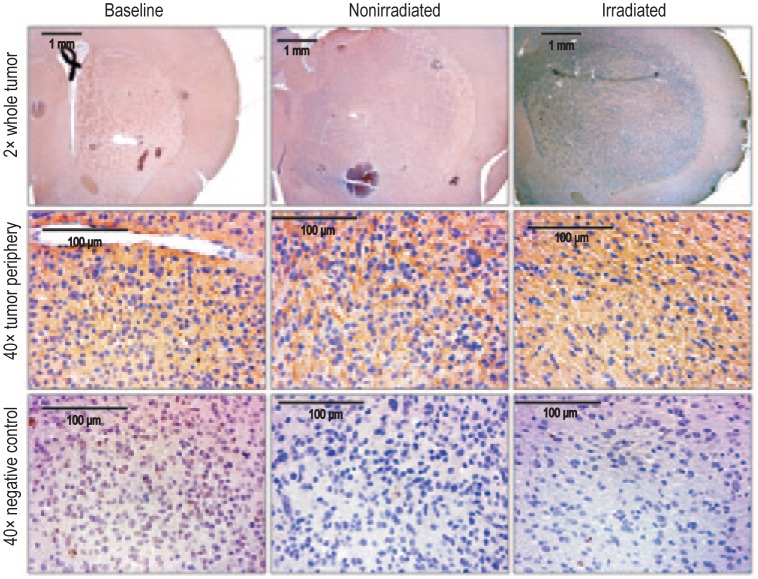
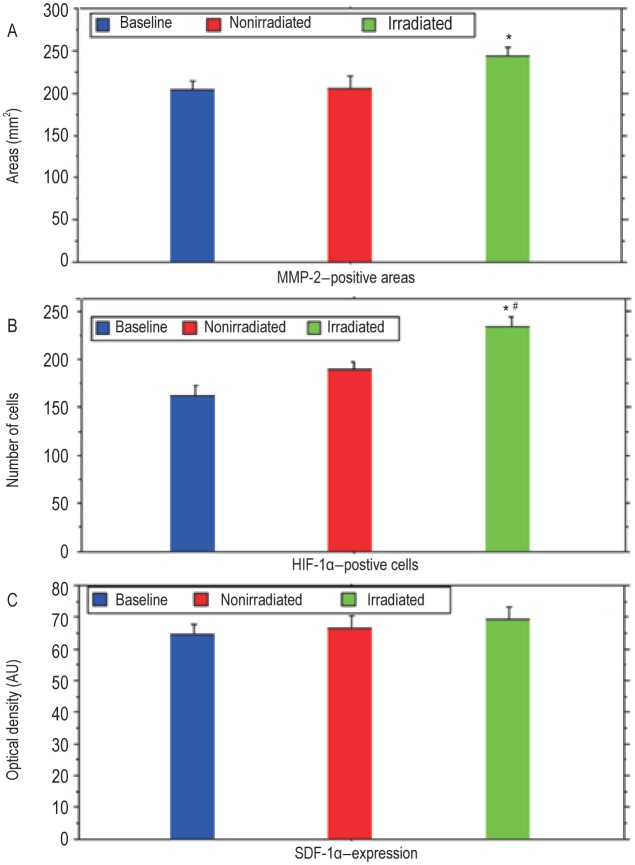
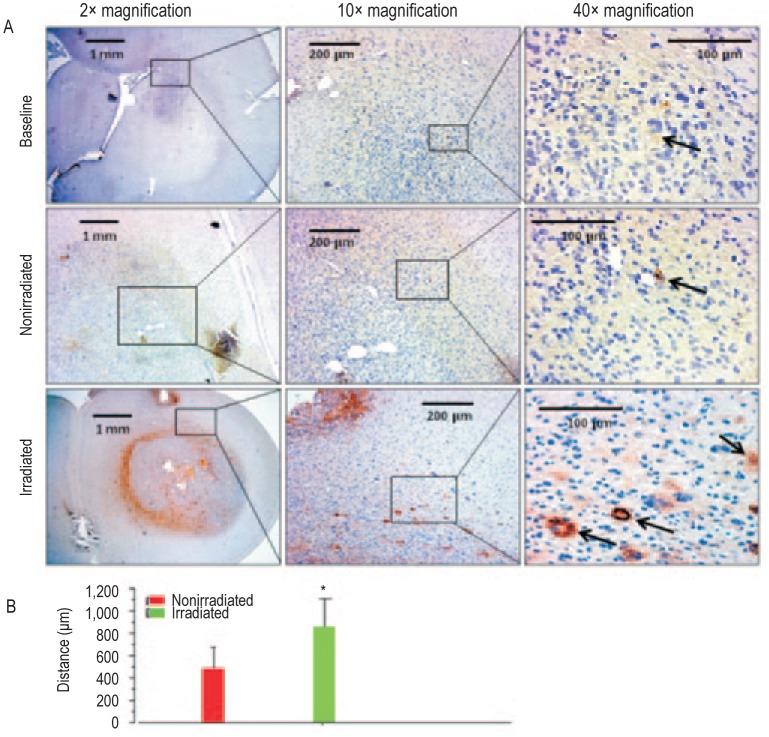
Tumors were stained for expressions of MMP-2 and CD44 to evaluate the invasive capacity and infiltration of GBM cells. The invasiveness of GBM cells increased as evidenced by higher MMP-2 staining in tumors receiving radiation (Figure 4). Compared with nonirradiated tumors, which showed expression of MMP-2 throughout the tumor in a linear and sparse fashion, MMP-2 expression in irradiated tumors was denser, involved larger areas, and extended to the tumor periphery. Semiquantitative analysis revealed positive areas for MMP-2 were significantly larger in irradiated tumors compared with that of baseline and nonirradiated tumors (P < 0.05) (Figure 5). Foci of CD44-positive areas were seen beyond the tumor periphery into the normal brain following irradiation, indicating tumor cell migration (Figure 6). Most CD44-positive cells in the baseline and non-irradiated groups remained within the boundary of the main tumor mass. Very few CD44-positive cells were observed in tumors in the baseline and nonirradiated groups. However, CD44-positive cells were abundant in the irradiated group and were seen mostly at the periphery and beyond the margin of the tumor mass. The average distance of CD44-positive foci in the irradiated group was (855.0 ± 461.6) µm compared with (481.4 ± 310.4) µm in the nonirradiated group, indicating greater infiltration of tumor cells following radiation (P < 0.05).
Figure 4. Matrix metallopro-teinase-2 (MMP-2) expression was increased following irradiation, indicating an increase in tumor infiltration.
Representative images of tumor sections were stained for infiltration marker MMP-2 (upper panel; 2× magnification). Increase in MMP-2 expression is noted at the tumor periphery after irradiation, compared with nonirradiated or baseline tumors (middle panel; 40× magnification). A dense expression of MMP-2 is observed in the irradiated tumor. The lower panel shows consecutive sections for negative control for corresponding MMP-2 immunohistochemistry (40× magnification).
Figure 5. Graphic representation of expression of MMP-2, hypoxi-inducible factor-1α (HIF-1α), and stromal cell- derived factor 1α (SDF-1α) in baseline, nonirradiated, and irradiated tumors.
A, MMP-2 expression is significantly higher in irradiated tumors compared with baseline tumors (P < 0.05). B, the number of HIF-1α-positive cells is significantly higher in irradiated tumors compared with baseline tumors (P < 0.001) and nonirradiated groups (P < 0.01). No significant difference of the expression of HIF-1α is observed between baseline and nonirradiated groups. C, SDF-1α expression is similar in all tumor groups (P >0.05). *Compared with baseline tumors; # Compared with nonirradiated tumors. Au, absorbance unit.
Figure 6. Subcurative irradiation increased the number of invasive cells positive for CD44.
A, immunohistochemical study shows presence of CD44-positive cells in the tumor and in the adjacent brain. Irradiation caused an increase in the foci of CD44-positive areas (black arrow; magnification 2×, 10×, and 40×). B, graphic representation shows a significant increase in the distance traveled by CD44-positive cells in irradiated tumors. *, P < 0.05.
Tumor angiogenesis and MVD
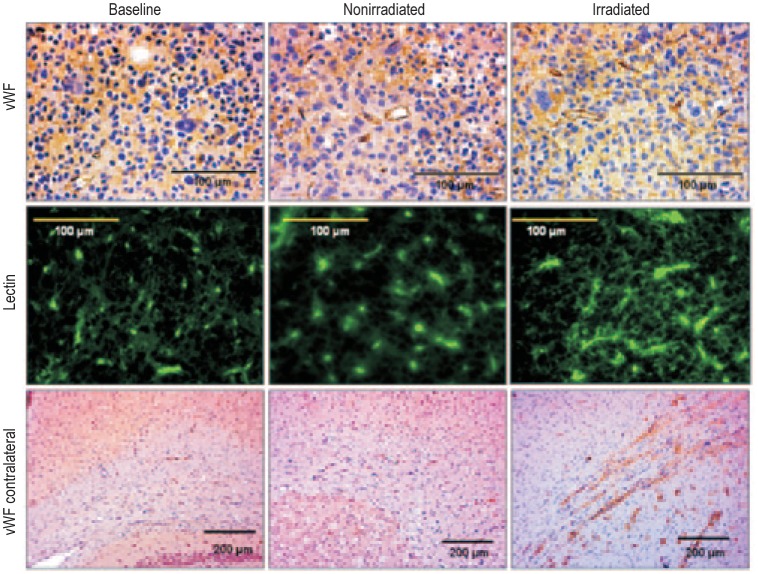
Various markers of angiogenesis and quantification of MVD assessed tumor neovascularization. There were no differences in the expression of VEGF or SDF-1α (Figures 5 and 7) in tumors between the irradiated and nonirradiated groups (Figure 7). However, HIF-1α staining was significantly higher in irradiated tumors compared with baseline and nonirradiated tumors (Figures 5 and 7). vWF staining in tumors treated with radiation, compared with nonirradiated and baseline groups, are shown in Figure 8. Although there were qualitative changes in the tumor vasculature such as dilation and tortuosity following irradiation, no differences in the quantity of tumor vasculature was observed on vWF staining among baseline, non-irradiated, and irradiated groups (Figure 8). The MVD calculated by counting vWF-positive areas in the baseline, nonirradiated, and irradiated groups was (244 ± 23)/mm2, (207 ± 27)/mm2, and (289 ± 29)/mm2, respectively (P = 0.07). Surprisingly, in tumors that received radiation, we observed vWF-positive areas crossing the midline to the opposite cerebral hemisphere along the tracts of corpus callosum (Figure 8).
Figure 7. Subcurative irradiation did not change the expression of vascular endothelial growth factor (VEGF), stromal cell-derived factor 1α (SDF-1α), and hypoxia-inducible factor 1α (HIF-1α).
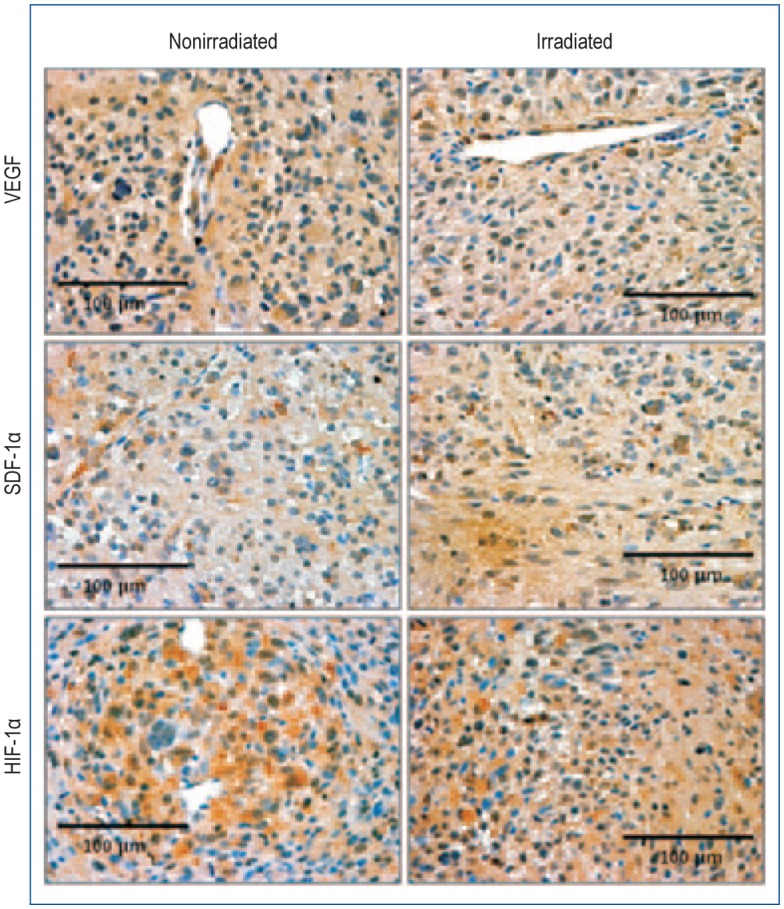
No definite change is observed between irradiated and nonirradiated tumors (40× magnification).
Figure 8. Irradiation increased neovascularization in the con-tralateral corpus callosum.
Tumor neovascularization is observed after staining for von-Willebrand factor (vWF) (40× magnification) in baseline, nonirradiated, and irradiated tumors (upper panel). Fluorescein isothiocyanate (FITC)-tagged lectin staining also shows neovascularization in baseline, nonirradiated, and irradiated tumors (middle panel). vWF-positive areas are seen crossing the midline along the corpus callosum in rats receiving radiation (10× magnification) (lower panel). Although irradiated tumors exhibit a relative increase in the number of vessels, analysis of mean microvessel density did not reveal any significant changes in irradiated tumors compared with baseline or nonirradiated tumors.
Discussion
Our results indicate that the subcurative radiation of the tumor led to increased proliferation of residual GBM cells and hypoxia as indicated by a greater percentage of Ki-67-positive cells and HIF-1α positive cells, respectively. An increase in the numbers of MMP-2-positive areas and CD44-positive cells at the periphery of tumors receiving radiation suggested an increase in migration, infiltration, and the number of treatment-resistant cells. In addition, many tumor cell foci were seen migrating outside of primary tumor mass into normal brain tissue. However, we did not observe increased vascularization, based on the expression of angiogenesis markers on immunohistochemistry or MVD measurement in the irradiated group.
Radiation produces a therapeutic effect by eradicating microscopic disease after the primary tumor is surgically removed. It has been an integral part of postoperative treatment of GBM for the past many decades. Nevertheless, the vast majority of patients experience tumor recurrence. Several hypotheses, including alterations in tumor microenvironment and tumor biological factors, have been implicated in resistance to therapy and tumor recurrence. Our goal in the present study was to examine the effect of radiation on tumor biological factors including proliferation, infiltration, migration, and vascularization in an animal model of primary GBM. The radiation dose used in this study was sufficient to cause radiation injury (necrosis) in the normal brain, which was revealed as extensive demyelination and changes in vascularization. We assumed, therefore, that the same dose of radiation would also cause necrosis in the tumor, which was confirmed with HE staining. However, we expected that not all tumor cells would be affected by the dose of radiation, and some tumor cells would remain viable (i.e., radiation dose was delivered subcuratively).
Radiation has been suggested to increase the invasive and migratory potential of GBM cells in vitro and in vivo[27], [28]. These increases are predominantly thought to be due to elevated expression of the proteolytic enzyme MMP-2[29]–[35]. MMP-2 activates various cellular pathways, leading to increased cell proliferation, motility, invasion, and angiogenesis[31], [36]. The increase in MMP-2 expression, especially at the periphery, observed in our experiment would suggest that GBM cells acquire an aggressive phenotype after radiation. We also observed CD44-positive microscopic foci of tumor cells, migrating away from the primary tumor into the surrounding normal brain tissue after radiation. CD44 is a cell surface molecule responsible for cell-cell and cell-matrix interactions, and its expression has been associated with GBM cell migration, invasion, and resistance to treatment[24],[37]–[40]. Our results suggest up-regulation of MMP-2 and CD44 expression in the viable tumor cells following subcurative radiation, facilitating GBM infiltration and invasion into normal brain tissue. Notably, T2-weighted MRI was not sensitive enough to detect infiltration at the tumor periphery following irradiation, although peripheral edema may indicate extension of tumor margin, which is also observed on MRI as high signal intensity areas.
In addition to greater invasion and migration of GBM cells after radiation, we observed an increase in the proliferation of GBM cells, as evidenced by a higher percentage of Ki-67-positive cells in tumors treated with radiation. Ki-67, also known as MKI67, is an antigen encoded by the MKI67 gene in humans[41]. Ki-67, which is strictly present in active phases of the cell cycle (G1, S, G2, and M phases) and absent in the resting phase (G0), is associated with cell proliferation and RNA ribosomal transcription. During interphase, Ki-67 can be detected in the cell nucleus, and while in mitosis, it can be detected on the surface of chromosomes. It is possible that the increase in Ki-67 staining in irradiated tumors is secondary to accelerated repopulation of tumor cells following sublethal DNA damage repair[42].
One of the characteristic features of GBM is their hypervascularity secondary to increased production of proangiogenic factors, including VEGF, HIF-1α, and SDF-1α[43]–[45]. Radiation treatment has been reported to increase the release of these proangiogenic factors[46]–[49]. However, in the current study, there was no increase in vascularization in tumors that received radiation. One possible reason for this is the high dose of radiation, which completely obliterated the hypoxia-induced angiogenic signal (though HIF-1α was increased). This is supported by the observation of vWF staining crossing the midline to the opposite hemisphere where the radiation dose would be lower, thus leading to the release of proangiogenic factors.
A unique feature of our study is the use of primary GBM spheroid cells developed from resected GBM tissues, which form infiltrative tumors when implanted in animals[21]. Primary GBM spheroid-cell-derived tumors can infiltrate the normal brain to a greater extent compared to established cell lines such as U251, U87, or 9L cells, where tumor growth is primarily by displacement. Another advantage of using primary GBM spheroid cells is prolonged life span of the implanted rats of up to 16-18 weeks, compared with 5–6 weeks for standard tumor models. The slow growth and prominent infiltration of GBM spheroid cells allow us to study the effect of treatment interventions at clinically relevant time points. Although GBM at later stages showed hypervascularity and prominent enhancement on postcontrast CT or MRI, our personal experiences showed a reduced number of microvessels in the rat model of glioma derived from primary GBM, compared with an animal model of glioma derived from human U251 cell line. Comparative studies are warranted to determine the factors causing decreased vascularization in primary GBM versus tumors derived from established cell lines.
Although our results have interesting clinical implications, there are several limitations on our study. The radiation dose was delivered in a single fraction. Although GBM patients are treated with fractionated irradiation, applying fractioned regimen in nude rats would be technically challenging. Another limitation was that the neurosphere cells were derived from a single patient. Ideally, samples from different patients should have been used. In our previous experience, samples from different patients failed to produce symmetrical tumor masses. Therefore, we chose to use cells derived from a single patient.
In summary, our results suggest that subcurative radiation increases tumor cell proliferation, migration, and invasion in an rat model of primary human GBM. Future studies should be aimed at exploring the relationship between MMP-2 expression, the development of treatment-resistant cells, and the outcome following adjuvant radiation treatment in glioma.
Acknowledgments
We thank Thaiz Borin for her assistance during immunohisto-chemistry analysis. This work was supported by grants from the National Institutes of Health (NIH) [No. K25CA129173 (MMA), R01CA122031 (ASA), and 1R01CA160216 (ASA)].
References
- 1.Wen PY, Kesari S. Malignant gliomas in adults. N Engl J Med. 2008;359:492–5072. doi: 10.1056/NEJMra0708126. [DOI] [PubMed] [Google Scholar]
- 2.Stupp R, Mason WP, van den Bent MJ, et al. Radiotherapy plus concomitant and adjuvant temozolomide for glioblastoma. N Engl J Med. 2005;352:987–996. doi: 10.1056/NEJMoa043330. [DOI] [PubMed] [Google Scholar]
- 3.Singh SK, Hawkins C, Clarke ID, et al. Identification of human brain tumor initiating cells. Nature. 2004;432:396–401. doi: 10.1038/nature03128. [DOI] [PubMed] [Google Scholar]
- 4.Borovski T, Beke P, van Tellingen O, et al. Therapy-resistant tumor microvascular endothelial cells contribute to treatment failure in glioblastoma multiforme. Oncogene. 32:1539–1548. doi: 10.1038/onc.2012.172. [DOI] [PubMed] [Google Scholar]
- 5.Hu YL, DeLay M, Jahangiri A, et al. Hypoxia-induced autophagy promotes tumor cell survival and adaptation to antiangiogenic treatment in glioblastoma. Cancer Res. 2012;72:1773–1783. doi: 10.1158/0008-5472.CAN-11-3831. [DOI] [PMC free article] [PubMed] [Google Scholar]
- 6.Amberger-Murphy V. Hypoxia helps glioma to fight therapy. Curr Cancer Drug Targets. 2009;9:381–390. doi: 10.2174/156800909788166637. [DOI] [PubMed] [Google Scholar]
- 7.Oliver L, Olivier C, Marhuenda FB, et al. Hypoxia and the malignant glioma microenvironment: regulation and implications for therapy. Curr Mol Pharmacol. 2009;3:263–284. doi: 10.2174/1874467210902030263. [DOI] [PubMed] [Google Scholar]
- 8.Perry J, Okamoto M, Guiou M, et al. Novel therapies in glioblastoma. Neurol Res Int. 2012;2012:428565. doi: 10.1155/2012/428565. [DOI] [PMC free article] [PubMed] [Google Scholar]
- 9.Onishi M, Ichikawa T, Kurozumi K, et al. Angiogenesis and invasion in glioma. Brain Tumor Pathol. 2011;28:13–24. doi: 10.1007/s10014-010-0007-z. [DOI] [PubMed] [Google Scholar]
- 10.Stummer W, Pichlmeier U, Meinel T, et al. Fluorescence-guided surgery with 5-aminolevulinic acid for resection of malignant glioma: a randomised controlled multicentre phase III trial. Lancet Oncol. 2006;7:392–401. doi: 10.1016/S1470-2045(06)70665-9. [DOI] [PubMed] [Google Scholar]
- 11.Laramore GE, Martz KL, Nelson JS, et al. Radiation Therapy Oncology Group (RTOG) survival data on anaplastic astrocytomas of the brain: does a more aggressive form of treatment adversely impact survival? Int J Radiat Oncol Biol Phys. 1989;17:1351–1356. doi: 10.1016/0360-3016(89)90549-x. [DOI] [PubMed] [Google Scholar]
- 12.Souhami L, Seiferheld W, Brachman D, et al. Randomized comparison of stereotactic radiosurgery followed by conventional radiotherapy with carmustine to conventional radiotherapy with carmustine for patients with glioblastoma multiforme: report of radiation therapy oncology group 93-05 protocol. Int J Radiat Oncol Biol Phys. 2004;60:853–860. doi: 10.1016/j.ijrobp.2004.04.011. [DOI] [PubMed] [Google Scholar]
- 13.Laperriere NJ, Leung PMK, McKenzie S, et al. Randomized study of brachytherapy in the initial management of patients with malignant astrocytoma. Int J Radiat Oncol Biol Phys. 1998;41:1005–1011. doi: 10.1016/s0360-3016(98)00159-x. [DOI] [PubMed] [Google Scholar]
- 14.Gilbert MR, Wang M, Aldape KD, et al. RTOG 0525: a randomized phase III trial comparing standard adjuvant temozolomide (TMZ) with a dose-dense (dd) schedule in newly diagnosed glioblastoma (GBM) J Clin Oncol. 2011;29(Suppl. abstr):2006. [Google Scholar]
- 15.McNamara MG, Mason WP. Antiangiogenic therapies in glioblastoma multiforme. Expert Rev Anticancer Ther. 2012;12:643–654. doi: 10.1586/era.12.35. [DOI] [PubMed] [Google Scholar]
- 16.Norden AD, Drappatz J, Wen PY. Antiangiogenic therapies for high-grade glioma. Nat Rev Neurol. 2009;5:610–620. doi: 10.1038/nrneurol.2009.159. [DOI] [PubMed] [Google Scholar]
- 17.Chi AS, Norden AD, Wen PY. Antiangiogenic strategies for treatment of malignant gliomas. Neurotherapeutics. 2009;6:513–526. doi: 10.1016/j.nurt.2009.04.010. [DOI] [PMC free article] [PubMed] [Google Scholar]
- 18.RTOG 0837: Randomized, Phase II, Double-blind, placebo-controlled trial of conventional chemoradiation and adjuvant temozolomide plus cediranib versus conventional chemoradiation and adjuvant temozolomide plus placebo in patients with newly diagnosed glioblastoma. Available from: http://www.rtog.org/ClinicalTrials/ProtocolTable/StudyDetails.aspx?study=0837&mode=broadcasts&ptid=387.
- 19.Brandsma D, van den Bent MJ. Pseudoprogression and pseudores-ponse in the treatment of gliomas. Curr Opin Neurol. 2009;22:633–638. doi: 10.1097/WCO.0b013e328332363e. [DOI] [PubMed] [Google Scholar]
- 20.Clarke JL, Chang S. Pseudoprogression and pseudoresponse: challenges in brain tumor imaging. Curr Neurol Neurosci Rep. 2009;9:241–246. doi: 10.1007/s11910-009-0035-4. [DOI] [PubMed] [Google Scholar]
- 21.deCarvalho AC, Nelson K, Lemke N, et al. Gliosarcoma stem cells undergo glial and mesenchymal differentiation in vivo. Stem Cells. 2010;28:181–190. doi: 10.1002/stem.264. [DOI] [PMC free article] [PubMed] [Google Scholar]
- 22.Kim JH, Khil MS, Kolozsvary A, et al. Fractionated radiosurgery for 9L gliosarcoma in the rat brain. Int J Radiat Oncol Biol Phys. 1999;45:1035–1040. doi: 10.1016/s0360-3016(99)00273-4. [DOI] [PubMed] [Google Scholar]
- 23.Arbab AS, Janic B, Jafari-Khouzani K, et al. Differentiation of glioma and radiation injury in rats using in vitro produce magnetically labeled cytotoxic T-cells and MRI. PLoS One. 2010;5:e9365. doi: 10.1371/journal.pone.0009365. [DOI] [PMC free article] [PubMed] [Google Scholar]
- 24.La Fleur L, Johansson AC, Roberg K. A CD44high/EGFR low subpopulation within head and neck cancer cell lines shows an epithelial-mesenchymal transition phenotype and resistance to treatment. PLoS One. 2012;7:e44071. doi: 10.1371/journal.pone.0044071. [DOI] [PMC free article] [PubMed] [Google Scholar]
- 25.Landini G. http://www.dentistry.bham.ac.uk/landinig/software/software.html. Last updated on 27 Feb 2013. Date accessed Sep 3 2013.
- 26.Weidner N, Semple JP, Welch WR, et al. Tumor angiogenesis and metastasis—correlation in invasive breast carcinoma. N Engl J Med. 1991;324:1–8. doi: 10.1056/NEJM199101033240101. [DOI] [PubMed] [Google Scholar]
- 27.Zhai GG, Malhotra R, Delaney M, et al. Radiation enhances the invasive potential of primary glioblastoma cells via activation of the Rho signaling pathway. J Neurooncol. 2006;76:227–237. doi: 10.1007/s11060-005-6499-4. [DOI] [PubMed] [Google Scholar]
- 28.Wild-Bode C, Weller M, Rimner A, et al. Sublethal irradiation promotes migration and invasiveness of glioma cells: implications for radiotherapy of human glioblastoma. Cancer Res. 2001;61:2744–2750. [PubMed] [Google Scholar]
- 29.Park CM, Park MJ, Kwak HJ, et al. Ionizing radiation enhances matrix metalloproteinase-2 secretion and invasion of glioma cells through Src/epidermal growth factor receptor-mediated p38/Akt and phosphatidylinositol 3-kinase/Akt signaling pathways. Cancer Res. 2006;66:8511–8519. doi: 10.1158/0008-5472.CAN-05-4340. [DOI] [PubMed] [Google Scholar]
- 30.Badiga AV, Chetty C, Kesanakurti D, et al. MMP-2 siRNA inhibits radiation-enhanced invasiveness in glioma cells. PLoS One. 2011;6:e20614. doi: 10.1371/journal.pone.0020614. [DOI] [PMC free article] [PubMed] [Google Scholar] [Retracted]
- 31.Rao JS, Steck PA, Mohanam S, et al. Elevated levels of M[r] 92,000 type IV collagenase in human brain tumors. Cancer Res. 1993;53:2208–2211. [PubMed] [Google Scholar]
- 32.Forsyth PA, Wong H, Laing TD, et al. Gelatinase-A (MMP-2), gelatinase-B (MMP-9) and membrane type matrix metallo-proteinase-1 (MT1-MMP) are involved in different aspects of the pathophysiology of malignant gliomas. Br J Cancer. 1999;79:1828–1835. doi: 10.1038/sj.bjc.6990291. [DOI] [PMC free article] [PubMed] [Google Scholar]
- 33.Kunishio K, Okada M, Matsumoto Y, et al. Matrix metalloproteinase-2 and -9 expression in astrocytic tumors. Brain Tumor Pathol. 2003;20:39–45. doi: 10.1007/BF02483445. [DOI] [PubMed] [Google Scholar]
- 34.Qian LW, Mizumoto K, Urashima T, et al. Radiation-induced increase in invasive potential of human pancreatic cancer cells and its blockade by a matrix metalloproteinase inhibitor, CGS27023. Clin Cancer Res. 2002;8:1223–1227. [PubMed] [Google Scholar]
- 35.Ohuchida K, Mizumoto K, Murakami M, et al. Radiation to stromal fibroblasts increases invasiveness of pancreatic cancer cells through tumor-stromal interactions. Cancer Res. 2004;64:3215–3222. doi: 10.1158/0008-5472.can-03-2464. [DOI] [PubMed] [Google Scholar]
- 36.Egeblad M, Werb Z. New functions for the matrix metalloproteinases in cancer progression. Nat Rev Cancer. 2002;2:161–174. doi: 10.1038/nrc745. [DOI] [PubMed] [Google Scholar]
- 37.Tews DS, Nissen A. Expression of adhesion factors and degrading proteins in primary and secondary glioblastomas and their precursor tumors. Invasion Metastasis. 1998;18:271–284. doi: 10.1159/000024520. [DOI] [PubMed] [Google Scholar]
- 38.Okamoto I, Kawano Y, Murakami D, et al. Proteolytic release of CD44 intracellular domain and its role in the CD44 signaling pathway. J Cell Biol. 2001;155:755–762. doi: 10.1083/jcb.200108159. [DOI] [PMC free article] [PubMed] [Google Scholar]
- 39.Okamoto I, Kawano Y, Tsuiki H, et al. CD44 cleavage induced by a membrane-associated metalloprotease plays a critical role in tumor cell migration. Oncogene. 1999;18:1435–1446. doi: 10.1038/sj.onc.1202447. [DOI] [PubMed] [Google Scholar]
- 40.Okamoto I, Tsuiki H, Kenyon LC, et al. Proteolytic cleavage of the CD44 adhesion molecule in multiple human tumors. Am J Pathol. 2002;160:441–447. doi: 10.1016/S0002-9440(10)64863-8. [DOI] [PMC free article] [PubMed] [Google Scholar]
- 41.Schonk DM, Kuijpers HJ, van Drunen E, et al. Assignment of the gene(s) involved in the expression of the proliferation-related Ki-67 antigen to human chromosome 10. Hum Genet. 1989;83:297–299. doi: 10.1007/BF00285178. [DOI] [PubMed] [Google Scholar]
- 42.Hermens AF, Barendsen GW. Changes of cell proliferation characteristics in a rat rhabdomyosarcoma before and after X-irradiation. Eur J Cancer. 1969;5:173–189. doi: 10.1016/0014-2964(69)90065-6. [DOI] [PubMed] [Google Scholar]
- 43.Plate KH, Breier G, Weich HA, et al. Vascular endothelial growth factor is a potential tumour angiogenesis factor in human gliomas in vivo. Nature. 1992;359:845–848. doi: 10.1038/359845a0. [DOI] [PubMed] [Google Scholar]
- 44.Zagzag D, Lukyanov Y, Lan L, et al. Hypoxia-inducible factor 1 and VEGF upregulate CXCR4 in glioblastoma: implications for angiogenesis and glioma cell invasion. Lab Invest. 2006;86:1221–1232. doi: 10.1038/labinvest.3700482. [DOI] [PubMed] [Google Scholar]
- 45.Strieter RM, Belperio JA, Phillips RJ, et al. CXC chemokines in angiogenesis of cancer. Semin Cancer Biol. 2004;14:195–200. doi: 10.1016/j.semcancer.2003.10.006. [DOI] [PubMed] [Google Scholar]
- 46.Gorski DH, Beckett MA, Jaskowiak NT, et al. Blockage of the vascular endothelial growth factor stress response increases the antitumor effects of ionizing radiation. Cancer Res. 1999;59:3374–3378. [PubMed] [Google Scholar]
- 47.Kil WJ, Tofilon PJ, Camphausen K. Post-radiation increase in VEGF enhances glioma cell motility in vitro. Radiat Oncol. 2012;7:25. doi: 10.1186/1748-717X-7-25. [DOI] [PMC free article] [PubMed] [Google Scholar]
- 48.Chiang CS, Fu SY, Wang SC, et al. Irradiation promotes an m2 macrophage phenotype in tumor hypoxia. Front Oncol. 2012;2:89. doi: 10.3389/fonc.2012.00089. [DOI] [PMC free article] [PubMed] [Google Scholar]
- 49.Kioi M, Vogel H, Schultz G, et al. Inhibition of vasculogenesis, but not angiogenesis, prevents the recurrence of glioblastoma after irradiation in mice. J Clin Invest. 2010;120:694–705. doi: 10.1172/JCI40283. [DOI] [PMC free article] [PubMed] [Google Scholar]


