Abstract
High-speed fluorescence-activated cell sorting is relevant for a plethora of applications, such as PCR-based techniques, microarrays, cloning, and propagation of selected cell populations. We suggest a simple cell-sorting technique to eliminate early and late apoptotic and necrotic cells, with good signal-to-noise ratio and a high-purity yield. The mitochondrial potential dye, TMRE (tetramethylrhodamine ethyl ester perchlorate), was used to separate viable and non-apoptotic cells from the cell sorting samples. TMRE staining is reversible and does not affect cell proliferation and viability. Sorted TMRE+ cells contained a negligible percentage of apoptotic and damaged cells and had a higher proliferative potential as compared with their counterpart cells, sorted on the basis of staining with DNA viability dye. This novel sorting technique using TMRE does not interfere with subsequent functional assays and is a method of choice for the enrichment of functionally active, unbiased cell populations.
Keywords: apoptotic cell elimination, cell sorting, mitochondrial dye, TMRE, caspase, Click-IT, viability
Introduction
FACS (fluorescence-activated cell sorting) became a standard method to produce highly purified cell populations for further evaluation by PCR-based techniques, western blotting, cell culturing, and transplantation experiments, among others. Sample preparation procedures (such as detachment, enzymatic digestion for attached cells, mechanical dissociation for primary cells) may significantly increase the proportion of apoptotic and damaged cells in the sorted sample (Frisch and Screaton 2001; Suh et al. 2005). The sorting of functionally active cells is necessary for cloning and in the propagation of cells in order to assess the growth potential, drug sensitivity, and functional abilities of cells as well as their suitability for cell transplantation experiments. Cells undergoing apoptosis differ from non-apoptotic cells in their immunostimulatory features and their ability to be engrafted (Fuo et al. 2001; de Boer et al. 2002; Duggleby et al. 2012).
Selection of “viable” cells on the basis of light scattering (FSC/SSC – forward scatter channel/side scatter channel dotplot) is often insufficient (Petrunkina and Harrison 2011). The elimination of dead cells on the basis of supravital DNA staining may lead to an overestimation of the viability of the cells, especially in cell preparations of compromised plasma membrane integrity (Jayaraman 2008). These methods are also limited by the inherent toxicity of DNA viability dye (Wlodkowic and Darzynkiewicz 2008). Supravital DNA dyes, such as Hoechst 33342, DRAQ5, and DyeCycle Violet, at the concentrations generally applied to live cells induce DNA damage resulting in blockage of cell cycle progression, increased cell-cycle checkpoint kinase 2 (Chk2) and p53 phosphorylation and, consequently, perturbed G2M progression and changes in histone H2AX phosphorylation (Zhao et al. 2009). Furthermore, cells considered “viable” by DNA staining are often heterogeneous by light scattering parameters and may include populations committed to apoptosis.
The simultaneous determination of dead and apoptotic cells by flow cytometry traditionally requires a minimum of two markers (such as propidium iodide (PI), Annexin V, among others) (Schmid et al. 1999). In attempts to exclude apoptotic cells, several studies report the use of Annexin V as a marker to exclude damaged and apoptotic, but still viable, cells from cell population by immunomagnetic purification (Grunewald et al. 2001; de Vantery Arrighi et al. 2009; Lee et al. 2010). However, cell sorting on the basis of labeling with Annexin V tagged to a fluorescent dye is limited because of the relatively high dissociation constant of the Annexin V/Phosphatidylserine (PS) complex, which results in unstable staining.
Another approach to determine the proportion of apoptotic cells in a sample is the use of potential-dependent staining of mitochondria (Kroemer 1999; Galluzzi et al. 2009). During apoptosis, the decrease in mitochondrial potential precedes the gross morphological changes that occur during the apoptotic process and before exposure of PS on the external leaflet of the plasma membrane (Zamzami et al. 1995; Overbeeke et al. 1999). Therefore, potential-dependent staining of mitochondria may provide a better functional assessment of changes to cell function.
Several dyes have been used to determine mitochondrial potential; yet, many of these dyes have undesirable properties (Modica-Napolitano and Aprille 1987; Chen 1989; Poot and Pierce 1999; Plasek and Sigler, 1996; Castedo et al. 2002). TMRE (tetramethylrhodamine ethyl ester perchlorate) is a highly fluorescent, cationic, lipophilic dye, and its retention depends exclusively on the mitochondrial inner membrane potential (Jayaraman 2005). It was shown that TMRE positivity is associated with an absence of apoptotic processes (King et al. 2007). However, it has yet to be tested whether sorting based on TMRE staining could be useful in excluding apoptotic and dead cells from cell samples. In this study, we show that sorting cells on the basis of staining for mitochondrial potential (TMRE-stained) provides a method to purify a cell population that is negative for the DNA viability dye and has a low percentage of apoptotic cells. Furthermore, we show that TMRE has a negligible effect on cell viability. This type of cell sorting will be advantageous for applications requiring sorted cells with high functional activity.
Materials & Methods
Cell Lines and Reagents
Human THP-1, Jurkat, HeLa and mouse leukemic monocyte macrophage RAW 264.7 cells were obtained from the American Type Culture Collection (ATCC) (Manassas, VA). Cells were grown in RPMI-1640 and DMEM (Dulbecco’s Modified Eagle Medium) (CellGro, Manassas, VA) supplemented with 2 mM L-glutamine (BioWhittaker, Walkersville, MD), 10% heat-inactivated fetal calf serum (FSC) and antibiotics (Sigma-Aldrich, St. Louis, MO) at 37C in CO2 incubator. TMRE, Rhodamine 123 (Rho123) and staurosporine (STS) were purchased from Sigma-Aldrich. JC-10 was purchased from Enzo Life Sciences (Farmingdale, NY). Drugs were dissolved in dimethyl sulfoxide (DMSO). DMSO alone at the same concentration was used as a control.
Flow Cytometry Sorting and Analysis
A 15-channel FACSAria II Cell Sorter (BD Biosciences, San Jose, CA) equipped with various lasers (488 nm, 640 nm, 407 nm and 561 nm).
Annexin V Assay and Caspase 3/7 Staining
The Annexin V-Alexa Fluor 647 (Life Technologies, Grand Island, NY) staining procedure was performed according to the manufacturer’s protocol. Briefly, the cells were resuspended with the Annexin V-binding buffer to a concentration of 1×10⁶ cells/ml and stained with Annexin V-conjugate. Samples were incubated for 20 min at room temperature in the dark. After washing with the Annexin V-binding buffer, the cells were analyzed with a flow cytometer.
For caspase 3/7 staining CellEventTM Caspase 3/7 Green reagent (Life Technologies), a fluorogenic substrate for activated caspase-3 and -7 was used according to the manufacturer’s protocol. The cells were incubated with 5 μM of substrate for 30 min at room temperature and then analyzed with a flow cytometer.
Staining for Mitochondrial Potential and Viability
For staining with TMRE or JC-10, cells were incubated for 10 min with 10 nM JC-10 or for 20 min of 5–100 ng/ml TMRE at 37C. TMRE dye was excited by 561 nm laser and its fluorescence was captured using a bandpass filter at 582/15 nm. Sytox Blue (SB) (Life Technologies) and 7-aminoactinomycin D (7-AAD) were excited by 407 and by 488 nm lasers, respectively.
Click-IT Proliferation Analysis
Click-ITTM EdU-Alexa Fluor488 Kit (Life Technologies) was used to assess cell proliferation. The 5-ethynyl-2’-deoxyuridine (EdU) is a nucleoside analog of thymidine that is incorporated into DNA only during DNA synthesis, allowing for the quantitation of newly synthesized DNA (Salic and Mitchison 2008; Hamelik and Krishan 2009). The use of EdU is a less toxic alternative to the bromodeoxyuridine method, as it does not require the DNA denaturation and harsh permeabilization steps. To perform the assay, sorted cells were treated with 2.5 mM EdU-Alexa Fluor 488 (Life Technologies), directly added to the culture medium, and processed at different time intervals according to manufacturer’s instructions.
Cell Cycle Staining
Cells were incubated in the presence of TMRE (100 and 250 nM) in triplicate, and then fixed for 6 and 24 hr, respectively, with cold ethanol that was added carefully to the mix. Cells were then pelleted and stained with 50 µg/ml PI and 0.1 mg/ml RNase A (both from Sigma-Aldrich). The PI signal was acquired using the FACSCalibur cytometer in FL-1 channel (BD Biosciences).
Quantitative Imaging Cytometry Analysis
Imaging cytometry analysis on Imagestream 100 (Amnis, Seattle, WA), equipped with 488, 658 and 405 nm laser sources and brightfield light source, was performed using 40× objective, as described elsewhere (Ponomarev et al. 2011). For subsequent analysis with IDEAS software (Amnis), approximately 5000–20,000 cell events were collected.
Phagocytosis Assay
CypHer5E mono N-hydroxysuccinimide ester (CypHer5E) was obtained from GE Healthcare (Piscataway, NJ) and conjugated with 1-μm Amino beads purchased from Polysciences (Warrington, PA). Briefly, particles were spun down at 3,000 rpm/min and resuspended in 0.1 M sodium carbonate (pH 9.0), as described by Beletskii et al. (2005). After agitation for 2 hr at room temperature, CypHer5E-conjugated particles were resuspended in phosphate-buffered saline (PBS) and centrifuged three more times. Particles were tested microscopically for background level before use.
Bone marrow-derived macrophages were isolated from 6-week-old C57BL/6 mice. After lysing erythrocytes, mononuclear cells were incubated with M-CSF (myeloid colony-stimulating factor) at 10 ng/ml in DMEM supplemented with 10% FBS for 5 days, with media changes every 2–3 days. Bone marrow-derived primary macrophages were incubated with CypHer5E-conjugated beads for 1 hr and then analyzed by flow and imaging cytometry.
Microscopic Analysis
Cells were imaged at room temperature using a 40×/0.75 objective on a Zeiss Axiovert 200 fluorescent microscope (Carl Zeiss Microscopy Inc., Thornwood, NY) equipped with a CoolSNAP HQ2 camera (Photometrics, Tucson, AZ), and using SlideBook 4.2 software (Intelligent Imaging Innovations Inc., Denver, CO).
Statistical Analysis
At least 10,000 events were acquired using the flow cytometer. The data on Annexin V, cell cycle and mitochondrial-potential staining were analyzed by Diva 6.1 and CellQuest software (BD Biosciences) and FlowJo software (TreeStar Inc., Ashland, OR). Statistical analysis was performed using a paired t-test.
Results
Mitochondrial Potential Staining
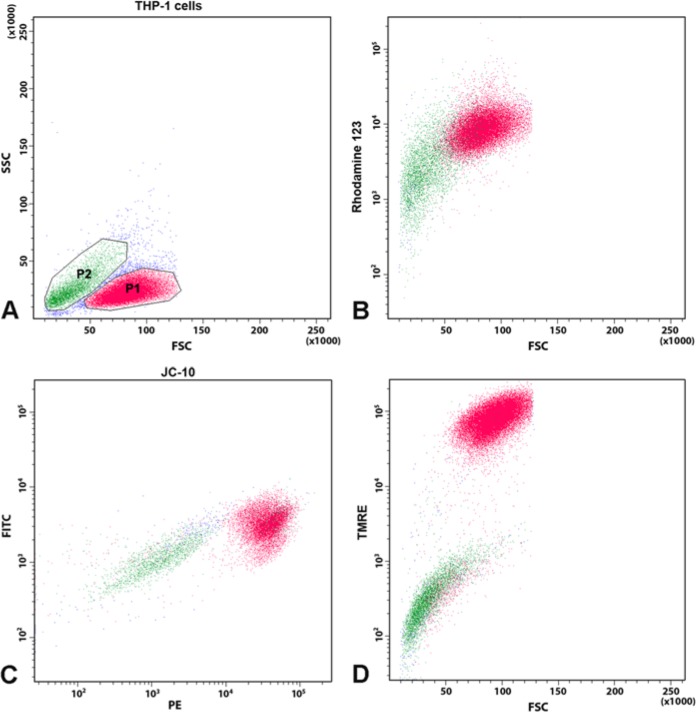
We used mitochondrial dyes, TMRE, Rho123 and JC-10, to define cell subpopulations for the characterization of mitochondrial potential of different cell lines (THP-1, HeLa, Jurkat). Figure 1 shows representative dotplots of THP-1 cells stained with different mitochondrial dyes. TMRE staining of cells allowed two cell populations to be defined—positive and low-negative (Fig.1A)—using a wide range of dye concentrations—from 5 nM to 100 nM. The difference between negative and positive TMRE populations, calculated as a staining index (SI), was similar within the 10-100 nM range (SI = 21.7–27.3) and slightly decreased at 5 nM (SI = 13.6). The dynamic range (minimal to maximal concentrations) that resulted in significant differences between positive and negative populations was higher for TMRE (5–100 nM) as compared with Rho123 (very low SI) and JC-10 (low SI) (data not shown).
Figure 1.
Representative flow cytometric patterns of THP-1 cells stained with Rhodamine (Rho)123, JC-10 and TMRE. (A) Dotplot of light scattering distribution of THP-1 cells. (B) Dotplot of Rho123 staining. Red and green dots correspond to the events depicted in the respective forward scatter/side scatter (FSC/SSC) plots in the regions R1 and R2. (C) Dotplot of JC-10 fluorescence (488 nm laser, bandpass 576/26 on the x-axis and bandpass 530/30 on the y-axis); (D) Dotplot of TMRE staining (561 nm laser, bandpass 582/15).
Negative and low TMRE-subpopulations corresponded to the DNA dye-positive subpopulations (dead and highly damaged cells), whereas TMRE-positive (TMRE+) cells were DNA dye negative; i.e., viable (verified by staining with DNA viability dyes: SB, 7-AAD and TO-PRO-3).
Light scatter analysis revealed that cell subpopulations that were negative or dim for mitochondrial dyes produced a low FSC signal, whereas cell populations brightly stained with mitochondrial dyes produced a high FSC signal. In the culture specimens (THP-1, HeLa, Jurkat) with significant spontaneous apoptosis, TMRE staining closely matched with FSC/SSC distribution: TMRE+ cells had a low SSC, wheras TMRE-negative (TMRE–) cells had a high SSC/FSC ratio. However, some cells with a low SSC/FSC ratio were also TMRE– and they were further analyzed using apoptosis markers.
Imaging and Flow Cytometry Analysis of TMRE-stained Cell Subpopulations
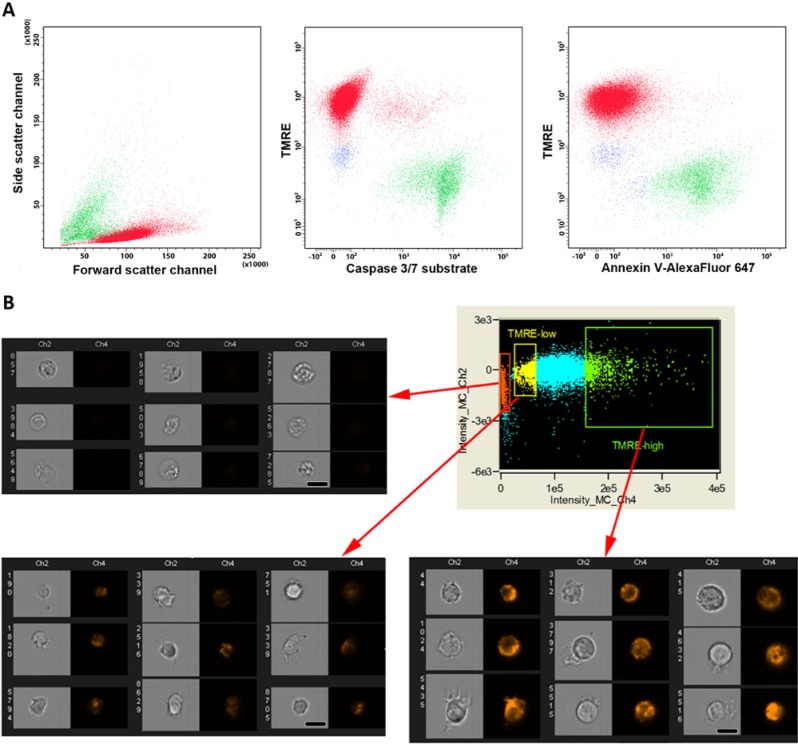
To evaluate the usefulness of TMRE for cell sorting, we stained Jurkat cells with Annexin V and the fluorescent caspase 3/7 substrate. The distributions of subsets were estimated with respect to populations selected on the basis of these apoptotic markers, DNA viability dye (SB) or TMRE staining. The percentage of cells belonging to each subset (SB–/Annexin V+, SB–/Annexin V–, TMREhigh/Annexin V+, TMREhigh/Annexin V–, TMRElow/Annexin V+, TMRElow/Annexin V– or similar populations positive/negative for caspase 3/7 substrate) was evaluated in 3×10⁴ cells for each sample. The population of TMREhigh cells contained <1% of apoptotic cells (Annexin V+ and caspase 3/7+), whereas the population of TMRE– cells had only 0.4–0.5% of Annexin V– cells (Fig. 2A). Thus, TMRE allowed us to discriminate between “viable” cell populations, as defined by the DNA viability marker, and the subpopulation of early apoptotic cells. To check the possibility that TMRElow staining might come from a relatively small volume of the cytoplasm in some cells, we analyzed the size of TMRE-stained THP-1 cells directly with Imagestream 100 (Amnis, Seattle, WA). The result obtained showed no correlation between the size of the cells (intensity of signal in the brightfield channel and cell area) versus fluorescence intensity of TMRE-staining (Fig. 2B). TMRE– cells had a similar distribution area as the positive ones; however, their fraction was contaminated with debris particles.
Figure 2.
TMRE staining of THP-1 cells. (A) Triple staining of Jurkat cells after induction of apoptosis by staurosporine (STS) with TMRE (561 nm laser, bandpass 582/15), Annexin V-AlexaFluor 647 (640 nm laser; bandpass 660/20), caspase 3/7 substrate (488 nm laser, bandpass 530/30). Green, TMRE+ High cells; red, TMRE– Negative cells; yellow, TMRELow. (B) Dotplot and representative images of THP-1 cells captured by Imagestream100 (Amnis, Seattle, USA) from TMREhigh (green box), TMRElow (yellow box) and TMRE– (orange box) populations. Scale bar, 20 μm.
Phagocytosis of CypHer5E-conjugated Beads by Different Fractions of TMRE-stained Macrophages
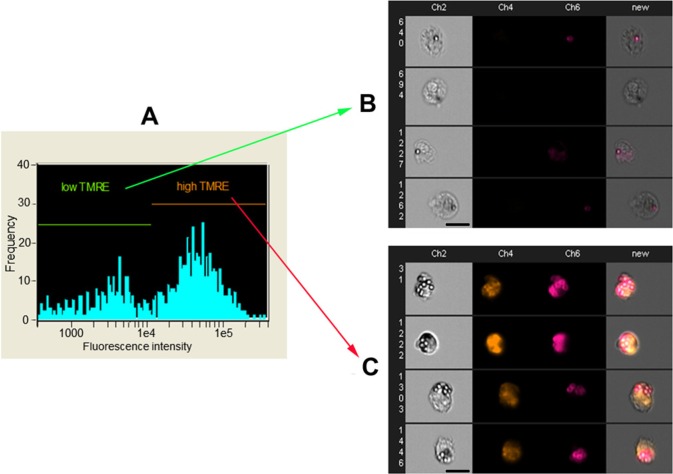
The assessment of functional activity of TMRE-stained cells was carried out using phagocytosis assay with CypHer5E-conjugated beads on primary bone marrow macrophages. Engulfed CypHer5E-conjugated beads showed a large increase in fluorescence intensity compared with adherent beads (Fig. 3). The level of phagocytosis was measured as the MFI (mean fluorescent index) of CypHer5E fluorescence. The MFI of CypHer5E fluorescence of TMREhigh macrophages was five times higher than MFI of TMRElow macrophages (p<0.001) (Fig. 3B, 3C).
Figure 3.
Phagocytosis of CypHer5E-conjugated beads by primary bone marrow murine macrophages. (A) Histogram of the fluorescent distribution of internalized and adherent CypHer5E-beads in bone marrow macrophages. (B) Representative images of TMREhigh bone marrow cells with phagocytosed CypHer5E-conjugated 1-μm latex beads. (C) Representative images of TMRElow bone marrow cells with phagocytosed or adherent CypHer5E-conjugated 1-µm latex beads. Images were captured by flow imaging cytometer Imagestream 100 (Amnis, Seattle, WA). Scale bar, 20 μm.
TMRE Does Not Affect Cell Proliferation
The intensity of TMRE staining did not change significantly during cell sorting (2–6 hr). However, after 24 hr incubation in the dye-free culture medium, we observed a significant loss of TMRE staining (data not shown). This is advantageous for further multi-color staining of sorted cells, leaving free an additional fluorescent channel.
TMRE dye continuously present in cell medium does not affect cell proliferation; the percentage of Jurkat cells in the cell cycle distribution after TMRE incubation for 6 or 24 hr (using the PI staining protocol) was not different at all cycle phases as compared with control cells incubated without TMRE (data not shown). Jurkat cells in the S-phase represented 40–45% of the total cell population for both TMRE-incubated (100 nM) and control cells at both 6 and 24 hr. The TMRE dose of 250 nM induced a slight decrease of the percentage of Jurkat cells in the S-phase (36–40%); however, this difference was still statistically insignificant.
To further evaluate the influence of TMRE on cell proliferation, we loaded sorted TMRE+ and unsorted control THP-1 cells with EdU and assessed the percentage of cells in the proliferating state (Fig. 4A, 4B). After 24 hr incubation, the percentage of proliferating cells decreased only slightly (from 49% to 43%) in the TMRE-stained cell population. Proliferation determined by Click-IT also showed that TMRE-loaded THP-1 cells have nearly the same proliferation index as compared to the unloaded ones (Fig. 4B).
Figure 4.
(A) DNA histograms of EdU-labeling of TMREhigh and TMRElow subpopulations of Jurkat cells. (B) DNA histograms of EdU-labeling of Jurkat cells treated with 100 nM TMRE for different time periods (2, 4, 6 and 8 hr) in comparison with untreated cells. (C) Representative images of sorted THP-1 cells after 2 hr incubation in culture medium. Upper panel, TMREhigh; lower panel, TMRElow. Scale bar, 20 μm. Overlay differential interference contrast (DIC)/Fluorescence (in red channel).
Next, we sorted different TMRE subpopulations of THP-1 and HeLa cell lines and, after culturing of sorted cells, found that TMREhigh cells proliferate normally in 2 hr after sorting (44.9% proliferating cells versus 51.6% for unsorted THP-1 cells) and attach normally to the dish surface (Fig. 4A, 4C). However, the TMRE– subpopulation failed to attach to the dish surface and almost did not proliferate (3.03%) (Fig. 4C).
Analysis of Cell Sorting Based on TMRE Staining with Annexin V, Caspase 3/7 Substrate and DNA Viability Dye, Sytox Blue
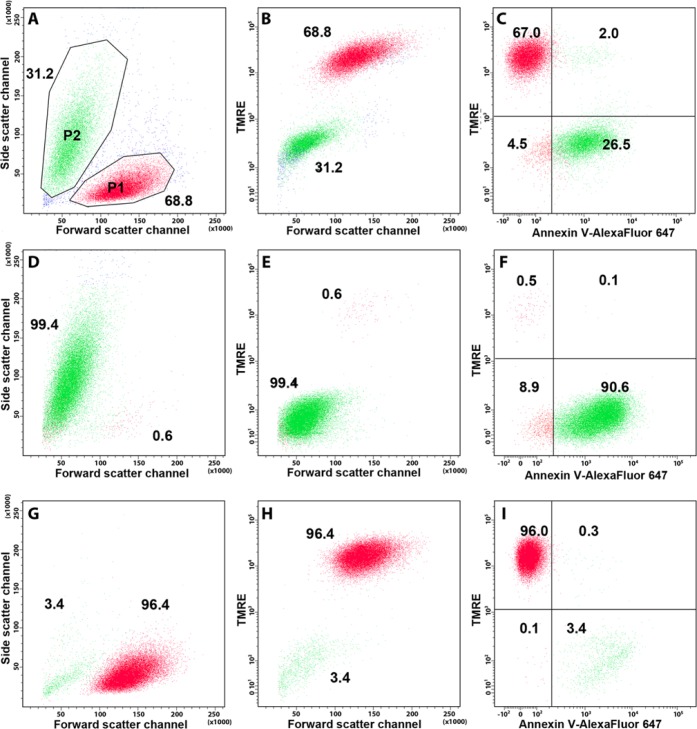
We next sorted HeLa, Jurkat and THP-1 cells with a significant level of spontaneous apoptosis (% of Annexin V+ and/or caspase substrate-positive cells was 12.8–31.2) based on TMRE staining, and then analyzed the populations obtained. A representative sorting experiment is illustrated in Figure 5. Populations sorted as TMRE+ contained 2–3% of late apoptotic/dead cells (Annexin V+ and SB+) (Fig. 5I), whereas populations sorted as TMRE– contained only 0.5% TMRE+ cells (Fig. 5F). Thus, TMRE-based cell sorting allowed for almost a complete separation of viable non-apoptotic cells.
Figure 5.
Discrimination of viable, apoptotic, and late apoptotic/necrotic cells using TMRE (green), Sytox Blue (blue) and Annexin V-Alexa Fluor 647 (red). (A) Apoptotic (red) and viable (green) unsorted Jurkat cell populations defined by light scattering. (B) Apoptotic and viable unsorted Jurkat cell populations defined by TMRE staining. (C) Apoptotic and viable unsorted Jurkat cell populations defined by TMRE and Annexin V-Alexa Fluor 647 staining. (D) Sorted TMRElow cell population, defined by light scattering. (E) Sorted TMRElow cell population, defined by TMRE staining and forward scatter. (F) Sorted TMRElow cell population, defined by TMRE and Annexin V-Alexa Fluor 647 staining. (G) Sorted TMREhigh cell population, defined by light scattering. (H) Sorted TMREhigh cell population defined by TMRE staining and forward scatter. (I) Sorted TMREhigh cell population, defined by TMRE and Annexin V-Alexa Fluor 647 staining. Numbers show the percentage of cells in each population (A, B, D, E, G, H) or in quadrants (C, F, I). Red and green dots correspond to the events depicted in the respective FSC/SSC plots in the regions P1 and P2.
Next, we induced apoptosis by STS in Jurkat cells. STS was introduced at a range of concentrations (0.1–0.5 μg/ml), and a final dose of 0.2 μg/ml with an incubation time of 3 hr was chosen for sorting experiments. The unsorted cell sample stained with TMRE contained 72% Annexin V+ cells (Suppl. Fig. 1). Forward scatter/side scatter (FSC/SSC) distribution alone was insufficient to separate the apoptotic and non-apoptotic populations. In unsorted STS-treated cells, the SSClow population, normally described as ‘viable’ cells, contained a high percentage of apoptotic cells (up to 34%). We sorted the functional ‘alive’ cells from the STS-treated cell sample based exclusively on mitochondrial potential staining. The purified TMREhigh cell subpopulation was almost negative for the apoptotic marker caspase 3/7 substrate (0.5%) and negative for SB staining (less than 0.3%; data not shown). Besides, TMRE-based sorting allowed for the elimination of the SBintermediate cell subpopulation, which includes a significant proportion of apoptotic cells.
Analysis of Proliferative Activity after Cell Sorting of TMRE-stained and SB-stained Cells
Next, we compared the proliferative potential of cell subpopulations sorted on the basis of TMRE-staining of non-apoptotic cells (TMREhigh cell subset), and the cell subpopulation sorted based on the exclusion of dead cells with SB-viability staining. In the first series of experiments, we used Jurkat cells maintained in vitro with high level of spontaneous apoptosis (up to 40%). It has been previously reported that the population of cells undergoing spontaneous apoptosis between cultured and/or transfected cells might be rather large—up to 25% or even more (Qiao and Farrell 1999; Sapozhnikov et al. 1999; Vassena et al. 2007). The sorted, non-apoptotic TMREhigh cell subpopulation was evaluated by Click-IT EdU cell proliferation assay based on incorporation of EdU in newly synthesized DNA and its staining by azide dyes via a copper-mediated “click” reaction (King et al. 2007). The percentage of proliferating cells was higher than in the sample sorted on the basis of conventional DNA dye-exclusion: 28% versus 18.3% (Fig. 6; representative experiment; p<0.01).
Figure 6.
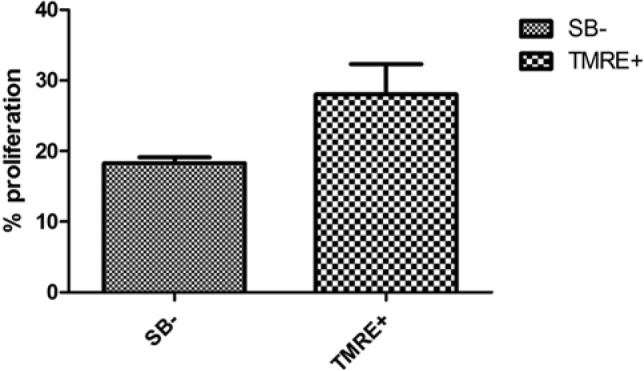
Comparison of the percentage of proliferating cells in TMRE+ and Sytox Blue-negative (SB–) sorted Jurkat cells. Data are expressed as mean ± SEM, n=3; p<0.01.
In the next series of experiments, we sorted primary mouse thymocytes stained either with TMRE or SB, and evaluated the proliferative potential of sorted TMREhigh and SB– populations. In all sorted samples, the percentage of proliferating cells was higher in TMREhigh than in SB– cells, (Fig. 7; representative experiment; p<0.01).
Figure 7.
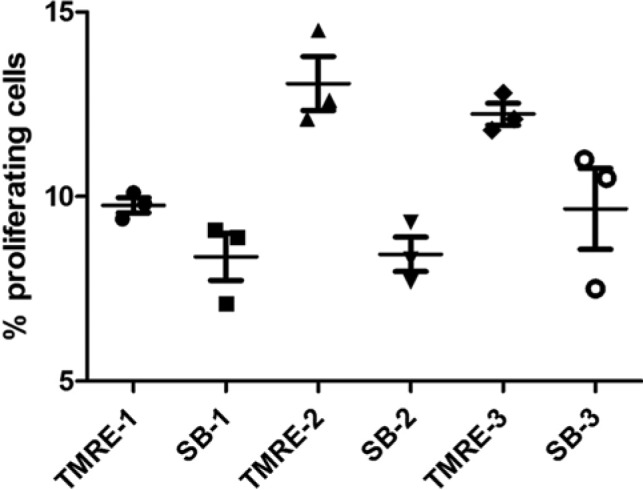
Comparison of the percentage of proliferating cells in TMRE+ and Sytox Blue-negative (SB–) sorted primary murine thymocytes from mice. In the representative experiment (129/SV substrains), thymocytes from each mouse were stained with TMRE or SB and sorted on FACSAria II cytometer. The sorted TMRE+ and SB– subpopulations were labeled with EDU for 16 hr, and then processed according to manufacturer’s instructions. Data are expressed as mean ± SEM, with at least three parallel sorted samples taken from each mouse; p<0.01.
Discussion
In an effort to minimize the loss of function when sorting cultured cells from dead and apoptotic ones, we used a single-step sorting method with mitochondrial dye (TMRE). Cell sorting on the basis of mitochondrial dye staining was previously used to produce a functionally active subpopulation of spermatozoa, viable islet cells and for the separation of cardiomyocytes from fibroblasts (Auger et al. 1993; Khryapenkova et al. 2008; Hattori et al. 2009; Sousa et al. 2011).
We compared TMRE positivity with apoptotic markers (Annexin V and caspase 3/7 substrate staining) and found that all cells positive for Annexin V and caspase 3/7 substrate are strongly compromised on their mitochondrial potential, as assessed by TMRE staining (Fig. 4).
The important asset of FACS-sorting is the ability to use live, sorted cell fractions for further in vitro and/or in vivo assays. TMRE staining can be performed in complete culture medium and does not require any additional components. In contrast, efficient staining with Annexin V requires a special Ca2+-containing buffer. Besides, Annexin V staining is transient and probes have to be analyzed within 1-2 hr. Retention of the TMRE is optimal for sorting; even after 4-6 hr, the difference between the positive and negative populations is large enough for efficient cell sorting. Transition of cells into the dye-free medium has minimal effect on dye efflux and staining gradually disappears within 24 hr, similar to that observed with the tetramethylrhodamine methyl ester (TMRM) dye (Hattori et al. 2009).
In our experiments, TMRE staining had an obvious advantage over other mitochondrial dyes, resulting in the highest staining index (Fig. 1) and, in accordance with literary sources, the cells showed differences in stain retention and cytotoxicity (Modica-Napolitano and Aprille 1987; Chen 1989; Poot and Pierce 1999). JC-10 staining also made it possible to define a negative subpopulation of cells positive for apoptotic markers (Fig. 1), but the fluorescence shift between low and high populations was not as dramatic as it was for TMRE.
Many mitochondrial dyes, such as JC-1, Rho123, and DiOC6(3), have a number of drawbacks (Metivier et al. 1998). Rho123 is phototoxic and inhibits mitochondrial ATPase function (Modica-Napolitano and Aprille 1987; Chen 1989). Staining with Rho123 and DiOC6(3) indirectly depends on mitochondrial potential (Metivier et al. 1998), and also on the potassium concentration in the incubation medium (Plasek and Sigler, 1996; Hattori et al. 2009). Conditions such as these make Rho123 and DiOC6(3) less suitable for the evaluation of mitochondrial potential and early apoptotic changes as compared with TMRE. TMRE was extensively used for labeling and measuring of membrane potential in living cells by fluorescence and confocal microscopy because it does not inhibit mitochondrial function, unlike other mitochondrial potential-sensitive dyes (Jayaraman 2005).
The population of cells undergoing spontaneous apoptosis can be significant: 25% or higher (Qiao and Farrell 1999; Sapozhnikov et al. 1999; Vassena et al. 2007). The sample preparation procedure (detachment of cells followed by enzyme digestion) may additionally increase the percentage of apoptotic cells in the sorted sample. TMRE, in combination with light scattering gating, achieves 96-97% purity of viable cells, even in the case of high contamination with dead and apoptotic cells. This feature might be useful for the comparison of sorted populations. One of the advantages of TMRE staining is the negligible number of TMRE intermediate cells (<1% in our experiments), whereas DNA dyes can produce intermediate populations as large as 10%.
It is known that supravital DNA dyes possess different negative effects on cells. DRAQ5 induces chromatin aggregation and selective blocking of cells in the G2M phase (Zhao et al. 2009). Vybrant DyeCycle Orange induces significant cytotoxic responses in HL-60 and U937 cells (Wlodkowic and Darzynkiewicz 2008), whereas DyeCycle Violet suppresses progression through G2M and S-phases (Zhao et al. 2009). Thus, staining with supravital DNA dyes may have significant consequences for the functionality of sorted cells and their progeny. In our experiments, staining with TMRE (up to 100 nM) had almost no effect on the cell cycle progression or proliferation of sorted cells (Fig. 2). Moreover, the sorted TMRE+ subpopulation of cells (cell lines and/or primary thymocytes) was highly purified (Fig. 5) and had higher proliferative potential compared with cells sorted on the basis of viability dye staining (SB) (Figs. 6, 7). Also, TMREhigh stained cells (bone marrow macrophages) had a higher capability for phagocytosis as compared with the TMRElow cellular subpopulation (Fig. 3).
We used TMRE in combination with Alexa Fluor 647 (red laser), caspase 3/7 substrate (green channel from 488 nm laser), and SB (blue channel from 407 nm laser). With the exception of the PE channel, all other channels could be used, including dyes such as TO-PRO-3, 7-AAD and Brilliant Violet-conjugates. TMRE staining could be combined with transfection with green fluorescent protein (GFP), its derivatives (enhanced GFP or Blue Fluorescent Protein (BFP)) and a variety of far red proteins (mCherry, m-Kate-2, among others).
This is the first report to demonstrate that the selection of non-apoptotic cells by staining with the non-toxic mitochondrial dye TMRE can significantly decrease the percentage of damaged and functionally inactive cells in different types of cultured cells and enrich for cells with a higher proliferative potential. Cell sorting on the basis of TMRE staining has a negligible effect on cell cycle, allows for the elimination of dead, damaged and apoptotic cells, and can be crucial for applications requiring functional activity of cells, such as phagocytosis assays or assessing proliferative potential.
Acknowledgments
We are also grateful to Aleksandra Gorelova and Julia Hillabrant for help with the editing and preparation of the manuscript.
Footnotes
Supplementary material for this article is available on the Journal of Histochemistry & Cytochemistry Web site at http://jhc.sagepub.com/supplemental.
Declaration of Conflicting Interests: The author(s) declared no potential conflicts of interest with respect to the research, authorship, and/or publication of this article.
Funding: The author(s) disclosed receipt of the following financial support for the research, authorship, and/or publication of this article: The work was supported in part by NIH S10 RR023459 grant, Harvard Pilot grant, Russian Foundation for Basic Research grants 11-04-01749a and 13-04-40189-H and Program in Cellular and Molecular Medicine, Boston Children’s Hospital.
References
- Auger J, Leonce S, Jouannet P, Ronot X. (1993). Flow cytometric sorting of living, highly motile spermatozoa based on evaluation their mitochondrial activity. J Histochem Cytochem 41:1247-1253 [DOI] [PubMed] [Google Scholar]
- Beletskii A, Cooper M, Sriraman P, Chiriac C, Zhao L, Abbot S, Yu L. (2005). High-throughput phagocytosis assay utilizing a pH-sensitive fluorescent dye. Biotechniques 39: 894-897 [DOI] [PubMed] [Google Scholar]
- de Boer F, Draeger AM, Pinedo HM, Kessler FL, Monnee-van Muijen M, Weijers G, Westra G, van der Wall E, Netelenbos T, Oberink JW, Huijgens PC, Schuurhuis GJ. (2002). Early apoptosis largely account for functional impairment of CD34+ cells in frozen-thawed stem cell grafts. J Hematother Stem Cell Res 11:951-963 [DOI] [PubMed] [Google Scholar]
- Castedo M, Ferri K, Roumier T, Metivier D, Zamzami N, Kroemer G. (2002). Quantitation of mitochondrial alterations associated with apoptosis. J Immunol Methods 26:539-47 [DOI] [PubMed] [Google Scholar]
- Chen LB. (1989). Fluorescent labeling of mitochondria. Methods Cell Biol 29:103-123 [DOI] [PubMed] [Google Scholar]
- Duggleby RC, Querol S, Davy RC, Fry LJ, Gibson DA, Horton RB, Mahmood SN, Gomez SG, Madrigal JA. (2012). Flow cytometry assessment of apoptotic CD34+ cells by annexin V labeling may improve prediction of cord blood potency for engraftment. Transfusion 52:549-559 [DOI] [PubMed] [Google Scholar]
- Frisch SM, Screaton RA. (2001). Anoikis mechanisms. Curr Opin Cell Biol. 13: 555-562 [DOI] [PubMed] [Google Scholar]
- Fuo T, Guo D, Huang X, O’Gorman MR, Huang L, Crawford SE, Soriano HE. (2001). Apoptosis occurs in isolated and banked primary mouse hepatocytes. Cell Transplant 10:59-66 [PubMed] [Google Scholar]
- Galluzzi L, Aaronson SA, Abrams J, Alnemri ES, Andrews DW, Baehrecke EH, Bazan NG, Blagosklonny MV, Blomgren K, Borner C, Bredesen DE, Brenner C, Castedo M, Cidlowski JA, Ciechanover A, Cohen GM, De Laurenzi V, De Maria R, Deshmukh M, Dynlacht BD, El-Deiry WS, Flavell RA, Fulda S, Garrido C, Golstein P, Gougeon ML, Green DR, Gronemeyer H, Hajnóczky G, Hardwick JM, Hengartner MO, Ichijo H, Jäättelä M, Kepp O, Kimchi A, Klionsky DJ, Knight RA, Kornbluth S, Kumar S, Levine B, Lipton SA, Lugli E, Madeo F, Malomi W, Marine JC, Martin SJ, Medema JP, Mehlen P, Melino G, Moll UM, Morselli E, Nagata S, Nicholson DW, Nicotera P, Nuñez G, Oren M, Penninger J, Pervaiz S, Peter ME, Piacentini M, Prehn JH, Puthalakath H, Rabinovich GA, Rizzuto R, Rodrigues CM, Rubinsztein DC, Rudel T, Scorrano L, Simon HU, Steller H, Tschopp J, Tsujimoto Y, Vandenabeele P, Vitale I, Vousden KH, Youle RJ, Yuan J, Zhivotovsky B, Kroemer G. (2009). Guidelines for the use and interpretation of assays for monitoring cell death in higher eukaryotes. Cell Death Differ 16:1093-1107 [DOI] [PMC free article] [PubMed] [Google Scholar]
- Grunewald S, Paasch U, Glander H-J. (2001). Enrichment of non-apoptotic human spermatozoa after cryopreservation by immunomagnetic cell sorting. Cell and Tissue Banking 2:127-133 [DOI] [PubMed] [Google Scholar]
- Hamelik RM, Krishan A. (2009). Click-it assay with improved DNA distribution histograms. Cytometry Part A. 75: 862-865 [DOI] [PubMed] [Google Scholar]
- Hattori F, Chen H, Yamashita H, Tohyama S, Satoh YS, Yuasa S, Li W, Yamakawa H, Tanaka T, Onitsuka T, Shimoji K, Ohno Y, Egashira T, Kaneda R, Murata M, Hidaka K, Morisaki T, Sasaki E, Suzuki T, Sano M, Makino S, Oikawa S, Fukuda K. (2009). Nongenetic method for purifying stem cell-derived cardiomyocytes. Nat Methods 7:61-66 [DOI] [PubMed] [Google Scholar]
- Jayaraman S. (2005). Flow cytometric determination of mitochondrial membrane potential changes during apoptosis of T lymphocytes and pancreatic beta cell lines: comparison of tetramethylrhodamineethylester (TMRE), chloromethyl-X-rosamine (H2-CMX-Ros) and MitoTracker Red 580 (MTR580). J Immunol Methods 306:68-79 [DOI] [PubMed] [Google Scholar]
- Jayaraman S. (2008). A novel method for the detection of viable human pancreatic cells by flow cytometry using fluorophores that selectively detect labile zinc, mitochondrial potential and protein thiols. Cytometry Part A 73A:615-625 [DOI] [PubMed] [Google Scholar]
- King MA, Eddaoudi A, Davies DC. (2007). A comparison of three flow cytometry methods for evaluating mitochondrial damage during staurosporine-induced apoptosis in Jurkat cells. Cytometry Part A 71A:668-674 [DOI] [PubMed] [Google Scholar]
- Khryapenkova TG, Plotnikov EY, Korotetskaya MV, Sukhikh GT, Zorov DB. (2008). Heterogeneity of mitochondrial potential as a marker for isolation of pure cardiomyoblast population. Cell Technologies in Biol and Med 4:506-511 [DOI] [PubMed] [Google Scholar]
- Kroemer G. (1999). Mitochondrial control of apoptosis. Biochem Soc Symp 66:1-15 [DOI] [PubMed] [Google Scholar]
- Lee TH, Liu CH, Shih YT, Tsao HM, Huang CC, Chen HH, Lee MS. (2010) Magnetic-activated cell sorting for sperm preparation reduces spermatozoa with apoptotic markers and improves the acrosome reaction in couples with unexplained infertility. Hum Reprod. 25: 839-846 [DOI] [PubMed] [Google Scholar]
- Metivier D, Dallaporta B, Zamzami N, Larochette N, Susin SA, Marzo I, Kroemer G. (1998). Cytofluorometric detection of mitochondrial alterations in early CD95/Fas/Apo-1- triggered apoptosis of Jurkat T lymphoma cells. Comparison of seven mitochondrion-specific fluorochromes. Immunol Lett 61:157-163 [DOI] [PubMed] [Google Scholar]
- Modica-Napolitano JS, Aprille JR. (1987). Basis for selective cytotoxicity of rhodamine 123. Cancer Res 47:4361-4365 [PubMed] [Google Scholar]
- Overbeeke R, Yildirim M, Reutelinsperger CPM, Haanen C, Vermes I. (1999). Sequential occurrence of mitochondrial and plasma membrane alterations, fluctuations in cellular Ca2+ and pH during initial and later phases of cell death. Apoptosis 4:455-460 [DOI] [PubMed] [Google Scholar]
- Petrunkina AM, Harrison RA. (2011). Mathematical analysis of mis-estimation of cell subsets in flow cytometry: viability staining revisited. J Immunol Methods 368:71-79 [DOI] [PubMed] [Google Scholar]
- Plasek J, Sigler K. (1996). Slow fluorescent indicators of membrane potential: a survey of different approaches to probe response analysis. J Photochem Photobiol B 33:101-124 [DOI] [PubMed] [Google Scholar]
- Ponomarev ED, Veremeyko T, Barteneva NS. (2011). Visualization and quantitation of the expression of microRNAs and their target genes in neuroblastoma single cells using imaging cytometry. BMC Res Notes 4:517. [DOI] [PMC free article] [PubMed] [Google Scholar]
- Poot M, Pierce RH. (1999). Detection of changes in mitochondrial function during apoptosis by simultaneous staining with multiple fluorescent dyes and correlated multiparameter flow cytometry. Cytometry 35:311-317 [DOI] [PubMed] [Google Scholar]
- Qiao L, Farrell GC. (1999). The effects of cell density, attachment substratum and dexamethasone on spontaneous apoptosis of rate hepatocytes in primary culture. In Vitro Cell Dev Biol Anim 35:417-424 [DOI] [PubMed] [Google Scholar]
- Salic A, Mitchison TJ. (2008). A chemical method for fast and sensitive detection of DNA synthesis in vivo. Proc Natl Acad Sci U S A 105:2415-2420 [DOI] [PMC free article] [PubMed] [Google Scholar]
- Sapozhnikov AM, Ponomarev ED, Tarasenko TN, Telford WG. (1999). Spontaneous apoptosis and expression of cell surface heat-shock proteins in cultured EL-4 lymphoma cells. Cell Prolif 32:363-378 [DOI] [PMC free article] [PubMed] [Google Scholar]
- Schmid I, Ferbas J, Uittenbogaart CH, Giorgi JV. (1999). Flow cytometric analysis of live cell proliferation and phenotype in populations with low viability. Cytometry 35:64-74 [DOI] [PubMed] [Google Scholar]
- Sousa AP, Amaral A, Baptista M, Tavares R, Caballero Campo P, Caballero Peregrín P, Freitas A, Paiva A, Almeida-Santos T, Ramalho-Santos J. (2011). Not all sperm are equal: functional mitochondria characterize a subpopulation of human sperm with better fertilization potential. PLoS One 6:e18112. [DOI] [PMC free article] [PubMed] [Google Scholar]
- Suh TK, Schenk JL, Seidel GE. (2005). High pressure flow cytometric sorting damages sperm. Theriogenology 64:1035-1048 [DOI] [PubMed] [Google Scholar]
- de Vantery Arrighi C, Lucas H, Chardonnens D, de Agostini A. (2009). Removal of spermatozoa with externalized phosphatidylserine from sperm preparation in human assisted medical procreation: effects on viability, motility and mitochondrial membrane potential. Reprod Biol Endocrinol 7:1. [DOI] [PMC free article] [PubMed] [Google Scholar]
- Vassena L, Proschan M, Fauci AS, Lusso P. (2007). Interleukin 7 reduces the levels of spontaneous apoptosis in CD4+ and CD8+ T cells from HIV-1-infected individuals. Proc Natl Acad Sci U S A 104:2355-2360 [DOI] [PMC free article] [PubMed] [Google Scholar]
- Wlodkowic D, Darzynkiewicz Z. (2008). SYTO probes in the cytometry of tumor cell death. Cytometry A 73A:496-507 [DOI] [PubMed] [Google Scholar]
- Zamzami N, Marchetti P, Castedo M, Zanin C, Vayssiere JL, Petit PX, Kroemer G. (1995). Reduction in mitochondrial potential constitutes an early irreversible step of programmed lymphocyte death in vivo. J Exp Med 181:1661-1672 [DOI] [PMC free article] [PubMed] [Google Scholar]
- Zhao H, Traganos F, Dobrucki J, Wlodkowic D, Darzynkiewicz Z. (2009). Induction of DNA damage response by the supravital probes of nucleic acids. Cytometry A 75:510-519 [DOI] [PMC free article] [PubMed] [Google Scholar]


