Abstract
Histotripsy produces tissue fractionation through dense energetic bubble clouds generated by short, high-pressure, ultrasound pulses. Conventional histotripsy treatments have used longer pulses from 3 to 10 cycles wherein the lesion-producing bubble cloud generation depends on the pressure-release scattering of very high peak positive shock fronts from previously initiated, sparsely distributed bubbles (the “shock-scattering” mechanism). In our recent work, the peak negative pressure (P−) for generation of dense bubble clouds directly by a single negative half cycle, the “intrinsic threshold,” was measured. In this paper, the dense bubble clouds and resulting lesions (in RBC phantoms and canine tissues) generated by these supra-intrinsic threshold pulses were studied. A 32-element, PZT-8, 500 kHz therapy transducer was used to generate very short (< 2 cycles) histotripsy pulses at a pulse repetition frequency (PRF) of 1 Hz and P− from 24.5 to 80.7 MPa. The results showed that the spatial extent of the histotripsy-induced lesions increased as the applied P− increased, and the sizes of these lesions corresponded well to the estimates of the focal regions above the intrinsic cavitation threshold, at least in the lower pressure regime (P− = 26–35 MPa). The average sizes for the smallest reproducible lesions were approximately 0.9 × 1.7 mm (lateral × axial), significantly smaller than the −6dB beamwidth of the transducer (1.8 × 4.0 mm). These results suggest that, using the intrinsic threshold mechanism, well-confined and microscopic lesions can be precisely generated and their spatial extent can be estimated based on the fraction of the focal region exceeding the intrinsic cavitation threshold. Since the supra-threshold portion of the negative half cycle can be precisely controlled, lesions considerably less than a wavelength are easily produced, hence the term “microtripsy.”
Keywords: Histotripsy, Intrinsic Cavitation Threshold, Microtripsy, Tissue Fractionation
I. INTRODUCTION
Histotripsy is a noninvasive, cavitation-based therapy that uses very short, high-pressure ultrasound pulses to generate a dense, energetic, lesion-producing bubble cloud. This histotripsy treatment can create controlled tissue erosion when it is targeted at a fluid-tissue interface [1–3] and well-demarcated tissue fractionation when it is targeted within bulk tissue [4–6]. Additionally, histotripsy has been shown to be capable of fragmenting model kidney stones using surface erosion that is mechanistically distinct from conventional shockwave lithotripsy (SWL) [7, 8]. Histotripsy therapy can be guided and monitored using ultrasound B-mode imaging in real-time, since 1) the cavitating bubble cloud appears as a temporally changing hyperechoic region in B-mode imaging, allowing the treatment to be precisely targeted, and 2) the echogenicity of the targeted region decreases as the degree of tissue fractionation increases, which can be used as a way of monitoring lesion production (image feedback) in real-time [9–11].
In conventional histotripsy treatments, ultrasound pulses with ≥ 3 acoustic cycles are applied, and the bubble cloud formation relies on the pressure release scattering of the positive shock fronts (sometimes exceeding 100 MPa, P+) from initially initiated, sparsely distributed bubbles (or a single bubble). This has been called the “shock scattering mechanism” [12]. This mechanism depends on one (or a few sparsely distributed) bubble(s) initiated with the initial negative half cycle(s) of the pulse at the focus of the transducer. A cloud of microbubbles then forms due to the pressure release backscattering of the high peak positive shock fronts from these sparsely initiated bubbles. These back-scattered high-amplitude rarefactional waves exceed the intrinsic threshold thus producing a localized dense bubble cloud. Each of the following acoustic cycles then induces further cavitation by the backscattering from the bubble cloud surface, which grows towards the transducer. As a result, an elongated dense bubble cloud growing along the acoustic axis opposite the ultrasound propagation direction is observed with the shock scattering mechanism. This shock scattering process makes the bubble cloud generation not only dependent on the peak negative pressure, but also the number of acoustic cycles and the amplitudes of the positive shocks. Without these intense shock fronts developed by nonlinear propagation, no dense bubble clouds are generated when the peak negative half-cycles are below the intrinsic threshold.
Therefore, the cavitation threshold for the shock scattering mechanism varies with the applied exposure conditions, and the reported thresholds (P−) range from 6 to 15 MPa [13, 14] for degassed water and 13.5 to 21 MPa in tissue and tissue phantoms [12, 15]. The spatial extent of the bubble cloud is not well-defined and it changes with the variation in shock scattering process created by different exposure conditions. Moreover, for pulses longer than about 8–10 cycles, the elongating bubble cloud moves out of the focal zone. Thus, longer pulses do not enhance lesion formation [16].
In our recent work [17], a second mechanism for bubble cloud formation was proposed and investigated. This occurs when one or more negative half cycle(s) of the applied ultrasound pulses exceed(s) an “intrinsic threshold” of the medium, thus directly forming a dense bubble cloud without shock scattering. This intrinsic threshold is defined by a very sharp transition zone, and is relatively insensitive to the inhomogeneities in soft tissue or the lack of dissolved gases. Moreover, this intrinsic threshold is independent of the applied positive pressure, since the influence of shock scattering is minimized when applying pulses less than 2 cycles. The reported threshold (P−), where the probability of cavitation (formation of a dense bubble cloud) for one single pulse is 0.5, is between 26.4–30.0 MPa in samples with high water content, including water, hydrogel, and soft tissue. Because of the sharp, highly repeatable threshold, at negative pressure amplitudes not significantly greater than this, a dense energetic lesion-forming cloud of microbubbles is generated consistently with a spatial pattern similar to the part of the negative half cycles(s) exceeding the intrinsic threshold. That part of the therapy pulse exceeding intrinsic threshold, and the resulting spatial extent of the lesion forming bubble cloud, are independent of positive shocks and the somewhat chaotic shock scattering phenomenon. Therefore, the spatial extent of the lesion generated using this mechanism is expected to be well-defined and more predictable. The lesion size can be easily controlled, even for small lesions, simply by a precise adjustment of the therapy pulse amplitude.
In this paper, the characteristics of the lesions generated by the intrinsic threshold mechanism were investigated using red-blood-cell (RBC) tissue-mimicking phantoms and ex vivo canine tissues. More specifically, a 500 kHz therapy transducer, which generated histotripsy pulses of less than 2 cycles, was used, and various sizes of lesions in RBC phantoms and canine tissues were generated using various acoustic pressure levels. The smallest possible lesion that could be generated consistently with this transducer was tested by lowering the applied acoustic pressure to a level that was just above the intrinsic cavitation threshold. The lesion sizes in RBC phantoms were quantified based on the optical images taken by a high speed camera, and the lesion sizes in ex vivo tissue were quantified based on ultrasound B-mode images and histological sections. Estimates for the sizes of the lesions based on how large the focal regions were above the cavitation thresholds were also computed and compared to the sizes of the lesions generated experimentally.
II. MATERIALS AND METHODS
A. Sample Preparation
Experiments were performed on red-blood-cell (RBC) tissue-mimicking phantoms and ex vivo canine kidneys and livers. The procedures described in this study were approved by the University of Michigan’s Committee on Use and Care of Animals.
The RBC tissue-mimicking phantom can be used for the visualization and quantification for cavitation-induced damage [18]. In this study, fresh canine blood was obtained from adult research canine subjects in an unrelated study. An anticoagulant solution of citrate-phosphate-dextrose (CPD) (C7165, Sigma-Aldrich, St. Loius, MO, USA) was added to the blood with a CPD-to-blood ratio of 1:9 (v:v), and kept at 4°C before usage. The blood stored under these conditions could last for approximately one month, and, in this study, it was used within three weeks after blood collection. The RBC phantoms were prepared from an agarose-saline mixture and RBCs, following the protocols described in a previous paper [18]. The agarose-saline mixture consists of low-melting-point agarose powder (AG-SP, LabScientific, Livingston, NJ, USA) and 0.9% saline at an agarose-to-saline ratio of 1:100 (w:v). This RBC tissue-mimicking phantom has a three-layer structure with a very thin (~500 μm) RBC-agarose-saline hydrogel layer in the center, and a transparent agarose-saline hydrogel layer (~2 cm thick) on the top and at the bottom. The central RBC-agarose layer serves as a real-time indicator for cavitational damage, since, at the place where cavitational damage is induced, the RBC-agarose mixture will change from translucent and red to transparent and colorless within one second due to RBC lysis [18].
Experiments were also performed in ex vivo canine kidneys and livers to validate the results observed in the RBC phantoms. The excised canine kidneys and livers were collected from adult canine subjects from an unrelated study, kept in 0.9% saline at 4°C, and used within 36 hours. Before the experiments, the kidneys and livers were submerged in degassed 0.9% saline and placed in a chamber under partial vacuum (~33 kPa absolute) at room temperature for 1–2 hours. The tissues were then sectioned into small specimens (~3×3×3 cm) and embedded in a 1% agarose hydrogel that consisted of low-melting-point agarose and 0.9% saline.
B. Histotripsy Pulse Generation and Calibration
Histotripsy pulses were generated by a 32-element, 500 kHz therapy transducer that was directly mounted on one side of a water tank filled with degassed water at room temperature (40% of normal saturation determined by pO2). The gas saturation was measured by a commercial dissolved oxygen meter (YSI5000, YSI Inc., Yellow Springs, OH, USA). The active elements in the transducer consisted of 50.8 mm diameter PZT-8 discs, each individually mounted to an acoustic lens with a geometric focus of 150 mm. The elements were arranged in a large hemispherical configuration with an f-number of approximately 0.5. To generate short therapy pulses, a custom high voltage pulser developed in-house was used to drive the transducer elements. The pulser was connected to a field-programmable gated array (FPGA) development board (Altera DE1, Terasic Technology, Dover, DE, USA) specifically programmed for histotripsy therapy pulsing. This setup allowed the transducer to output short pulses consisting of less than two cycles.
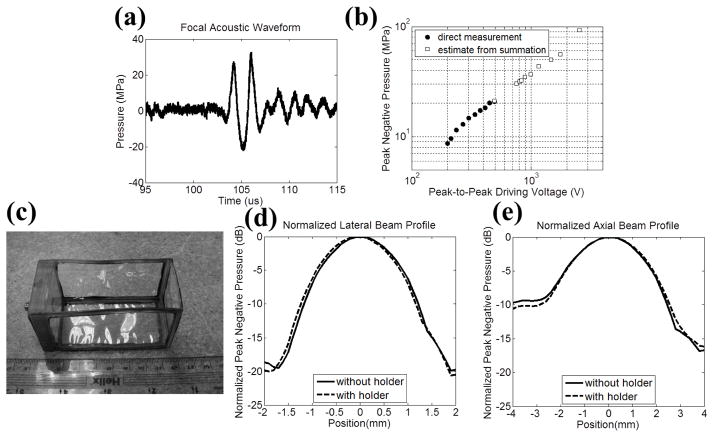
A fiber-optic probe hydrophone (FOPH) built in-house [19] was used to measure the acoustic output pressure of the therapy transducer. Fig. 1(a) shows the directly measured, free-field acoustic waveform of a typical histotripsy pulse generated by the 32-element, 500 kHz therapy transducer prior to inducing cavitation on the tip of FOPH. The peak negative pressures beyond the cavitation threshold were estimated by the summation of the output focal P− from individual elements. Above the cavitation threshold, the glass fiber sensor was consistently shattered. In the previous study [17], this estimate had a good agreement with the P− measured directly in a higher cavitation threshold medium, 1,3 butanediol. Furthermore, for the therapy transducer used in this study, each element was self-focused, and their acoustic waves did not overlap significantly until they reached the focus.
Fig. 1.
Histotripsy pulse calibration (a) A representative free-field 1.5-cycle acoustic waveform for the 500 kHz therapy transducer at a pressure level of P− = 22.6 MPa via direct measurement. (b) A plot of the measured focal P− versus the peak-to-peak electrical driving voltage to one representative element in the therapy transducer. Solid circles (●) represent the results from direct measurements with all 32 elements firing at the same time, and squares (□) represent the estimates from the summations of the individual elements when they are firing separately. (c) A photograph of the gel holder for RBC phantoms and agarose-hydrogel-embedded tissue specimens. (d) Normalized lateral beam profile with (dashed line) and without (solid line) the plastic gel holder in place. (e) Normalized axial beam profile with (dashed line) and without (solid line) the plastic gel holder in place.
Fig. 1(b) plots the focal acoustic pressure as a function of the peak-to-peak electrical driving voltage (to one representative element in the therapy transducer), with both axes in logarithmic scales. The actual P− values prior to reaching cavitation threshold were measured directly by driving all the elements at the same time, and plotted as solid circles (●). The estimated P− values from the summation of individual elements are plotted as squares (□). The P− estimates from the summation showed a similar trend as the ones from the direct measurement, and they had a good agreement at the driving voltage of 492 Volts where P− = 20.9 MPa via direct measurement and P− = 21.0 MPa via the estimate from summation. The −6dB beamwidths (calculated based on P−) at the output pressure level of P− = 8.5 MPa were measured to be 1.80 and 4.04 mm in the lateral and axial directions, respectively.
Rectangular, custom-made, plastic gel holders (4×4×8 cm) with acoustically transparent membranes (50μm thick clear DuraLar polyester films, McMaster-Carr, Aurora, OH) glued on their sides, as shown in Fig. 1(c), were used to hold the RBC phantoms and agarose-hydrogel-embedded tissue specimens. The influence of the plastic gel holders on focal P− and one-directional (1D) beam profiles was also investigated. Based on the acoustic pressure measurement with the plastic gel holder in place, the P− was attenuated by 12% (1.1 dB), and this attenuation could be attributed to both the reflection due to impedance mismatch and absorption in the plastic material. However, the 1D beam profiles in lateral and axial directions did not change significantly, as shown in Figs. 1(d) and 1(e). The applied P− was then corrected by the attenuation contributed by the plastic gel holder. Additionally, the applied P− was further linearly corrected for the attenuation contributed by agarose hydrogel and canine specimens with previously reported attenuation coefficients [17, 18, 20]. Tables I and II list the estimated P− used in the RBC Phantom experiments and ex vivo canine tissue experiments, respectively.
TABLE I.
PRESSURE LEVELS USED IN THE RBC PHANTOM EXPERIMENTS
| Peak-to-Peak Electrical Driving Voltage* (Volts) | Estimated Focal P− from Summation of Individual Elements (MPa) | Focal P− with Attenuation Correction (MPa)
|
|
|---|---|---|---|
| Gel Holder | Agarose Hydrogel | ||
| 685 | 28.3 | 25.0 | 24.5 |
| 757 | 30.3 | 26.7 | 26.2 |
| 801 | 31.6 | 27.8 | 27.3 |
| 831 | 32.2 | 28.4 | 27.9 |
| 995 | 36.9 | 32.6 | 32.0 |
| 1165 | 43.7 | 38.5 | 37.8 |
| 1474 | 49.9 | 44.0 | 43.2 |
| 1764 | 56.0 | 49.4 | 48.5 |
| 2547 | 93.2 | 82.2 | 80.7 |
The peak-to-peak electrical driving voltage is the representative driving voltage from one of the elements in the therapy transducer.
TABLE II.
PRESSURE LEVELS USED IN THE EX VIVO CANINE TISSUE EXPERIMENTS
| Peak-to-Peak Electrical Driving Voltage (Volts) | Estimated Focal P− from Summation of Individual Elements (MPa) | Focal P− with Attenuation Correction (MPa)
|
||
|---|---|---|---|---|
| Gel Holder | Kidney | Liver | ||
| 894 | 34.8 | 30.7 | 28.5 | 29.3 |
| 995 | 36.9 | 32.6 | 30.2 | 31.0 |
| 1764 | 56.0 | 49.4 | 45.8 | 47.1 |
C. Treatment in RBC Phantoms and Lesion Analysis
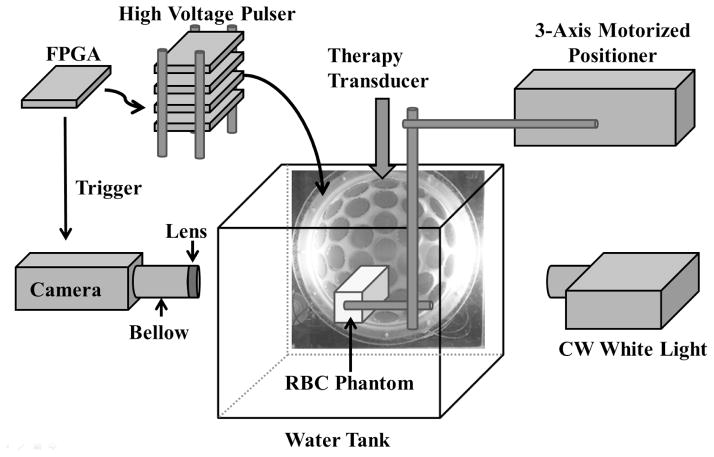
The experiment setup in the RBC phantom experiment is illustrated in Fig. 2. Besides the histotripsy pulse generation described in the previous section, a digital, CMOS, high-speed camera (Phantom V210, Vision Research, Wayne, NJ, USA) was positioned perpendicularly to the water tank in an orientation that allowed for the visualization of the axial-lateral plane of the therapy transducer. The camera received trigger signals from the FPGA board, which maintained the synchronization of image capturing and the delivery of histotripsy pulses. The RBC phantoms were mounted on a 3-axis motorized positioner (Parker, Cleveland, OH, USA), submerged in the water tank with the corresponding orientation for the visualization of axial-lateral-plane lesions, and illuminated by a continuous wave (CW) white light source for high speed photography. The RBC phantom, therapy transducer, and camera were aligned by visually adjusting the sharpness of the RBC layer and the cavitation bubble as they appeared in the high speed images.
Fig. 2.
A schematic illustration of the experiment setup. A 32-element therapy transducer was directly mounted on one side of a water tank and the tank was filled with degassed water. The therapy transducer was driven by a high voltage pulser that was connected to a FPGA development board. An RBC phantom was submerged in the water tank and illuminated by a CW white light source for high speed photography. In ex vivo canine tissue experiment, a tissue specimen embedded in a gel holder was used instead of the RBC phantom, and ultrasound B-mode imaging monitoring was used instead of high speed photography.
Each intended treatment region in the RBC phantoms was exposed to 500 histotripsy pulses at a PRF of 1 Hz. Single-focal-point exposures were performed in each case. A PRF of 1 Hz was chosen to exclude the contribution of the cavitation memory effect described in a previous paper [21]. Pressure levels listed in column 4 of Table I were used in these RBC phantom experiments.
During histotripsy treatment, the cavitational bubble clouds and their resulting damage in RBC phantoms were evaluated by optical images captured by the Phantom V210 high-speed camera. With an additional magnifying lens (Tominon, 1:4.5, f = 135 mm) used along with the camera, the resolution of these captured images was approximately 14–15 μm per pixel. The RBC phantoms were back lit with CW white light, thus the captured optical images would appear as “shadow graphs” in which the cavitational bubble clouds appeared dark black, the RBCs appeared gray, and the histotripsy-induced lesions appeared white. For every delivered histotripsy pulse, two images were acquired, one (bubble cloud image) at 10 μs after the arrival of the pulse, where the maximal spatial extent of the bubble cloud was observed, and the other (lesion image) at 500 ms after the arrival of the pulse, where only histotripsy-induced damage in the RBC phantom was observed.
These optical images were then post-processed with MATLAB (R2011a, MathWorks, Natick, MA, USA) using a method similar to those described in previous papers [18, 21]. The lesion image was firstly converted to gray-scale, and then converted to a binary image using the threshold determined by the built-in function, graythresh, in MATLAB. The regions with brightness that were higher than the threshold would become “1 (white)” in the binary image and would be considered “damaged.” In contrast, the regions with brightness less than the threshold would become “0 (black)” and be considered “intact.” The white regions that were smaller than 4 pixels (correspond to regions less than 8 μm in radius) were considered to be noise and excluded from the damage zone. By counting the number of the white pixels in the binary image and converting it to actual size with the help of a pre-captured scale image, the area, length, and width of the lesion were determined. The bubble cloud images were quantified in a similar way, except the thresholds for binary image conversion were calculated based on the mean and standard deviation of the intensity of the bubble cloud, and the bubble cloud would be identified as “0 (black).” Then, the regions occupied by bubble clouds were overlaid after 500 applied histotripsy pulses, and the sizes in the lateral and axial dimensions of the overlaid bubble cloud occupied regions were further quantified.
For each lesion, the lesion development process was studied by investigating the relationship between the quantified lesion area and the number of the histotripsy pulses that had been applied. In order to compare this lesion development process for different pressure levels, the lesion sizes were further normalized to their maximal extents, which occurred after the application of 500 histotripsy pulses.
D. Treatment in Ex Vivo Tissues
In order to validate the results in RBC phantoms, experiments were also performed in ex vivo canine renal and hepatic specimens as mentioned earlier. Canine renal and hepatic specimens that were embedded in agarose hydrogels were mounted on the 3-axis motorized positioner, and ultrasound B-mode imaging, instead of high speed photography, was used to monitor the histotripsy treatment. The ultrasound B-mode imaging was performed using a commercial ATL L12-5 linear ultrasound probe (Advanced Technology Laboratories, Inc., Bothell, WA, USA), along with a commercial ATL HDI 5000 ultrasound scanner.
Each intended treatment region was exposed to 500 histotripsy pulses at a PRF of 1 Hz, and a single-focal-point exposure was performed. Various pressure levels, listed in column 4 and 5 of Table II, were applied to various regions of the specimens. In order to better identify the smaller lesions after treatment, two surface markers (10 mm separation) with higher pressure levels were generated on the surface of canine tissue specimen, along with two large lesions generated 6 mm right beneath the two surface markers. The small lesion was then generated in between these two large lesions and approximately 6 mm beneath the surface of the tissue specimen.
The lesions were then evaluated with both histological sections and ultrasound B-mode imaging. For histological section preparation, the treated canine specimens were fixed with 10% phosphate buffered formalin (Fisher Scientific, Fair Lawn, NJ, USA) and sectioned into approximate 3mm-thick slices along the lateral-axial planes of the lesions using a regular kitchen knife and surgical scalpels. These slices were then further processed into 4μm-thick histological sections with 100 μm sectioning step size using a microtome and stained with hematoxylin and eosin (H&E). Visual inspection using bright field microscopy was performed to identify the section with maximal spatial extent of the damage among all sections for each sample. The maximal extents of the lesions in the lateral and axial directions were quantified based on the bright field microscopic images with the help of a pre-calibrated scale.
Ultrasound B-mode imaging allows us to evaluate the tissue treatment outcome in real-time, since the echogenicity in B-mode imaging of a treated region decreases as the degree of tissue fractionation increases [10, 11]. In this study, in order to resolve the lesions generated in the tissue specimens, especially the smaller ones generated with lower pressure level, a high-frequency ultrasound probe, RMV 707B (15–45 MHz, VisualSonics, Toronto, ON, Canada), along with a high-frequency ultrasound scanner, Vevo 770 (VisualSonics), was used to evaluate the lesion after treatment. Due to the short working distance of the ultrasound probe (focal length = 12.7mm), tissue specimens were taken out of the gel holder and agarose hydrogel was removed during the ultrasound evaluation process. The axial and lateral dimensions of the lesions were then measured based on the hypoechoic regions that appeared in the recorded B-mode images.
E. Lesion Size Estimation
The probability for the generation of a dense bubble cloud using a single, short pulse (≤ 2 cycles) is a function of the applied P−. This cavitation probability curve follows a sigmoid function [17], given by
| (1) |
where erf is the error function, pt is the pressure that gives a cavitation probability (Pcav) of 0.5, and σ is a variable that relates to the transition width in the cavitation probability curve, with ± σ giving the difference in pressure for cavitation probability from 0.15 to 0.85. The pt and σ values in water, gelatin gel, and high water content soft tissue were found to be within the range of 26–30 MPa (pt) and 0.8–1.4 MPa (σ) [17].
Fig. 3 shows representative cavitation probability curves for producing dense bubble clouds in water plotted using the empirical values of pt and σ values determined in the previous study. Since the histotripsy pulses used in this study (500 kHz center frequency at PRF = 1 Hz) were different from those used in the previous study [17] (1 MHz center frquency at PRF = 0.33 Hz), the cavitation probabilities for the 500 kHz histotripsy pulses were also experimentally investigated and plotted in Fig. 3. This investigation was performed using a passive cavitation detection (PCD) approach similar to the one described in [17]. A needle hydrohpone (HNR-0500, ONDA Corp., Sunnyvale, CA, USA) was mounted orthogonal to the acoustic propagation path, and pointing to the focus of the transducer. For the signal analysis, the spectral energies within 600kHz–900kHz (1.5f) of the received scattered signals were firstly integrated (integrated power spectrum, SPCD). For each applied pressure, the “expected” value for SPCD without caivatiaon was then determined by extrapolating the SPCD from really low pressures (1–5MPa) based on their focal intensities obtained from calibration measurements. If the measured SPCD is greater than the expected value by five standard deviations, a dense bubble cloud is considered to have occurred during the pulse.
Fig. 3.
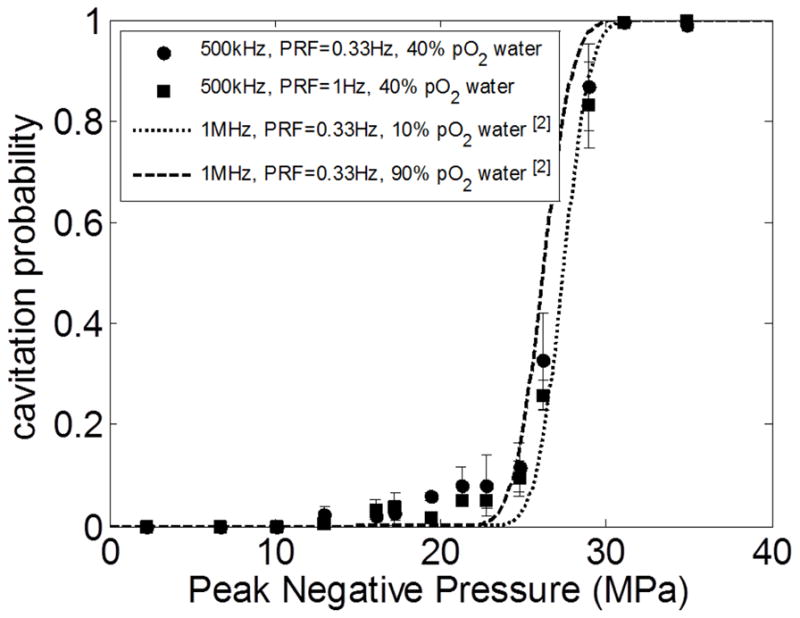
The probability for the generation of a dense bubble cloud using a single, short (≤ 2 cycles) pulse. The data from this study (500kHz center frequency transducer in filtered 40% pO2 water) were plotted as solid circles (PRF = 0.33 Hz) and solid squares (PRF = 1 Hz), with vertical error bars indicating one standard deviation. The sigmoidal cavitation probability curves, plotted using the emprical values of pt and σ values determined in the previous study [17] (1 MHz at PRF = 0.33 Hz), are shown as dotted line (distilled 10% pO2 water) and dashed line (unfiltered 90% pO2 water)
From this measurement and the results showing in Fig. 3, it’s reasonable to assume the cavitation thresholds are insensitive to both the center frequency of the transducer (at least between 500 kHz and 1 MHz) and the pulse repetition frequency (when PRF ≤ 1 Hz, with minimal cavitation memory effect [21] involved). The empirical values of pt and σ values listed in [17] for gel phantom and renal tissue were then used in the size estimation for the lesions generated in this study.
As illustrated in Fig. 4, the expected lesion sizes in the lateral and axial dimensions were estimated by linearly scaling 1D beam profiles to the applied P−, then evaluating the regions on the scaled profiles where the P− values exceed a pressure threshold. This pressure threshold for lesion size estimation (PLSE) was defined as the P− that gives a 50% probability of observing at least one dense bubble cloud generation event over the course of 500 delivered pulses.
Fig. 4.

Illustration for the lesion size estimation using the lateral direction as an example. (a) A normalized lateral beam profile which plots P− values that were normalized by the P− at the focus (position = 0 mm). (b) The estimated lateral beam profile was obtained by multiplying the normalized beam lateral proflie from (a) with the estimated P− that was applied to the focus. (c) A threshold based on the cavitation probability curve was applied, the region above the threshold would be determined as damage zone, and then the lesion size was calculated. For RBC phantom experiments, this threshold (PLSE) is P− = 23.4 MPa (see Section E in MATERIALS AND METHODS for the calculation of this value.)
Since Eq. 1 only showed the cavitation probability curve for one “single” pulse (Pcav), we first used the binomial theorem to calculate the Pcav that would give a 50% probability of observing at least one dense bubble cloud generation per 500 pulses. This Pcav was calculated to be 0.0014. In 5% gelatin hydrogel, the P− that resulted in Pcav = 0.0014 was caluclated to be 23.4 MPa (PLSE) using the empirical values of of pt and σ listed in [17]. This PLSE was used to estimate the size of the lesions that would be produced in RBC phantoms, since the acoustic properties of 1.5% agarose hydrogel are similar to those of 5% gelatin hydrogel. In renal tissue, the PLSE was calculated to be 26.1 MPa, which was then used to estimate the size of the lesion that would be produced in the ex vivo canine kidney experiments.
III. RESULTS
A. Experiments on RBC Phantoms
A total of 74 lesions were generated in RBC phantoms with nine pressure levels (listed in column 4 of Table I), and each pressure level contained a total of nine lesions, with the exception of two lesions for P− = 24.5 MPa. In the case of P− = 24.5 MPa, cavitational bubbles were not generated in response to every applied histotripsy pulse, and the shapes of the lesions were not well-confined and they varied between samples. Therefore, for P− = 24.5 MPa, only the lesion and bubble cloud images are shown in Figs. 5–6, and no further quantitative analysis was performed. In the pressure levels from P− = 26.2 MPa to P− = 80.7 MPa, bubble clouds were consistently generated in every applied histotripsy pulse.
Fig. 5.

Representative lesion [(a)–(f)] and bubble cloud [(g)–(l)] images in RBC phantoms after 500 histotripsy pulses had being applied. These images were taken in the axial-lateral plane of the therapy transducer, and the histotripsy pulses propagated from the left to the right of the field. As can be seen, the spatial extents of both the lesion and bubble cloud increased as the applied pressure level increased. The images for P− = 27.3 and 27.9 MPa are not included in this figure since they don’t differ from the ones for P− = 26.2 MPa significantly. The pressure level of P− = 80.7 MPa resulted in an extreme outcome, and its result is shown separately in Fig. 7
Fig. 6.
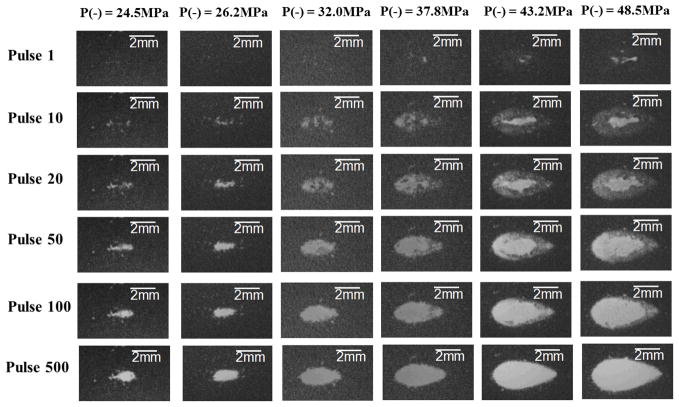
Representative lesion images in RBC phantoms demonstrating the lesion development processes. These images were taken in the axial-lateral plane of the therapy transducer, and the histotripsy pulses propagated from the left to the right of the field. Each column represents one applied pressure level, and each row represents different stage of the lesion development (pulse 1, 10, 20, 50, 100, and 500). The results for P− = 27.3, 27.9, and 80.7 MPa are not included in this figure for the same reason mentioned in the caption of Fig. 5.
Fig. 5 shows representative lesion and bubble clouds images at the 500th pulse, whereas Fig. 6 demonstrates the lesion development process and shows representative lesion images for pulses 1, 10, 20, 50, 100, and 500. The images for P− = 27.3 MPa and 27.9 MPa did not vary significantly from the images for P− = 26.2 MPa, so they are not included. The pressure level of P− = 80.7 MPa resulted in an extreme outcome, and its result is shown separately in Fig. 7. As can be seen in the Fig. 5, the spatial extent of both the lesion and the bubble clouds increased as the applied pressure level increased. As shown in Fig. 6, the lesion development process started from the center with minimal damage at the periphery. Then, the lesion gradually grew outwards as the number of applied pulses increased.
Fig. 7.
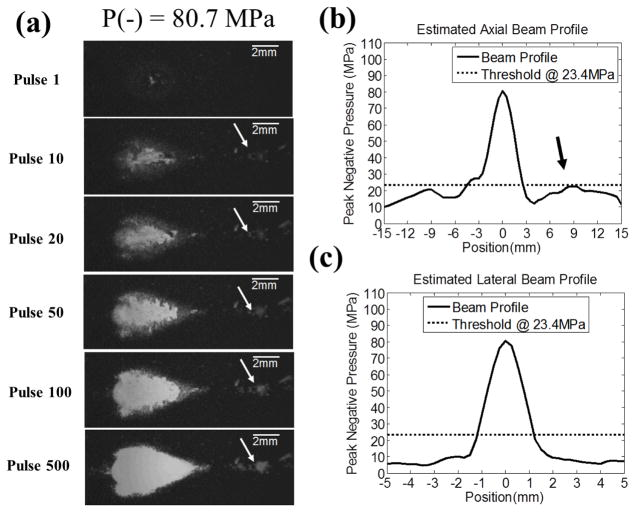
The extreme case where P− = 80.7 MPa was applied and one of the grating lobes (post-focal) in the axial direction was close to the threshold for lesion size estimation, PLSE. (a) The representative lesion images in RBC phantom for pulses 1, 10, 20, 50, 100, and 500. These images were taken in the axial-lateral plane of the therapy transducer, and the histotripsy pulses propagated from the left to the right of the image. Collateral damage along axial direction was observed. (b) and (c) 1D estimated axial and lateral beam profiles are plotted as solid lines (–), whereas the dotted lines (...) represents the thresholds at PLSE = 23.4 MPa (for RBC phantoms, see Section E in MATERIALS AND METHODS for the calculation of this value). The 1D beam profiles in (b) and (c) show that one of the grating lobes (post-focal) in the axial direction is close to the threshold (indicated by the black arrow), and this corresponds well with the collateral damage seen in (a) (indicated by the white arrow).
The extreme case came when the applied P− was increased to 80.7 MPa, where collateral damage along the axial direction was observed [Fig. 7(a)]. Based on the 1D extrapolated beam profiles along axial [Fig. 7(b)] and lateral [Fig. 7(c)] directions at this pressure level, the applied pressure at the post-focal grating lobe in the axial direction was close to the threshold for lesion size estimation, PLSE. This corresponded well with the finding in Fig. 7(a), demonstrating that collateral damage occurred at the location where the grating lobe was close to that threshold.
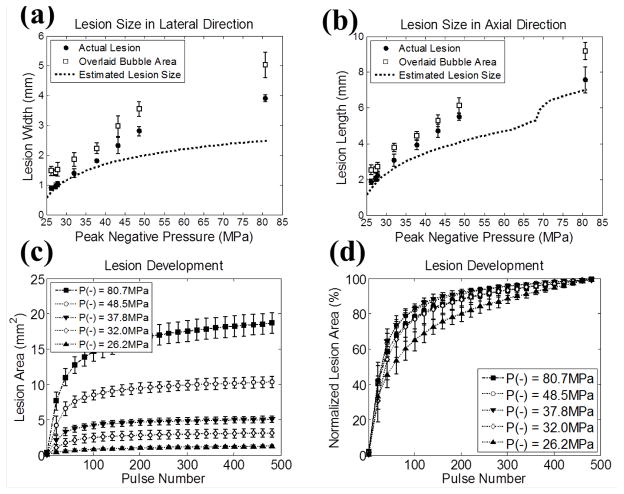
The quantified sizes of the lesions and the overlaid bubble cloud occupied regions are plotted in Figs. 8(a) and 8(b), along with their estimates based on the focal profile regions above the PLSE threshold. As shown in the figure, the quantified sizes for both the lesions and overlaid bubble cloud occupied regions increased linearly with the applied P−. The sizes for lesions were slightly smaller than those for the overlaid bubble cloud occupied regions, and the differences between them were in the range of 0.5–1 mm. The average lesion widths ranged from 0.90 mm (P− = 26.2 MPa) to 3.91 mm (P− = 80.7 MPa), while the average lesion lengths ranged from 1.86 mm (P− = 26.2 MPa) to 7.57 mm (P− = 80.7 MPa). The estimates derived using PLSE = 23.4 MPa corresponded well to the quantified lesion sizes in lower pressure levels. However, as the pressure level increased, higher discrepancy between the quantified lesion sizes and the estimates was observed in both lateral and axial directions. Note that there was a discontinuity in the estimated lesion size in axial direction around P− = 70 MPa. This was due to an inflection in the 1D axial beam profile at the bottom of the main lobe, as shown in Fig. 7(b) (around −3 mm).
Fig. 8.
The quantified lesion sizes [(a) and (b)] and the lesion development processes [(c) and (d)] as a function of the applied P− in RBC phantom experiments. The sample sizes are nine (N = 9) for each pressure level, and the vertical error bars represent ± one standard deviation. (a) Lesion size in lateral direction. (b) Lesion size in axial direction. Actual lesions are plotted as solid circles (●) and overlaid bubble regions are plotted as empty squares (□). The estimations based on the focal profile regions above the threshold (PLSE = 23.4 MPa for RBC phantoms, see Section E in MATERIALS AND METHODS for the calculation of this value) are plotted as dotted lines (...). (c) The quantified lesion areas in the axial-lateral plane as a function of the number of histotripsy pulses applied. (d) The quantified lesion areas normalized to their maximal extents, at which 500 histotripsy pulses had been applied. The results for different P− values are plotted as follows: 26.2 MPa (...▲...), 32.0 MPa (...◇...), 37.8 MPa (...▼...), 48.5 MPa (...○...), and 80.7 MPa (...■...).
Figs. 8(c) and 8(d) plot the quantitative results of the lesion development processes for various pressure levels. For clarity, the results from P− = 27.3, 27.9, and 43.2 MPa are not displayed (the results for P− = 27.3 and 27.9 MPa lie between P− = 26.2 and 32.0 MPa, and the result for 43.2 MPa lies between P− = 37.8 and 48.5 MPa). Fig. 8(c) shows the quantified area of the lesion as a function of the number of applied histotripsy pulses. The normalized lesion area is shown in Fig. 8(d), and as can be seen, the lesions that were created with lower pressure levels developed more slowly. The average numbers of histotripsy pulses required to reach 80% lesion development were 200 (P− = 26.2 MPa), 181 (P− = 27.3 MPa), 170 (P− = 27.9 MPa), 121 (P− = 32.0 MPa), 86 (P− = 37.8 MPa), 92 (P− = 43.2 MPa), 87 (P− = 48.5 MPa), and 115 (P− = 80.7 MPa). An exception occurred at P− = 80.7 MPa, where the lesion developed more slowly than P− = 48.5 MPa. This could be attributed to the sparsely distributed single bubbles generated in the prefocal grating lobe since the applied pressure there approached the PLSE threshold.
B. Ex Vivo Canine Kidney Experiments
The results for the experiments performed on the canine renal specimens are summarized as follows and shown in Figs. 9–10. The sample sizes for the pressure levels of P− = 28.5, 30.2, and 45.8 MPa are 5, 5, and 7, respectively. Fig. 9 shows representative B-mode images of the canine renal specimens after the application of 500 histotripsy pulses with these three pressure levels. As can be seen, the backscatter intensity of the tissue specimen decreased after treatment, resulting in hypoechoic regions on B-mode imaging. Moreover, these hypoechoic regions were larger when histotripsy at a higher pressure level was applied.
Fig. 9.
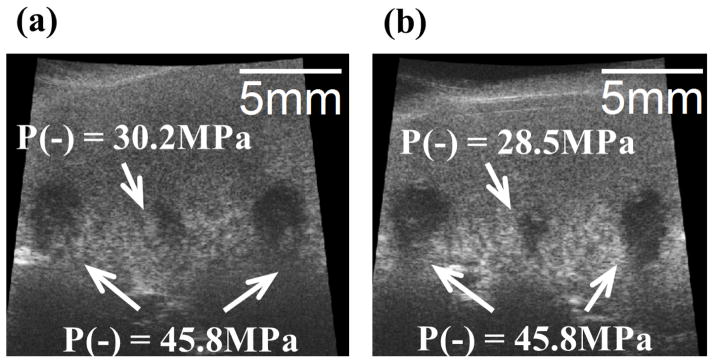
Representative B-mode images of canine renal specimens after the application of 500 histotripsy pulses. The histotripsy pulses propagated from the top to the bottom in the images. (a) Two large lesions with 10 mm separation using P− = 45.8 MPa, and one small lesion in between using P− = 30.2 MPa. (b) Two large lesions with 10 mm separation using P− = 45.8 MPa, and one small lesion in between using P− = 28.5 MPa.
Fig. 10.
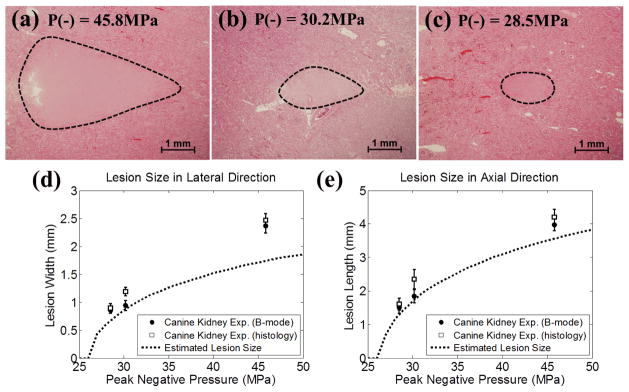
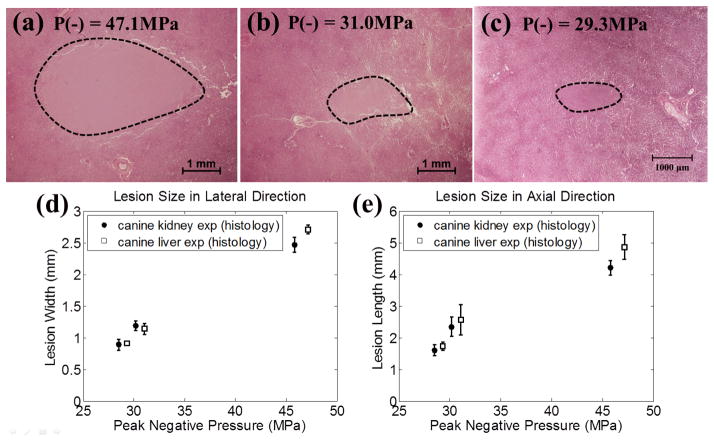
Representative histological sections in the canine renal tissue treatment, with the applied P− of 45.8 MPa (a), 30.2 MPa (b), and 28.5 MPa (c). The histological sections represent the axial-lateral planes of the lesions and the histotripsy pulses propagate from left to the right in the image. (d) and (e) plot the quantified lateral and axial dimensions of the lesions and their estimates based on the regions above the threshold (PLSE = 26.1 MPa for renal tissue, see Section E in MATERIALS AND METHODS for the calculation of this value). The results quantified from B-mode imaging are plotted as solid circles (●), and the results quantified from histological section are plotted as empty squares (□). The vertical bars represent ± one standard deviation. The estimates based on the regions above the cavitation threshold are plotted as dotted lines (...). The sample sizes are 7, 5, and 5 for P− = 45.8, 30.2, and 28.5 MPa, respectively.
The representative histological sections are displayed in Figs. 10(a)–(c). As shown in the histological sections, the intended treatment regions had lost their normal architecture and contained only acellular granular debris, and a larger spatial extent of the lesion occurred when a higher pressure level was applied. The lesion sizes quantified from histological sections and B-mode images are shown in Figs. 10(d) and 10(e), along with the estimates for the lesion sizes based on the regions that are above the PLSE threshold. As can be seen from the figure, the lesion sizes quantified by the histological sections were similar as those quantified by B-mode images, with statistically significant difference occurring only at the applied pressure level of P− =30.2 MPa (p-values = 0.002 and 0.02 in the lateral and axial directions, respectively). In the lateral dimension of the lesion [Fig. 10(d)], the quantified lesion widths lay close to the estimates, where the quantified lesion widths in histological sections were 0.22 (P− = 28.5 MPa), 0.31 (P− = 30.2 MPa), and 0.73 mm (P− = 45.8 MPa) larger than the estimates. In the axial dimension of the lesion [Fig. 10(e)], the quantified lesion lengths lay close to the estimates, where the quantified lesion lengths in histological sections were 0.31 (P− = 28.5 MPa), 0.62 (P− = 30.2 MPa), and 0.65 mm (P− = 45.8 MPa) larger than the estimates.
C. Ex Vivo Canine Liver Experiments
The results for the experiments performed on the canine hepatic specimens are summarized as follows and shown in Figs. 11–12, and the sample sizes for the pressure levels of P− = 29.3, 31.0, and 47.1 MPa are 5, 5, and 8, respectively. Fig. 11 shows representative B-mode images of the hepatic specimens after the application of 500 histotripsy pulses. Similar as the result in Fig. 9, hypoechoic regions occurred on B-mode images after histotripsy treatment, and these regions were larger when histotripsy at a higher pressure level was applied.
Fig. 11.
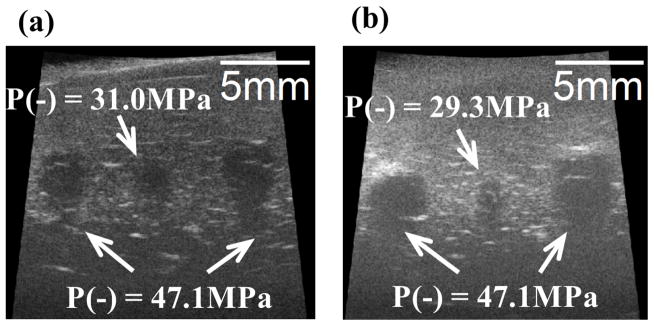
Representative B-mode images of canine hepatic specimens after the application of 500 histotripsy pulses. The histotripsy pulses propagated from the top to the bottom in the images. (a) Two large lesions with 10 mm separation using P− = 47.1 MPa, and one small lesion in between using P− = 31.0 MPa. (b) Two large lesions with 10 mm separation using P− = 47.1 MPa, and one small lesion in between using P− = 29.3 MPa.
Fig. 12.
Representative histological sections in the canine hepatic tissue treatment, with the applied P− of 47.1 MPa (a), 31.0 MPa (b), and 29.3 MPa (c). The histological sections represent the axial-lateral planes of the lesions and the histotripsy pulses propagate from the left to the right in the images. The quantified lateral and axial dimensions of the lesions based on histological sections in hepatic tissue are plotted in (d) and (e), along with the lesion sizes in renal tissue. The results for canine kidney are plotted as solid circles (●), and the results quantified for canine liver are plotted as empty squares (□). The vertical error bars represent ± one standard deviation. The sample sizes for canine liver experiment are 8, 5, and 5 for P− = 47.1, 31.0, and 29.3 MPa, respectively. The sample sizes for canine kidney experiment are 7, 5, and 5 for P− = 45.8, 30.2, and 28.5 MPa, respectively.
The representative histological sections are displayed in Figs. 12(a)–12(c). Similar to the case in renal specimens, the intended treatment regions had lost their normal architecture and contained only acellular granular debris, and a larger spatial extent of the lesion occurred when a higher pressure level was applied. The lesion sizes quantified from histological sections are shown in Figs. 12(d) and 12(e), along with the lesions sizes of canine kidney for comparison. As can be seen, lesion sizes in both lateral and axial directions increased as the applied P− increased. Since the empirical values of pt and σ for liver were not determined [17], no estimates were calculated in this case.
IV. Discussion
In this paper, precise and controlled lesions were generated by the intrinsic threshold mechanism in both RBC phantoms and ex vivo canine specimens. In comparison to the bubble clouds and lesions generated by the shock scattering mechanism shown in our previous studies [12, 18, 21, 22], those generated by the intrinsic threshold mechanism have two advantageous characteristics. First, the shape of the bubble cloud generated by the intrinsic threshold mechanism is well-confined and corresponds well to the shape of the transducer focal zone, whereas the shape of the bubble cloud generated by the shock scattering mechanism is variable and somewhat unpredictable. Because tissue fractionation is directly correlated to the activity of the cavitational bubble cloud, the shape of the lesions produced by the intrinsic threshold mechanism is more predictable and has a better agreement to the shape of the transducer focal zone. Second, the bubble clouds generated by the intrinsic threshold mechanism are more uniform and consistent within the region exceeding the intrinsic threshold, whereas the bubble clouds generated by the shock scattering mechanism can be isolated to subvolumes of the focus due to complex scattering behavior. Therefore, the intrinsic threshold mechanism can potentially lead to more efficient and complete lesion development.
Moreover, using this intrinsic threshold mechanism, very small and controlled lesions can be generated by allowing only a small fraction of the focal region to exceed the cavitation threshold. In this paper, the smallest reproducible lesions generated in RBC phantoms, canine renal specimens, and canine hepatic specimens averaged 0.90 × 1.86 mm (lateral × axial), 0.89 × 1.61 mm, and 0.91 × 1.73 mm, respectively. These values were much smaller than the wavelength of the transducer (λ = ~3 mm for 500 kHz in agarose hydrogel, kidney, and liver). In the lateral direction, the lesion widths were even smaller than the diffraction limited −6dB focal pressure, λ/2. These results demonstrate that microscopic and precise lesions can be achieved using the intrinsic threshold mechanism, hence we call it “microtripsy.”
The sizes of the lesions generated in this study corresponded well with the estimates based on how large the regions were above the PLSE threshold. However, a discrepancy was observed at higher pressure level, as can be seen in Figs. 8 and 10. In order to address this discrepancy, we studied whether the focal size of the transducer remained the same at higher pressure levels. A University of Washington (UW) study [23] has investigated the dependency of focal size on the applied pressure level in high intensity focused ultrasound (HIFU). Both their simulated and experimental results suggested that, when the applied acoustic pressure increased to a certain level, the −6dB beamwidths based on P− increased while the beamwidths based on P+ decreased, due to nonlinear acoustic propagation. Hence, we investigated whether the focal size, for the therapy transducer used in this study, changed with the applied pressure level. Using the fiber optic probe hydrophone (FOPH), 1D beam profile scans along the lateral and axial directions were performed with 100μm step size, and the corresponding −6dB beamwidths based on P+ and P− are plotted in Fig. 13. The −6dB beamwidths based on P− increased from 1.80 × 4.04 mm (lateral × axial) at P− = 8.7 MPa to 1.94 × 4.26 mm at P− = 18.4 MPa. The −6dB beamwidths based on P+ decreased from 1.72 × 3.77 mm at P− = 8.7 MPa to 1.58 × 3.43 mm at P− = 18.4 MPa. These results follow a similar trend described in the study from UW[23], and is the likely explanation for the discrepancy between experimental lesion sizes and their estimates at higher pressure levels. Though we couldn’t get a direct measurement of the beamwidths at the pressure levels used in this study (due to the unavoidable cavitation on the fiber tip in FOPH), this effect can be potentially modeled using a proper nonlinear simulation that we may investigate in the future. Other potential explanations for the discrepancy between actual lesion sizes and the estimates include 1) the maximal bubble expansion is dependent on the applied peak negative pressure, and the higher the applied P−, the larger the expansion, 2) the estimates of the lesion size were based on a simplified model rather than a sophisticated Monte-Carlo simulation demonstrated in [17].
Fig. 13.
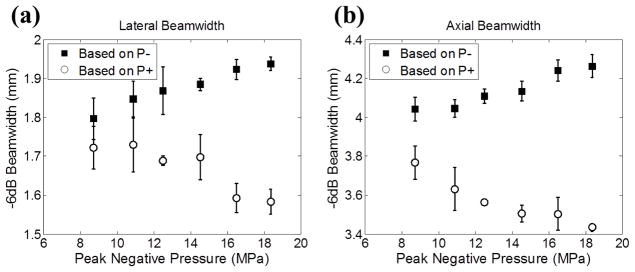
The calibrated −6dB beamwidths in lateral (a) and axial (b) directions for the 500 kHz therapy transducer as a function of the applied P−. The beamwidths calculated based on P− are plotted as solid squares (■) and those calculated based on P+ are plotted as empty circles (○). The vertical error bars represent ± one standard deviation. The sample sizes for each point in (a) are three, and the samples sizes for each point in (b) are four.
The ellipsoidal-shape of the lesions generated at lower pressure levels correspond well with the shape of the focal regions above the PLSE threshold. However, anomalous “tear-drop-shaped” lesions were observed at higher pressure levels and became pronounced at P− of 80.7 MPa, as shown in Figs. 6 and 7(a). This “self-quenching” phenomenon may be due to a reduction in pulse intensity as it propagates through the significantly larger lesion resulting in a progressive reduction in the spatial extent of the supra-PLSE zone and the size of the bubble cloud. The reduction in intensity could result from work done in generating the bubble cloud in the proximal zone of the lesion and some self-shadowing resulting from the rapidly expanding bubbles. Small residual bubbles from previous pulses would have a similar shadowing effect on subsequent pulses, particularly for larger lesions.
In the ex vivo canine tissue experiments, the lesions generated in hepatic tissue are slightly larger than the ones generated in renal tissue, at the same applied pressure levels (before attenuation correction). A majority of this difference can be attributed to the difference in attenuation, since, as shown in Figs. 12(d) and 12(e), the results from two different tissues are actually closer to each other and follow a similar trend after attenuation correction. Another potential explanation is that hepatic tissue has lower Young’s modulus (YM) than renal tissue, since a previous study [24] shows that the tissue erosion process is faster in softer tissue (i.e. lower YM). Additionally, as shown in [17], the expansion of the bubble is larger in softer tissue, thus could potentially resulting in larger produced lesions.
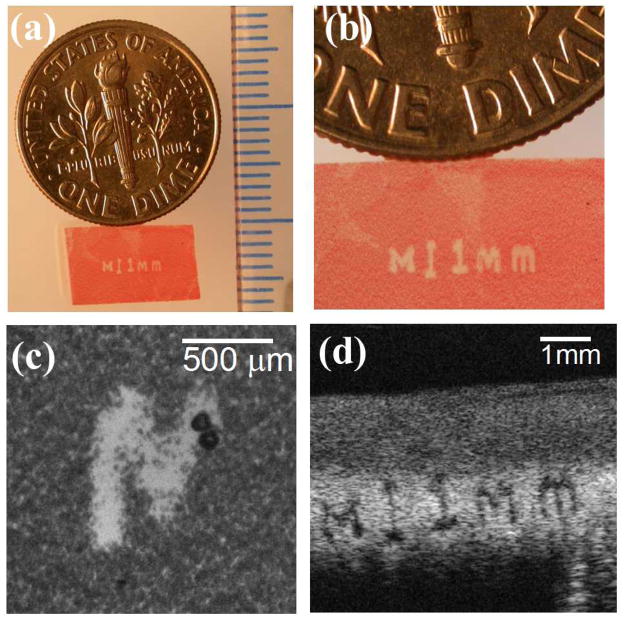
Besides the lesions generated using the 500 kHz transducer in this study, an experiment was performed in a RBC phantom using a 3 MHz 7-element transducer to demonstrate the lesion production of the intrinsic threshold mechanism using a transducer of considerably higher frequency (3 MHz). The active elements in the transducer consisted of 20 mm diameter PZT-4 discs, each individually mounted to an acoustic lens with a geometric focus of 40 mm. The lateral and axial −6dB beamwidths of the 7-element transducer were measured to be 0.31 and 1.42 mm, respectively. The elements were driven by a high voltage pulser that gave an acoustic output of less than 2 cycles. Histotripsy pulses (100 pulses in total) were delivered at a PRF of 1 Hz for each intended treatment location. The smallest reproducible lesion for a single-focal-spot exposure has an average size of 0.16×0.27 mm (axial × lateral). Though this 3 MHz transducer did not share the same design as the 500 kHz transducer, the size of the smallest reproducible lesion was approximately 1/6 of that generated with the 500 kHz transducer. Fig. 14 shows a lesion generated in a RBC phantom using this 3 MHz transducer, and this phantom was moved mechanically with a motorized positioning system during the treatment, creating an “M” character followed by a vertical “scale bar” and a string of characters showing “1 mm.” This figure demonstrates the precision that can be achieved with “micotripsy” using a 3 MHz transducer.
Fig. 14.
A representative lesion in RBC phantom generated by a 3 MHz transducer using the intrinsic threshold mechanism. The lesion reads “M ‘vertical scale bar’ 1mm.” This phantom was moved mechanically with a motorized positioning system during the treatment. (a) An overlook of the lesion along with a US dime coin and a ruler with millimeter tick marks. (b) A magnified view of the lesion (c) A high speed image showing the bubble cloud generated during treatment (d) An ultrasound B-mode image of the lesion after treatment.
This “microtripsy” technique based on the bubble clouds generated by the intrinsic threshold mechanism can be quite beneficial in the case where microscopic and well-defined tissue ablation is required. Especially, as shown in the study, very precise lesions could still be achieved using a low frequency transducer as long as we carefully allow only a small fraction of the focal zone to exceed the intrinsic threshold. Low frequency transducers would be favorable in applications that require long ultrasound penetration depth or where the intended targets have very attenuative overlying tissues, such as in transcranial brain therapy. Moreover, low-frequency single cycle (or close) pulses minimize phase aberration. In the future, we plan to apply supra-intrinsic threshold histotripsy (“microtripsy”) to very specific applications including transcranial and ophthalmologic procedures. We also plan to investigate different strategies on how to more precisely control the small fraction of the focal volume that exceeds the intrinsic threshold.
V. Conclusion
In this study, the capability of histotripsy to generate precise, sub-wavelength lesions is demonstrated both in RBC phantoms and ex vivo canine tissues. This “microtripsy” procedure uses the highly repeatable and very sharp transition zone in cavitation probability inherent to bubble cloud generation above the intrinsic threshold. Lesion sizes in both axial and lateral directions can be increased by increasing the applied peak negative pressure. These lesion sizes corresponded well to the dimensions of the focal beam profile estimated to be beyond the intrinsic cavitation threshold, though there was a discrepancy at higher applied pressure levels (P− >35 MPa), most likely accounted for by an increase in the size of the peak negative pressure focal zone due to nonlinear propagation processes. This microtripsy technique can be significantly useful in the clinical applications where precise, microscopic tissue ablation is required, particularly where low frequencies are indicated while still maintaining small precise sub-wavelength lesions.
Supplementary Material
Acknowledgments
The authors thank Dr. Shin Yoshizawa for the discussion about the dependency of focal size on applied pressure level, Dr. Cheri X. Deng for letting us use her VisualSonics Vevo770 system, and Alexander P. Duryea for his help in assembling the 3MHz transducer mentioned in the Discussion section. This work is supported by the National Institute of Health (grants R01 CA134579, R01 EB008998, and R01 DK091267) and the Hartwell Foundation. Drs. Timothy L. Hall, Zhen Xu, J. Brian Fowlkes, and Charles A. Cain have financial interest and/or other relationship with HistoSonics.
References
- 1.Xu Z, Ludomirsky A, Eun LY, Hall TL, Tran BC, Fowlkes JB, Cain CA. Controlled ultrasound tissue erosion. IEEE Trans Ultrason Ferroelectr Freq Control. 2004 Jun;51:726–36. doi: 10.1109/tuffc.2004.1308731. [DOI] [PMC free article] [PubMed] [Google Scholar]
- 2.Xu Z, Owens G, Gordon D, Cain C, Ludomirsky A. Noninvasive creation of an atrial septal defect by histotripsy in a canine model. Circulation. 2010 Feb 16;121:742–9. doi: 10.1161/CIRCULATIONAHA.109.889071. [DOI] [PMC free article] [PubMed] [Google Scholar]
- 3.Owens GE, Miller RM, Ensing G, Ives K, Gordon D, Ludomirsky A, Xu Z. Therapeutic ultrasound to noninvasively create intracardiac communications in an intact animal model. Catheterization and Cardiovascular Interventions. 2011;77:580–588. doi: 10.1002/ccd.22787. [DOI] [PMC free article] [PubMed] [Google Scholar]
- 4.Parsons JE, Cain CA, Abrams GD, Fowlkes JB. Pulsed cavitational ultrasound therapy for controlled tissue homogenization. Ultrasound Med Biol. 2006 Jan;32:115–29. doi: 10.1016/j.ultrasmedbio.2005.09.005. [DOI] [PubMed] [Google Scholar]
- 5.Roberts WW. Focused ultrasound ablation of renal and prostate cancer: current technology and future directions. Urol Oncol. 2005 Sep-Oct;23:367–71. doi: 10.1016/j.urolonc.2005.05.022. [DOI] [PubMed] [Google Scholar]
- 6.Lake AM, Hall TL, Kieran K, Fowlkes JB, Cain CA, Roberts WW. Histotripsy: Minimally Invasive Technology for Prostatic Tissue Ablation in an In Vivo Canine Model. Urology. 2008;72:682–686. doi: 10.1016/j.urology.2008.01.037. [DOI] [PMC free article] [PubMed] [Google Scholar]
- 7.Duryea AP, Hall TL, Maxwell AD, Xu Z, Cain CA, Roberts WW. Histotripsy erosion of model urinary calculi. J Endourol. 2011 Feb;25:341–4. doi: 10.1089/end.2010.0407. [DOI] [PMC free article] [PubMed] [Google Scholar]
- 8.Duryea AP, Maxwell AD, Roberts WW, Xu Z, Hall TL, Cain CA. In vitro comminution of model renal calculi using histotripsy. IEEE Trans Ultrason Ferroelectr Freq Control. 2011 May;58:971–80. doi: 10.1109/TUFFC.2011.1898. [DOI] [PMC free article] [PubMed] [Google Scholar]
- 9.Rabkin BA, Zderic V, Vaezy S. Hyperecho in ultrasound images of HIFU therapy: involvement of cavitation. Ultrasound Med Biol. 2005 Jul;31:947–56. doi: 10.1016/j.ultrasmedbio.2005.03.015. [DOI] [PubMed] [Google Scholar]
- 10.Hall TL, Fowlkes JB, Cain CA. A real-time measure of cavitation induced tissue disruption by ultrasound imaging backscatter reduction. IEEE Trans Ultrason Ferroelectr Freq Control. 2007 Mar;54:569–75. doi: 10.1109/tuffc.2007.279. [DOI] [PubMed] [Google Scholar]
- 11.Wang TY, Xu Z, Winterroth F, Hall TL, Fowlkes JB, Rothman ED, Roberts WW, Cain CA. Quantitative ultrasound backscatter for pulsed cavitational ultrasound therapy- histotripsy. IEEE Trans Ultrason Ferroelectr Freq Control. 2009 May;56:995–1005. doi: 10.1109/tuffc.2009.1131. [DOI] [PMC free article] [PubMed] [Google Scholar]
- 12.Maxwell AD, Wang TY, Cain CA, Fowlkes JB, Sapozhnikov OA, Bailey MR, Xu Z. Cavitation clouds created by shock scattering from bubbles during histotripsy. J Acoust Soc Am. 2011 Oct;130:1888–98. doi: 10.1121/1.3625239. [DOI] [PMC free article] [PubMed] [Google Scholar]
- 13.Xu Z, Fowlkes JB, Ludomirsky A, Cain CA. Investigation of intensity thresholds for ultrasound tissue erosion. Ultrasound in Medicine & Biology. 2005;31:1673–1682. doi: 10.1016/j.ultrasmedbio.2005.07.016. [DOI] [PMC free article] [PubMed] [Google Scholar]
- 14.Maxwell AD, Cain CA, Duryea AP, Yuan L, Gurm HS, Xu Z. Noninvasive Thrombolysis Using Pulsed Ultrasound Cavitation Therapy ??Histotripsy. Ultrasound in medicine & biology. 2009;35:1982–1994. doi: 10.1016/j.ultrasmedbio.2009.07.001. [DOI] [PMC free article] [PubMed] [Google Scholar]
- 15.Xu Z, Hall TL, Fowlkes JB, Cain CA. Effects of acoustic parameters on bubble cloud dynamics in ultrasound tissue erosion (histotripsy) The Journal of the Acoustical Society of America. 2007;122:229–236. doi: 10.1121/1.2735110. [DOI] [PMC free article] [PubMed] [Google Scholar]
- 16.Wang T-Y, Maxwell AD, Park S, Xu Z, Fowlkes JB, Cain CA. Why Are Short Pulses More Efficient in Tissue Erosion Using Pulsed Cavitational Ultrasound Therapy (Histotripsy)? In: Kullervo H, Jacques S, editors. AIP. Vol. 1215. 2009. pp. 40–43. [Google Scholar]
- 17.Maxwell AD, Cain CA, Hall TL, Fowlkes JB, Xu Z. Probability of Cavitation for Single Ultrasound Pulses Applied to Tissues and Tissue-Mimicking Materials. Ultrasound Med Biol. 2013;39:449–465. doi: 10.1016/j.ultrasmedbio.2012.09.004. [DOI] [PMC free article] [PubMed] [Google Scholar]
- 18.Maxwell AD, Wang TY, Yuan L, Duryea AP, Xu Z, Cain CA. A Tissue Phantom for Visualization and Measurement of Ultrasound-Induced Cavitation Damage. Ultrasound in Medicine & Biology. 2010;36:2132–2143. doi: 10.1016/j.ultrasmedbio.2010.08.023. [DOI] [PMC free article] [PubMed] [Google Scholar]
- 19.Parsons JE, Cain CA, Fowlkes JB. Cost-effective assembly of a basic fiber-optic hydrophone for measurement of high-amplitude therapeutic ultrasound fields. J Acoust Soc Am. 2006 Mar;119:1432–40. doi: 10.1121/1.2166708. [DOI] [PubMed] [Google Scholar]
- 20.Mast TD. Empirical relationships between acoustic parameters in human soft tissues. Acoustics Research Letters Online. 2000;1:37–42. [Google Scholar]
- 21.Wang TY, Xu Z, Hall TL, Fowlkes JB, Cain CA. An Efficient Treatment Strategy for Histotripsy by Removing Cavitation Memory. Ultrasound in Medicine & Biology. 2012;38:753–766. doi: 10.1016/j.ultrasmedbio.2012.01.013. [DOI] [PMC free article] [PubMed] [Google Scholar]
- 22.Xu Z, Raghavan M, Hall TL, Chang CW, Mycek MA, Fowlkes JB, Cain CA. High Speed Imaging of Bubble Clouds Generated in Pulsed Ultrasound Cavitational Therapy - Histotripsy. Ultrasonics, Ferroelectrics and Frequency Control, IEEE Transactions on. 2007;54:2091–2101. doi: 10.1109/TUFFC.2007.504. [DOI] [PMC free article] [PubMed] [Google Scholar]
- 23.Canney MS, Bailey MR, Crum LA, Khokhlova VA, Sapozhnikov OA. Acoustic characterization of high intensity focused ultrasound fields: A combined measurement and modeling approach. The Journal of the Acoustical Society of America. 2008;124:2406–2420. doi: 10.1121/1.2967836. [DOI] [PMC free article] [PubMed] [Google Scholar]
- 24.Cooper M, Zhen X, Rothman ED, Levin AM, Advincula AP, Fowlkes JB, Cain CA. Controlled ultrasound tissue erosion: the effects of tissue type, exposure parameters and the role of dynamic microbubble activity. Ultrasonics Symposium, 2004 IEEE; 2004. pp. 1808–1811. [Google Scholar]
Associated Data
This section collects any data citations, data availability statements, or supplementary materials included in this article.


