Abstract
RNA plays a dual role as an informational molecule and a direct effector of biological tasks. The latter function is enabled by RNA’s ability to adopt complex secondary and tertiary folds and thus has motivated extensive computational1–2 and experimental3–8 efforts for determining RNA structures. Existing approaches for evaluating RNA structure have been largely limited to in vitro systems, yet the thermodynamic forces which drive RNA folding in vitro may not be sufficient to predict stable RNA structures in vivo5. Indeed, the presence of RNA binding proteins and ATP-dependent helicases can influence which structures are present inside cells. Here we present an approach for globally monitoring RNA structure in native conditions in vivo with single nucleotide precision. This method is based on in vivo modification with dimethyl sulfate (DMS), which reacts with unpaired adenine and cytosine residues9, followed by deep sequencing to monitor modifications. Our data from yeast and mammalian cells are in excellent agreement with known mRNA structures and with the high-resolution crystal structure of the Saccharomyces cerevisiae ribosome10. Comparison between in vivo and in vitro data reveals that in rapidly dividing cells there are vastly fewer structured mRNA regions in vivo than in vitro. Even thermostable RNA structures are often denatured in cells, highlighting the importance of cellular processes in regulating RNA structure. Indeed, analysis of mRNA structure under ATP-depleted conditions in yeast reveals that energy-dependent processes strongly contribute to the predominantly unfolded state of mRNAs inside cells. Our studies broadly enable the functional analysis of physiological RNA structures and reveal that, in contrast to the Anfinsen view of protein folding, thermodynamics play an incomplete role in determining mRNA structure in vivo.
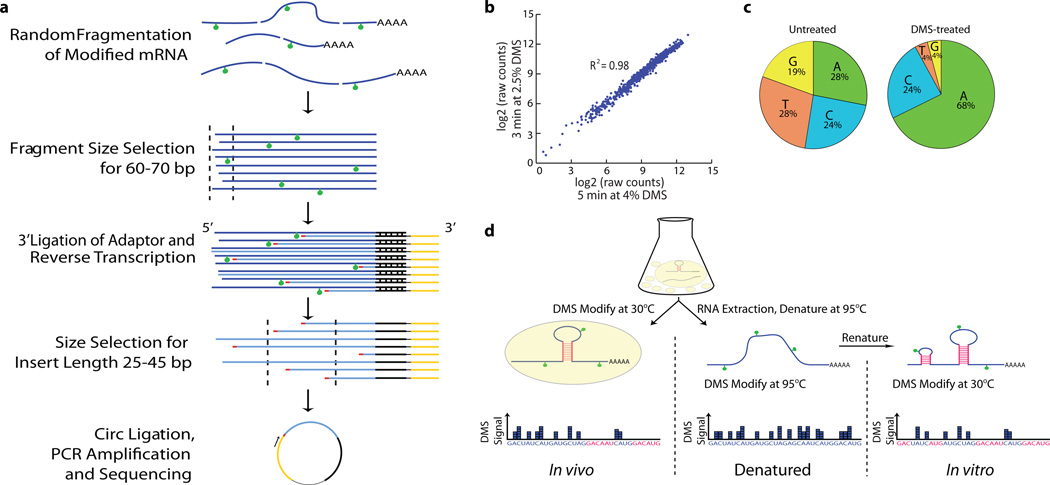
A wide range of chemicals and enzymes have been used to monitor RNA structure11,7. We focused on DMS as it enters cells rapidly9,12 and is a well-established tool for the analysis of RNA structure13. DMS is highly reactive with solvent accessible, unpaired residues but reliably unreactive with bases engaged in Watson-Crick interactions, thus nucleotides that are strongly protected or reactive to DMS can be inferred to be base-paired or unpaired, respectively. We coupled DMS treatment to a massively parallel sequencing readout (DMS-seq) by randomly fragmenting the pool of modified RNAs and size-selecting prior to 3’ ligation with a specific adapter oligo (Fig. 1a). Since DMS modifications at adenine and cytosine residues block reverse transcription14 (RT), we used a second size selection step to collect and sequence only the prematurely terminated cDNA fragments. Sequencing of the fragments reveals the precise site of DMS modification, with the number of reads at each position providing a measure of relative reactivity of that site. The results are highly reproducible and robust against changes in the time of modification or concentration of DMS used (Fig. 1b). The sequencing readout allowed global analysis with a high signal-to-noise ratio—in DMS treated samples, >90% of reads end with an adenine and cytosine, corresponding to false positives for A and C of 7% and 17%, respectively (Fig. 1c). For each experiment, we measured RNA structure both in vivo and in vitro (i.e. refolded RNA in the absence of proteins). We also measured DMS reactivity under denaturing conditions (95°C) as a control for intrinsic biases in reactivity, library generation or sequencing, revealing only modest variability compared to that caused by structure-dependent differences in reactivity (Fig. 2c, Extended Data Fig. 1a).
Figure 1. Utilizing DMS for RNA structure probing by deep sequencing.
a, Schematic of strategy for library preparation with DMS-modified RNAs. b, DMS-seq data is highly reproducible and robust against changes in time and DMS concentration. c, In vivo DMS treatment dramatically enriches for sequencing reads mapping to A/C bases compared to untreated control. d, DMS-seq was completed for in vivo, denatured, and in vitro samples. The denatured sample served as an ‘unstructured’ control.
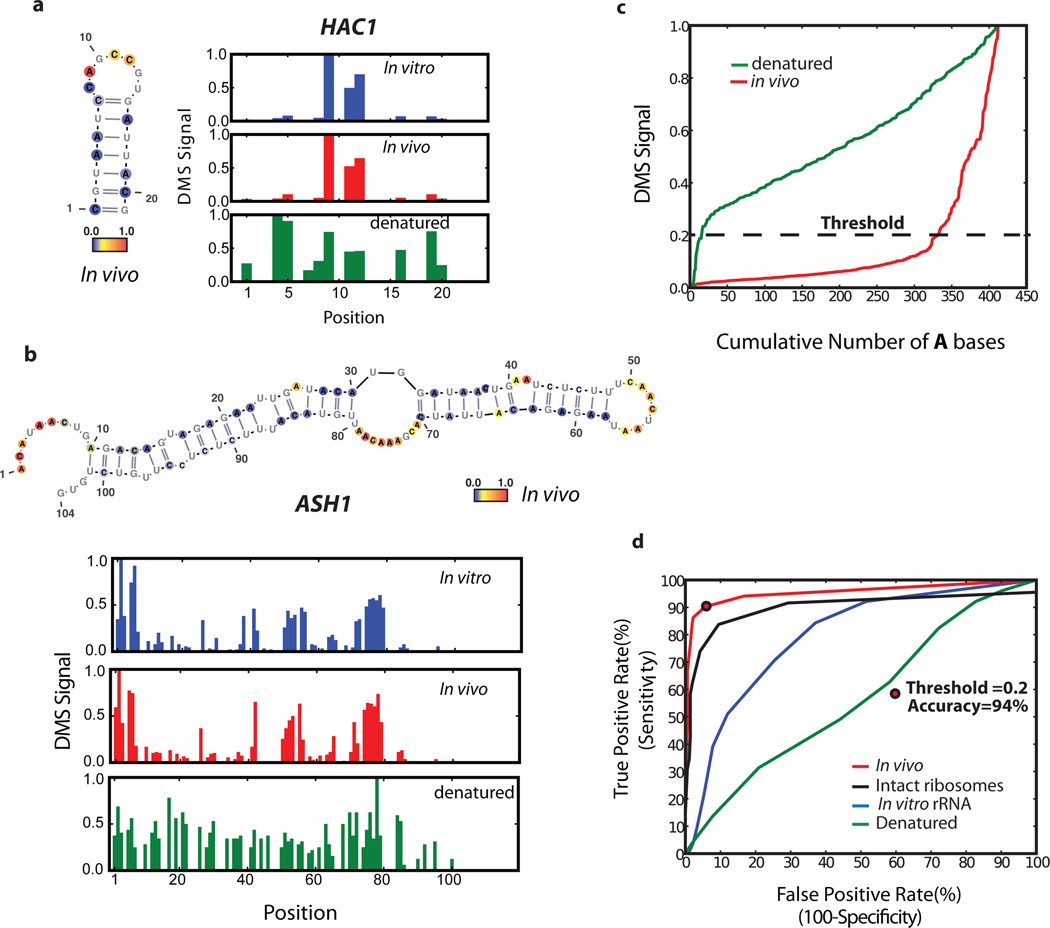
Figure 2. Comparison of DMS-seq data to known RNA structures.
A–b, DMS signal in (a) HAC1 (position 1 corresponds to chrVI:75828) (b) ASH1 (position 1 corresponds to chrXI:96245). Number of reads per position was normalized to the highest number of reads in the inspected region, which is set to 1.0. Also shown are the known secondary structures with nucleotides color-coded reflecting DMS-seq signal in vivo. c, DMS signal on 18S rRNA A bases plotted from least to most reactive. d, ROC curve on the DMS signal for A/C bases from the 18S rRNA. Threshold at 94% accuracy corresponds to 0.2 for the A bases.
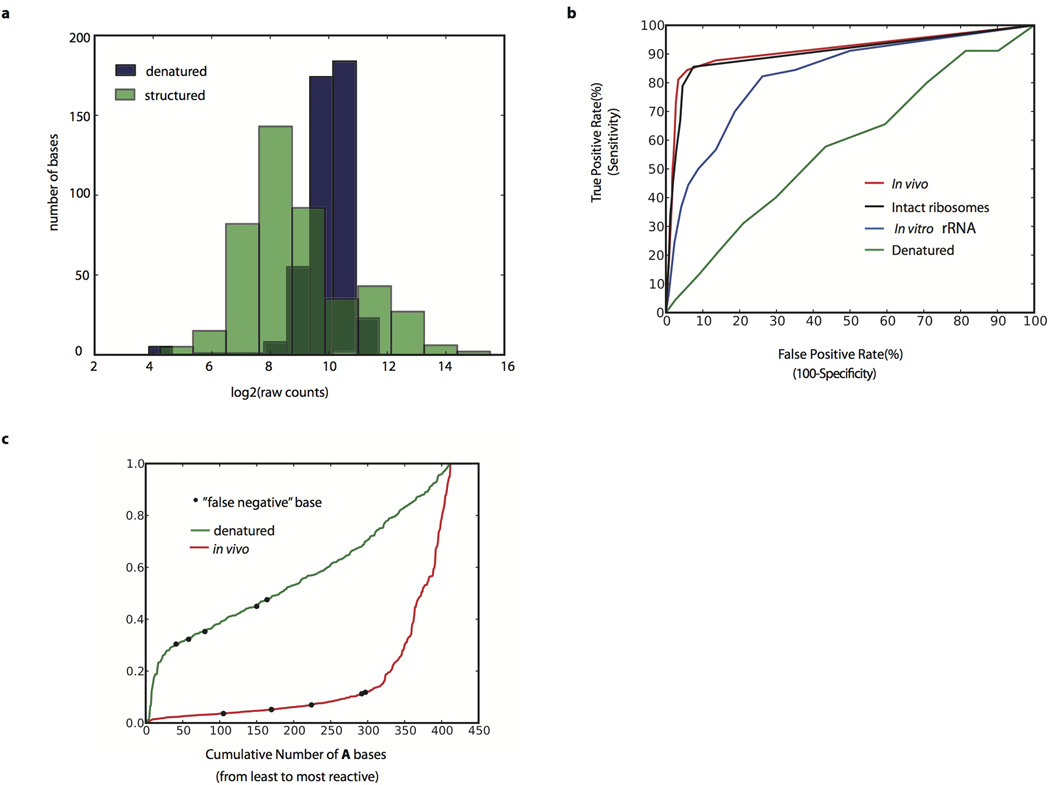
Extended Data Figure 1. Ribosomal RNA analysis.
a, Histogram of raw counts distribution for denatured and structured 18S rRNA. Log2 (raw counts) for A bases plotted for in vivo and denatured samples. b, ROC curve on the DMS signal for A and C bases from the 25S rRNA in denatured, in vitro, intact ribosomes, and in vivo samples. True positives are defined as bases that are both unpaired and solvent accessible, and true negatives are defined as bases that are paired. c, DMS signal on all of the 18S rRNA A bases plotted from least to most reactive in the denatured or in vivo samples. The A bases that are false negatives relative to the crystal structure are colored as black dots on both the denatured and in vivo samples.
The in vivo DMS-seq data are in excellent agreement with known RNA structures. We examined three validated mRNA structures in S. cerevisiae: HAC1, RPS28B, and ASH115–17. In each case, the DMS-seq pattern qualitatively recapitulates secondary structure with high reactivity constrained to loop regions in both the in vivo and the in vitro samples but not in the denatured (Fig. 2a–b). Recent determination of a high-resolution yeast 80S ribosome crystal structure10 allowed us to comprehensively evaluate the DMS-seq data for rRNAs. Comparison of the 18S (Fig. 2c) and 25S (Extended Data Fig. 1b) rRNA DMS signal in vivo versus denatured reveals a large number of strongly protected bases in vivo. Based on DMS reactivity, we used a threshold to bin bases into reactive and unreactive groups, then calculated agreement with the crystal structure model as a function of the threshold. True positives were defined as both unpaired and solvent accessible bases according to the crystal structure, and true negatives defined as paired bases. A receiver operator characteristic (ROC) curve shows a range of thresholds with superb agreement between the in vivo DMS-seq data and the crystal structure model (Fig. 2d). For example, at a threshold of 0.2 the true positive rate, false positive rate, and accuracy are 90%, 6%, and 94% respectively. Bases that were not reactive at this threshold in vivo showed normal reactivity when denatured (Extended Data Fig. 1c). This argues that the small fraction (~10%) of residues that are designated as accessible, but are nonetheless strongly protected from reacting with DMS, resulted from genuine differences in the in vivo conformation of the ribosome and the existing crystal structures. Agreement with the crystal structure was far less good for in vitro refolded rRNA (as expected given the absence of ribosomal proteins) and was completely absent for denatured RNA. By contrast, probing of intact purified ribosomes gave a very similar result to that seen in vivo, further demonstrating that DMS-seq yields comparable results in vitro and in vivo when probing the same structure.
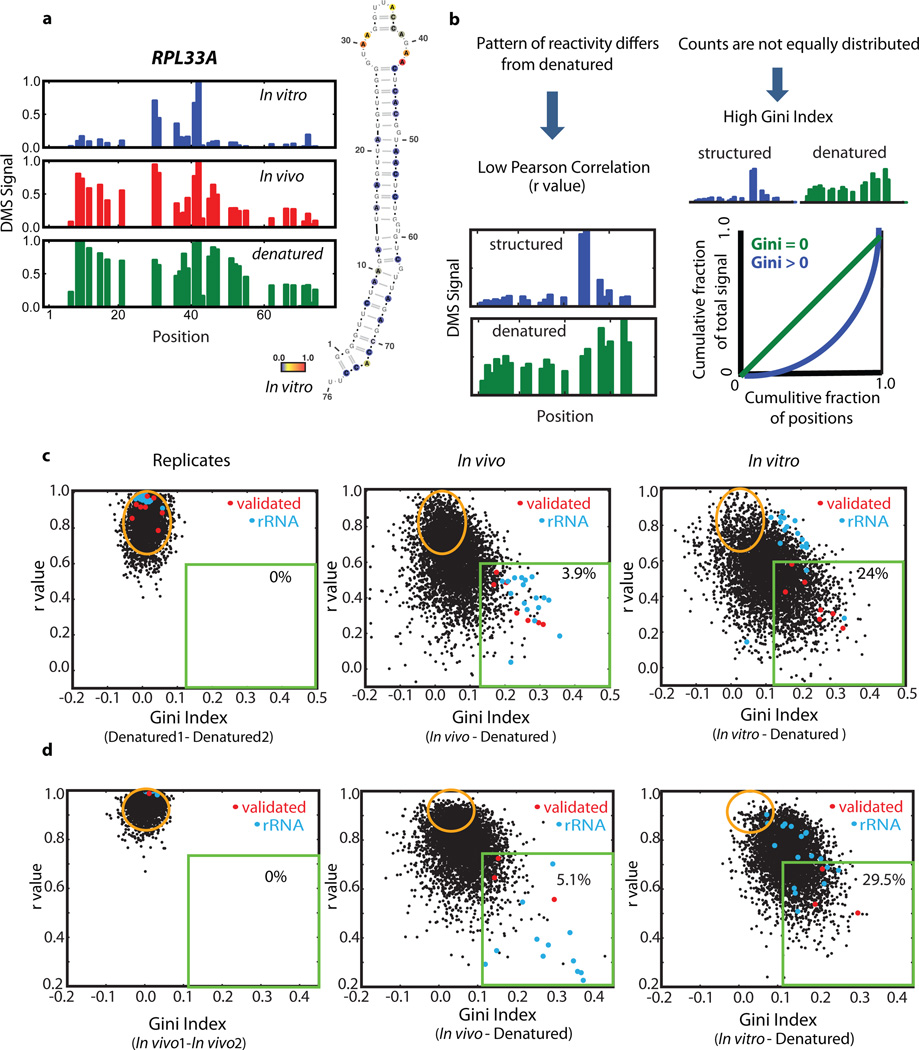
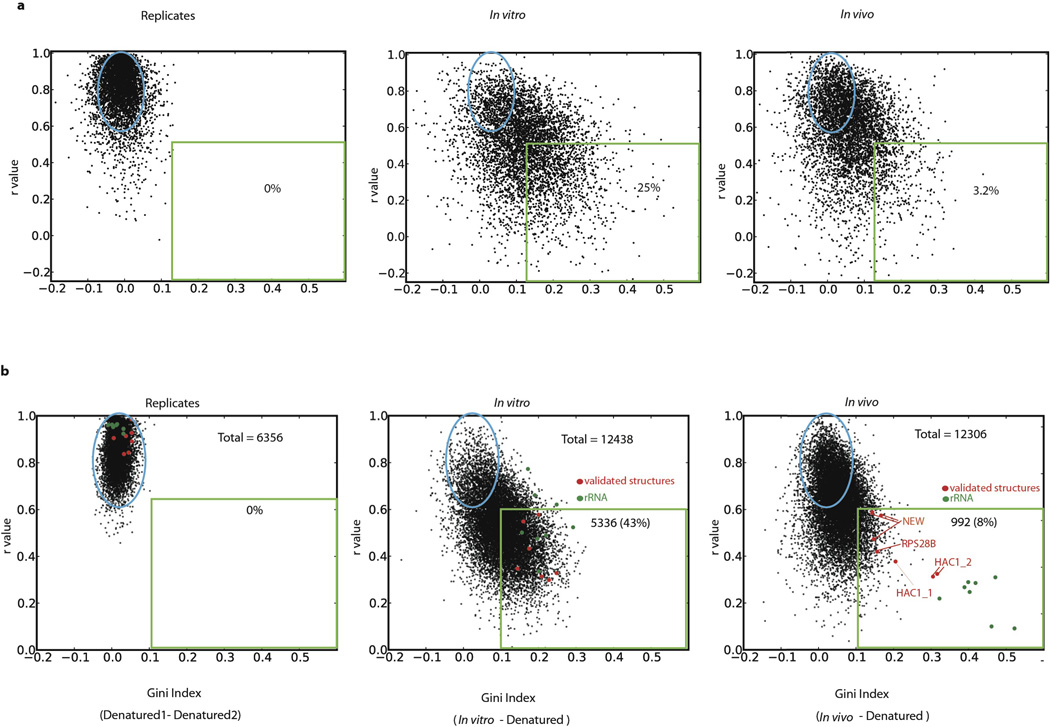
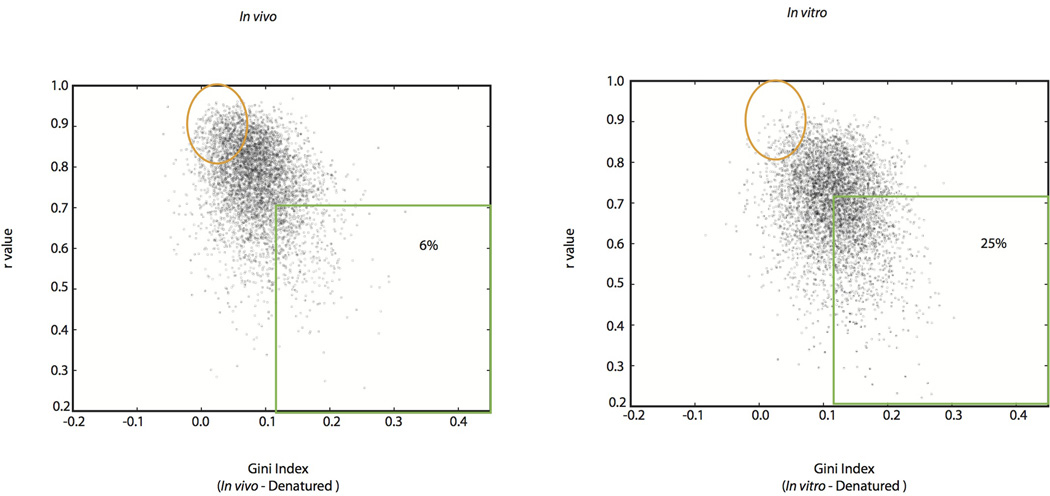
Qualitatively, we observed many mRNA regions where structure was apparent in vitro but not in vivo. For example, computational analysis18 predicts a stem loop structure in RPL33A. The in vitro DMS-seq data strongly supported this predicted structure whereas this region showed little to no evidence of structure in cells (Fig. 3a). To systematically explore the relationship between mRNA structure in vivo and in vitro, we quantitated structure in a given region using two metrics: Pearson correlation coefficient (r value), which reports on the degree of similarity of the modification pattern to that of a denatured control, and the Gini index19, which measures disparity in count distribution as would be seen between an accessible loop verses a protected stem (Fig. 3b). We then applied these metrics to windows containing a total of 50 A/C nucleotides. Globally, mRNAs are much more structured in vitro compared to in vivo: there is a strong shift towards low r values and high Gini indices for the in vitro data that is far less pronounced in vivo (Fig. 3c). Thus unlike the ribosomal RNA, we find little evidence within mRNAs for in vivo DMS protection beyond what we observe in vitro, suggesting that the DMS protection we observe in vivo is not due to mRNA-protein interactions. For example, using a cut-off (r value <0.55, Gini index >0.14) which captured the rRNAs and functionally validated mRNA structures, including both previously characterized and newly identified structures (see below), we found that out of 23,412 mRNA regions examined (representing 1,948 transcripts), only 3.9% are structured in vivo compared to 24% in vitro (Fig. 3c and Extended Data Fig. 2 for similar results obtained with windows of different sizes). In addition, 29% of the regions in vivo are indistinguishable from denatured (Fig. 3c, orange circle), whereas in vitro only 9% of regions were fully denatured. We also applied DMS-seq to mammalian cells (both K562 cells and human foreskin fibroblast), which revealed qualitatively very similar results to yeast—a limited number of stable structures in vivo compared to in vitro (Fig. 3d, Extended Data Fig. 3–4).
Figure 3. Identification of structured mRNA regions reveals far less structure in vivo than in vitro.
a, DMS signal in RPL33A mRNA, position 1 corresponds to chrXVI:282824. In vitro DMS signal color-coded proportional to intensity and plotted onto the Mfold structure prediction. b, Schematic representation of the two metrics used to define structured regions within mRNAs. C–d, Scatter plots of Gini index versus r value from biological replicates or in vivo and in vitro relative to denatured samples for non-overlapping mRNA regions of 50 A/C nucleotides for (c) yeast and (d) K562 cells. 5,000 randomly selected regions are shown. Red dots represent regions spanning validated mRNA structures and blue dots are regions from rRNA. Evaluated regions have a minimum of 15 reads per A/C on average and their total number for in vivo data is (c) 23,412 and (d)17,242.
Extended Data Figure 2. mRNA structure analysis with different window sizes.
Scatter plots of Gini Index verses r values in replicate samples and for in vivo or in vitro samples relative to denatured sample for mRNA regions with an average of at least 15 counts per position, spanning the sequence of (a) 25 A/C nucleotides (5000 randomly selected regions are shown) or (b) 100A/C nucleotides. Shown are regions spanning validated secondary structures (red dots) and regions from the 18S rRNA (green dots).
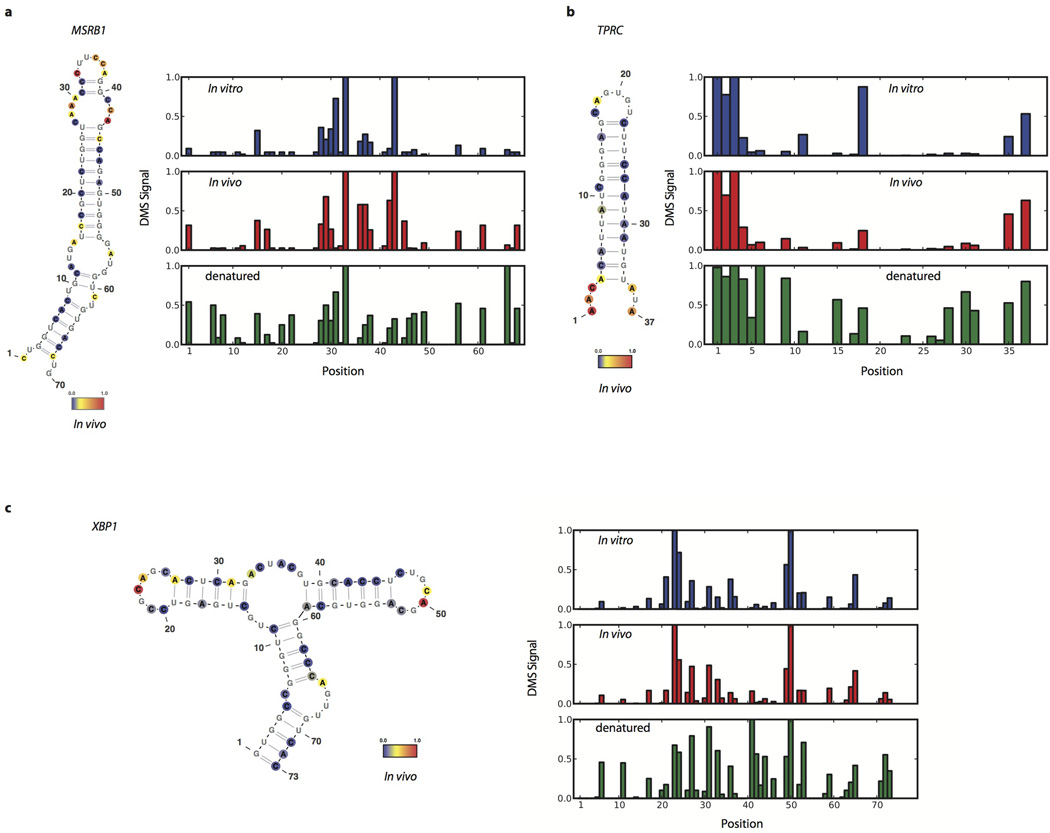
Extended Data Figure 3. Agreement of DMS-seq with validated structures in mammalian K562 cells.
Raw DMS counts were normalized to the most reactive nucleotide in the given region. A and C bases were normalized separately. The DMS signal is color coded proportional to intensity and plotted onto the secondary structure model of (a) MSRB1 selenocysteine insertion element, nucleotide 1 corresponds to nucleotide 966 of the transcript, (b) TPRC iron recognision element, nucleotide 1 corresponds to nucleotide 3901 of the transcript, (c) XBP1 conserved non cannonical intron recognized by Ire1, nucleotide 1 corresponds to nucleotide 520 of the transcript.
Extended Data Figure 4. Global mRNA analysis of human foreskin fibroblast cells.
Scatter plots of Gini Index verses r values for in vivo or in vitro samples relative to denatured sample for mRNA regions spanning the sequence of 50 A/C nucleotides.
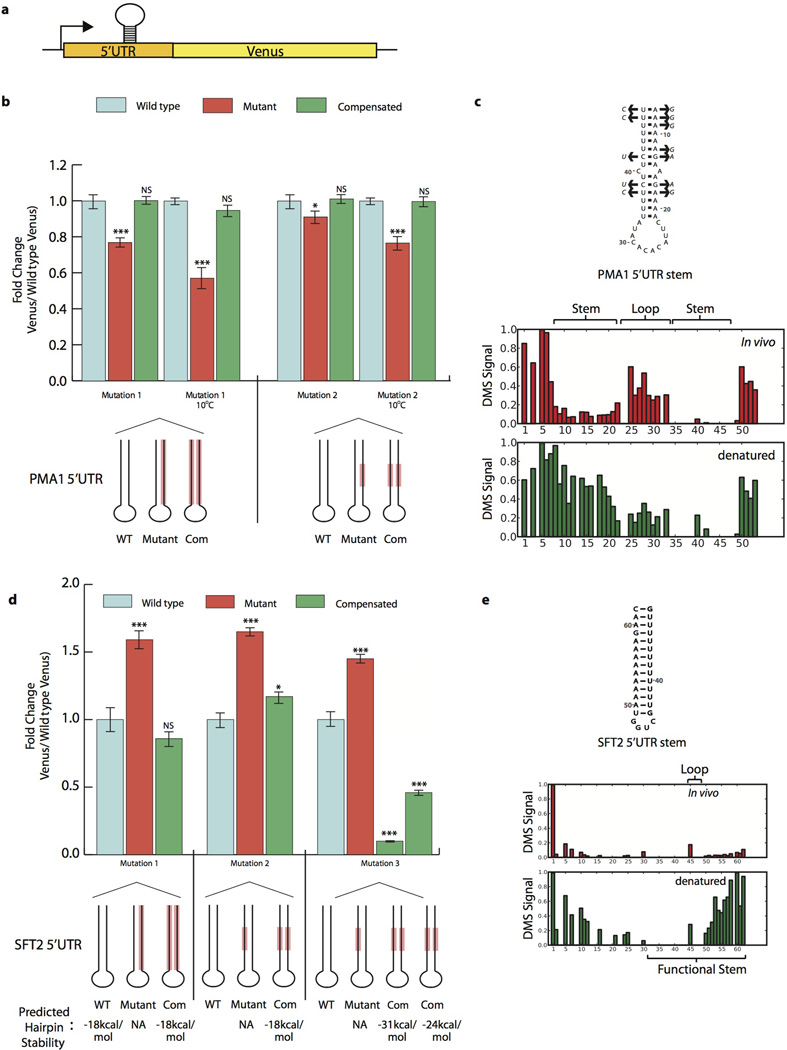
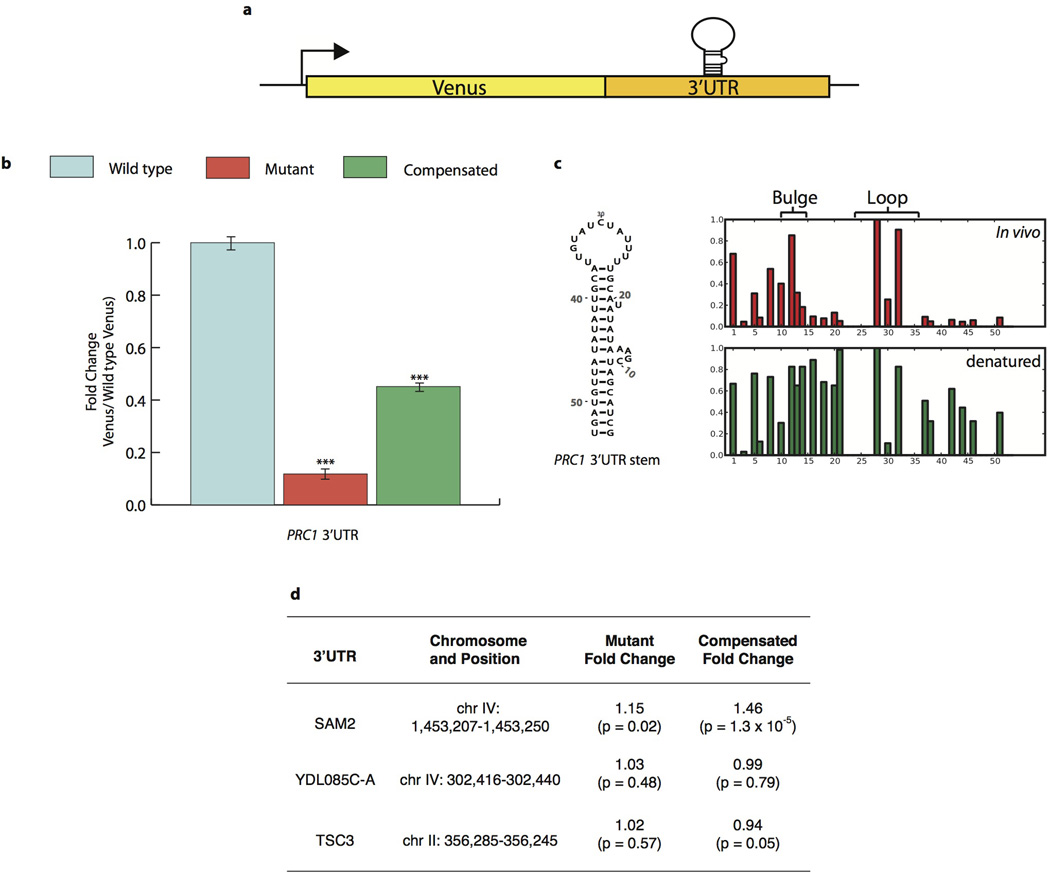
Because the pool of stable structures seen in vivo includes previously validated functional mRNA structures, this relatively small subset of mRNA regions provides highly promising candidates for novel functional RNA structures. To explore this, we focused on two structured 5’ untranslated regions (UTRs) from PMA1 and SFT2 and on the structured PRC1 3’UTR for more detailed functional analyses. We fused these UTRs upstream or downstream, respectively, of a Venus protein reporter and quantified Venus levels by flow cytometry. Stem loop structures in these UTRs significantly increased (5’SFT2) or decreased (5’PMA1 and 3’PRC1) protein levels upon disruption of their predicted base pairing interactions, and Venus protein levels were rescued by compensatory mutations (Extended Data Fig. 5–6, Extended Data Table 1). Phylogenetic analysis revealed the 5’UTR PMA1 stem is under positive evolutionarily selection (Extended Data Fig. 5c), lending additional support for a physiological function. A list of 189 structured regions, along with a model of their secondary structures that are similarly supported by phylogenetic analysis of compensatory mutations, is hosted on an online database (http://weissmanlab.ucsf.edu/yeaststructures/index.html). In addition, we mutated predicted stems in three 3’UTRs with evidence of strong ordered structures in vitro but not in cells, and these mutations resulted in minimal expression changes (Extended Data Fig. 6d). Nonetheless, it remains possible that transient, heterogenous or weakly ordered structures in vivo have biological roles especially if they become more ordered under different physiological conditions.
Extended Data Figure 5. Functional verification of novel 5’UTR structures in vivo.
a, Putative 5’UTR stems were manipulated in the context of a Venus reporter in vivo. b, PMA1 5’UTR structure was mutated and compensated twice with Venus reporter, differing in number and character of bases mutated. Mutation location shown in red on schematic. Reported p-values relative to wildtype Venus levels, calculated by two-sided t-test (p < .01, .001, and .0001 represent *, **, and *** respectively). For all graphs, Venus signal normalized to cell size before calculating fold change and data presented is from two biological and two technical replicates. Error bars represent SEM. c, Secondary structure of functional PMA1 5’UTR stem, with compensatory mutations (arrows) found in S. paradoxus, S. mikatae, S. kudriavzevii, and S. bayanus. Raw DMS signal shown below (position 1 = chrVII:482745). d, SFT2 5’UTR structure was mutated and compensated three times in Venus reporter system, differing in number, character, and location of bases mutated. Mutation location shown in red on schematic. Stem stability as predicated by mfold. Reported p-values relative to wild type Venus levels, also by two-sided t -test (p < .01, .001, and .0001 represent *, **, and *** respectively). Error bars represent standard deviation c, Secondary structure of functional SFT2 5’UTR stem. Position 1 = chrII:24023.
Extended Data Figure 6. Functional verification of novel PRC1 3’UTR structure in vivo.
a, Putative 3’UTR stems were manipulated in the context of a Venus reporter in vivo, followed by Venus quantitation with flow cytometry. b, PRC1 3’UTR structure was mutated and compensated in Venus reporter system. For all data, reported p-values relative to wildtype Venus levels, calculated by two-sided t-test (p < .01, .001, and .0001represent *, **, and *** respectively). Venus signal was normalized to cell size with fold change reported relative to Venus levels seen with the wild type stem. All results shown are derived from four measurements: two biological and two technical replicates. Error bars show standard deviation. c, Secondary structure of functional PRC1 3’UTR stem, shown with raw DMS signal for in vivo and denatured samples. Position 1 = chrXIII:863554. d,Weakly structured 3’UTRs in vivo were tested for function as in (b) but reveal little effectwhen mutated and no evidence for compensation.
Extended Data Table 1. Sequences of functional structure mutations.
5’-3’ mRNA structure sequences are listed. Lowercase letters correspond to non-paired bases, found in bulges or loops within the stem. Mutated bases are underlined.
| UTR | Stem Sequence (5’ to 3’) |
|---|---|
| PMA1 Wildtype | TTTTTTCTcTCTTTTatacacacattcAAAAGAaAGAAAAAA |
| PMA1 Mutant 1 | TTTTTTCTcTCTTTTatacacacattcTTTTCTcTCTTTTTT |
| PMA1 Compensated 1 | AAAAAAGAaAGAAAAatacacacattcTTTTCTcTCTTTTTT |
| PMA1 Mutant 2 | TTTTTTCTcTCTTTTatacacacattcAAAttcatttAAAAAA |
| PMA1 Compensated 2 | TTTTTaagcgagTTTatacacacattcAAAttcatttAAAAAA |
| SFT2 Wildtype | GTTTTTTTTTTTTGctggTAAAAAAAAAGAAC |
| SFT2 Mutant 1 | CAAAAAAAAAAAATctggTAAAAAAAAAGAAC |
| SFT2 Compensated 1 | CAAAAAAAAAAAATctggGTTTTTTTTTTTTG |
| SFT2 Mutant 2 | GTTTTTTTTTTTTGctggTAAAttttttGAAC |
| SFT2 Compensated 2 | GTTTaaaaaaTTTGctggTAAAttttttGAAC |
| SFT2 Mutant 3 | GTTTTTTTTTTTTGctggTAAAccccccGAAC |
| SFT2 Compensated 3 | GTTTggggggTTTGctggTAAAccccccGAAC |
| PRC1 Wildtype | GCTACGATcgaaATATAtACGTttttatctatgttACGTTATATATTGTAGT |
| PRC1 Mutant | TGATGTTAcgaaTATATtTGCAttttatctatgttACGTTATATATTGTAGT |
| PRC1 Compensated | TGATGTTAcgaaTATATtTGCAttttatctatgttTGCAATATATAGCATCG |
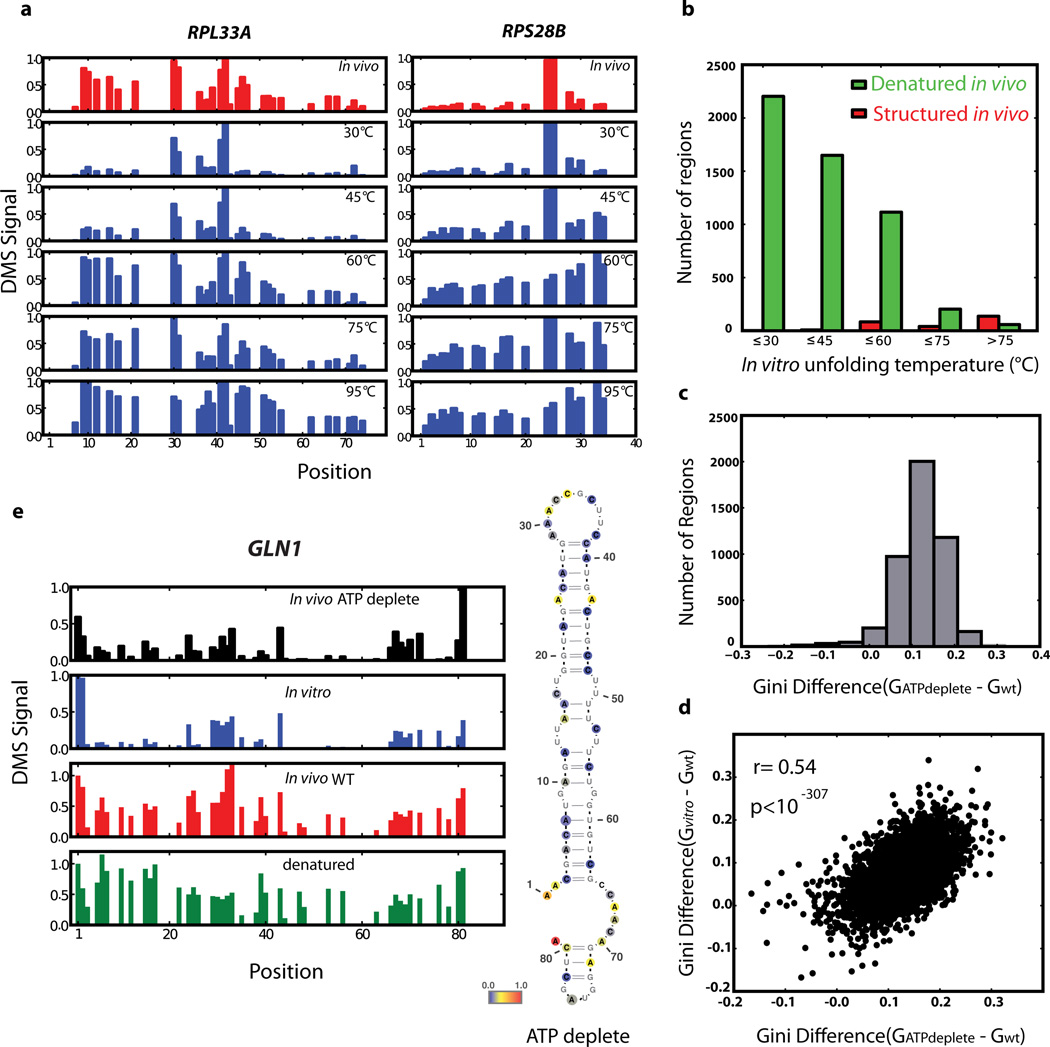
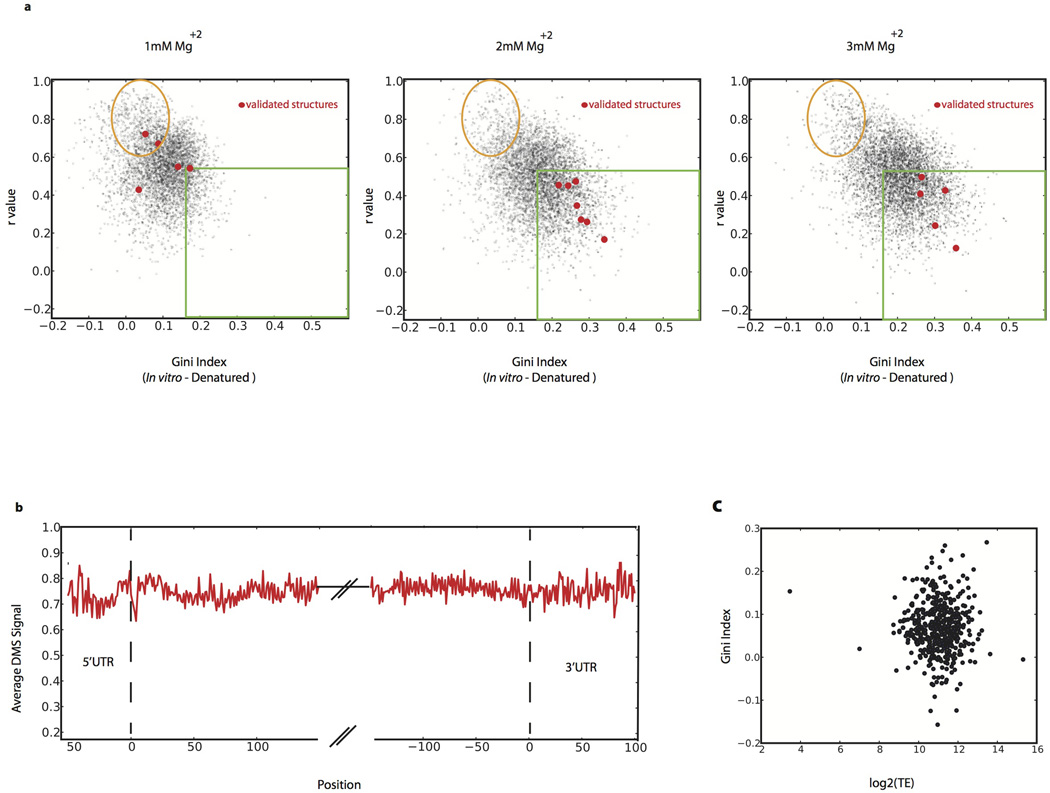
To evaluate what role in vitro thermodynamic stability plays in driving mRNA folding in vivo, we performed genome-wide structure probing experiments in vitro at five temperatures (30, 45, 60, 75, and 95°C). As temperature rises and structure unfolds (Fig. 4a), the DMS signal becomes more even (low Gini index) and the modification pattern resembles that of the 95°C denatured control (high r value). We defined in vitro temperature of unfolding (Tunf) as the lowest temperature where a region appeared similar to the denatured controls. Remarkably, many regions with little or no detectable structure in vivo show similar thermostability to highly structured regions, including structures that are functionally validated (Fig. 4a, b). For example, the regions of RPL33A (unfolded in vivo) and RPS28B (a functionally validated structure in vivo) are both highly structured in vitro and have Tunf = 60°C. Nonetheless, we find that structures present in vivo do have a strong propensity for high thermostability (Fig. 4b), consistent with a recent in vitro mRNA thermal unfolding study8. In addition to the role of thermostability in explaining the disparity of RNA structure between in vivo and in vitro samples, we tested the effect of Mg2+ concentration in vitro. We obtained similar structure results with 2–6mM Mg2+. However, at 1 mM Mg2+, we observe unfolding of most structures including the functionally validated ones (Extended Data Fig. 7a). The above observations indicate that Mg2+ concentration and thermodynamic stability play an important but incomplete role in determining mRNA structure in vivo.
Figure 4. Factors affecting the difference between mRNA structure in vivo and in vitro.
a, Example of DMS signal changes for RPL33A and RPS28B in vivo and in vitro with increasing temperature. b, Histogram of in vitro unfolding temperature (Tunf) for denatured (green bars) or structured (red bars) regions in vivo. c, Histogram of Gini index difference between ATP-depleted and wildtype yeast samples. d, Gini index differences in ATP-depleted yeast or in vitro refolded mRNAs relative to wildtype yeast, calculated over 50 A/C nucleotides. e, Example of in vivo structure changes during ATP depletion. Position 1 corresponds to chrXVI:643,069.
Extended Data Figure 7. Global analysis of mRNA structure.
a, In vitro DMS-seq on RNA re-folded in different Mg+2 concentrations. b, Metagene plot of the average DMS signal (normalized to denatured control) over 5’UTR, coding, and 3’UTR regions. c, Scatter plot of Gini Index (calculated over the first 100 A/C bases) of in vivo messages (relative to denatured) verses translation efficiency.
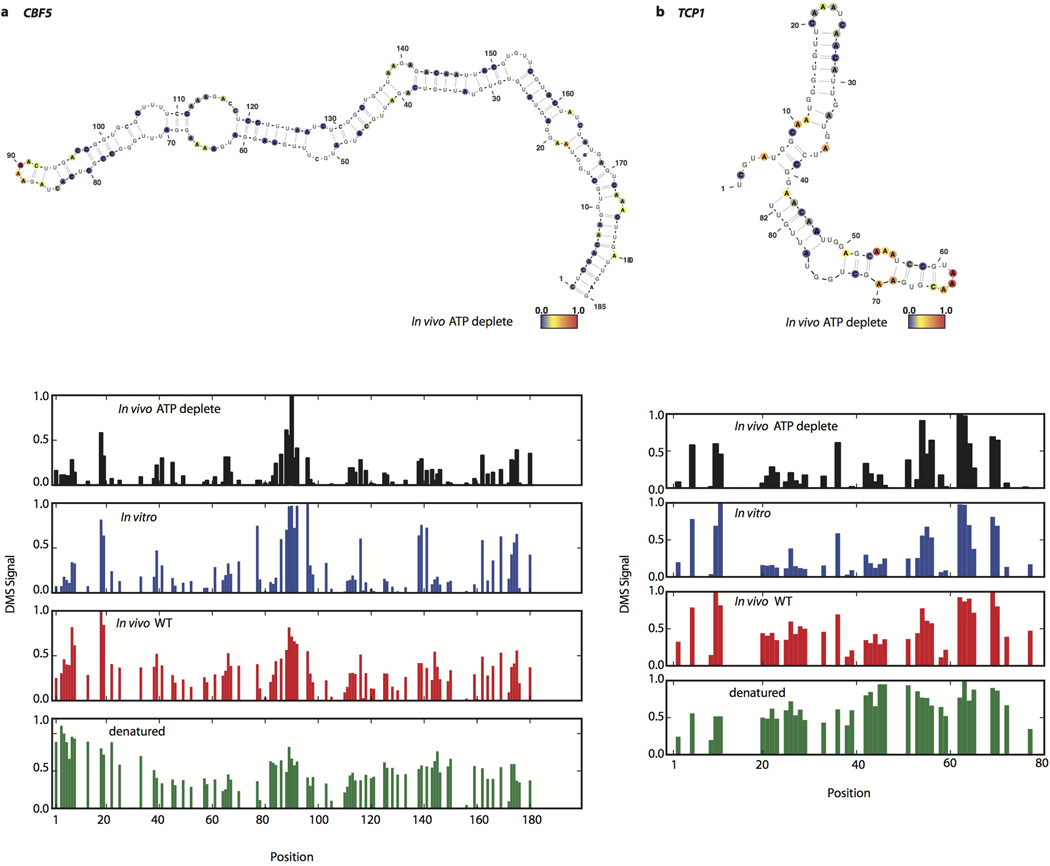
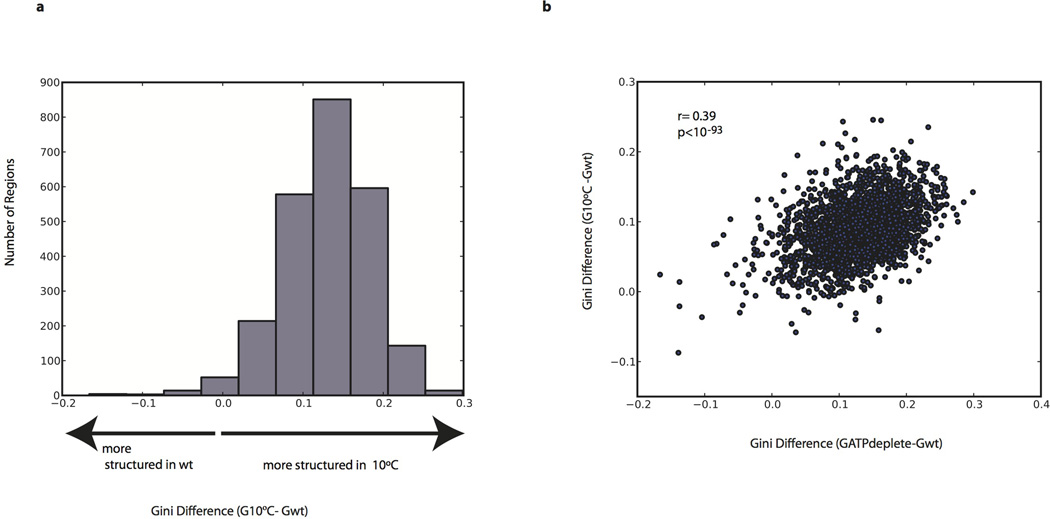
A central question is what accounts for the differences between in vivo and in vitro mRNA structure. Although translation by ribosomes plays a role in unwinding structure, this is unlikely to be the dominant force for unfolding in vivo since the average in vivo structure for coding regions was not distinguishable from 5’ and 3’UTRs (Extended Data Fig. 7b). Moreover, within coding regions, high ribosome occupancy of an mRNA as measured by ribosome profiling21 was not generally associated with lower structure (Extended Data Fig. 7c). It is likely that both active mechanisms (e.g., RNA helicases) and passive mechanisms (e.g., single stranded RNA binding proteins) counteract mRNA’s intrinsic propensity to form the stable structures22 seen with in vitro studies3,23 and computational approaches18. To investigate how energy-dependent processes contribute to unfolding mRNA in vivo, we performed DMS-seq on yeast depleted of ATP24. We observed a dramatic increase in mRNA structure in vivo following ATP depletion (Fig. 4c). Moreover, the structural changes seen upon ATP depletion are strongly correlated (r = 0.54, p < 10−307) to the changes between in vivo and in vitro samples (Fig. 4d–e, and Extended Data Fig. 8). We also observed a large increase in mRNA structure at 10°C in vivo (Extended Data Fig. 9a), but these changes are not as strongly correlated with those seen upon ATP depletion (Extended Data Fig. 9b). Thus the mRNA structures present in a cell are impacted by a range of factors, underscoring the value of DMS-seq in defining the RNA structures present in a specific physiological condition or perturbation.
Extended Data Figure 8. In vivo structures forming in ATP depleted conditions.
Raw DMS counts were normalized to the most reactive nucleotide in a given region. The DMS signal is color coded proportional to intensity and plotted onto the mfold predicted secondary structure model of (a) CBF5, nucleotide 1 corresponds to chrXII position 506,479 (b) TCP1, nucleotide 1 corresponds to chrIV position 887,991.
Extended Data Figure 9. Analysis of mRNA structure at 10°C.
a, Histogram of gini index difference (calculated over 100A or Cs) between 10°C and wt (30°C) samples. b, Scatter plot of the gini index differences in ATP depleted or 10°C yeast relative to wt yeast calculated over 50 As or Cs.
In summary, DMS-seq provides the first comprehensive exploration of RNA structure in a cellular environment and reveals that in rapidly dividing cells, mRNAs in vivo are far less structured than in vitro. This scarcity of structure is well suited for the primary role of mRNA as an informational molecule providing a uniform substrate for translating ribosomes. Nonetheless, we identify hundreds of specific mRNA regions that are highly structured in vivo, and we show for three examples that these structures impact protein expression. Our studies provide an excellent set of candidate regions, among the truly enormous number of structured regions seen in vitro, for exploring the regulatory role of structured mRNAs. The DMS-seq approach is readily extendable to other organisms, including human-derived samples as we show here, and to the analysis of the wide range of functional RNA molecules present in a cell. Thus DMS-seq broadly enables the analysis of structure-function relationships for both informational and functional RNAs. Among the many potential applications, attractive candidates include the analysis of long noncoding RNAs25,26, the relationship between mRNA structure and microRNA/RNAi targeting27, and functional identification and analysis of ribozymes28, riboswitches29, and thermal sensors30.
METHODS
Media and Growth Conditions
Yeast strain BY4741 was grown in YPD at 30°C. Saturated cultures were diluted to OD600 of roughly 0.09 and grown to a final OD600 of 0.7 to 0.8 in YPD at the time of DMS treatment or mRNA harvesting. For ATP depletion experiments, cells were incubated for 1h in 10mM sodium azide and 10mM deoxyglucose prior to DMS treatment31. For 10°C experiments, cells were grown to exponential phase and shifted to 10°C by diluting the 30°C media with 4°C media. Mammalian cells were grown and treated with DMS in log phase (K562 cells) or at ~80% confluency for adherent cells (human foreskin fibroblast).
DMS Modification
For in vivo DMS modification, 15 ml of exponentially growing yeast at 30°C were incubated with 300–600 µl DMS for 2–4 min (which results in multiple modifications per mRNA molecule). Cells at 10°C were incubated with 400 µl DMS for 40min to achieve similar modification levels as cells grown at 30°C. DMS was quenched by adding 30 ml stop solution (30% BME, 25% Isoamyl Alcohol) after which cells were quickly put on ice, collected by centrifugation at 3000g and 4°C for 3 min, and washed with 15 ml 30% BME solution. Cell were then re-suspended in total RNA lysis buffer (10 mM EDTA, 50 mM NaOAc pH 5.5), and total RNA was purified with hot acid phenol (Ambion). PolyA(+) mRNA was obtained using magnetic poly(A)+ Dynal beads (Invitrogen). For in vitro and denatured DMS modifications, mRNA was collected in the same way as described above but from yeast that were not treated with DMS or quench solution. 4 µg of mRNA was denatured at 95°C for 2 min and either incubated in 0.2% DMS for 1 min (denatured control sample) or cooled on ice and re-folded in RNA folding buffer (10 mM Tris pH 8.0, 100 mM NaCl, 6 mM MgCl2) at 30°C for 30 min then incubated in 3–5% DMS for 2–5 min (in vitro sample). For intact ribosomes, polysomes were isolated on a sucrose gradient and treated with 4% DMS at 10° for 40 min in polysome gradient buffer (20mM Tris pH 8.0, 150mM KCl, 0.5mM DTT, 5mM MgCl2). DMS amounts/times were chosen to give a similar overall level of modification for the in vivo, in vitro and denatured sample. For in vitro probing at different temperatures, the RNA was re-folded at 45°C, 60°C, or 70°C. The DMS was quenched using 30% BME, 0.3M NaOAc, 2 µl GlycoBlue solution and precipitated with 1X volume of 100% Isopropanol. For K562 cells, 15ml of cells were treated with 300µl (in-vivo replicate 1) or 400µl (in vivo replicate 2) DMS and modified for 4 minutes. DMS was quenched by adding 30ml of 30% BME solution after which cells were quickly put on ice, collected by centrifugation at 1000g at 4°C for 3 min, and washed twice with 15 ml 30% BME solution. For fibroblast cells, 15cm32 plates with 15ml of media were treated with 300µl DMS for 4 min. The DMS was decanted and the plates were washed twice in 30% BME stop solution. Both K562 cells and fibroblasts were resuspended in Trizol Reagent and total RNA was isolated. PolyA(+) mRNA was obtained using oligotex resin (Qiagen).
Library Generation
Sequencing libraries were prepared as outlined in Fig. 1 with a modified version of the protocol used for ribosome profiling32. Specifically, DMS treated mRNA samples were denatured for 2 min at 95°C and fragmented at 95°C for 2 min in 1X RNA fragmentation buffer (Zn2+ based, Ambion). The reaction was stopped by adding 1/10 volume of 10X Stop solution (Ambion) and quickly placed on ice. The fragmented RNA was run on a 10% TBU (Tris Borate Urea) gel for 60 min. Fragments of 60–80 nucleotides in size were visualized by blue light (Invitrogen) and excised. Gel extraction was performed by crushing the purified gel piece and incubating in 300 µl DEPC treated water at 70°C for 10 min with vigorous shaking. The RNA was then precipitated by adding 33 µl NaOAc, 2 µl GlycoBlue (Invitrogen), and 900 µl 100% EtOH, incubating on dry ice for 20 min and spinning for 30 min at 4°C. The samples were then re-suspended in 7 µl 1X PNK buffer (NEB) and the 3’phospates left after random fragmentation were resolved by adding 2 µl T4 PNK (NEB), 1 µl of Superase Inhibitor (Ambion) and incubating at 37°C for 1h. The samples were then directly ligated to 1 µg of microRNA cloning linker-1, /5rApp/CTGTAGGCACCATCAAT/3ddC/ (IDT DNA) by adding 2µl T4 RNA ligase2, truncated K227Q (NEB), 1 µl 0.1M DTT, 6 µl 50%PEG, 1 µl 10X ligase2 buffer, and incubating at room temperature for 1.5 hr. Ligated products were run on a 10% TBU gel for 40 min, visualized by blue light, and separated from unligated excess linker-1 by gel extraction as described above. Reverse transcription (RT) was performed in 20 µl volume at 52°C using SuperscriptIII (Invitrogen), and truncated RT products of 25–50 nucleotides (above the size of the RT primer) were extracted by gel purification. The samples were then circularized using circ ligase (Epicenter), and Illumina sequencing adapters were introduced by 8–10 cycles of PCR.
Sequencing and sequence alignment
Raw sequences obtained from Hiseq2000 (Illumina) corresponding to the DNA sequence from the RT termination products were aligned as described33, against Saccharomyces cerevisiae assembly R62 (UCSC: sacCer2) downloaded from the Saccharomyces Genome Database on October 11, 2009 (SGD, http://www.yeastgenome.org/). Aligned reads were filtered so that no mismatches were allowed and alignments were required to be unique. Mammalian cells data was aligned to a transcript collection downloaded from RefSeq(http://www.ncbi.nlm.nih.gov/refseq/), in which each gene is represented by its longest protein-coding transcript. Aligned reads were filtered so that no more than 2 mismatches were allowed and the alignments were required to be unique. All data is deposited in Gene Expression Omnibus (series record GSE45803).
Computing the DMS signal
For the ribosomal RNA, the raw data was normalized proportionally to the most highly reactive residue after removing the outliers by 90% Winsorisation (all data above the 95th percentile is set to the 95th percentile)34. For the mRNA, the raw data was normalized proportionally to the most highly reactive base within the given structured window. Normalization of DMS data in windows of 50–200nt counteracts artifacts caused by mRNA fragmentation before polyA selection, which can lead to increased overall signal towards the 3’end of longer messages (since any 5’ end that was broken off before the polyA(+) selection would be lost after the polyA(+) selection).
Computing the agreement with ribosomal RNA
The secondary structure models for yeast ribosomal RNAs were downloaded from Comparative RNA Website and Project database (www.rna.icmb.utexas.edu/DAT/3C/Structure/index.php). The crystal structure model was downloaded from Protein Data Bank (PDB) (DOI:10.2210/pdb3u5b/pdb). The solvent accessible surface area35 was calculated in Pymol, and DMS was modeled as a sphere with 3 Å radius (representing a conservative estimate for accessibility since DMS is a flat molecule). Accessible residues were defined as residues with solvent accessibility area of greater than 2 Å2. True positive bases were defined as bases that are both unpaired in the secondary structure model and solvent accessible in the crystal structure model. True negative bases were defined as bases than are paired (A-U or C-G specifically) in the secondary structure model. The DMS data was normalized as described above. Accuracy was calculated as the number of true positive bases plus the number of true negative bases divided by all tested bases.
Secondary structure models
Secondary structure models were generated using mfold36. Color coding by DMS signal was done using VARNA (http://varna.lri.fr/)
In vivo and in vitro DMS analysis
Saccharomyces cerevisiae transcriptome coordinates were taken from Nagalakshimi et al.37. In total we collected between 140–200 million reads that uniquely aligned to the yeast genome per each sample (in vivo, in vitro, and denatured). Raw data was filtered for messages that have at least 15 reads on average per A or C position. The full yeast dataset is comprised of two biological and two technical in vivo replicates, two biological and one technical in vitro replicates, and two biological and one technical denatured replicates. For mammalian K562 dataset we collected two biological in vivo replicates (at 2%DMS and 2.7%DMS), one in vitro, and one denatured samples. For mammalian fibroblast data we collected of one in vivo, one in vitro, and one denatured samples. Sliding non-overlapping windows spanning a specified number of As and Cs starting at the 5’UTR were used to parse each message into a number of regions. Regions with matching length were taking from the 18S ribosomal RNA. A Gini Index and r value relative to that of a denatured control was calculated for each region. Highly structured regions in windows of 50 A or C nucleotides were defined with r value <0.55 and Gini Index >0.14 to encompass the in vivo regions containing validated structures and ribosomal RNA. Regions that are denatured in vivo were defined with r value >0.70 and Gini Index <0.08. Melting temperature (Tunf) was defined as the lowest temperature where the DMS signal for a given mRNA region resembles denatured and was estimated based on the temperature at which a region reached r >= 0.70 or Gini Index <= 0.11. This represents relaxed criteria for unfolding to avoid bias towards overestimating thermostablity of regions due to sample variability caused by sequencing depth of in vitro temperature samples (which have 5–10 fold less coverage than the in vivo, in vitro (30°C), and denatured samples). For metagene analyses, the DMS signal was normalized in windows of 200 A or C nucleotides (relative to the top five most reactive residues), and the in vivo data was normalized by the denatured. Translation efficiency (TE) per message was calculated as number of ribosome footprints divided by the number of mRNA fragments.
Conservation Analysis
For a list of regions as well as secondary structure models supported by DMS data and conservation analysis visit: http://weissmanlab.ucsf.edu/yeaststructures/index.html Multiple sequence alignments generated by MultiZ38 were downloaded from http://hgdownload.cse.ucsc.edu/goldenPath/sacCer2/multiz7way. Small (50 As or Cs) and large (100 As or Cs) overlapping regions with evidence for structure from the DMS probing experiment were inspected by the phylogenetic conservation analysis. The consensus secondary structure prediction was compared to normalized DMS data. The DMS values were separated in two groups for paired and unpaired bases, respectively. The median of both groups and the p-value from a one-sided Wilcoxon rank sum test is reported, testing the hypothesis that unpaired bases have higher DMS values. Both distributions are shown as box plots for each region on the website. For each region (i) a consensus secondary structure was predicted and (ii) the consensus structure was assessed for features typical of a functional RNA. The consensus secondary structure (i) was done using RNAalifold39 which extends the classical thermodynamic folding for single sequences in two ways: it averages over the sequences while evaluating the energy for a given fold and it adds “pseudoenergies” to account for consistent or inconsistent mutations. The goal is to find the structure of the minimum free energy in this extended energy model. RNAalifold readily predicts a consensus structure even if there is no selection pressure for a conserved RNA structure. RNAz40,41 was used to address the question if a predicted structure is likely to be a functional structure that is evolutionarily conserved. RNAz calculates two metrics typical for functional RNAs: (i) thermodynamic stability and (ii) evolutionary conservation. RNAz calculates a z-score indicating how much more stable a structure is compared to a random background of sequences of the same dinucleotide content. By convention, negative z-score indicates more stable structures and all reported z-scores are the average of all sequences in the alignment. RNAz calculates a metric known as structure conservation index (SCI). The SCI takes values between 0 and 1.0 means there is no structure conserved at all, 1 means the structure is perfectly conserved. The SCI is not normalized with respect to sequences conservation, so an alignment with sequences 100% conserved has by definition SCI = 1.0. RNAz evaluates z-score, SCI and sequence diversity of the alignment and provides an overall classification score that is based on a support vector machine classifier. It ranges from very negative values with little evidence for a functional RNA, over 0 which means undecided to high positive values with good evidence for a functional RNA. For convenience, this score is mapped to a probability of being a functional RNA which is reported in the results (the higher the better). A total of 189 structures with RNAz significance value > 0.5 and a correlation p-value between the predicted structure and the DMS signal of < 0.01 are displayed on the aforementioned website.
Functional UTR Cloning
A fluorescent Venus reporter driven by a Nop8 promoter (chrXV:52262–53096) and C. albicans ADH1 terminator was genomically integrated into yeast strain BY4741 at the TRP1 locus (chrIV:461320–462280). Plasmids containing kanamycin resistance and the untranslated region (UTR) of interest were made in a pUC18 plasmid backbone (Thermo Scientific). For the PMA1 5’UTR, the entire 1kb promoter region and 5’UTR (chrVII:482672–483671) was used. The pNop8 promoter was retained for the SFT2 5’UTR investigation, with only the Nop8 5’UTR replaced by the SFT2 5’UTR. All 3’UTRs were cloned to include >100bp after evidence of transcription ends (see Extended Data Fig. 5–6 and Extended Data Table 1 for sequence of PMA1, SFT2, and PRC1 structures). BY4741-Venus yeast were transformed using the standard technique of homologous recombination from a plasmid PCR product containing either a wildtype, mutant, or compensated UTR. Successfully transformed yeast were identified by check PCR and subsequently sequenced to confirm the presence of only the desired mutations.
Mutagenesis in the endogenous PMA1 locus was done via the strategy described above for the PMA1 5’UTR, except homologous recombination was targeted to the endogenous PMA1 locus and surrounding genomic region rather than to Venus. After sequencing to confirm the presence of only the desired mutations, PMA1 was C-terminally tagged with Venus via PCR product from the pFA6a-link-yEVenus-SpHIS5 plasmid42.
Flow Cytometry
A saturated yeast culture was diluted 1:200 fold in minimal media and grown at 30°C for 6–8 hr before flow cytometry using a LSRII flow cytometer (Becton Dickinson) and 530/30 filter. 10°C cultures were grown for 72 hr. Venus signal from each cell was normalized to cell size (Venus/sidescatter) using Matlab 7.8.0 (Mathworks)43, and once normalized, all events (~20,000 per experiment) were averaged for a final Venus/sidescatter value.
Acknowledgments
We thank R. Andino, M. Bassik, J. Doudna, J. Dunn, T. Faust, N. Stern-Ginossar, C. Gross, C. Guthrie, N. Ingolia, C. Jan, M. Kampmann, D. Koller, G.W. Li, S. Mortimer, E. Oh, C. Pop, and members of the Weissman lab for discussions; J. Stewart-Ornstein and O. Brandman for plasmids; C. Chu, N. Ingolia, and J. Lund for sequencing help. This research was supported by the Center for RNA Systems Biology (J.S.W.), the Howard Hughes Medical Insitute (J.S.W.), and the National Science Foundation (M. Z.).
Footnotes
Author Contributions: S.R., M.Z. and J.S.W designed the experiments. S.R. and M.Z. performed the experiments, and S.R. analyzed the data. S.W. and M.K. completed the phylogenetic analysis. S.R., M.Z., and J.S.W. drafted and revised the manuscript.
Competing Interests: The authors declare that there are no competing interests.
References
- 1.Gruber AR, Neuböck R, Hofacker IL, Washietl S. The RNAz web server: prediction of thermodynamically stable and evolutionarily conserved RNA structures. Nucleic Acids Res. 2007;35:W335–W338. doi: 10.1093/nar/gkm222. [DOI] [PMC free article] [PubMed] [Google Scholar]
- 2.Ouyang Z, Snyder MP, Chang HY. SeqFold: Genome-scale reconstruction of RNA secondary structure integrating high-throughput sequencing data. Genome Res. 2013;23:377–387. doi: 10.1101/gr.138545.112. [DOI] [PMC free article] [PubMed] [Google Scholar]
- 3.Kertesz M, et al. Genome-wide measurement of RNA secondary structure in yeast. Nature. 2010;467:103–107. doi: 10.1038/nature09322. [DOI] [PMC free article] [PubMed] [Google Scholar]
- 4.Underwood JG, et al. FragSeq: transcriptome-wide RNA structure probing using high-throughput sequencing. Nat Methods. 2010;7:995–1001. doi: 10.1038/nmeth.1529. [DOI] [PMC free article] [PubMed] [Google Scholar]
- 5.Spitale RC, et al. RNA SHAPE analysis in living cells. Nat. Chem. Biol. 2013;9:18–20. doi: 10.1038/nchembio.1131. [DOI] [PMC free article] [PubMed] [Google Scholar]
- 6.Lucks JB, et al. Multiplexed RNA structure characterization with selective 2’-hydroxyl acylation analyzed by primer extension sequencing (SHAPE-Seq) Proc. Natl. Acad. Sci. U.S.A. 2011;108:11063–11068. doi: 10.1073/pnas.1106501108. [DOI] [PMC free article] [PubMed] [Google Scholar]
- 7.Deigan KE, Li TW, Mathews DH, Weeks KM. Accurate SHAPE-directed RNA structure determination. Proc. Natl. Acad. Sci. U.S.A. 2009;106:97–102. doi: 10.1073/pnas.0806929106. [DOI] [PMC free article] [PubMed] [Google Scholar]
- 8.Wan Y, et al. Genome-wide measurement of RNA folding energies. Mol. Cell. 2012;48:169–181. doi: 10.1016/j.molcel.2012.08.008. [DOI] [PMC free article] [PubMed] [Google Scholar]
- 9.Wells SE, Hughes JM, Igel AH, Ares M., Jr Use of dimethyl sulfate to probe RNA structure in vivo. Meth. Enzymol. 2000;318:479–493. doi: 10.1016/s0076-6879(00)18071-1. [DOI] [PubMed] [Google Scholar]
- 10.Ben-Shem A, et al. The structure of the eukaryotic ribosome at 3.0 Å resolution. Science. 2011;334:1524–1529. doi: 10.1126/science.1212642. [DOI] [PubMed] [Google Scholar]
- 11.Ziehler WA, Engelke DR. Probing RNA structure with chemical reagents and enzymes. Chapter 6, Unit 6.1. Curr Protoc Nucleic Acid Chem. 2001 doi: 10.1002/0471142700.nc0601s00. [DOI] [PMC free article] [PubMed] [Google Scholar]
- 12.Zaug AJ, Cech TR. Analysis of the structure of Tetrahymena nuclear RNAs in vivo: telomerase RNA, the self-splicing rRNA intron, and U2 snRNA. RNA. 1995;1:363–374. [PMC free article] [PubMed] [Google Scholar]
- 13.Cordero P, Kladwang W, VanLang CC, Das R. Quantitative dimethyl sulfate mapping for automated RNA secondary structure inference. Biochemistry. 2012;51:7037–7039. doi: 10.1021/bi3008802. [DOI] [PMC free article] [PubMed] [Google Scholar]
- 14.Inoue T, Cech TR. Secondary structure of the circular form of the Tetrahymena rRNA intervening sequence: a technique for RNA structure analysis using chemical probes and reverse transcriptase. Proc. Natl. Acad. Sci. U.S.A. 1985;82:648–652. doi: 10.1073/pnas.82.3.648. [DOI] [PMC free article] [PubMed] [Google Scholar]
- 15.Gonzalez TN, Sidrauski C, Dörfler S, Walter P. Mechanism of non-spliceosomal mRNA splicing in the unfolded protein response pathway. EMBO J. 1999;18:3119–3132. doi: 10.1093/emboj/18.11.3119. [DOI] [PMC free article] [PubMed] [Google Scholar]
- 16.Badis G, Saveanu C, Fromont-Racine M, Jacquier A. Targeted mRNA degradation by deadenylation-independent decapping. Mol. Cell. 2004;15:5–15. doi: 10.1016/j.molcel.2004.06.028. [DOI] [PubMed] [Google Scholar]
- 17.Chartrand P, Meng XH, Singer RH, Long RM. Structural elements required for the localization of ASH1 mRNA and of a green fluorescent protein reporter particle in vivo. Curr. Biol. 1999;9:333–336. doi: 10.1016/s0960-9822(99)80144-4. [DOI] [PubMed] [Google Scholar]
- 18.Zuker M. Mfold web server for nucleic acid folding and hybridization prediction. Nucleic Acids Res. 2003;31:3406–3415. doi: 10.1093/nar/gkg595. [DOI] [PMC free article] [PubMed] [Google Scholar]
- 19.Wittebolle L, et al. Initial community evenness favours functionality under selective stress. Nature. 2009;458:623–626. doi: 10.1038/nature07840. [DOI] [PubMed] [Google Scholar]
- 20.Rüegsegger U, Leber JH, Walter P. Block of HAC1 mRNA translation by long-range base pairing is released by cytoplasmic splicing upon induction of the unfolded protein response. Cell. 2001;107:103–114. doi: 10.1016/s0092-8674(01)00505-0. [DOI] [PubMed] [Google Scholar]
- 21.Ingolia NT, Ghaemmaghami S, Newman JRS, Weissman JS. Genome-wide analysis in vivo of translation with nucleotide resolution using ribosome profiling. Science. 2009;324:218–223. doi: 10.1126/science.1168978. [DOI] [PMC free article] [PubMed] [Google Scholar]
- 22.Herschlag D. RNA chaperones and the RNA folding problem. J. Biol. Chem. 1995;270:20871–20874. doi: 10.1074/jbc.270.36.20871. [DOI] [PubMed] [Google Scholar]
- 23.Li F, et al. Global analysis of RNA secondary structure in two metazoans. Cell Rep. 2012;1:69–82. doi: 10.1016/j.celrep.2011.10.002. [DOI] [PubMed] [Google Scholar]
- 24.Stade K, et al. Exportin 1 (Crm1p) is an essential nuclear export factor. Cell. 1997;90:1041–1050. doi: 10.1016/s0092-8674(00)80370-0. [DOI] [PubMed] [Google Scholar]
- 25.Kretz M, et al. Control of somatic tissue differentiation by the long non-coding RNA TINCR. Nature. 2013;493:231–235. doi: 10.1038/nature11661. [DOI] [PMC free article] [PubMed] [Google Scholar]
- 26.Memczak S, et al. Circular RNAs are a large class of animal RNAs with regulatory potency. Nature. 2013 doi: 10.1038/nature11928. [DOI] [PubMed] [Google Scholar]
- 27.Tan X, et al. Tiling genomes of pathogenic viruses identifies potent antiviral shRNAs and reveals a role for secondary structure in shRNA efficacy. Proc. Natl. Acad. Sci. U.S.A. 2012;109:869–874. doi: 10.1073/pnas.1119873109. [DOI] [PMC free article] [PubMed] [Google Scholar]
- 28.Tang J, Breaker RR. Structural diversity of self-cleaving ribozymes. Proc Natl Acad Sci U S A. 2000;97:5784–5789. doi: 10.1073/pnas.97.11.5784. [DOI] [PMC free article] [PubMed] [Google Scholar]
- 29.Li S, Breaker RR. Eukaryotic TPP riboswitch regulation of alternative splicing involving long-distance base pairing. Nucleic Acids Res. 2013;41:3022–3031. doi: 10.1093/nar/gkt057. [DOI] [PMC free article] [PubMed] [Google Scholar]
- 30.Meyer M, Plass M, Pérez-Valle J, Eyras E, Vilardell J. Deciphering 3′ss Selection in the Yeast Genome Reveals an RNA Thermosensor that Mediates Alternative Splicing. Molecular Cell. 2011;43:1033–1039. doi: 10.1016/j.molcel.2011.07.030. [DOI] [PubMed] [Google Scholar]
- 31.Kortmann J, Sczodrok S, Rinnenthal J, Schwalbe H, Narberhaus F. Translation on demand by a simple RNA-based thermosensor. Nucleic Acids Res. 2011;39:2855–2868. doi: 10.1093/nar/gkq1252. [DOI] [PMC free article] [PubMed] [Google Scholar]
- 32.Ingolia NT, Brar GA, Rouskin S, McGeachy AM, Weissman JS. The ribosome profiling strategy for monitoring translation in vivo by deep sequencing of ribosome-protected mRNA fragments. Nat Protoc. 2012;7:1534–1550. doi: 10.1038/nprot.2012.086. [DOI] [PMC free article] [PubMed] [Google Scholar]
- 33.Ingolia NT, Ghaemmaghami S, Newman JRS, Weissman JS. Genome-wide analysis in vivo of translation with nucleotide resolution using ribosome profiling. Science. 2009;324:218–223. doi: 10.1126/science.1168978. [DOI] [PMC free article] [PubMed] [Google Scholar]
- 34.Hastings C, Mosteller F, Tukey JW, Winsor CP. Low Moments for Small Samples: A Comparative Study of Order Statistics. The Annals of Mathematical Statistics. 1947;18:413–426. [Google Scholar]
- 35.Lee B, Richards FM. The interpretation of protein structures: estimation of static accessibility. J. Mol. Biol. 1971;55:379–400. doi: 10.1016/0022-2836(71)90324-x. [DOI] [PubMed] [Google Scholar]
- 36.Zuker M. Mfold web server for nucleic acid folding and hybridization prediction. Nucleic Acids Res. 2003;31:3406–3415. doi: 10.1093/nar/gkg595. [DOI] [PMC free article] [PubMed] [Google Scholar]
- 37.Nagalakshmi U, et al. The transcriptional landscape of the yeast genome defined by RNA sequencing. Science. 2008;320:1344–1349. doi: 10.1126/science.1158441. [DOI] [PMC free article] [PubMed] [Google Scholar]
- 38.Blanchette M, et al. Aligning multiple genomic sequences with the threaded blockset aligner. Genome Res. 2004;14:708–715. doi: 10.1101/gr.1933104. [DOI] [PMC free article] [PubMed] [Google Scholar]
- 39.Bernhart SH, Hofacker IL, Will S, Gruber AR, Stadler PF. RNAalifold: improved consensus structure prediction for RNA alignments. BMC Bioinformatics. 2008;9:474. doi: 10.1186/1471-2105-9-474. [DOI] [PMC free article] [PubMed] [Google Scholar]
- 40.Washietl S, Hofacker IL, Stadler PF. Fast and reliable prediction of noncoding RNAs. Proc. Natl. Acad. Sci. U.S.A. 2005;102:2454–2459. doi: 10.1073/pnas.0409169102. [DOI] [PMC free article] [PubMed] [Google Scholar]
- 41.Gruber AR, Findeiß S, Washietl S, Hofacker IL, Stadler PF. Rnaz 2.0: improved noncoding RNA detection. Pac Symp Biocomput. 2010:69–79. [PubMed] [Google Scholar]
- 42.Sheff MA, Thorn KS. Optimized cassettes for fluorescent protein tagging in Saccharomyces cerevisiae. Yeast. 2004;21:661–670. doi: 10.1002/yea.1130. [DOI] [PubMed] [Google Scholar]
- 43.Brandman O, et al. A Ribosome-Bound Quality Control Complex Triggers Degradation of Nascent Peptides and Signals Translation Stress. Cell. 2012;151:1042–1054. doi: 10.1016/j.cell.2012.10.044. [DOI] [PMC free article] [PubMed] [Google Scholar]


