Abstract
Purpose
We differentiated calcium oxalate monohydrate and calcium oxalate dihydrate kidney stones using micro and clinical computerized tomography images.
Materials and Methods
A total of 22 calcium oxalate monohydrate and 15 calcium oxalate dihydrate human kidney stones were scanned using a commercial micro-computerized tomography scanner with a pixel size of 7 to 23 μm. Under an institutional review board approved protocol, image data on 10 calcium oxalate monohydrate and 9 calcium oxalate dihydrate stones greater than 5 mm were retrieved from a total of 80 patients who underwent clinical dual energy computerized tomography for clinical indications and had stones available for infrared spectroscopic compositional analysis. Micro and clinical computerized tomography images were processed using in-house software, which quantified stone surface morphology with curvature based calculations. A shape index was generated as a quantitative shape metric to differentiate calcium oxalate monohydrate from calcium oxalate dihydrate stones. Statistical tests were used to test the performance of the shape index.
Results
On micro-computerized tomography images the shape index of calcium oxalate monohydrate and calcium oxalate dihydrate stones significantly differed (ROC curve AUC 0.92, p <0.0001). At the optimal cutoff sensitivity was 0.93 and specificity was 0.91. On clinical computerized tomography images a significant morphological difference was also detected (p = 0.007). AUC, sensitivity and specificity were 0.90, 1 and 0.73, respectively.
Conclusions
On micro and clinical computerized tomography images a morphological difference was detectable in calcium oxalate monohydrate and calcium oxalate dihydrate stones larger than 5 mm. The shape index is a highly promising method that can distinguish calcium oxalate monohydrate and calcium oxalate dihydrate stones with reasonable accuracy.
Keywords: kidney, kidney calculi, calcium oxalate, tomography, x-ray computed, diagnosis, differential
Between 1976 and 1994 nephrolithiasis developed in 5.2% of the American population between ages 20 and 74 years.1 Nephrolithiasis is a recurrent disease with a relapse rate of about 50% in 5 to 10 years.2 Unenhanced CT is a fast, accurate method of diagnosing urolithiasis in patients with acute flank pain.3,4 It is currently the diagnostic test of choice for detecting nephrolithiasis. Recent technological advances increased the amount of potentially useful data that can be obtained from these examinations including for guiding optimal therapy. DECT provides a tool to characterize the chemical composition of kidney stones, a key factor for understanding the cause of and potential treatment strategies in individuals. Several studies show that stones can be accurately separated into UA and nonUA types using DECT with almost 100% accuracy.5–8 Qu et al improved the method by reporting that additional tin filtration before one of the x-ray tubes further separated nonUA stones into 4 subgroups.9
The accuracy of stone type discrimination using DECT is strongly influenced by the effective atomic number of stones.10 For stones with a relatively large difference in the effective atomic number, eg UA vs nonUA stones, DECT can separate stone types with high accuracy, eg 100%.9 However, current DECT technology cannot reliably distinguish stones with close effective atomic numbers, eg a difference of less than 0.5, due to the lack of a sufficient signal-to-noise ratio. For example, COM and COD calculi cannot be discriminated by DECT because they have similar chemical compositions (CaC2O4 · H2O and CaC2O4 · 2H2O) and close effective atomic numbers (13.45 and 12.99, respectively).
However, discriminating COM and COD stones has potential clinical benefits because COD stones respond more effectively to extracorporeal SWL.11, 12 In vivo differentiation of COM and COD stones may avoid ineffective, potentially harmful SWL procedures and improve preventive medical treatment in patients with stones. Furthermore, knowledge of stone composition can provide information on pathogenic factors since COD tends to form at relatively low supersaturation and high calcium-to-oxalate ratios,13 while COM is more characteristic of hyperoxaluric states (enteric and primary hyperoxaluria.14)
We differentiated COM from COD stones using morphological information gleaned from CT images. Kidney stones have unique visual morphological features that strongly correlate with chemical composition.14–16 For example, COM stones usually have smooth, mammillary or mulberry-shaped surface morphology, while the COD stone surface is usually speculated with bipyramidal crystals with blunt or sharp angles and edges.14 Furthermore, stone morphology is distinguishable on radiographic or CT images,17–19 which may better allow stone type differentiation or prediction of the SWL outcome. However, the methods used to delineate stone morphology in previous studies were qualitative, less objective, time-consuming and subject to variability between subjects and observers.
To address these limitations, we developed what is to our knowledge a novel, fully automated method to quantify stone surface morphology from 3D CT images. We applied the method to a test data set to determine its ability to differentiate COM and COD stones ex vivo and in vivo.
MATERIALS AND METHODS
Two types of image data were acquired in this study, including 1 type from micro-CT and the other from patient CT images. These data sets were processed independently using the same algorithm.
Data Acquisition
Micro-CT
A total of 22 COM and 15 COD 2 to 10 mm human kidney stones were scanned in air using a SkyScan 1172 micro-CT scanner (SkyScan, Kontich, Belgium). All COM stones included in study were 95% or greater pure. COD stones were at least 80% pure and a higher percentage of COD was relatively rare in the stone cohort. This was related in part to the tendency of COD stones to transition to COM in vivo,14,20–22 which makes it relatively difficult to identify pure COD calculi.
Stone mineral content was determined using a combination of micro-CT and Fourier-transform infrared spectroscopic analysis.22 Briefly, stones were scanned by micro-CT and appropriate regions were identified for dissection and analysis by Fourier-transform infrared spectroscopic analysis. Micro-CT clearly reveals primary COD due to its characteristic polyhedral crystal shapes. When COD and COM are together, they are also distinguishable by x-ray attenuation.22 The same procedure was used for clinical data to determine the stone mineral content.
Images were reconstructed with isotropic spatial resolution and a pixel size of 7 to 23 μm depending on stone size. Images with multiple stones or stone fractions were cropped to ensure that only 1 calculus was included in an image. The individual stone image served as the input for morphology analysis. Clinical CT images were processed similarly.
Clinical CT
Under this institutional review board approved, Health Insurance Portability and Accountability Act compliant protocol, we retrieved image data on 11 COM and 8 COD stones from a total of 80 patients who underwent clinically indicated DECT using a Somatom® Definition FLASH scanner for kidney stone composition analysis. All patients had surgically removed or passed stone material available for compositional analysis by infrared spectroscopy and micro-CT. We studied only stones larger than 5 mm that were greater than 80% pure on micro-CT and infrared spectroscopy. DECT mixed images (0.5 blending ratio of high and low energy images) were reconstructed with 1 mm image thickness, a 0.8 mm image increment and a medium smooth kernel. Zoomed reconstruction was performed with a field of view of 100 mm.
Data Processing
Surface morphology was quantified using a shape index derived from the 3D images. The shape index represents a characteristic feature of the stone exterior, eg shape and roughness, for stone type separation. Data processing and statistical analyses were done using Matlab®. The main steps were 1) stone segmentation and surface mesh generation, and 2) the shape index.
For stone segmentation and surface mesh generation the calculated threshold used to segment the stone from the background was based on the Otsu method23 (modified Matlab function graythresh). A triangular mesh of stone surface was then generated (Matlab function isosurface), which provides a mathematical representative of stone surface.
For the shape index the mean curvature of each vertex on the mesh was calculated based on a previously reported algorithm.24–26 Figure 1 shows the relationship between curvature and roughness. A histogram of the vertex curvatures was plotted. The shape index was defined as the full width at half maximum of the histogram, which was used to describe the overall surface morphology of the stone. The shape index was directly used for stone classification.
Figure 1.
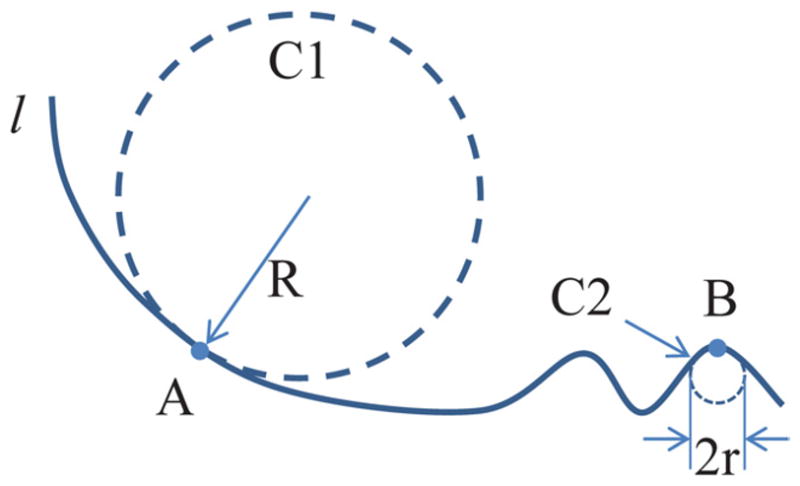
Relationship between curvature and roughness. Curvature of point (A and B) on line (l) can be defined as reciprocal of circle radius, eg radius (R) for large circle (C1) and radius (r) for small circle (C2), which is tangent to point and more tightly close to line. Smooth section of line (around A) has smaller curvature than rough section (around B). Thus, curvature is natural way to quantify roughness. It was used in our study to analyze kidney stone surface morphology.
Statistical Analysis
Statistical analysis of the micro-CT and patient data sets was done using the 2-sample t test (2 tails and unequal variance) and ROC analysis. The CI of the AUC was determined by the bootstrapping method. Statistical significance was considered at p <0.05.
RESULTS
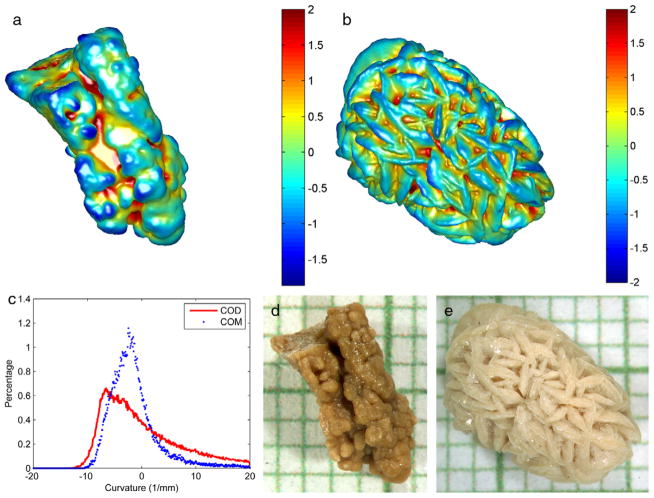
Figure 2 shows the surface characteristics of COM and COD stones on micro-CT. The morphological differences of 2 stones representative of the 2 groups were quantified by a histogram representing the curvature of the stone surface (fig. 2, a to c). In the whole group of 37 stones the shape index was significantly different between COM and COD (mean ± SD 0.26 ± 0.23, range 0.04 to 1.03 vs 0.64 ± 0.15, range 0.39 to 0.91, p <0.0001, fig. 3, a). Using the shape index determined by micro-CT to separate COD from COM stones, the AUC of the ROC curve was 0.92 (95% CI 0.74–0.99, fig. 3, b). The optimal cutoff point used to differentiate stone types was determined by the minimum cost method with equal cost weightings for false-negative and false-positive results with 0.93 sensitivity and 0.91 specificity for the differentiation.
Figure 2.
Surface renderings of COM (a) and COD (b) stones from micro-CT images. Color maps represents surface mean curvature, which represents surface roughness. Curvature values were normalized for convenient display. Note surface curvature histogram (c) and microscopic views of stones (e) and (d). Smallest background grid indicates 1 mm.
Figure 3.
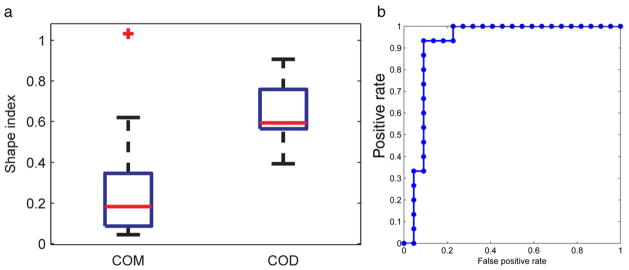
a, boxplot shows micro-CT data set shape index. Outlier (plus sign) was defined as lower than q1 − 1.5 × (q3 − q1) or higher than q3 + 1.5 × (q3 − q1), where q1 and q3 represent 25th and 75th percentiles (box edges), respectively. Red lines indicate median. Whiskers represent most extreme data points, excluding outlier. b, ROC curve of micro-CT data set differentiating COD and COM stones.
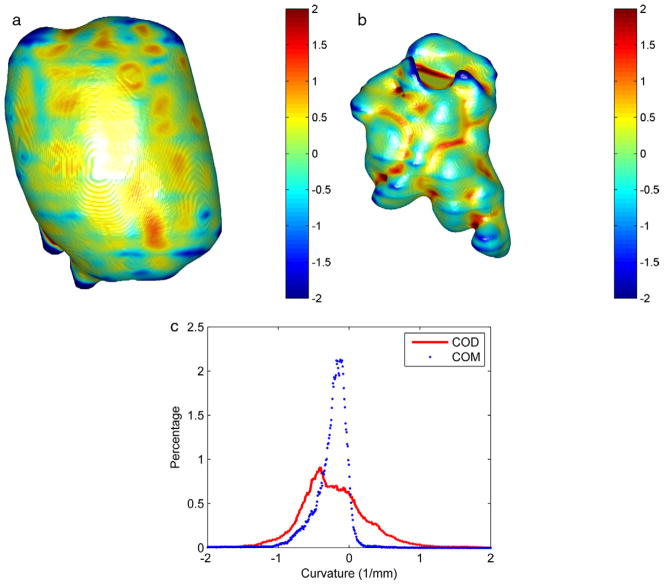
Figure 4 shows a representative patient image. Overall, the shape index of COM and COD stones significantly differed on DECT in vivo (mean 0.08 ± 0.02, range 0.05–0.12 vs 0.12 ± 0.03, range 0.08 to 0.16, p = 0.008, fig. 5, a). The ROC AUC was 0.90 (95% CI 0.66–1, fig. 5, b). Using the optimal cutoff, sensitivity and specificity were 1 and 0.73 to differentiate COM and COD, respectively.
Figure 4.
Surface renderings of COM (a) and COD (b) stones from patient images. Color maps represents surface mean curvature, which represents surface roughness. Curvature values were normalized. Note surface curvature histogram (c).
Figure 5.
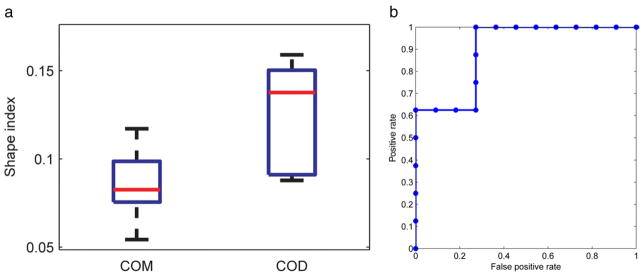
a, boxplot shows patient data set shape index. Red lines indicate median. Box edges indicate 25th and 75th percentiles. Whiskers indicate most extreme data points. b, patient data set ROC curve differentiating COD from COM stones.
DISCUSSION
We report what is to our knowledge the first attempt to determine kidney stone composition using morphological features from clinical CT images. We achieved high accuracy for distinguishing COM and COD stone types. This method requires minimal operator input and, therefore, it is efficient and objective.
SWL is a common first line, minimally invasive treatment for renal stone disease. The SWL outcome varies depending in part on stone fragility, which in turn is determined by multiple factors, including composition. Cystine and brushite calculi are often most resistant to shock waves, followed in descending order by COM, struvite, COD and UA.27 Using optical microscopy, Daudon et al systematically classified stone types based on morphological and structural appearance and found a strong relation between stone morphology and type.14 Thus, since stone morphology could potentially predict the SWL outcome, others studied the relationship between stone morphology, formation mechanisms and composition.
Grases investigated stone micromorphology using scanning electron microscopy.15,16 They proposed 2 general formation mechanisms of attached and unattached calculus development. Zarse et al used micro-CT to nondestructively characterize kidney stone morphology and chemical composition.28 These studies provide solid evidence of the importance of stone morphological information for diagnosis.
Others attempted to use morphological information from clinical imaging, eg radiography12,29 and CT,17,19,30 for better stone management. However, in these studies descriptions of stone morphological shapes were qualitative, which may suffer from interobserver variation. The shape index proposed in our study is a quantitative measure of stone morphology directly calculated from 3D CT images. Thus, it is expected to be more consistent and convenient. This method could also be useful for other stone morphological analysis.
We used micro-CT and clinical CT to validate our method at 2 spatial resolution levels. Micro-CT is a powerful tool for stone analysis because of its high spatial and contrast resolution. In our study the fine structure and morphological features of calculi were clearly visible on micro-CT images. Thus, the calculated shape index had a much larger dynamic range than the clinical CT images. However, micro-CT can only be used for ex vivo studies. Furthermore, stones sent for analysis are often only pieces formed during fragmentation of the stone before its removal. Therefore, the integrity of morphological features could be compromised and the calculated shape index may deviate from the calculation using the whole stone. For these reasons we confirmed our findings using clinical CT images.
Although currently clinical CT has much lower spatial resolution than micro-CT due to hardware limitation and radiation dose considerations, in our study they provided valuable in vivo analysis of intact stones. Indeed, clinical CT results were comparable to those of micro-CT, providing a potential opportunity to integrate quantitative morphological analysis into an imaging assessment and treatment algorithm for stone disease. However, due to the morphological difference in stone samples between the 2 data sets, it was difficult to quantitatively compare micro-CT and clinical CT results.
There are 2 limitations of this study. For clinical scans we chose stones larger than 5 mm due to the spatial resolution limits of clinical CT. Although it would be optimal to study smaller stones, calculi greater than 5 mm are less likely to pass spontaneously. Therefore, knowledge of their composition is more important for making surgical management decisions. In the future newer generation scanners may improve the ability to study smaller stones, which may allow composition information to be applied to this subset for clinical research and medical management proposes.
The other limitation is that we had a limited number of stones in our patient cohort. However, because the difference was relatively large, this preliminary data set was sufficient to show the effectiveness of our algorithm. A larger cohort of patient will be included in future studies.
CONCLUSIONS
COM and COD stones can be accurately differentiated by micro-CT based on unique morphological surface features on micro-CT images. These features can also be used to differentiate COM from COD stones greater than 5 mm in vivo with reasonable accuracy using clinical scans. COD and COM calculi can be differentiated using noninvasive, readily available CT scanners to inform the care of patients with stones, including the choice of surgical intervention.
Acknowledgments
Supported by National Institutes of Health Grants DK83007 and DK59933.
Abbreviations and Acronyms
- 3D
3-dimensional
- COD
calcium oxalate dihydrate
- COM
calcium oxalate monohydrate
- CT
computerized tomography
- DECT
dual-energy CT
- SWL
shock wave lithotripsy
- UA
uric acid
Footnotes
Study received institutional review board approval.
References
- 1.Stamatelou KK, Francis ME, Jones CA, et al. Time trends in reported prevalence of kidney stones in the United States: 1976–1994. Kidney Int. 2003;63:1817. doi: 10.1046/j.1523-1755.2003.00917.x. [DOI] [PubMed] [Google Scholar]
- 2.Moe OW. Kidney stones: pathophysiology and medical management. Lancet. 2006;367:333. doi: 10.1016/S0140-6736(06)68071-9. [DOI] [PubMed] [Google Scholar]
- 3.Smith RC, Rosenfield AT, Choe KA, et al. Acute flank pain: comparison of non-contrast-enhanced CT and intravenous urography. Radiology. 1995;194:789. doi: 10.1148/radiology.194.3.7862980. [DOI] [PubMed] [Google Scholar]
- 4.Dalrymple NC, Verga M, Anderson KR, et al. The value of unenhanced helical computerized tomography in the management of acute flank pain. J Urol. 1998;159:735. [PubMed] [Google Scholar]
- 5.Graser A, Johnson TR, Bader M, et al. Dual energy CT characterization of urinary calculi: initial in vitro and clinical experience. Invest Radiol. 2008;43:112. doi: 10.1097/RLI.0b013e318157a144. [DOI] [PubMed] [Google Scholar]
- 6.Primak AN, Fletcher JG, Vrtiska TJ, et al. Noninvasive differentiation of uric acid versus non-uric acid kidney stones using dual-energy CT. Acad Radiol. 2007;14:1441. doi: 10.1016/j.acra.2007.09.016. [DOI] [PMC free article] [PubMed] [Google Scholar]
- 7.Stolzmann P, Kozomara M, Chuck N, et al. In vivo identification of uric acid stones with dual-energy CT: diagnostic performance evaluation in patients. Abdom Imaging. 2010;35:629. doi: 10.1007/s00261-009-9569-9. [DOI] [PubMed] [Google Scholar]
- 8.Stolzmann P, Scheffel H, Rentsch K, et al. Dual-energy computed tomography for the differentiation of uric acid stones: ex vivo performance evaluation. Urol Res. 2008;36:133. doi: 10.1007/s00240-008-0140-x. [DOI] [PubMed] [Google Scholar]
- 9.Qu M, Ramirez-Giraldo JC, Leng S, et al. Dual-energy dual-source CT with additional spectral filtration can improve the differentiation of non-uric acid renal stones: an ex vivo phantom study. AJR Am J Roentgenol. 2011;196:1279. doi: 10.2214/AJR.10.5041. [DOI] [PMC free article] [PubMed] [Google Scholar]
- 10.Spiers FW. Effective atomic number and energy absorption in tissues. Br J Radiol. 1946;19:52. doi: 10.1259/0007-1285-19-218-52. [DOI] [PubMed] [Google Scholar]
- 11.Bon D, Dore B, Irani J, et al. Radiographic prognostic criteria for extracorporeal shock-wave lithotripsy: a study of 485 patients. Urology. 1996;48:556. doi: 10.1016/s0090-4295(96)00251-8. [DOI] [PubMed] [Google Scholar]
- 12.Dretler SP, Polykoff G. Calcium oxalate stone morphology: fine tuning our therapeutic distinctions. J Urol. 1996;155:828. doi: 10.1016/s0022-5347(01)66319-5. [DOI] [PubMed] [Google Scholar]
- 13.Ackermann D, Brown P, Khan SR. Preparation and application of calcium oxalate dihydrate crystal seeds. Urol Res. 1989;17:147. [PubMed] [Google Scholar]
- 14.Daudon M, Bader CA, Jungers P. Urinary calculi: review of classification methods and correlations with etiology. Scanning Microsc. 1993;7:1081. [PubMed] [Google Scholar]
- 15.Grases F, Costa-Bauza A, Garcia-Ferragut L. Biopathological crystallization: a general view about the mechanisms of renal stone formation. Adv Colloid Interface Sci. 1998;74:169. doi: 10.1016/s0001-8686(97)00041-9. [DOI] [PubMed] [Google Scholar]
- 16.Grases F, Costa-Bauza A, Ramis M, et al. Simple classification of renal calculi closely related to their micromorphology and etiology. Clin Chim Acta. 2002;322:29. doi: 10.1016/s0009-8981(02)00063-3. [DOI] [PubMed] [Google Scholar]
- 17.Kim SC, Hatt EK, Lingeman JE, et al. Cystine: helical computerized tomography characterization of rough and smooth calculi in vitro. J Urol. 2005;174:1468. doi: 10.1097/01.ju.0000173636.19741.24. [DOI] [PubMed] [Google Scholar]
- 18.Wang SC, Hsu YS, Chen KK, et al. Correlation between urinary tract pure stone composition and stone morphology on plain abdominal film. J Chinese Med Ass. 2004;67:235. [PubMed] [Google Scholar]
- 19.Williams JC, Jr, Paterson RF, Kopecky KK, et al. High resolution detection of internal structure of renal calculi by helical computerized tomography. J Urol. 2002;167:322. [PubMed] [Google Scholar]
- 20.Tomazic BB, Nancollas GH. A study of the phase transformation of calcium oxalate trihydrate-monohydrate. Invest Urol. 1979;16:329. [PubMed] [Google Scholar]
- 21.Akbarieh M, Tawashi R. Surface phase transition of hydrated calcium oxalate crystal in the presence of normal and stone-formers’ urine. Scanning Microsc. 1990;4:387. [PubMed] [Google Scholar]
- 22.Williams JC, Jr, McAteer JA, Evan AP, et al. Micro-computed tomography for analysis of urinary calculi. Urol Res. 2010;38:477. doi: 10.1007/s00240-010-0326-x. [DOI] [PubMed] [Google Scholar]
- 23.Otsu N. A threshold selection method from gray-level histograms. IEEE Trans. 1979;9:62. [Google Scholar]
- 24.Alliez P, Cohen-Steiner D, Devillers O, et al. Sophia Antipolis Cedex. France: Institut National de Recherche en Informatique et en Automatique; 2003. Anisotropic Polygonal Remeshing. Rapport de recherche No. 4808. [Google Scholar]
- 25.Cohen-Steiner D, Morvan JM. Restricted Delaunay triangulations and normal cycle. Presented at Symposium on Computational Geometry; Sam Diego, California. June 8–10, 2003. [Google Scholar]
- 26.Dyn N, Hormann K, Kim SJ, et al. Optimizing 3D triangulations using discrete curvature analysis. In: Lyche T, Schmaker LL, editors. Mathematical Methods for Curves and Surfaces. Nashville: Vanderbilt University Press; 2001. pp. 135–146. [Google Scholar]
- 27.Dretler SP. Stone fragility—a new therapeutic distinction. J Urol. 1988;139:1124. doi: 10.1016/s0022-5347(17)42801-1. [DOI] [PubMed] [Google Scholar]
- 28.Zarse CA, McAteer JA, Sommer AJ, et al. Nondestructive analysis of urinary calculi using micro computed tomography. BMC Urol. 2004;4:15. doi: 10.1186/1471-2490-4-15. [DOI] [PMC free article] [PubMed] [Google Scholar]
- 29.Arshadi H, Dianat SS, Ganjehei L. Accuracy of radiological features for predicting extracorporeal shock wave lithotripsy success for treatment of kidney calculi. Urol J. 2009;6:88. [PubMed] [Google Scholar]
- 30.Zarse CA, Hameed TA, Jackson ME, et al. CT visible internal stone structure but not Hounsfield unit value, of calcium oxalate monohydrate (COM) calculi predicts lithotripsy fragility in vitro. Urol Res. 2007;35:201. doi: 10.1007/s00240-007-0104-6. [DOI] [PMC free article] [PubMed] [Google Scholar]


