

Abstract
The use of molecular simulation to estimate the strength of macromolecular binding free energies is becoming increasingly widespread, with goals ranging from lead optimization and enrichment in drug discovery to personalizing or stratifying treatment regimes. In order to realize the potential of such approaches to predict new results, not merely to explain previous experimental findings, it is necessary that the methods used are reliable and accurate, and that their limitations are thoroughly understood. However, the computational cost of atomistic simulation techniques such as molecular dynamics (MD) has meant that until recently little work has focused on validating and verifying the available free energy methodologies, with the consequence that many of the results published in the literature are not reproducible. Here, we present a detailed analysis of two of the most popular approximate methods for calculating binding free energies from molecular simulations, molecular mechanics Poisson–Boltzmann surface area (MMPBSA) and molecular mechanics generalized Born surface area (MMGBSA), applied to the nine FDA-approved HIV-1 protease inhibitors. Our results show that the values obtained from replica simulations of the same protease–drug complex, differing only in initially assigned atom velocities, can vary by as much as 10 kcal mol–1, which is greater than the difference between the best and worst binding inhibitors under investigation. Despite this, analysis of ensembles of simulations producing 50 trajectories of 4 ns duration leads to well converged free energy estimates. For seven inhibitors, we find that with correctly converged normal mode estimates of the configurational entropy, we can correctly distinguish inhibitors in agreement with experimental data for both the MMPBSA and MMGBSA methods and thus have the ability to rank the efficacy of binding of this selection of drugs to the protease (no account is made for free energy penalties associated with protein distortion leading to the over estimation of the binding strength of the two largest inhibitors ritonavir and atazanavir). We obtain improved rankings and estimates of the relative binding strengths of the drugs by using a novel combination of MMPBSA/MMGBSA with normal mode entropy estimates and the free energy of association calculated directly from simulation trajectories. Our work provides a thorough assessment of what is required to produce converged and hence reliable free energies for protein–ligand binding.
1. Introduction
In the past two decades, both computationally assisted rational drug design and personalized medicine have been held out as potential new paradigms which would produce novel therapies at a time when the approval of new drugs is in seemingly irreversible decline.1,2 One of the key components of these approaches is the need for predictive modeling of protein function and binding selectivity. Consequently, delivering on the promises made for each requires that the tools used in basic research are fully validated and their range of applicability both understood and acknowledged.
From a physical perspective, the quantity which governs biomolecular association, determining whether proteins bind to one another or ligands (where the latter may be natural or pharmaceutical in origin), is the binding affinity. Consequently, the calculation of binding free energies (also known as “binding affinities”) is one of the most important areas of biomolecular simulation. One of the most widely applied simulation techniques in this field is molecular dynamics (MD),3,4 in which the motions of the atoms that make up proteins are computed using a simplified model based on Newtonian mechanics. Theoretically, the accuracy of the estimates of any thermodynamic quantity from MD is limited by two factors: that of the force fields used to describe the interatomic interactions and the inability to sample sufficiently the ensemble of microstates available to the system.
A variety of approaches are available for calculating binding affinities from MD simulations ranging from the theoretically rigorous, such as thermodynamic integration (TI)5 or free energy perturbation (FEP),6 to the largely empirical, such as the linear interaction energy (LIE)7 method (excellent reviews of this subject are available by Gilson and Zhou8 as well as Steinbrecher and Labahn9). The computational requirements of these methods tend to increase considerably as more physical detail is included in the models used. In both drug discovery, where large numbers of candidates must be assessed, and clinical applications, where diagnoses must typically be given in days or at most weeks, rapid turnaround of calculations is vital, and calculations that take a week or more to complete are unlikely to ever be adopted beyond basic research environments.2 More fundamentally, it is not the notional accuracy of the different methods but the reproducibility of the results obtained which needs to be verified and validated before any method can be seen as a reliable tool for future applications.
The molecular mechanics Poisson–Boltzmann surface area (MMPBSA)10,11 and molecular mechanics generalized Born surface area (MMGBSA)12 methods of estimating binding free energies have become some of the most widely applied due to their claims to provide a compromise between accuracy and speed. Both of these methods, however, neglect to account for changes in configurational entropy upon binding. Consequently, they are frequently combined with estimates of this contribution made using normal-mode analysis of harmonic frequencies from minimized snapshots from the MD trajectory. While the convergence and applicability of MMPBSA and MMGBSA have been widely studied13,14 the computational cost of normal-mode analysis has meant that only recently has its performance begun to be similarly investigated.15 Here, we present an extensive analysis of the convergence properties and ability to reproduce experimental values of the methods applied to HIV-1 protease binding to the nine FDA-approved inhibitors. These results build on our previous work that used these techniques to evaluate differences in binding strength of different protein sequences to individual drugs in both the HIV protease16,17 and the anticancer therapy target epidermal growth factor receptor (EGFR).18 In the latter case, the prediction made for the L858R mutant was thought to disagree with experimental results,19 but more recent data have confirmed the validity of the computational estimates.20
Ensembles of multiple short simulations were run for each protein–ligand combination, as previous studies have suggested that a multiple/ensemble MD approach can sample phase space more efficiently than fewer long time simulations.16,21,22 This approach also allows us to investigate the reproducibility of the calculations on the individual simulations within an ensemble (we will refer to an individual simulation within an ensemble for each inhibitor as a replica). We also evaluate the performance of a significantly less computationally expensive method proposed by Swanson et al.23 for accounting for neglected terms in the MMPBSA/MMGBSA methods using the MD trajectories directly. As part of this investigation, we have looked at combining this contribution with MMPBSA/MMGBSA calculations alone as well as the novel combination of these two components with normal mode derived entropy estimates.
2. Methods
When two reactants combine at constant temperature and pressure, the binding affinity is characterized by the change in Gibbs free energy given by
| 1 |
at temperature T and is composed of the change in enthalpy (ΔH) and the change in entropy (ΔS). In this study, we aim to assess the ability of several different end-point free energy calculation methodologies to estimate ΔG using protein–ligand conformations generated via molecular dynamics simulations. The methods under investigation are MMPBSA10,11 and MMGBSA,12 including and excluding terms aiming to explicitly incorporate solute entropic contributions to the binding energy. All of these methods run as post-processing steps on snapshots taken from the MD trajectories, with averages computed over all snapshots.
Even when incorporating terms describing solute entropic contributions, these methods possess several apparent limitations for computing absolute binding free energies. They do not implicitly account for free energy differences that arise from possible changes in key protonation states or explicit water-mediated binding between a protein and ligand which may provide significant contributions to the binding free energy.24 Despite these limitations and scepticism about the validity of the methods in some quarters,25 our previous work indicates that changes in binding energy of less than 1 kcal mol–1 between HIV-1 protease mutants can be distinguished.16,26
2.1. Free Energy Calculation Protocols
Both MMPBSA and MMGBSA are end-point free-energy calculations. In such methods, the free energy of binding, ΔG, is calculated using
| 2 |
where ⟨Gcomplex⟩, ⟨Genzyme⟩, and ⟨Gligand⟩ are the average values of the Gibbs free energy for the complex, enzyme, and ligand, respectively. Separate simulation of the complex and its two components can be used, but due to difficulties in obtaining converged free energies, it is more common to extract configurations of the free enzyme and ligand from simulation of the complex. Much of the improved convergence behavior of the single trajectory approach is due to the fact that the noisy term describing the internal energy of the system components is canceled between ligand, enzyme, and complex.13 This is the strategy we have employed in the present study. Normal mode solute entropy calculations use the same configurations and also a calculation similar to eq 2 to calculate the overall entropic penalty from values computed for the complex, enzyme, and ligand. The free energy of association, however, deals exclusively with the degrees of freedom available to the bound ligand and is computed from collections of snapshots. The details of all four computations are provided below.
2.1.1. MMPBSA and MMGBSA
The binding free energy change calculated by MMPBSA and MMGBSA (ΔGMMPB(GB)SA) can be broken down into a number of components:
| 3 |
where ΔGvdWMM and ΔGele are the van der Waals and electrostatic contributions to the molecular mechanics free energy difference, respectively, and ΔGpolsol and ΔGnonpol are the polar and nonpolar solvation terms, respectively. Modules of the AMBER 9 package27 were used in the evaluation of all components of the MMPBSA calculation. The SANDER module was employed to calculate both molecular mechanics terms (ΔGvdWMM and ΔGele), with no cutoff being applied to the nonbonded energies. The electrostatic free energy of solvation, ΔGpolsol, is the part of the calculation described by the Poisson–Boltzmann (PB) or generalized Born (GB) calculation. GB is an approximation to PB, and in both methods internal and external dielectric constants of 1 and 80, respectively, were used. In the PB case, a thousand iterations of the linear Poisson–Boltzmann equation were performed on a cubic lattice grid with a spacing of 0.5 Å using the DelPhi28 program. The GB calculations were calculated using the model proposed by Onufriev al.12 The nonpolar solvation energy, ΔGnonpol, was calculated from the solvent accessible surface area (SASA) using the MSMS program29 with a 1.4 Å radius probe based on the equation:
| 4 |
where A is the solvent accessible surface area difference, γ is the surface tension, and β is the offset. The constants γ and β were set to the standard values of 0.0052 kcal mol–1 Å–2 and 0.92 kcal mol–1, respectively, in our MMPBSA simulations and 0.0072 kcal mol–1 Å–2 and 0 kcal mol–1 in MMGBSA.10−12
2.1.2. Normal Mode Analysis
The nonpolar solvation term of the MM(GB)PBSA calculation incorporates an implicit estimate of the entropic changes associated with the insertion of a solute into the solvent. However, no account is made for the entropic impact of changes in the configurational freedom of the enzyme and ligand upon complex formation in vacuo. In general, protein–ligand binding events cause restrictions to the number of conformations available to both and consequently a reduction in entropy; this contribution is known as the configurational (or conformational) entropy. For some systems, it has been observed that agreement with experimental binding affinity values can be improved by incorporating a normal mode estimation of the entropic component of the binding free energy alongside MMPB(GB)SA.16,30 Including this contribution, the final binding affinity estimate ΔGtheor is given by
| 5 |
where ΔGMMPB(GB)SA is the MMPBSA or MMGBSA binding affinity estimate, T is the thermodynamic temperature, and −TΔSNM is the normal mode estimate of the configurational entropy penalty of the binding reaction.
As implemented within the AMBER 9 package27 employed in this study, ΔSNM is the combination of three components:
| 6 |
where ΔStra, ΔSrot, and ΔSvib are the contributions related to changes in translational, rotational, and vibrational freedoms, respectively.
2.1.3. Free Energy of Association
Swanson et al.23 proposed a method for improving the validity of MMPBSA binding energy calculations which they called the free energy of association (which we will denote using ΔGAssoc); this is simply added to the MMPB(GB)SA value:
| 7 |
ΔGAssoc is conceptually linked to the freedom of motion which is left to the ligand upon binding and provides a previously lacking link between the estimated binding affinity and the standard concentration. Swanson et al.23 assumed that other contributions to the conformational entropy change upon binding were negligible. They also note that the validity and accuracy of normal mode calculations of configurational entropy remain questionable. However, ΔGAssoc may be conceived of as an alternative approach to compute the ΔStra and ΔSrot contributions to the free energy. In this work, we have investigated not only ΔGPB(GB)–Assoc but also a calculation of the binding free energy incorporating ΔGAssoc and ΔSvib:
| 8 |
ΔGAssoc is computed from
| 9 |
where Co is the standard state concentration, usually taken to be 1 M (1 molecule/1660 Å3), zligtrans and zlig are the ligand translational and rotational configuration integrals, respectively.
zligtrans was calculated by superimposing every snapshot onto an average structure of the protease using Cα atoms alone. This provides a static reference system along with an average ligand structure. The eigenvalues (λi) of the covariance matrix of the ligand center of mass were then computed providing variance measures along three independent axes from the relation λi = ⟨Δxi2⟩. The translational configurational integral is then given by
| 10 |
Similarly, the ligand’s rotational integral can be computed from quaternions representing the ligand’s rotational motion relative to the average structure. A small angle approximation allows the reduction of the three quaternions describing rotation about three axes into a single quaternion, three of whose components are sinusoidally related to three rotation angles. As for the translational component, the covariance matrix can be evaluated to produce eigenvalues that can be used to calculate zligrot in an analogous manner to eq 10.
The structural superposition of each snapshot onto the average structure was performed using scripts based on the alignment code found in MDAnalysis.31−33 The use of this method is attractive as it is based on the configurations taken directly from the simulations and is computationally inexpensive. This method assumes that the simulation explores a single minimum, whereas we expect that replicas will explore different minima. Consequently, here we evaluate ΔGAssoc for each replica individually.
2.2. Model Preparation and Simulation Protocol
Preparation and simulation setup were performed using the automated Binding Affinity Calculator (BAC); full details of this tool and the simulation parameters employed are available in Sadiq et al.34 Models of the subtype B HXB2 wildtype sequence of HIV-1 were constructed using the coordinates from PDB crystal structures listed in Table 1. All systems were solvated in orthorhombic water boxes with a minimum extension from the protein of 14 Å.
Table 1. The PDB Codes of the Crystal Structures Used to Provide Coordinates for the HIV-1 Protease Bound to Each of the Nine FDA-Approved Protease Inhibitors.
| drug name | abbreviation | PDB |
|---|---|---|
| Amprenavir | APV | 1HPV |
| Atazanavir | AZV | 2AQU |
| Darunavir | DRV | 2HSI |
| Indinavir | IDV | 1HSG |
| Lopinavir | LPV | 1MUI |
| Nelfinavir | NFV | 1OHR |
| Ritonavir | RTV | 1HXW |
| Saquinavir | SQV | 1FB7 |
| Tipranavir | TPV | 2O4P |
Protein parameters were taken from the standard AMBER force field for bioorganic systems (ff03).35 Drug parameters were produced using the general AMBER force field (GAFF)36 following the procedure detailed in Sadiq et al.34 with the exception that drug protonation states were determined using Open Babel37 (using a pH of 5, based upon the conditions used in most binding assays for the protease). Gaussian 9838 was used to perform geometric optimization of the inhibitor with 6-31G** basis functions, and the restrained electrostatic potential (RESP) procedure, also part of the AMBER package, was used to calculate the partial atomic charges. All ligands were found to be neutral except for Indinavir, which was protonated at pH 5, in agreement with the previous findings of Oehme et al.15 (structures for all nine inhibitors are shown in Figure 1). Before the production simulations reported here were run, all systems were minimized and equilibrated for 2 ns using the protocol defined by the BAC.34
Figure 1.

The chemical structures of all nine FDA-approved protease inhibitors simulated in this study.
All simulations presented here were performed in the molecular dynamics package NAMD239 in the NPT ensemble with a temperature of 300 K and a pressure of 1 bar, using a 2 fs time step. Free energy analysis was conducted on configuration snapshots generated over the course of MD simulations using the NMODE and MMPBSA modules of the AMBER 9 package.27 Snapshots were output every 10 ps to give 100 snapshots per nanosecond of simulation. Management of ensemble simulation runs and analysis was facilitated by use of the BigJob40,41 extension of the SAGA middleware,42 further details of which are provided in Supporting Information.
The HIV-1 protease consists of two peptide chains, which are usually constructed from the same sequence of amino acids (the structure of the drug bound protein is shown in Figure 2). The catalytic function of the enzyme is performed by a dyad which consists of two aspartic acid (Asp) residues, one in position 25 of each chain (we label that in the first chain D25 and that in the second D25′). It has been established by our group and others that the correct determination of the protonation state of the catalytic dyad of HIV-1 protease is of vital importance in order to obtain accurate binding affinities.16,43 Four possible protonation states are possible for the system: dianionic (D−), diprotonated (D25, D25′), Asp 25 protonated (D25), and Asp 25′ protonated (D25′). We have employed the same protocol used previously to establish the protonation state appropriate for lopinavir (LPV)16 in order to ascertain the correct protonation state for each drug. Twenty replica simulations (varying only in having different, randomized initial velocities) were performed for each system. Each simulation produced 2 ns of equilibration and 4 ns of production trajectory. In all cases except Tipranavir, where the diprotonated system was favored, the protein was found to be monoprotonated. Full results for each system are given in Table S1.
Figure 2.
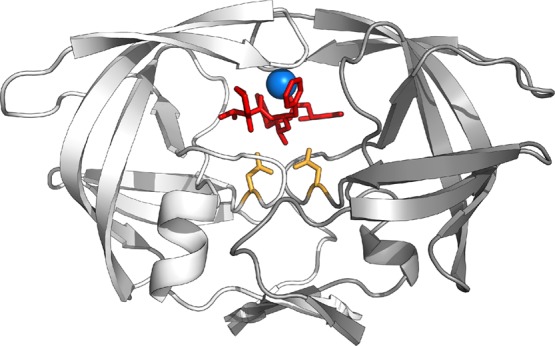
Structure of the lopinavir bound HIV-1 protease (shown in cartoon representation). The two monomers are shown in white and gray, with the inhibitor lopinavir and the catalytic dyad at position 25 of each protease monomer in chemical structure representation (in red and orange, respectively). The conserved water molecule bound between the inhibitor and protease flaps is shown in blue.
Once the correct catalytic dyad protonation state was determined for each drug, 30 more replicas were performed for all systems using the same conditions and the binding affinity averages calculated from the full 50 member ensembles used for our final comparison of drug binding affinities. This size of ensemble was shown to provide well converged ΔGMMPBSA results for protease mutants bound to the inhibitor lopinavir in our previous work.16 A second ensemble of the lopinavir system was run and analyzed in order to assess the reproducibility of the binding affinity estimates produced (the second ensemble is denoted as LPV 2).
3. Results
Our aim in the following sections is to investigate both the level of conformational sampling required to obtain converged results and, once this has been ascertained, to compare the performance of the different methods of free energy calculation in terms of how well they reproduce experimental results.
3.1. Internal Sampling, Convergence, and Reproducibility
The combination of the computational cost of the calculations and the necessity for rapid results in applications such as drug discovery and lead enrichment has led many previous studies of MMPBSA and MMGBSA performance to be limited to single simulations, often providing less than 10 ns of MD trajectory for analysis.13−15 Here, we use ensembles of 50 simulations to determine the variability of the results produced by these analyses and how they depend upon the replica length and rate at which conformational samples are taken from the MD trajectories. This strategy is enabled by the increasing availability of supercomputing resources with many thousands of cores (sometimes referred to as petascale resources) which make the execution of many large simulations feasible. In this work, we harnessed resources on both the U.S. XSEDE and E.U. PRACE networks (details of the machines used can be found in the Supporting Information).
3.1.1. Effect of Simulation Length and Sampling Rate
Our previous work indicated that ensembles of 50 replica simulations producing 4 ns of production trajectory were capable of producing well converged MMPBSA values and correctly ranking a series of protease mutants bound to lopinavir (LPV) but that longer single simulations could not.16 More recent work has suggested that single simulations of 10 ns duration can produce reliable results using MMPBSA for a selection of 14 HIV-1 protease inhibitors selected to give a wide range of affinities and to include representatives of six different scaffolds identified from the literature14 Here, we focus on using 50 replica ensembles to see if we can extend our previous analysis to cover all of the FDA approved HIV-1 protease inhibitors. In order to assess the impact of replica simulation length and sampling rate on the convergence of averages obtained by each of the free energy protocols under study, a method to quantify the error in the averages taken from a given ensemble is required. We have chosen to use the statistical technique of bootstrapping.44 This method involves resampling with replacement the N input data points (in this case, the snapshot values of ΔGMMPBSA, ΔGMMGBSA, or −TΔSNM) to provide a new bootstrap sample also containing N data points. This process is repeated many times (in our case 10 000 times) and the mean of each bootstrap population calculated. The standard deviation (σboot) of these means provides an estimate of the error associated with an average derived from a given sample.
Figure 3 shows the variation of σboot with replica length and sampling rate for ΔGMMPBSA, ΔGMMGBSA, and −TΔSNM in the case of the wildtype protease bound to lopinavir (LPV). The most surprising feature of these tracks is that after 4 ns, σboot increases for both ΔGMMPBSA and ΔGMMGBSA despite the increased level of sampling being used. This is particularly pronounced for ΔGMMPBSA and is due to the ingress of water into the active site as identified in our previous work,16,17,45 leading to higher variability in MMPBSA results. This may also explain a slight drift in binding strength observed in the nanosecond average values over time, see Figure S1. The results for ΔGMMGBSA already appear very well converged at the 4 ns point with a σboot of less than 0.21 kcal mol–1 at all of the sampling rates investigated; in the case of ΔGMMPBSA, the error is less than 0.3 kcal mol–1 at this trajectory length. We have therefore limited all of the remaining replica lengths to 4 ns. There is little benefit observable for either method when the sampling rate is increased above 20 snapshots per nanosecond. Despite this, for reasons of consistency with our previous work, we have used 100 snapshots per nanosecond for our ΔGMMPBSA and ΔGMMGBSA averages. Analysis of the convergence of the separate components of ΔGMMPBSA and ΔGMMGBSA can be found in the Supporting Information.
Figure 3.
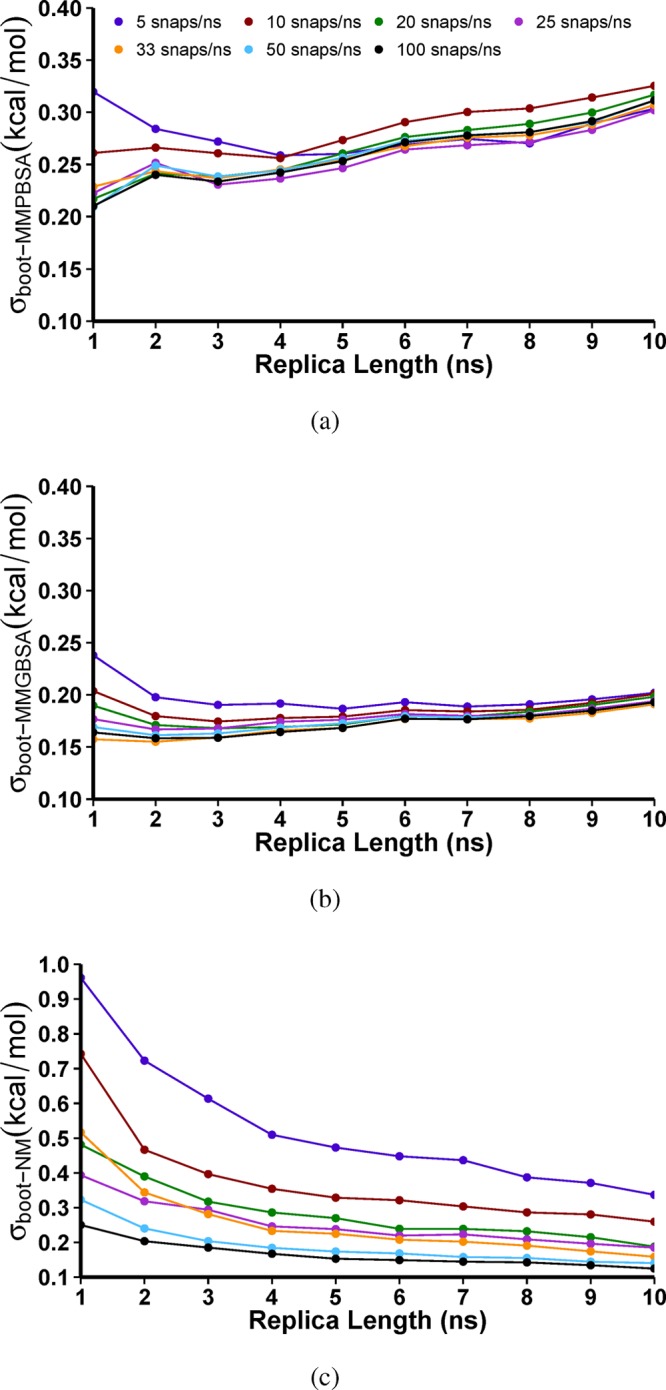
The variation of the bootstrap statistics, σboot, with replica simulation length and the sampling rate used for the averages of (a) ΔGMMPBSA, (b) ΔGMMGBSA, and (c) −TΔSNM for 50 replica ensemble simulations of wildtype HIV-1 protease bound to the inhibitor LPV.
Figure 3c shows that, unlike for ΔGMMPBSA, the error on −TΔSNM averages is significantly reduced as the sampling rate increases up to a maximum of 100 snapshots per nanosecond. Here, there is no sign of any change in the convergence behavior as the length of simulation produced by each replica is increased. In order to have comparable error levels at reasonable computational cost, we have chosen to use 25 snapshots per nanosecond for −TΔSNM calculations which provide an estimated error σboot of approximately 0.3 kcal mol–1, comparable to those obtained for ΔGMMPBSA.
3.1.2. Variance Between Replicas
Given that the vast majority of publications that apply the MMPBSA or MMGBSA methodologies report no more than one or two simulations, it is instructive to examine the variation in binding free energy values that we observe from different replica simulations. Figure 4a,c show the distribution of the averages obtained for each replica via the MMPBSA and MMGBSA methodologies, respectively. The distributions are very broad for all combinations of drug and methodology, in almost every case (excepting NFV using MMGBSA and one of the LPV replicas using MMPBSA) the range of values observed being greater than 7 kcal mol–1. Using both methodologies, the values for AZV and RTV have the largest ranges, all of which exceed 10 kcal mol–1. In addition to the width of these distributions it is clear from visual inspection that the results do not fit well to the expected Gaussian distribution, which would seem to indicate that sampling on this level is not well converged. By contrast, the ΔGMMPBSA and ΔGMMGBSA snapshot distributions, shown in Figure 4b and d, respectively, do appear to follow well-defined Gaussian distributions. We suggest that the latter observation and the fact that the distributions for the two LPV replicas lie very close together mean that the overall averages are well converged, even if this is not clear from the replica distributions.
Figure 4.

Normalized frequency distribution analysis of the binding affinities. Distributions for MMPBSA (ΔGMMPBSA) are shown in (a) per replica averages and (b) per snapshot and those for MMGBSA (ΔGMMGBSA) in (c) per replica average and (d) per snapshot for each of the nine protease inhibitors studied. In the case of the inhibitor lopinavir (LPV), two replica ensembles are shown, the first with open circles and the latter with filled triangles. Explanations of the abbreviations used for each drug are given in Table 1. The expected normal distribution given the same mean and standard deviation for each data set is shown by the blue lines (the distribution for the second LPV replica is shown in red).
A similar result is obtained for normal mode estimates of the configurational entropy, albeit with a much larger range in the snapshot values obtained. Again, the snapshot based normalized frequency distributions of the values closely resemble normal distributions with the same mean and standard deviation as shown in Figure 5b. This is a significant result as, previously, we were unable to obtain the expected Gaussian distribution of values when using a lower sampling rate of five snapshots per nanosecond for a total of 1000 snapshots per ensemble (here, we use 5000).16 The computational cost of normal-mode analysis has meant that many published studies use far fewer snapshots than this. In all cases, the distributions are very broad, the range of values is greater than 80 kcal mol–1, and the distributions encompass some snapshots with attractive (negative) contributions to the binding free energy. As for the MMPB(GB)SA results, the replica averages do not produce well-defined normal distributions. However, in line with the bootstrap analysis presented above, the replica distributions are only seen to be as broadly distributed as those for the MMPB(GB)SA results. This confirms that by using 25 snapshots per replica we are able to produce well converged estimates of the configurational entropy. Analysis of the three contributions to −TΔSNM indicates that all of the variation observed in the overall computation comes from −TΔSvib and consequently that the discussion above applies equally to this component of ΔGPBAssocNM and ΔGGBAssocNM.
Figure 5.

Normalized frequency distribution analysis of the conformational entropy contribution to the binding affinities (−TΔSNM) calculated for (a) each replica and (b) each configurational snapshot computed using normal-mode analysis for each of the nine protease inhibitors studied. In the case of the inhibitor lopinavir (LPV), two replica ensembles are shown, the first with open circles and the latter with filled triangles. Explanations of the abbreviations used for each drug are given in Table 1. The expected normal distribution given the same mean and standard deviation for each data set is shown by the blue lines (the distribution for the second LPV replica is shown in red).
It is not possible to produce consistent per snapshot distributions of ΔGtheor–PB or ΔGtheor–GB, due to the differences in sampling rate, but per replica distributions show similar deviations and have a comparable range to those of ΔGMMPBSA and ΔGMMGBSA (see Figure 6). The narrowest replica distributions for the ΔGMMPBSA and ΔGMMGBSA results (for NFV and LPV, respectively) have a standard deviation of 1.5 and 1.6 kcal mol–1, while those for ΔGtheor–PB and ΔGtheor–GB (TPV and LPV, respectively) are 2.22 and 2.48 kcal mol–1. The two largest drugs under investigation, RTV and AZV, have consistently broader distributions than the others using either MMPBSA or MMGBSA, with or without the incorporation of −TΔSNM.
Figure 6.

Normalized frequency distribution analysis of the binding affinities calculated for each replica using (a) MMPBSA and normal-mode analysis (ΔGtheor–PB) and (b) MMGBSA and normal-mode analysis (ΔGtheor–GB) for each of the nine protease inhibitors studied. In the case of the inhibitor lopinavir (LPV), two replica ensembles are shown, the first with open circles and the latter filled triangles. The narrowest replica distributions for the ΔGMMPBSA and ΔGMMGBSA results (for NFV and LPV, respectively) are 1.5 and 1.6 kcal mol–1. The expected normal distribution given the same mean and standard deviation for each data set is shown by the blue lines (the distribution for the second LPV replica is shown in red).
Unlike MMPB(GB)SA and normal modes, the binding free energy of association, ΔGAssoc, has not previously been widely applied, and little is known about the performance of this methodology. Figure 7 shows that we obtain comparatively narrow distributions of the replica averages compared to any of the other free energy components studied here, with a typical range of approximately 5 kcal mol–1. The overall averages also show a relatively small range across the different drugs of only 4.29 kcal mol–1 with six of the nine drugs having averages between 11 and 12 kcal mol–1 (further details are provided in Table S4). It does not appear from the distributions that ΔGAssoc is well converged for the ensembles used here, suggesting that for this technique more sampling is required. An alternative explanation of the poor approximation to a normal distribution is that the naive implementation of this technique applied here (assuming that each replica represents a single local energy minimum) is inappropriate and that some form of clustering might be used before the calculation is performed.
Figure 7.
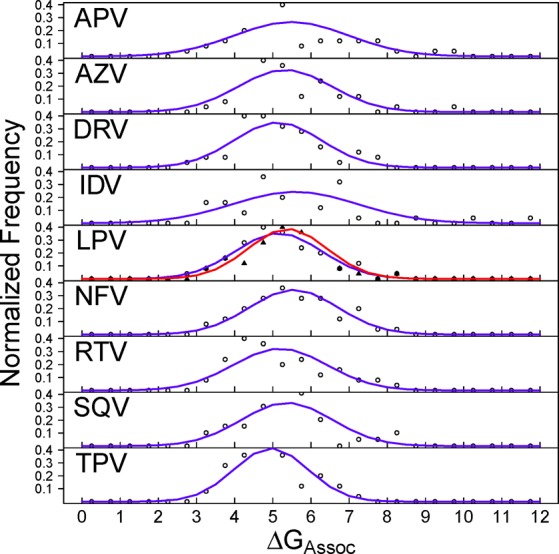
Normalized frequency distribution analysis of the free energy of association (ΔGAssoc) for each replica. The expected normal distribution given the same mean and standard deviation for each data set is shown by the blue lines (the distribution for the second LPV replica is shown in red).
Overall, the results presented here confirm the observation that individual simulation trajectories do not yield reproducible results but that ensembles of simulations can be efficiently used to generate converged free energy estimates. Thus, our findings made previously about lopinavir bound to protease sequences of different binding strengths16 also apply in the case of the ranking of different protease inhibitors. Remarkably, we observe that the distribution of replica averages of −TΔSNM is no broader than that of ΔGMMPBSA or ΔGMMGBSA. Bootstrap analysis of the number of replicas indicates that an ensemble size of 50 represents a good compromise between computational effort and the accuracy of the sampling obtained (see Figure S3).
3.2. Comparison with Experimental Data
In order to assess the efficacy of the binding affinity assessment methodologies we have employed, it is necessary to compare our results with experimental values. We searched BindingDB,46 an online database of measured binding affinities, to identify data sets which covered all nine FDA-approved protease inhibitors under comparable experimental conditions. We found data sets from two groups that fit these criteria, reported by Freire and co-workers47−49 (we will refer to this as Expt1) and by Dierynck et al.50 (we will refer to this as Expt2). Two statistical measures are often used to compare computationally derived binding estimates to those from experiments; the coefficient of determination (r2) and the Spearman rank coefficient (rs). The former describes the level of linear correlation between the two data sets, the latter whether the rank ordering of the two data sets is the same. Comparing the two experimental data sets, we obtain an r2 value of 0.47 and an rs of 0.90, suggesting that while the rank ordering of the proteins is consistent the exact differences between ligands varies considerably. Consequently, we decided to use rs as the main metric to assess the performance of the different free energy methodologies we have employed and to compare our results to both the two experimental data sets and the average of the two (we will refer to the average data set as ExptAvg).
None of the methodologies produce rs results higher than 0.63 for Expt1, Expt2, or ExptAvg (see Table 2). The methods incorporating contributions of configurational entropy (ΔGtheor–PB and ΔGtheor–GB) or the free energy of association (ΔGPB–Assoc and ΔGGB–Assoc) alone generally slightly improve on those that do not (ΔGMMPBSA and ΔGMMGBSA) but with the best results coming from incorporating both (ΔGPBAssocNM and ΔGGBAssocNM). Graphical comparisons of the computed binding affinities and corresponding experimental values can be found in the Supporting Information.
Table 2. Spearman Rank Coefficient (rs) for Each of the Studied Computational Free Energy Methodologies Compared to the Two Experimental Data Sets and Their Average, Ranking All Nine FDA Approved Drugs.
| method | Expt1 | Expt2 | ExptAvg |
|---|---|---|---|
| ΔGMMPBSA | 0.57 | 0.41 | 0.48 |
| ΔGMMGBSA | 0.46 | 0.35 | 0.39 |
| ΔGtheor–PB | 0.56 | 0.43 | 0.56 |
| ΔGtheor–GB | 0.55 | 0.43 | 0.57 |
| ΔGPB–Assoc | 0.57 | 0.41 | 0.48 |
| ΔGGB–Assoc | 0.51 | 0.38 | 0.44 |
| ΔGPBAssocNM | 0.61 | 0.53 | 0.62 |
| ΔGGBAssocNM | 0.60 | 0.55 | 0.63 |
Table 3 details the comparison between free energy estimates computed via MMPBSA (ΔGMMPBSA) and MMGBSA (ΔGMMGBSA) alone and incorporating normal mode derived configurational entropy (ΔGtheor–PB and ΔGtheor–GB). The only values to approach accuracy in terms of the absolute binding free energy are from ΔGtheor–PB. Even these values are generally more positive (less attractive) than the experimental values; this is consistent with previous observations that the binding of the conserved water molecule contributes between 3 and 4 kcal mol–1 to the strength of binding51−53 The observations regarding the two larger ligands remain relevant upon inclusion of ΔGAssoc alongside the vibrational component of the configurational entropy (see Table 4). The values of ΔGPBAssocNM and ΔGGBAssocNM do not reproduce the absolute experimental values as well as ΔGtheor–PB.
Table 3. Binding Affinity Estimates for All FDA-Approved HIV-1 Protease Inhibitors Bound to HXB2 Wildtype Proteasesa.
| drug | ΔGMMPBSA | ΔGMMGBSA | –TΔSNM | ΔGtheor–PB | ΔGtheor–GB | ΔGExpt1 | ΔGExpt2 | ΔGExptAvg |
|---|---|---|---|---|---|---|---|---|
| APV | –41.81 (0.04) | –55.54 (0.03) | 32.96 (0.24) | –8.85 (0.28) | –22.58 (0.27) | –13.2 (0.03) | –12.3 (0.12) | –12.7 (0.15) |
| AZV | –54.06 (0.05) | –66.22 (0.04) | 35.48 (0.25) | –18.59 (0.30) | –30.74 (0.29) | –14.2 (0.09) | –12.7 (0.05) | –13.4 (0.14) |
| DRV | –47.38 (0.04) | –63.39 (0.03) | 31.97 (0.24) | –15.41 (0.28) | –31.42 (0.27) | –15.0 (0.09) | –16.6 (0.20) | –15.8 (0.29) |
| IDV | –42.16 (0.03) | –61.19 (0.02) | 37.02 (0.23) | –5.14 (0.26) | –24.17 (0.25) | –12.4 (0.03) | –11.7 (0.23) | –12.1 (0.26) |
| LPV | –47.68 (0.04) | –64.40 (0.02) | 37.31 (0.23) | –10.37 (0.27) | –27.09 (0.25) | –15.1 (0.09) | –13.0 (0.06) | –14.1 (0.15) |
| LPV 2 | –48.38 (0.03) | –64.79 (0.03) | 38.13 (0.24) | –10.25 (0.27) | –26.66 (0.27) | –15.1 (0.09) | –13.0 (0.06) | –14.1 (0.15) |
| NFV | –42.75 (0.03) | –57.71 (0.02) | 33.15 (0.24) | –9.60 (0.27) | –24.56 (0.26) | –12.8 (0.05) | –11.5 (0.21) | –12.1 (0.26) |
| RTV | –58.80 (0.03) | –71.23 (0.03) | 37.68 (0.24) | –21.12 (0.27) | –33.55 (0.27) | –13.7 (0.05) | –11.8 (0.10) | –12.7 (0.15) |
| SQV | –44.17 (0.04) | –59.29 (0.03) | 36.93 (0.24) | –7.24 (0.28) | –22.36 (0.27) | –13.0 (0.04) | –12.0 (0.13) | –12.5 (0.17) |
| TPV | –43.08 (0.03) | –59.00 (0.03) | 32.15 (0.24) | –10.93 (0.27) | –26.85 (0.27) | –14.6 (0.09) | –12.5 (0.22) | –13.5 (0.31) |
Values are shown for MMPBSA (ΔGMMPBSA), MMGBSA (ΔGMMGBSA), normal mode derived configurational entropy (−TΔSNM), and combined methods (ΔGtheor–PB and ΔGtheor–GB). Experimental values from Ohtaka et al.,47 Ohtaka and Freire,48 Velazquez-Campoy et al.,49 and Dierynck et al.50 are also shown (denoted by Expt1, Expt2, and ExptAvg, respectively). Mean energies are in kcal mol–1. Standard errors are shown in parentheses.
Table 4. Binding Affinity Estimates for All FDA Approved HIV-1 Protease Inhibitors Bound to HXB2 Wildtype Proteasesa.
| drug | ΔGMMPBSA | ΔGMMGBSA | ΔGAssoc | –tδSVib | ΔGPBAssocNM | ΔGGBAssocNM | ΔGExpt1 | ΔGExpt2 | ΔGExptAvg |
|---|---|---|---|---|---|---|---|---|---|
| Apv | –41.81 (0.04) | –55.54 (0.03) | 11.14 (0.21) | 8.33 (0.24) | –22.34 (0.49) | –36.07 (0.48) | –13.2 (0.03) | –12.3 (0.12) | –12.7 (0.15) |
| Azv | –54.06 (0.05) | –66.22 (0.04) | 12.68 (0.17) | 9.98 (0.25) | –31.40 (0.46) | –43.56 (0.46) | –14.2 (0.09) | –12.7 (0.05) | –13.4 (0.14) |
| Drv | –47.38 (0.04) | –63.39 (0.03) | 11.18 (0.16) | 7.16 (0.24) | –29.04 (0.44) | –45.05 (0.43) | –15.0 (0.09) | –16.6 (0.20) | –15.8 (0.29) |
| Idv | –42.16 (0.03) | –61.19 (0.02) | 10.68 (0.23) | 11.75 (0.23) | –19.73 (0.50) | –38.76 (0.50) | –12.4 (0.03) | –11.7 (0.23) | –12.1 (0.26) |
| Lpv | –47.68 (0.04) | –64.40 (0.02) | 11.58 (0.16) | 12.07 (0.23) | –24.03 (0.43) | –40.75 (0.41) | –15.1 (0.09) | –13.0 (0.06) | –14.1 (0.15) |
| Lpv 2 | –48.38 (0.03) | –64.79 (0.03) | 11.15 (0.14) | 12.88 (0.24) | –24.35 (0.41) | –40.76 (0.41) | –15.1 (0.09) | –13.0 (0.06) | –14.1 (0.15) |
| Nfv | –42.75 (0.03) | –57.71 (0.02) | 14.23 (0.16) | 8.25 (0.24) | –20.27 (0.43) | –35.23 (0.42) | –12.8 (0.05) | –11.5 (0.21) | –12.1 (0.26) |
| Rtv | –58.80 (0.03) | –71.23 (0.03) | 11.9 (0.17) | 12.13 (0.24) | –34.77 (0.44) | –47.2 (0.44) | –13.7 (0.05) | –11.8 (0.10) | –12.7 (0.15) |
| Sqv | –44.17 (0.04) | –59.29 (0.03) | 9.94 (0.19) | 11.53 (0.24) | –22.7 (0.47) | –37.82 (0.46) | –13.0 (0.04) | –12.0 (0.13) | –12.5 (0.17) |
| Tpv | –43.08 (0.03) | –59.00 (0.03) | 11.86 (0.13) | 6.97 (0.24) | –24.25 (0.41) | –40.17 (0.39) | –14.6 (0.09) | –12.5 (0.22) | –13.5 (0.31) |
Values are shown for MMPBSA (ΔGMMPBSA), MMGBSA (ΔGMMGBSA), the free energy of association (ΔGAssoc), the vibrational component of the normal mode derived configurational entropy (−TΔSvib), and combined methods (ΔGPBAssocNM and ΔGGBAssocNM). Experimental values from Ohtaka et al.,47 Ohtaka and Freire,48 Velazquez-Campoy et al.,49 and Dierynck et al.50 are also shown (denoted by Expt1, Expt2, and ExptAvg, respectively). Mean energies are in kcal mol–1. Standard errors are shown in parentheses.
The binding affinity estimates for two drugs, those for RTV and AZV, stand out as being much too attractive. It was noted above that these two ligands exhibited the least well behaved replica distributions for all of the free energy calculation components and that they are the largest drugs in the data set. It is likely that these drugs distort the protein geometry more than is the case for smaller drugs and that there should be an energetic penalty associated with this.54 The calculations presented a single trajectory approach, and consequently no account is taken of these potential contributions to the binding affinity (sometimes referred to as “strain”24). Specifically, these larger drugs have more interactions outside the active site (in the sites usually referred to as P3 and P3′ either side of the binding cavity) than are found in other ligands.54 This region of the protease is made up of residues R8 and P81 of one monomer and G27, A28, D29, D30, G48, and G49 of the other. It is possible that these interactions stabilize unrepresentative minima in the free energy landscape close to the original crystal structure, which may require additional sampling to escape from compared to simulations of smaller ligands. We investigated the idea that simply increasing the length of each replica might overcome any such barriers by extending 10 replicas of the RTV ensemble to 20 ns and found that in one case a conformational flip in the D29 residue allowed water access to the drug which was accompanied by a weakening of ΔGMMPBSA estimates of binding strength of approximately 10 to 15 kcal mol–1 (see Supporting Information). Our previous work has shown that when RTV is docked into protease conformations taken from LPV simulations, a significantly lower binding affinity is obtained than in simulations started from RTV crystal structures45 (although not by enough to result in a correct ranking with respect to the results obtained for other inhibitors in this study). This phenomenon was observed to be linked to the accessibility of the drug and protease active site to individual water molecules. Oehme et al.15 have also suggested that the binding strength of larger drugs is overestimated by MMPBSA and MMGBSA, although they did not note any specific interactions as the cause.
Excluding the two larger drugs, we obtain much improved rankings as shown in Table 5. Both the ΔGPBAssocNM and ΔGGBAssocNM results provide excellent agreement with both the Expt1 and Expt2 data sets as well as the average results ExptAvg. In all cases, the MMPBSA variant of the analysis method outperforms the MMGBSA alternative. Disappointingly, the inclusion of the free energy of association, ΔGAssoc, alone has no impact on the quality of the ranking using MMPBSA and makes only a slight improvement for MMGBSA.
Table 5. Spearman Rank Coefficient (rs) for Each of the Studied Computational Free Energy Methodologies Compared to the Two Experimental Data Sets and Their Average.
| method | Expt1 | Expt2 | ExptAvg |
|---|---|---|---|
| ΔGMMPBSA | 0.80 | 0.71 | 0.72 |
| ΔGMMGBSA | 0.63 | 0.63 | 0.60 |
| ΔGtheor–PB | 0.73 | 0.78 | 0.82 |
| ΔGtheor–GB | 0.67 | 0.74 | 0.76 |
| ΔGPB–Assoc | 0.80 | 0.71 | 0.72 |
| ΔGGB–Assoc | 0.68 | 0.68 | 0.65 |
| ΔGPBAssocNM | 0.84 | 0.91 | 0.93 |
| ΔGGBAssocNM | 0.75 | 0.90 | 0.87 |
Considering the more widely used analysis methodologies, the MMPBSA results, including and excluding −TΔSNM, provide good agreement with both the Expt1 and Expt2 data sets as well as the average results ExptAvg. MMGBSA without normal modes performs poorly, but the incorporation of −TΔSNM renders its performance comparable to MMPBSA without this contribution. Figure 8 indicates that, when normal modes are not included in the ranking, the relative binding strength for TPV is significantly underestimated compared to the average experimental values for both ΔGMMPBSA and ΔGMMGBSA. The inclusion of the configurational entropy corrects this and allows the tight binding drugs LPV, TPV, and DRV to be differentiated from those which are consistently seen to be weaker binders in the two experimental studies. Furthermore, for this set of ligands, when normal modes are included in the calculation, we significantly improve the coefficient of determination, r2 (see Table 6), indicating that the differentiation between drugs is more quantitatively accurate. The better performance when comparing against Expt2 and ExptAvg compared to Expt1 is largely due to the fact that our results find DRV to be notably more tightly bound than the other drugs, in line with the results of Dierynck et al.50 As in the case of rs, the results for ΔGPBAssocNM and ΔGGBAssocNM outperform the other methods, indicating that there is real value in using ΔGAssoc to evaluate the loss of translational and rotational freedom from the simulation trajectory as opposed to using the values produced by normal-mode analysis.
Figure 8.

Average experimental absolute binding free energies (ΔGExptAvg) of wildtype HIV-1 protease bound to seven inhibitors compared with theoretical predictions using (a) MMPBSA (ΔGMMPBSA), (b) MMGBSA (ΔGMMGBSA), (c) MMPBSA and normal-mode analysis (ΔGtheor–PB), (d) MMGBSA and normal-mode analysis (ΔGtheor–GB), (e) MMPBSA with free energy of association and normal-mode analysis (ΔGPBAssocNM), and (f) MMGBSA with free energy of association and normal-mode analysis (ΔGGBAssocNM). RTV and ATZ are excluded due to systematic overestimation of the binding affinity of large ligands. Error bars show the standard errors. The blue line represents a linear regression performed on each data set. Spearman rank coefficients are given in Table 5. A clear improvement in the rankings is produced upon the inclusion of entropy estimates.
Table 6. Coefficient of Determination (r2) for Each of the Studied Computational Free Energy Methodologies Compared to the Two Experimental Data Sets and Their Average.
| method | Expt1 | Expt2 | ExptAvg |
|---|---|---|---|
| ΔGMMPBSA | 0.71 | 0.39 | 0.64 |
| ΔGMMGBSA | 0.48 | 0.26 | 0.44 |
| ΔGtheor–PB | 0.58 | 0.74 | 0.77 |
| ΔGtheor–GB | 0.61 | 0.76 | 0.83 |
| ΔGPB–Assoc | 0.74 | 0.41 | 0.67 |
| ΔGGB–Assoc | 0.52 | 0.28 | 0.48 |
| ΔGPBAssocNM | 0.66 | 0.86 | 0.92 |
| ΔGGBAssocNM | 0.59 | 0.77 | 0.84 |
The recent work of Oehme et al.15 examined the ability of MMPBSA and MMGBSA to rank a selection of HIV-1 protease inhibitors (three drugs are common to their work and the present study) using duplicate simulations with similar trajectory lengths to our individual replicas. The range of experimental ΔG values they attempted to evaluate was approximately double that of the difference between DRV and IDV in our chosen test set. The focus of their work was to investigate the impact of ligand parametrization on the free energy values obtained. They found that the Hartree–Fock method employing 6-31G** basis functions, which we have used in this study (chosen because it was that used to parametrize the rest of the force field we employ), performed particularly poorly; their results produced r2 values with a magnitude of less than 0.01 for ΔGMMPBSA and ΔGtheor–PB and of 0.60 and 0.50 for ΔGMMGBSA and ΔGtheor–GB, respectively. Their results are comparable with our results when we include RTV and AZV. Even given the fact that the differences we aimed to detect were much smaller, we significantly improved on all of the performance metrics through the use of our ensemble approach. It is certainly possible that the choice of ligand parametrization may alter the characteristics of the free energy landscape in such a way that differing levels of sampling are required to correctly converge results. However, it seems unlikely that so large a difference is produced that results from such small numbers of simulations would be reproducible, given the range of values we obtain in our ensemble studies.
3.3. Bootstrapping Analysis of the Influence of Ensemble Size
As with the influence of simulation length on the mean, we have used a bootstrap analysis to investigate the influence of ensemble size on the Spearman rank coefficient (rs) using the standard deviation of this value as a bootstrap statistic (σboot–rs). In this instance, an ensemble containing the relevant number of replicas was sampled (with replacement) from the 50 replica ensemble for each drug 10 000 times and rs calculated each time. The standard deviation (σboot–rs) of the rank coefficients provides an estimate of the error associated with the rankings obtained. Figure 9 shows the influence of ensemble size on the reproducibility of the correlation with the ranking found in the ExptAvg data set for all methodologies incorporating MMPBSA. In all cases, it is clear that larger ensembles make for more reproducible rankings with lower σboot–rs values. With MMPBSA alone (ΔGMMPBSA), there are only minor changes in σboot–rs after approximately 25 replicas. A greater influence of larger ensembles is observed in the cases where normal-mode analysis entropy estimates are incorporated (both ΔGtheor–PB and ΔGPBAssocNM). In both cases, improvements in the reliability of rankings are to be expected by increasing the ensemble size up to 50 replicas. Similar results are obtained for the equivalent MMGBSA based methods and in comparisons with the values for the individual experimental data sets (graphs are provided in the Supporting Information).
Figure 9.

The variation of the bootstrap statistics, σboot–rs, with the number of replicas within an ensemble on the Spearman rank coefficient (rs) for the ranking of the seven FDA-approved inhibitors for which our methodologies are valid against the average experimental data set (ExptAvg) using (a) MMPBSA alone (ΔGMMPBSA), (b) MMPBSA and normal-mode analysis (ΔGtheor–PB), and (c) MMPBSA normal-mode analysis and the free energy of association (ΔGPBAssocNM). In all cases, the variation in the ranking is seen to reduce with the number of replicas up to 50, although the decrease slows after 20 to 25 replicas are included in the ensemble.
4. Conclusions
In the present work, we have assessed the potential of the MMPBSA and MMGBSA methodologies to produce the kind of reliable and reproducible predictions of binding affinity that could be used in drug discovery and personalized medicine applications. We have found that for seven of the nine FDA-approved HIV-1 protease inhibitors (amprenavir, darunavir, indinavir, lopinavir, nelfinavir, saquinavir, and tipranavir), these methodologies work well, reproducing experimental rankings comparably well to how different experiments correlate with one another.
The two largest ligands in our test set, atazanavir and ritonavir, are poorly handled by all of the approaches we have applied, illustrating that the MMPBSA and MMGBSA methodologies have significant limitations in the range of ligands that can be consistently compared (at least in the case of the HIV-1 protease). Compared to the well ranked ligands, these larger inhibitors have a greater level of interactions beyond the active site. Such interactions distort protein geometry and are poorly handled by the single trajectory approaches which we have employed here. It remains a significant challenge for future work to obtain converged values of the free energy that account for these differences. Our findings also suggest that the optimal sampling strategy and the applicability of the methods will depend strongly on the details of the protein target, with even what may be thought of as peripheral residues potentially having a significant impact on the computed binding affinities.
In order that free energy calculations can be further verified and validated, it is necessary that it becomes standard practice to present an analysis of the sampling and convergence properties of computations, not merely their results. The MMPBSA and MMGBSA methodologies have different convergence properties, with the latter converging much more quickly and being comparatively insensitive to the length of replica simulations in our ensembles. These observations agree with the single simulation results of Srivastava and Sastry,14 in which greater simulation length was seen to improve the ability of MMPBSA to rank ligands but not MMGBSA. However, we observe that there is greater variability in MMPBSA results as they are extended, which suggests that some of the benefits of trajectory elongation observed in that study may have been fortuitous. Furthermore, our work demonstrates that, with sufficient sampling, configurational entropies calculated using normal-mode analysis do exhibit normal distributions, contrary to our previous observations.16 Obtaining normal distributions required us to sample 25 conformations per nanosecond of trajectory. Surprisingly, we observe the distribution of average replica free energy contributions from normal modes to be less broad than that for either MMPBSA or MMGBSA.
Within the range of ligands that can be consistently treated, we found that the novel combination of MMPBSA with the vibrational component of normal mode configurational entropy and the free energy of association (as suggested by Swanson et al.23) provides the best statistical reproduction of experimental results. This methodology captures both the ranking of the drugs (as measured by Spearman rank coefficient, rs, with a value of 0.93) and the differentiation between drugs (coefficient of determination, r2, value of 0.92) found in the average results of two experimental data sets. The ranking using MMGBSA alongside these two additional contributions is also superior to other combinations we have evaluated. The inclusion of the computationally inexpensive, but rarely used, free energy of association methodology enhances the ranking obtained considerably, and our results suggest that its calculation should become part of best practice for performing MMPBSA/MMGBSA based calculation in the future.
Good, if notably less accurate, agreement with experimental results was obtained from MMPBSA alone and from both MMPBSA and MMGBSA with normal mode entropy contributions. When the free energy of association is not included in the calculation, the difference produced by including configurational entropy is relatively small. However, the extra computational effort can still be justified by the improvement in coefficient of determination when compared to the average of the two experimental data sets, which suggests that it better reproduces the magnitude of binding affinity difference between the ligands.
One of the most important factors in the ability to obtain the rankings we have presented is the use of ensemble simulations. The values obtained within ensembles of 50 replica simulations of the same protease–drug complex, differing only in initially assigned atom velocities, varied by as much as 10 kcal mol–1, a greater range than that between the best and worst binding FDA-approved inhibitors. The importance of the extensive level of sampling required to obtain consistently converged estimates of binding free energies (irrespective of their accordance with experimental or “real” values) is perhaps the most striking result of the present study. We have presented distributions of the results of all of the free energy computations we have conducted, and we believe that this should become common practice for all future computational binding affinity studies. The reproducibility of the rankings we have obtained is heavily dependent on ensemble size, with a minimum of 25 replicas being suggested by bootstrapping analysis necessary to provide reproducible results. We hope that future work will provide standards that better allow comparisons of different studies using a range of techniques and simulation parameters.
The aim of this study has been not only to validate the ability of MMPB(GB)SA-based free energy calculations to distinguish HIV-1 protease inhibitors but to investigate the broader suitability of the methods for rational drug design and personalized medicine applications. One of the major attractions of MMPB(GB)SA calculations is the promise of general applicability to any chemical species, whereas other techniques, such as free energy perturbation (FEP) or thermodynamic integration (TI), are practically limited to considering free energy differences between molecules that are relatively similar. In drug discovery and lead enrichment applications, the task is to provide rapid results for libraries of hundreds or thousands of candidate compounds. The computational cost of the ensemble MD simulations that we found necessary to obtain reliable MMPB(GB)SA values means that at present the use of these techniques in this field is unsuitable. It is likely that, for such applications, empirical scoring functions based on quantitative structure–activity relationship (QSAR) models will continue to be the best option (despite the obvious dangers of extrapolating beyond the data used to derive them). In personalized medicine contexts, the demands are however quite different, with results typically required only for a limited selection of drugs bound to one or a few target protein sequences. We have previously shown how MD simulations could be integrated into clinical decision support systems as part of the ViroLab project.17,55 Furthermore, the required turnaround times of days or up to a week are easily realizable. Ensemble simulations represent a very time-efficient method of performing MD calculations, as each replica can be run concurrently given sufficient computer resources. The 6 ns of trajectory for each replica can typically be produced in 15 h (assuming 2.5 h per nanosecond using 64 CPU cores based on our experience on several machines) and the free energy analysis within another 12 h. These times are only likely to reduce as new technology is introduced and algorithmic improvements are implemented.
Combining the results for different inhibitors presented here with our previous demonstration that the MMPBSA methodology with normal modes can successfully and reproducibly estimate the binding affinities of mutant proteases to a single inhibitor,16 we believe that MMPB(GB)SA techniques are capable of making significant contributions in academic research as well as basic and clinical medicine.
Acknowledgments
This work has been made possible thanks to computer resources provided by XSEDE TRAC award TG-MCB090174. In particular, simulations were performed on the Kraken machine at the National Institute for Computational Infrastructure (NICS) and Ranger at the Texas Advanced Computing Center (TACC). We thank Yaakoub El Khamra (TACC) for exceptional support on Lonestar and Ranger. The authors acknowledge the use of the UCL Legion High Performance Computing Facility (Legion@UCL), and associated support services, in the completion of this work. The work presented here made use of the EMERALD HPC facility provided by the e-Infrastructure South Centre for Innovation (EPSRC grant refs EP/K000144/1, EP/K000136/1). This work made use of HECToR, the U.K.’s national high-performance computing service, funded by the Office of Science and Technology through EPSRC’s High-End Computing Programme. Access to HECToR was provided through the 2020 Science programme (http://www.2020science.net/, EP/I017909/1). We acknowledge PRACE for awarding us access to Huygens at SARA and HLRB II at Leibniz-Rechenzentrum (LRZ). We thank the SAGA team members—Andre Merzky, Andre Luckow, and Ole Weidner—for their support and expertise. Important funding for SAGA was provided by UK EPSRC grant number GR/D0766171/1 (via OMII-UK) and HPCOPS NSF-OCI 0710874. D.W.W. and P.V.C. would also like to thank the EU FP7 CHAIN (HEALTH-2007-2.3.2-7) and FP7VPH-SHARE (FP7-ICT 269978) projects for their support.
Supporting Information Available
Details of the SAGA and BigJob middleware used to facilitate this study, alongside thermodynamic decomposition of binding affinities and structural and energetic analysis of the extended ritonavir simulations discussed in the main text, are provided. This information is available free of charge via the Internet at http://pubs.acs.org/.
The authors declare no competing financial interest.
Supplementary Material
References
- Walter F. M.; Emery J. D. Br. J. Gen. Pract. 2012, 62, 120–121. [DOI] [PMC free article] [PubMed] [Google Scholar]
- Wright D. W.; Wan S.; Shublaq N.; Zasada S. J.; Coveney P. V. Wiley Interdiscip. Rev.: Syst. Biol. Med. 2012, 4, 585–598. [DOI] [PubMed] [Google Scholar]
- Durrant J. D.; McCammon J. A. BMC Biol. 2011, 9, 71–80. [DOI] [PMC free article] [PubMed] [Google Scholar]
- Xie L.; Evangelidis T.; Xie L.; Bourne P. E. PLoS Comput. Biol. 2011, 7, e1002037. [DOI] [PMC free article] [PubMed] [Google Scholar]
- Kirkwood G. J. Chem. Phys. 1935, 3, 300–313. [Google Scholar]
- Zwanzig R. W. J. Chem. Phys. 1954, 22, 1420–1426. [Google Scholar]
- Aqvist J.; Medina C.; Samuelsson J. E. Protein Eng. 1994, 7, 385–391. [DOI] [PubMed] [Google Scholar]
- Gilson M. K.; Zhou H. Annu. Rev. Biophys. Biomol. Struct. 2007, 36, 21–42. [DOI] [PubMed] [Google Scholar]
- Steinbrecher T.; Labahn A. Curr. Med. Chem. 2010, 17, 767–785. [DOI] [PubMed] [Google Scholar]
- Massova I.; Kollman P. J. Am. Chem. Soc. 1999, 121, 8133–8143. [Google Scholar]
- Kollman P. A.; Massova I.; Reyes C.; Kuhn B.; Huo S.; Chong L.; Lee M.; Lee T.; Duan Y.; Wang W.; Donini O.; Cieplak P.; Srinivasan J.; Case D. A.; Cheatham T. E. Acc. Chem. Res. 2000, 33, 889–897. [DOI] [PubMed] [Google Scholar]
- Onufriev A.; Bashford D.; Case A. A. J. Phys. Chem. B 2000, 104, 3712–3720. [Google Scholar]
- Hou T.; Wang J.; Li Y.; Wang W. J. Chem. Inf. Model. 2011, 51, 69–82. [DOI] [PMC free article] [PubMed] [Google Scholar]
- Srivastava H. K.; Sastry G. N. J. Chem. Inf. Model. 2012, 52, 3088–3098. [DOI] [PubMed] [Google Scholar]
- Oehme D. P.; Brownlee R. T. C.; Wilson D. J. D. J. Comput. Chem. 2012, 33, 2566–2580. [DOI] [PubMed] [Google Scholar]
- Sadiq S. K.; Wright D. W.; Kenway O. A.; Coveney P. V. J. Chem. Inf. Model. 2010, 50, 890–905. [DOI] [PubMed] [Google Scholar]
- Wright D. W.; Coveney P. V. J. Chem. Inf. Model. 2011, 51, 2636–2649. [DOI] [PubMed] [Google Scholar]
- Wan S.; Coveney P. V. J. R. Soc., Interface 2011, 8, 1114–1127. [DOI] [PMC free article] [PubMed] [Google Scholar]
- Yun C.; Boggon T. J.; Li Y.; Woo M. S.; Greulich H.; Meyerson M.; Eck M. J. Cancer Cell 2007, 11, 217–227. [DOI] [PMC free article] [PubMed] [Google Scholar]
- Kim Y.; Li Z.; Apetri M.; Luo B.; Settleman J. E.; Anderson K. S. Biochemistry 2012, 51, 5212–5222. [DOI] [PMC free article] [PubMed] [Google Scholar]
- Caves L. S. D.; Evanseck J. D.; Karplus M. Protein Sci. 1998, 7, 649–666. [DOI] [PMC free article] [PubMed] [Google Scholar]
- Genheden S.; Ryde U. J. Comput. Chem. 2010, 31, 837–846. [DOI] [PubMed] [Google Scholar]
- Swanson J. M. J.; Henchman R. H.; McCammon J. A. Biophys. J. 2004, 86, 67–74. [DOI] [PMC free article] [PubMed] [Google Scholar]
- Mobley D. L.; Dill K. A. Structure 2009, 17, 489–498. [DOI] [PMC free article] [PubMed] [Google Scholar]
- Pearlman D. A. J. Med. Chem. 2005, 48, 7796–7807. [DOI] [PubMed] [Google Scholar]
- Stoica I.; Sadiq S. K.; Coveney P. V. J. Am. Chem. Soc. 2008, 130, 2639–2648. [DOI] [PubMed] [Google Scholar]
- Case D. A.; Cheatham T. E.; Darden T.; Gohlke H.; Luo R.; Merz K. M.; Onufriev A.; Simmerling C.; Wang B.; Woods R. J. J. Comput. Chem. 2005, 26, 1668–1688. [DOI] [PMC free article] [PubMed] [Google Scholar]
- Rocchia W.; Sridharan S.; Nicholls A.; Alexov E.; Chiabrera A.; Honig B. J. Comput. Chem. 2002, 23, 128–137. [DOI] [PubMed] [Google Scholar]
- Sanner M. F.; Olson A. J.; Spehner J. C. Biopolymers 1996, 38, 305–320. [DOI] [PubMed] [Google Scholar]
- Singh N.; Warshel A. Proteins 2010, 78, 1705–1723. [DOI] [PMC free article] [PubMed] [Google Scholar]
- Michaud-Agrawal N.; Denning E. J.; Woolf T. B.; Beckstein O. J. Comput. Chem. 2011, 32, 2319–2327. [DOI] [PMC free article] [PubMed] [Google Scholar]
- Liu P.; Agrafiotis D. K.; Theobald D. L. J. Comput. Chem. 2010, 31, 1561–1563. [DOI] [PMC free article] [PubMed] [Google Scholar]
- Theobald D. L. Acta Crystallogr., Sect. A: Cryst. Phys., Diffr., Theor. Gen. Crystallogr. 2005, 61, 478–480. [Google Scholar]
- Sadiq S. K.; Wright D. W.; Watson S. J.; Zasada S. J.; Stoica I.; Coveney P. J. Chem. Inf. Model. 2008, 48, 1909–1919. [DOI] [PubMed] [Google Scholar]
- Duan Y.; Wu C.; Chowdhury S.; Lee M. C.; Xiong G.; Zhang W.; Yang R.; Cieplak P.; Luo R.; Lee T.; Caldwell J.; Wang J.; Kollman P. J. Comput. Chem. 2003, 24, 1999–2012. [DOI] [PubMed] [Google Scholar]
- Wang J.; Wolf R. M.; Caldwell J. W.; Kollman P. A.; Case D. A. J. Comput. Chem. 2004, 25, 1157–1174. [DOI] [PubMed] [Google Scholar]
- O’Boyle N. M.; Banck M.; James C. A.; Morley C.; Vandermeersch T.; Hutchison G. R. J. Cheminf. 2011, 3, 33–47. [DOI] [PMC free article] [PubMed] [Google Scholar]
- Frisch M. J.; Trucks G. W.; Schlegel H. B.; Scuseria G. E.; Robb M. A.; Cheeseman J. R.; Zakrzewski V. G.; Montgomery J. A.; Stratmann R. E.; Burant J. C.; Dapprich S.; Millam J. M.; Daniels A. D.; Kudin K. N.; Strain M. C.; Farkas O.; Tomasi J.; Barone V.; Cossi M.; Cammi R.; Mennucci B.; Pomelli C.; Adamo C.; Clifford S.; Ochterski J.; Petersson G. A.; Ayala P. Y.; Cui Q.; Morokuma K.; Malick D. K.; Rabuck A. D.; Raghavachari K.; Foresman J. B.; Cioslowsk J.; Ortiz J. V.; Stefanov B. B.; Liu G.; Liashenko A.; Piskorz P.; Komaromi I.; Gomperts R.; Martin R. L.; Fox D. J.; Keith T.; Laham A. M. A.; Peng C. Y.; Nanayakkara A.; Gonzalez C.; Challacombe M.; Gill P. M. W.; Johnson B. G.; Chen W.; Wong M. W.; Andres J. L.; Gordon H. M.; Replogle E. S.; Pople J. A.. Gaussian 98; Gaussian, Inc.: Wallingford, CT, 1998. [Google Scholar]
- Phillips J. C.; Braun R.; Wang W.; Gumbart J.; Tajkhorshid E.; Villa E.; Chipot C.; Skeel R. D.; Kalé L.; Schulten K. J. Comput. Chem. 2005, 26, 1781–1802. [DOI] [PMC free article] [PubMed] [Google Scholar]
- Luckow A.; Jha S.. Abstractions for loosely-coupled and ensemble-based simulations on Azure. In IEEE International Conference on Cloud Computing Technology and Science (CloudCom), Los Alamitos, CA, 2010; IEEE: New York, 2010; pp 550–556. [Google Scholar]
- Luckow A.; Lacinski L.; Jha S.. SAGA BigJob: An Extensible and Interoperable Pilot-Job Abstraction for Distributed Applications and Systems. In The 10th IEEE/ACM International Symposium on Cluster, Cloud and Grid Computing(CCGrid), Melbourne, Victoria, Australia, 2010; IEEE: New York, 2010; pp 135–144. [Google Scholar]
- Goodale T.; Jha S.; Kaiser H.; Kielmann T.; Kleijer P.; von Laszewski G.; Lee C.; Merzky A.; Rajic H.; Shalf J. Comput. Methods Sci. Technol. 2006, 12, 7–20. [Google Scholar]
- Wittayanarakul K.; Hannongbua S.; Feig M. J. Comput. Chem. 2008, 29, 673–685. [DOI] [PubMed] [Google Scholar]
- Yu C. Pract. Assess. Res. Eval. 2003, 8. [Google Scholar]
- Hall B. A.; Wright D. W.; Jha S.; Coveney P. V. Biochemistry 2012, 51, 6487–6489. [DOI] [PubMed] [Google Scholar]
- Chen X.; Liu M.; Gilson M. K. Comb. Chem. High Throughput Screening 2001, 4, 719–725. [DOI] [PubMed] [Google Scholar]
- Ohtaka H.; Schön A.; Freire E. Biochemistry 2003, 42, 13659–13666. [DOI] [PubMed] [Google Scholar]
- Ohtaka H.; Freire E. Prog. Biophys. Mol. Biol. 2005, 88, 193–208. [DOI] [PubMed] [Google Scholar]
- Velazquez-Campoy A.; Muzammil S.; Ohtaka H.; Schön A.; Vega S.; Freire E. Curr. Drug Targets Infect. Disord. 2003, 3, 311–328. [DOI] [PubMed] [Google Scholar]
- Dierynck I.; De Wit M.; Gustin E.; Keuleers I.; Vandersmissen J.; Hallenberger S.; Hertogs K. J. Virol. 2007, 81, 13845–13851. [DOI] [PMC free article] [PubMed] [Google Scholar]
- Fornabaio M.; Spyrakis F.; Mozzarelli A.; Cozzini P.; Abraham D. J.; Kellogg G. E. J. Med. Chem. 2004, 47, 4507–4516. [DOI] [PubMed] [Google Scholar]
- Hamelberg D.; McCammon J. A. J. Am. Chem. Soc. 2004, 126, 7683–7689. [DOI] [PubMed] [Google Scholar]
- Lu Y.; Yang C.; Wang S. J. Am. Chem. Soc. 2006, 128, 11830–11839. [DOI] [PubMed] [Google Scholar]
- Ali A.; Bandaranayake R. M.; Cai Y.; King N. M.; Kolli M.; Mittal S.; Murzycki J. F.; Nalam M. N. L.; Nalivaika E. A.; Ozen A.; Prabu-Jeyabalan M. M.; Thayer K.; Schiffer C. A. Viruses 2010, 2, 2509–2535. [DOI] [PMC free article] [PubMed] [Google Scholar]
- Sloot P. M. A.; Coveney P. V.; Ertaylan G.; Müller V.; Boucher C. A.; Bubak M. Philos. Trans. R. Soc., A 2009, 367, 2691–2703. [DOI] [PubMed] [Google Scholar]
Associated Data
This section collects any data citations, data availability statements, or supplementary materials included in this article.