

Abstract
Nitrite undergoes reconversion to nitric oxide (NO) under conditions characteristic of the tumor microenvironment, such as hypoxia and low pH. This selective conversion of nitrite into NO in tumor tissue has led to the possibility of using nitrite to enhance drug delivery and radiation response. In this work we propose to serially characterize the vascular response of brain tumor bearing rats to nitrite using contrast-enhanced R2* mapping. Imaging is performed using a multi-echo gradient echo sequence at baseline, post iron-oxide nanoparticle injection, and post-nitrite injection, while the animal is breathing air. The results indicate that nitrite sufficiently increases vascular permeability in C6 gliomas such that the iron oxide nanoparticles accumulate within the tumor tissue. When animals breathed 100% oxygen, the contrast agent remained within the vasculature indicating that the conversion of nitrite to nitric oxide occurs in the presence of hypoxia within the tumor. The hypoxia-dependent, nitrite-induced extravasation of iron-oxide nanoparticles observed herein has implications for the enhancement of conventional and nanotherapeutic drug delivery.
Keywords: iron oxide nanoparticles, nitrite, drug delivery, contrast enhanced MRI
INTRODUCTION
Nitric oxide (NO) is an important cellular signaling molecule that plays an active role in many pathophysiological processes regulating blood flow via vasomodulation (1). Under normal basal conditions, NO is synthesized in the body from the amino acid L-arginine by the enzymatic action of nitric oxide synthase (NOS). However, the molecule has an extremely short half-life in the blood and undergoes a stepwise oxidation to nitrite (NO2−) and then nitrate (NO3−). Until recently, both nitrite and nitrate were considered useless by-products of the endogenous nitric oxide metabolic pathway (2). However, it is now clear that both nitrate and nitrite can be recycled physiologically to form NO in the vascular as well as tissue space, and hence work as storehouses of NO.
Conversion of nitrate to NO requires its initial reduction to nitrite. Reduction of nitrite to NO occurs via a number of enzymatic and non-enzymatic pathways including conversion through haemoglobin (3, 4), myoglobin (5, 6), xanthine oxidoreductase (7, 8), ascorbate (9), polyphenols (10, 11) and protons (12, 13). It is now also known that the generation of NO by these pathways is greatly enhanced under the conditions of hypoxia and low pH. This ensures NO production in situations for which the oxygen-dependent NOS enzyme activities are compromised (14, 15). Both these conditions of hypoxia and low pH are characteristic of tumor microenvironment and, hence, one can hypothesize that an external injection of nitrite could produce selective conversion to NO in the tumor tissue as compared to healthy tissue (16).
There are numerous studies with conflicting evidence on the impact of nitrate/nitrite on the incidence of cancer (17-20). While controversy still remains about the negative side effects of nitrite, it has been successfully used to treat conditions including stroke, myocardial infarction, and pulmonary hypertension (2). Recently, it was shown that infusion of nitrite along with radiation therapy could induce a transient change in the oxygenation status in the tumor and thereby improve the efficacy of treatment (16). The effect was attributed not to the alterations in blood flow or vascular characteristics but to the reduction of cellular oxygen consumption in the tumor. While the finding makes nitrite a potentially compelling radiosensitizer, it warrants further study in other tumor types in order to better characterize the effects, if any, of NO on tumor vessels and how these effects may be modulated by the local tumor microenvironment.
In this work, we propose to use MR imaging to characterize the vascular response of a glioma rat model to an intravenous infusion of nitrite. Tumor vascular imaging is carried out using a non-invasive contrast enhanced susceptibility-MRI technique. This MR approach relies upon the use of an exogenous blood pool contrast agent (CA) and has been previously used to assess the functional and hemodynamic status of the tumor vasculature (21). In particular, this study aims to characterize the temporal influence of nitrite on the contrast enhanced susceptibility-MR signal in tumors and whether any effects can be modulated under hyperoxic conditions.
METHODS
Animal Procedures
Due to their consistent growth patterns and neovasculature similar to spontaneous glioblastomas we chose to use the C6 tumor model in Wistar rats (22). Sixteen days prior to imaging, rats weighing 250-350 grams were stereotactically inoculated with ~105 C6 tumor cells. Rats were anesthetized using isoflurane (1.2%) and tumors cells were injected at a site of 1mm anterior and 3mm lateral (right hemisphere) to bregma at a depth of 3 mm. Intravascular catheters were placed in the jugular vein of the animals to enable the injection of the nitrite and exogenous CA.
During the imaging experiments animals were anesthetized using a mixture of air and isoflurane (1.2%) delivered via a nose cone. Body temperature was measured with a rectal thermister and was maintained at 37°C with a PID feedback-controlled heat source. Respiratory bellows were used to monitor the breathing rate. All physiologic signals were continuously collected and displayed on a computer using a commercial system (Small Animal Instruments, Inc., Stony Brook, NY) for the duration of the experiment. At the conclusion of the studies, the animals were euthanized with an overdose of anesthesia. The institutional IACUC committee approved all animal procedures.
Imaging Protocol
Imaging was carried out using a 4.7T Varian MRI system (Agilent/Varian Inc, Santa Clara, CA) with a 31 cm bore, actively shielded gradients (40 G/cm), and a 63 cm birdcage RF coil. The animal was in a prone position on a support cradle during imaging and was immobilized using a bite bar. Coronal and axial images were acquired to localize the animal within the field of view (FOV). Anatomical images were acquired using a fast-spin echo (FSE) imaging sequence. The imaging parameters were: FOV 40 × 40 mm, 5 slices, 1.5 mm ST, 128 × 128 matrix, NEX = 4, echo train length = 8, echo spacing = 4ms, TR = 3 s, effective TE = 60 ms. The images were optimized to provide adequate contrast between the tumor and the surrounding normal brain.
Susceptibility based cerebral blood volume (CBV) measurements were carried out using a multi-gradient echo sequence to extract the R2* at baseline and after the injection of an intravascular CA. The intravascular CA used in this study is a 30 nm mono-crystalline iron oxide based nanoparticle at a dose of 6 mg/kg, (®Molday-ION Biophysics Assay Laboratory, Worcester, MA). The CA is expected to stay within the vasculature for >7 hrs(21, 23). Pre-clinically, iron oxide particles are the most commonly used agent for dynamic susceptibility contrast-MRI and steady measures of blood volume(23). A similar contrast agent ferumoxytol is increasingly evaluated in patient populations owing to its long intravascular times (24, 25).
To study vascular changes after the injection of nitrite and the intravascular CA (N=8), serial imaging was carried out using the multi-gradient echo sequence to estimate the R2* before and after the intravenous bolus injection of nitrite (3mg/kg). The imaging parameters were: FOV 40 × 40 mm, 5 slices, 1.5 mm ST, 128 × 128 matrix, NEX = 10, 7 echoes spaced 5 ms apart with echo times (TE) from 3 to 28 ms, a 24° flip angle, and a TR of 200 ms. Approximately 6 baseline images were acquired before injecting nitrite and imaging continued for 1 hour thereafter. In another group of animals (N=6), the same studies were carried out without the use of the CA to see if just injecting nitrite altered the R2* in the normal tissue and the tumor. Nitrite-induced changes in R2* without CA are, in essence, akin to a BOLD experiment and would be expected to reflect changes in vascular volume and/or blood oxygenation. In a separate group of rats (N=5), a control experiment was carried out using similar imaging techniques by replacing only the nitrite injection with the same effective volume of saline after the injection of the intravascular CA. This enables the estimation of any effects that the overall blood volume increase might have on the vascular changes observed after the injection of nitrite.
In all of the studies described above the animals were made to breathe lab air to simulate the real world environment. One of the goals of this work was to identify whether the conversion of nitrite to nitric oxide was specific to the hypoxic tumor environment found in C6 tumors (26). To test this, in a separate cohort of rats (N=7), the experiment was repeated with serial imaging being carried out before and after the injection of CA prior to the injection of nitrite. However, the animal was made to inhale 100% O2 throughout the duration of the study instead of lab air. With such an approach we were able to assess whether the vascular effects observed are driven by the oxygenation status of the tumor tissue and/or the blood.
To further verify the hypoxic nature of the C6 tumors and to assess the effects of breathing 100% O2 on the hypoxic tumor status, 18F fluoromisonidazole (18F-FMISO) PET and anatomic MR images were acquired in two separate cohorts of rats – one set breathing air and one set breathing 100% O2. 18F-FMISO uptake is sensitive to tumor oxygenation levels, with increased uptake under air compared to higher oxygen gases (27, 28). Under air, 18F-FMISO uptake in hypoxic tissue increases over time (29, 30), while normal tissue exhibits decreasing or constant signal at later time points. Consequently, the late slope (e.g. between 1 and 2 hours after injection) can serve as a marker for tumor hypoxia. The PET imaging was performed on a Concorde Microsystems microPET Focus 220. Dynamic 18F-FMISO PET images were acquired for a duration of two hours (for a total of 42 frames) following bolus injection of approximately 1.25 mCi 18F-FMISO. The data were converted to percent injected dose per cc of tissue (%ID/cc), and the late slope (y=m*x+b) was calculated by linear fitting using the final hour (from 1 to 2 hrs after injection) of the time-activity curves. By comparing the late slopes in tumor tissue from animals breathing air (N=14) and animals breathing 100% O2 (N=3), we can determine whether hyperoxia reduces the hypoxic status within the C6 tumors.
Quantitative Analysis
Quantitative analysis was carried out by estimating the R2* on a voxel-by-voxel basis for the entire brain including the tumor. The difference between the baseline R2* and post-contrast R2* provides an estimate of the basal cerebral blood volume (23). Changes in the R2* following the injection of the nitrite or saline were estimated using the following equation: 100% · (R2*post-Nitrite− R2*post-CA) / R2*post-CA. Regions of interest (ROI) were drawn in the core of the tumor and on the normal appearing contralateral side of the rat brain. Results are presented as mean ± standard deviation for rats in each group at each time-point over the duration of the imaging study. Individual groups were statistically compared using a Student’s t-test.
RESULTS
Figure 1 a (top) shows a representative anatomical image of a tumor bearing rat brain imaged using the fast spin echo sequence. The arrow indicates the location of the tumor foci. The baseline CBV map, shown in Figure 1 b, shows a small region in the center of the tumor (arrow) with very low blood volume indicative of a necrotic core. The peripheral region of the tumor shows high CBV values indicative of increased vascular density. Figure 1 c (bottom) shows the percent change in the R2* map 55 minutes after nitrite injection. Most of the regions in the brain exhibit little to no-change (<6%) in the R2* and do not register on the color scale that shows increases in R2* > 6%. The “red” tones in the image represent a large positive change in R2*, while the “blue” tones in the image show small changes. In general, the spatial appearance and magnitude of enhanced R2* was heterogeneous across each tumor.
Figure 1.

a: Anatomical image with arrow indicating the location of the tumor. b: CBV map extracted using the change in R2* from baseline images, shows a small necrotic core (arrow), and a surrounding high CBV region indicative of increased vasculature. c: Percent change in R2* after nitrite injection.
Figure 2a shows the results of changes in R2* after the injection of saline (as shown by the arrow), which acts as a control in this experiment. The volume of saline injected is the same as that used for nitrite in the animal. Prior to the injection of saline the animal was injected with the intravascular agent in order to estimate the baseline blood volume. The R2* decreases by 3-4% in both the tumor and normal tissue. Figure 2b shows the results of the changes in R2* after the injection of nitrite without the prior injection of the intravascular CA. The R2* remains unchanged in both the tumor and the normal tissue.
Figure 2.
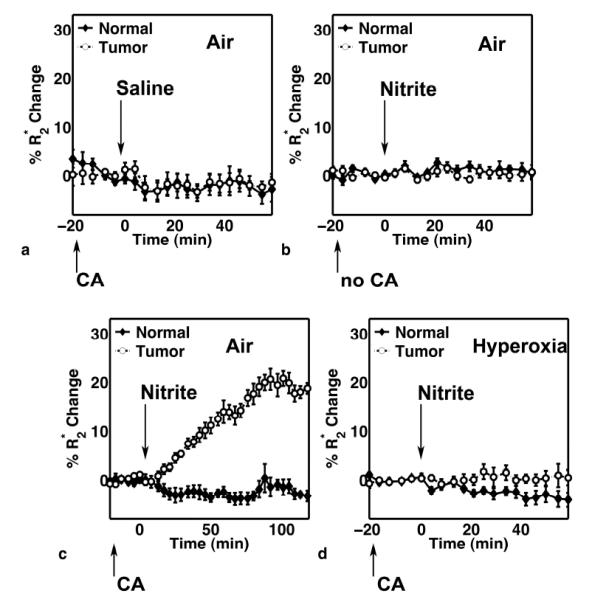
Percent change in R2* in normal and tumor tissue in 4 different cohorts of rats including: a) before and after the injection of the CA and saline (N = 5), b) before and after the injection of nitrite without the CA (N = 6), c) before and after the injection of CA and nitrite (N = 8), and d) before and after the injection of CA and nitrite while the animal is breathing 100% O2 (N = 7).
The results from the group of rats that were injected with nitrite following the injection of the intravascular CA are shown in Figure 2c. The normal tissue R2* remains unchanged after the injection of nitrite, while the tumor R2* gradually increased for the duration of the study (maximum average change across 8 rats ~ 20%). This indicates an increase in CA concentration specifically within the tumor tissue. Follow-up studies (data not shown) in additional rats have revealed that these pronounced R2* changes plateau approximately 1.5 hrs after nitrite injection and persist even after 6 hours. To determine if the changes in R2* were associated with regions of elevated CBV, the spatial correlation between the two maps were computed. A voxel-wise analysis of each animal revealed no spatial correlation between baseline tumor CBV and R2* changes (Pearson’s r ranged from −0.3 to 0.3 across the 8 animals).
Serial changes in R2* are shown in Figure 2d in the cohort of rats injected with the intravascular CA followed by nitrite, during the inhalation of 100% O2. The differential effect between the tumor and the normal tissue seen in the earlier group is lost, and R2* remains unchanged after the injection of nitrite. In both normal and tumor tissue, there was no significant difference (p > 0.05) in baseline (pre-nitrite) CBV values in animals breathing air or 100% O2.
The mean of the percent change in R2* of the final 4 time-points in tumor and normal tissue were compared using a student t-test for each group of rats. As shown in Figure 3, there were no significant differences in the tumor and normal tissue for the control group injected with saline, the group injected with nitrite but no CA, and the group injected with nitrite and the CA but breathing 100% O2. However, there were statistically significant (p<0.00001) differences between the tumor and normal tissue in the group injected with nitrite and CA and breathing lab air.
Figure 3.
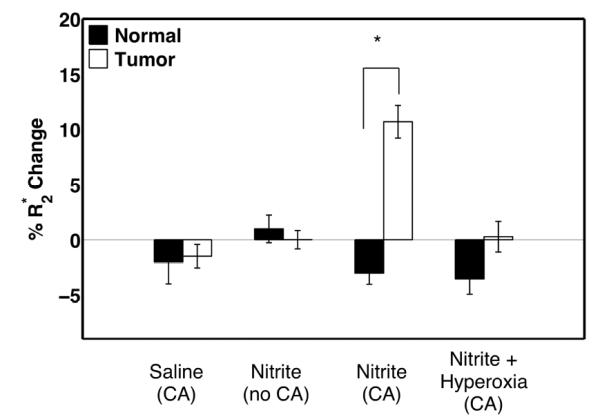
Comparison of the mean percent change in R2* of the last 4 time-points, in normal and tumor tissue in 4 different cohorts of rats including: a) before and after the injection of the CA and saline, b) before and after the injection of nitrite without the CA, c) before and after the injection of CA and nitrite, and d) before and after the injection of CA and nitrite while the animal is breathing 100% O2.
Figures 4a and 4b show example anatomic MRI and 18F-MISO PET late slope images in a C6 bearing rat. In general, the late slope of 18F-MISO was much greater in orthotopic C6 tumors than that found in the surrounding normal appearing brain tissue, which was typically close to zero or negative. Statistical analysis indicates that the late slope of 18F-MISO uptake in tumors was significantly greater than that found in normal brain (p < 0.005). The FMISO uptake was also strongly dependent on the inhaled gas, reflecting the sensitivity of FMISO to tumor hypoxic status. Under hyperoxia, the time-activity curves for tumor tissue exhibit a constant or negative late slope, similar to that found in normal tissue (Figure 4c). There were no significant differences between the late slope in normal and tumor tissue under hyperoxic conditions (p=0.683) (Figure 4d).
Figure 4.
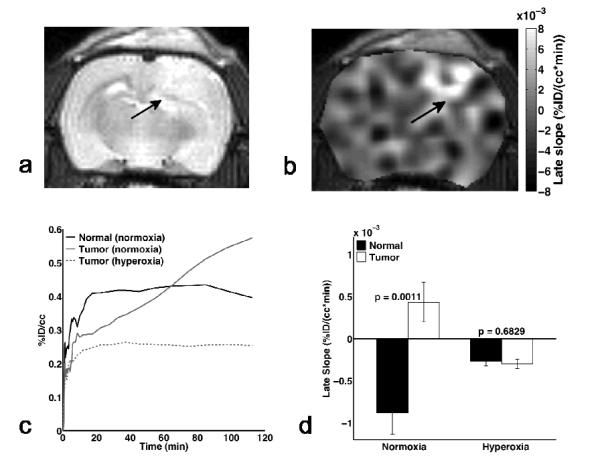
Example (a) anatomic and (b) 18F-FMISO PET late slope map of a C6 bearing rat under normoxia. Arrows indicate the location of the tumor. (c) Plot of 18F-FMISO uptake (as %ID/cc) versus time over the 2 hours post-injection. The uptake in tumor tissue under normoxia continually increases as a result of the tumor hypoxia, while the normal tissue and tumor under hyperoxia have more constant and similar late slopes. (d) Under normoxic conditions, the late slope in tumor was significantly higher than that in normal tissue, whereas there was no difference between normal and tumor tissue late slope under hyperoxia, indicating reduced hypoxia in the tumors.
DISCUSSION
Nitrite undergoes reconversion to nitric oxide (NO) under conditions characteristic of the tumor microenvironment, such as hypoxia and low pH. In this work, we focused our efforts on understanding the effect on the vasculature in the tumor upon external injection of nitrite. The results indicate that nitrite induces tumor-specific vascular changes in C6 gliomas. The changes observed are statistically different from that in the surrounding normal tissue, and are observed for a prolonged duration over several hours. These prolonged changes, and the apparent lack of a washout phase even after many hours, are not consistent with the more acute effects (~ 30 min) of nitrite on cellular respiration or hemodynamics previously reportedly (16), indicating they are likely due to increased vascular permeability and iron oxide CA accumulation within the tumor tissue rather than tumor vessel vasodilation. It has been well established that NO in the tumor microcirculation can increase local vascular permeability (31). In a similar study, Weyerbrock et al found that the permeability of C6 tumor vessels to aminoisobutyric acid, sucrose and dextran was greatly enhanced following the injection of the NO donor, Proli/NO. Simultaneous injection of Proli/NO and a chemotherapeutic agent resulted in the long-term survival of 40% of tumor bearing rats (32). Yin et al (33)showed that using other NO donors such as L-arginine or hydroxyurea can also result in the opening of the of the blood-brain tumor barrier.
It is known that under the influence of isoflurane, changes in breathing rate impacts cerebral blood flow. In this work, the respiratory rate was monitored continuously during imaging and was found to be relatively stable following the injection of nitrite but generally increase under hyperoxic conditions. Changes in blood flow (i.e. vasoconstriction) could alter the delivery of CA to the tumor tissue, and in turn the resulting R2* changes, however, it is important to note that the CA used in this study is a long circulating intravascular agent that remains in the system for several hours thereby reducing the effects of altered blood-flow. Furthermore, a comparison of pre-nitrite baseline CBV values between animals breathing air and 100 O2 yielded no significant differences, indicating that the delivery of the CA to normal and tumor tissue is not markedly affected by the hyperoxic challenge (e.g. due to hyperoxic vasoconstriction). This further enforces our conclusion that the effect on R2* is primarily driven by permeability changes and the accumulation of CA within tumor tissue after the injection of nitrite.
The iron oxide based CA used herein is known to be an intravascular contrast agent, and is widely used in evaluation of blood volume using susceptibility-based imaging techniques(21, 23-25). In this work, saline injections had little to no effect on the normal or tumor tissue R2*, and accordingly, the vasculature. If the effect of nitrite was driven by vasodilation, as would be expected due to the properties of nitric oxide, we would see changes in the R2* in the group of rats that were injected with nitrite but no CA. The effect would be similar to the one observed during BOLD MRI studies (34). Results from Figure 2b, do not show a change in R2* and hence we can rule out a vasoactive effect.
While we observe significant prolonged differences in R2* between the tumor and the normal tissue, the effect is nullified in the cohort of rats breathing 100% O2 instead of lab air. The increase in R2* is related to the extravasation of the iron oxide nanoparticles in the tumor tissue as confirmed by the prolonged effects observed in the tumors. This indicates that nitrite induces the extravasation of these iron-oxide nanoparticles, selectively, in the presence of local hypoxia in the tumors. As oxygenation is known to vary widely within tumors this finding is also consistent with the heterogenous spatial response to nitrite observed within each tumor in the study. In these studies, the presence of tumor hypoxia in C6 tumors was verified using 18F-FMISO PET imaging. Similarly, Kahn et al have previously found that C6 tumor pO2 is, on average, 12 – 14 mmHg (26).
As hyperoxic challenges are not always effective at increasing interstitial tumor oxygenation, 18F -FMISO was also used to determine the effects of hyperoxia on tumor hypoxia. Under normoxia, 18F -FMISO becomes trapped and accumulates in the hypoxic regions (here, tumor tissue). Images acquired at late time frames highlight the hypoxic tissue. Because the tracer accumulates over time, the late slope can provide insight into the hypoxic tumor status – a positive slope is indicative of hypoxia, while a constant or negative slope is indicative of a normal oxygenation level. Using the late slope of the time-activity curves, we found a large positive slope for tumor tissue and a negative slope for normal brain tissue under normoxia. Under hyperoxia, the slopes for both tumor tissue and normal brain were both slightly negative. The slopes were significantly different between normal and tumor tissue under normoxia (p<0.005), while there were no significant differences under hyperoxic conditions (p=0.683). From these results, we conclude that the hyperoxic challenge increases the tumor oxygenation such that regional hypoxia is reduced. Consequently, these seemingly normoxic tumor tissues would not permit the conversion of nitrite to NO, as evidenced by the lack of CA extravasation under 100% O2 (Figure 2d). While it is plausible that the mechanism for the total elimination of nitrite-induced effects seen in the cohort of animals treated with nitrite can be attributed to pathways involving nitrite reduction within the blood of the tumor, the 18F-FMISO studies lead us to conclude that the changes are predominantly in the tissue and not just the blood within the tumor.
The substantial nitrite-induced extravasation of iron-oxide nanoparticles observed here has implications for the enhancement of conventional and nanotherapeutic drug delivery. That the effect was only observed in hypoxic tumor regions also indicates a potential way to selectively deliver such exogenous therapies. Future studies will evaluate the utility of nitrite-enhanced drug and contrast agent delivery using iron oxide agents of different sizes and in additional tumor models. It would be particularly useful to corroborate the oxygen sensitivity of the nitrite effect in vivo by spatially correlating the MR changes observed herein to imaging methods sensitive to hypoxia (e.g. hypoxia selective radiotracers or other MRI methods such as qBOLD (35, 36)). In conclusion, the dynamic contrast enhanced R2* mapping approach is known to be a valuable tool for monitoring pharmacological changes in tumor vasoactivity but it can also be a very sensitive technique for the detection of NO-donor enhanced drug accumulation within tumors.
Acknowledgements
Work was performed at the Vanderbilt University Institute of Imaging Science, with support from NCI P30 CA068485, NCI U24 CA126588, NCI R21 CA127342-01 and NCI K99/R00 CA127599. The authors would like to thank Dr. John Gore for helpful discussions on contrast enhanced vascular imaging. The authors would also like to thank Zou Yue for performing the surgical procedures on the animals.
NCI
P30 CA068485
NCI
U24 CA126588
NCI
R21 CA127342-01
NCI
K99/R00 CA127599
Abbreviations
- NO
Nitric Oxide
- NOS
Nitric Oxide Synthase
- CA
Contrast Agent
- PID
proportional integral derivative
- CBV
cerebral blood volume
- BOLD
Blood Oxygenation Level Dependent
- TR
repetition time
- TE
echo time
- NEX
number of excitations
- 18F-FMISO
18F-fluoromisonidazole
REFERENCES
- 1.Marletta MA, Tayeh MA, Hevel JM. Unraveling the biological significance of nitric oxide. Biofactors. 1990;2(4):219–25. [PubMed] [Google Scholar]
- 2.Lundberg JO, Weitzberg E, Gladwin MT. The nitrate-nitrite-nitric oxide pathway in physiology and therapeutics. Nat Rev Drug Discov. 2008;7(2):156–67. doi: 10.1038/nrd2466. [DOI] [PubMed] [Google Scholar]
- 3.Cosby K, Partovi KS, Crawford JH, Patel RP, Reiter CD, Martyr S, Yang BK, Waclawiw MA, Zalos G, Xu X, Huang KT, Shields H, Kim-Shapiro DB, Schechter AN, Cannon RO, 3rd, Gladwin MT. Nitrite reduction to nitric oxide by deoxyhemoglobin vasodilates the human circulation. Nat Med. 2003;9(12):1498–505. doi: 10.1038/nm954. [DOI] [PubMed] [Google Scholar]
- 4.Nagababu E, Ramasamy S, Abernethy DR, Rifkind JM. Active nitric oxide produced in the red cell under hypoxic conditions by deoxyhemoglobin-mediated nitrite reduction. J Biol Chem. 2003;278(47):46349–56. doi: 10.1074/jbc.M307572200. [DOI] [PubMed] [Google Scholar]
- 5.Shiva S, Huang Z, Grubina R, Sun J, Ringwood LA, MacArthur PH, Xu X, Murphy E, Darley-Usmar VM, Gladwin MT. Deoxymyoglobin is a nitrite reductase that generates nitric oxide and regulates mitochondrial respiration. Circ Res. 2007;100(5):654–61. doi: 10.1161/01.RES.0000260171.52224.6b. [DOI] [PubMed] [Google Scholar]
- 6.Rassaf T, Flogel U, Drexhage C, Hendgen-Cotta U, Kelm M, Schrader J. Nitrite reductase function of deoxymyoglobin: Oxygen sensor and regulator of cardiac energetics and function. Circ Res. 2007;100(12):1749–54. doi: 10.1161/CIRCRESAHA.107.152488. [DOI] [PubMed] [Google Scholar]
- 7.Zhang Z, Naughton DP, Blake DR, Benjamin N, Stevens CR, Winyard PG, Symons MC, Harrison R. Human xanthine oxidase converts nitrite ions into nitric oxide (NO) Biochem Soc Trans. 1997;25(3):524S. doi: 10.1042/bst025524s. [DOI] [PubMed] [Google Scholar]
- 8.Godber BL, Doel JJ, Sapkota GP, Blake DR, Stevens CR, Eisenthal R, Harrison R. Reduction of nitrite to nitric oxide catalyzed by xanthine oxidoreductase. J Biol Chem. 2000;275(11):7757–63. doi: 10.1074/jbc.275.11.7757. [DOI] [PubMed] [Google Scholar]
- 9.Carlsson S, Wiklund NP, Engstrand L, Weitzberg E, Lundberg JO. Effects of pH, nitrite, and ascorbic acid on nonenzymatic nitric oxide generation and bacterial growth in urine. Nitric Oxide. 2001;5(6):580–6. doi: 10.1006/niox.2001.0371. [DOI] [PubMed] [Google Scholar]
- 10.Peri L, Pietraforte D, Scorza G, Napolitano A, Fogliano V, Minetti M. Apples increase nitric oxide production by human saliva at the acidic pH of the stomach: A new biological function for polyphenols with a catechol group? Free Radic Biol Med. 2005;39(5):668–81. doi: 10.1016/j.freeradbiomed.2005.04.021. [DOI] [PubMed] [Google Scholar]
- 11.Gago B, Lundberg JO, Barbosa RM, Laranjinha J. Red wine-dependent reduction of nitrite to nitric oxide in the stomach. Free Radic Biol Med. 2007;43(9):1233–42. doi: 10.1016/j.freeradbiomed.2007.06.007. [DOI] [PubMed] [Google Scholar]
- 12.Benjamin N, O'Driscoll F, Dougall H, Duncan C, Smith L, Golden M, McKenzie H. Stomach NO synthesis. Nature. 1994;368:6471–502. doi: 10.1038/368502a0. [DOI] [PubMed] [Google Scholar]
- 13.Lundberg JO, Weitzberg E, Lundberg JM, Alving K. Intragastric nitric oxide production in humans: Measurements in expelled air. Gut. 1994;35(11):1543–6. doi: 10.1136/gut.35.11.1543. [DOI] [PMC free article] [PubMed] [Google Scholar]
- 14.Giraldez RR, Panda A, Xia Y, Sanders SP, Zweier JL. Decreased nitric-oxide synthase activity causes impaired endothelium-dependent relaxation in the postischemic heart. J Biol Chem. 1997;272(34):21420–6. doi: 10.1074/jbc.272.34.21420. [DOI] [PubMed] [Google Scholar]
- 15.Ostergaard L, Stankevicius E, Andersen MR, Eskildsen-Helmond Y, Ledet T, Mulvany MJ, Simonsen U. Diminished NO release in chronic hypoxic human endothelial cells. Am J Physiol Heart Circ Physiol. 2007;293(5):H2894–903. doi: 10.1152/ajpheart.01230.2006. [DOI] [PubMed] [Google Scholar]
- 16.Frerart F, Sonveaux P, Rath G, Smoos A, Meqor A, Charlier N, Jordan BF, Saliez J, Noel A, Dessy C, Gallez B, Feron O. The acidic tumor microenvironment promotes the reconversion of nitrite into nitric oxide: Towards a new and safe radiosensitizing strategy. Clin Cancer Res. 2008;14(9):2768–74. doi: 10.1158/1078-0432.CCR-07-4001. [DOI] [PubMed] [Google Scholar]
- 17.Tannenbaum SR, Correa P. Nitrate and gastric cancer risks. Nature. 1985;317(6039):675–6. doi: 10.1038/317675b0. [DOI] [PubMed] [Google Scholar]
- 18.Mensinga TT, Speijers GJ, Meulenbelt J. Health implications of exposure to environmental nitrogenous compounds. Toxicol Rev. 2003;22(1):41–51. doi: 10.2165/00139709-200322010-00005. [DOI] [PubMed] [Google Scholar]
- 19.Preston-Martin S, Pogoda JM, Mueller BA, Holly EA, Lijinsky W, Davis RL. Maternal consumption of cured meats and vitamins in relation to pediatric brain tumors. Cancer Epidemiol Biomarkers Prev. 1996;5(8):599–605. [PubMed] [Google Scholar]
- 20.McKean-Cowdin R, Pogoda JM, Lijinsky W, Holly EA, Mueller BA, Preston-Martin S. Maternal prenatal exposure to nitrosatable drugs and childhood brain tumours. Int J Epidemiol. 2003;32(2):211–7. doi: 10.1093/ije/dyg050. [DOI] [PubMed] [Google Scholar]
- 21.Robinson SP, Rijken PF, Howe FA, McSheehy PM, van der Sanden BP, Heerschap A, Stubbs M, van der Kogel AJ, Griffiths JR. Tumor vascular architecture and function evaluated by non-invasive susceptibility MRI methods and immunohistochemistry. J Magn Reson Imaging. 2003;17(4):445–54. doi: 10.1002/jmri.10274. [DOI] [PubMed] [Google Scholar]
- 22.San-Galli F, Vrignaud P, Robert J, Coindre JM, Cohadon F. Assessment of the experimental model of transplanted C6 glioblastoma in wistar rats. J Neurooncol. 1989;7(3):299–304. doi: 10.1007/BF00172924. [DOI] [PubMed] [Google Scholar]
- 23.Perles-Barbacaru T, Procissi D, Demyanenko AV, Jacobs RE. Quantitative pharmacologic MRI in mice. NMR Biomed. 2012;25(4):498–505. doi: 10.1002/nbm.1760. [DOI] [PMC free article] [PubMed] [Google Scholar]
- 24.Dósa E, Guillaume DJ, Haluska M, Lacy CA, Hamilton BE, Njus JM, Rooney WD, Kraemer DF, Muldoon LL, Neuwelt EA. Magnetic resonance imaging of intracranial tumors: Intra-patient comparison of gadoteridol and ferumoxytol. Neuro-oncology. 2011;13(2):251–60. doi: 10.1093/neuonc/noq172. [DOI] [PMC free article] [PubMed] [Google Scholar]
- 25.Hamilton B, Nesbit G, Dosa E, Gahramanov S, Rooney B, Nesbit E, Raines J, Kraemer D, Neuwelt E. Comparative analysis of ferumoxytol and gadoteridol enhancement using T1- and T2-weighted MRI in neuroimaging. American Journal of Roentgenology. 2011 Oct;197(4):981–988. doi: 10.2214/AJR.10.5992. [DOI] [PMC free article] [PubMed] [Google Scholar]
- 26.Khan N, Li H, Hou H, Lariviere JP, Gladstone DJ, Demidenko E, Swartz HM. Tissue pO2 of orthotopic 9L and C6 gliomas and tumor-specific response to radiotherapy and hyperoxygenation. Int J Radiat Oncol Biol Phys. 2009;73(3):878–85. doi: 10.1016/j.ijrobp.2008.10.025. [DOI] [PMC free article] [PubMed] [Google Scholar]
- 27.Bentzen L, Keiding S, Horsman MR, Gronroos T, Hansen SB, Overgaard J. Assessment of hypoxia in experimental mice tumours by [18F]fluoromisonidazole PET and pO2 electrode measurements. influence of tumour volume and carbogen breathing. Acta Oncol. 2002;41(3):304–12. doi: 10.1080/02841860260088863. [DOI] [PubMed] [Google Scholar]
- 28.Matsumoto K, Szajek L, Krishna MC, Cook JA, Seidel J, Grimes K, Carson J, Sowers AL, English S, Green MV, Bacharach SL, Eckelman WC, Mitchell JB. The influence of tumor oxygenation on hypoxia imaging in murine squamous cell carcinoma using [64Cu]cu-ATSM or [18F]fluoromisonidazole positron emission tomography. Int J Oncol. 2007;30(4):873–81. [PubMed] [Google Scholar]
- 29.Cho H, Ackerstaff E, Carlin S, Lupu ME, Wang Y, Rizwan A, O'Donoghue J, Ling CC, Humm JL, Zanzonico PB, Koutcher JA. Noninvasive multimodality imaging of the tumor microenvironment: Registered dynamic magnetic resonance imaging and positron emission tomography studies of a preclinical tumor model of tumor hypoxia. Neoplasia. 2009;11(3):247–59. doi: 10.1593/neo.81360. 2p following 259. [DOI] [PMC free article] [PubMed] [Google Scholar]
- 30.Wang W, Georgi JC, Nehmeh SA, Narayanan M, Paulus T, Bal M, O'Donoghue J, Zanzonico PB, Schmidtlein CR, Lee NY, Humm JL. Evaluation of a compartmental model for estimating tumor hypoxia via FMISO dynamic PET imaging. Phys Med Biol. 2009;54(10):3083–99. doi: 10.1088/0031-9155/54/10/008. [DOI] [PMC free article] [PubMed] [Google Scholar]
- 31.Fukumura D, Yuan F, Endo M, Jain RK. Role of nitric oxide in tumor microcirculation. blood flow, vascular permeability, and leukocyte-endothelial interactions. Am J Pathol. 1997;150(2):713–25. [PMC free article] [PubMed] [Google Scholar]
- 32.Weyerbrock A, Walbridge S, Pluta RM, Saavedra JE, Keefer LK, Oldfield EH. Selective opening of the blood-tumor barrier by a nitric oxide donor and long-term survival in rats with C6 gliomas. J Neurosurg. 2003;99(4):728–37. doi: 10.3171/jns.2003.99.4.0728. [DOI] [PubMed] [Google Scholar]
- 33.Yin D, Wang X, Konda BM, Ong JM, Hu J, Sacapano MR, Ko MK, Espinoza AJ, Irvin DK, Shu Y, Black KL. Increase in brain tumor permeability in glioma-bearing rats with nitric oxide donors. Clin Cancer Res. 2008;14(12):4002–9. doi: 10.1158/1078-0432.CCR-07-1826. [DOI] [PubMed] [Google Scholar]
- 34.Kennan RP, Scanley BE, Innis RB, Gore JC. Physiological basis for BOLD MR signal changes due to neuronal stimulation: Separation of blood volume and magnetic susceptibility effects. Magn Reson Med. 1998;40(6):840–6. doi: 10.1002/mrm.1910400609. [DOI] [PubMed] [Google Scholar]
- 35.He X, Yablonskiy DA. Quantitative BOLD: Mapping of human cerebral deoxygenated blood volume and oxygen extraction fraction: Default state. Magn Reson Med. 2007;57(1):115–26. doi: 10.1002/mrm.21108. [DOI] [PMC free article] [PubMed] [Google Scholar]
- 36.Lemasson B, Christen T, Serduc R, Maisin C, Bouchet A, Le Duc G, Remy C, Barbier EL. Evaluation of the relationship between MR estimates of blood oxygen saturation and hypoxia: Effect of an antiangiogenic treatment on a gliosarcoma model. Radiology. 2012;265(3):743–52. doi: 10.1148/radiol.12112621. [DOI] [PubMed] [Google Scholar]