Abstract
Short-Lag Spatial Coherence (SLSC) imaging is a novel beamforming technique that reduces acoustic clutter in ultrasound images. A clinical study was conducted to investigate clutter reduction and endocardial border detection in cardiac SLSC images. Individual channel echo data were acquired from the left ventricle of 14 volunteers, after informed consent and IRB approval. Paired B-mode and SLSC images were created from these data. Contrast, contrast-to-noise, and signal-to-noise ratios were measured in paired images, and these metrics were improved with SLSC imaging in most cases. Three cardiology fellows rated the visibility of endocardial segments in randomly ordered B-mode and SLSC cine loops. SLSC imaging offered 22–33% improvement (p < 0.05) in endocardial border visibility when B-mode image quality was poor (i.e. 80% or more of the endocardial segments could not be visualized by the three reviewers). The percentage of volunteers with poor-quality images was decreased from 21% to 7% with the SLSC beamformer. Results suggest that SLSC imaging has the potential to improve clinical cardiac assessments that are challenged by clutter.
Keywords: echocardiography, clutter reduction, endocardial border detection, beamforming, B-mode, contrast, CNR, SNR
Introduction
Clinical cardiac ultrasound images are challenged by several noise artifacts, including speckle, acoustic shadowing, echo dropout and clutter. Though regarded as a noise artifact, speckle is beneficial for tracking myocardial motion in strain imaging and other motion-dependent applications. In addition, acoustic shadowing or echo dropout may be reduced by adjusting transducer placement, limiting ultrasound blockage by the ribs or enhancing the ultrasound angle of incidence with tissue. Clutter, on the other hand, is a persistent noise artifact that is usually difficult to remove or correct. Unlike speckle, clutter has no known benefits in echocardiography.
Clutter appears as a diffuse haze that reduces image contrast (Lediju et al., 2008) and obscures visualization of endocardial borders, tumors, vegetations, and other cardiac abnormalities (Patel et al., 1980; Mele et al., 2006). It presents a major challenge in strain imaging and automated or manual border detection (Teske et al., 2007; Vandenberg et al., 1992; Bezante et al., 2005; Skolnick et al., 1999). Sources of cardiac clutter include wavefront distortions encountered as sound travels transthoracically, sound reverberations in multiple tissue layers, and reflections from off-axis structures such as the ribs, lungs, chordae tendineae, valves, and myocardial walls (Yeh, 1977; Cloutier et al., 2003; Hinkelman et al., 1997; Lediju et al., 2009a).
Harmonic imaging is a common clutter reduction method, whereby images contain frequencies that are integer multiples of the frequencies of transmitted pulses. These harmonic frequencies are generated as a pulse travels through tissue. One reason for the reduced clutter content in harmonic images is that harmonic frequencies are not fully developed near the transducer surface, where sound reverberations typically occur (Tranquart et al., 1999; Shapiro et al., 1998; Muir and Carstensen, 1980; Starritt et al., 1986). In several studies, harmonic imaging lowered the percentage of patients with suboptimal images due to clutter from 45–51% to 11–24% (Chirillo et al., 2005; Caiati et al., 1999). This indicates that harmonic imaging improves image quality in a subset of patients, yet it does not always sufficiently reduce clutter.
Another approach to clutter reduction is to separate tissue signals from clutter noise using motion filters or principal component analysis-based filers (Zwirn and Akselrod, 2006; Gallippi and Trahey, 2002; Lediju et al., 2009b; Mauldin et al., 2011). These filters are effective at reducing stationary or slowly-moving clutter. In echocardiography, this type of clutter is often due to acoustic reverberations within the chest wall or reflections from stationary and slowly-moving extracardiac structures such as the ribcage and lungs. One challenge with these filters is their limited ability to remove the higher-velocity clutter that is due to reflections from intracardiac structures like the chordae tendineae, valves, and myocardial walls. In addition, these filters require information from multiple frames of image data to differentiate myocardial motion from clutter noise.
In transesophageal echocardiography (TEE), images are acquired by inserting an ultrasound transducer in the esophagus, rather than utilizing the standard transthoracic window (Ragland and Tak, 2006; Ward et al., 2004). Despite the improvements in image quality, TEE poses a discomfort to patients and is not recommended for routine clinical use (Ragland and Tak, 2006; Hanrath, 2001). Another alternative is contrast echocardiography, which utilizes contrast agents to enhance endocardial border visualization (Zwirn et al., 2009). However, the injection of contrast agents presents an additional expense to patients and necessitates a sterile environment for intravenous access (Al-Mansour et al., 2000; Moir and Marwick, 2004; Ophir and Parker, 1989).
Short-lag spatial coherence (SLSC) imaging (Lediju et al., 2011; Dahl et al., 2011), a novel beamforming approach that utilizes the spatial coherence of backscattered ultrasound echoes, overcomes many of the challenges associated with existing clutter-reduction or border-enhancement approaches. The spatial coherence of echoes from myocardium exhibits different characteristics from that of clutter and blood (Bamber et al., 2000). This difference is most noticeable over small spatial differences, thus SLSC imaging is implemented by computing the spatial coherence of echoes received by closely-spaced transducer elements. This paper presents initial results of the SLSC beamforming method applied to in vivo cardiac data.
Methods
Study Population
The study population consisted of 14 volunteers (9 men, 5 women, mean ± s.d. ages = 55 ± 17 years, range = 33–85 years). Six of the volunteers were employees of Duke University and eight were patients scheduled for an echocardiogram at the Duke University Medical Center. Two of the patients required the use of contrast agents for endocardial visualization during a standard exam, one patient suffered from pulmonary hypertension, and two patients had scar tissue in the chest wall, one from a heart transplant and one from breast surgery. This study was approved by the Duke University Institutional Review Board (Protocol ID: Pro00030455) and informed consent was obtained from all volunteers.
Data Acquisition
Each volunteer was placed in the left lateral decubitus position to acquire mid-level short axis views and apical four chamber views of the left ventricle (LV). These views are illustrated in Fig. 1 relative to a schematic of the heart. A Verasonics™ ultrasound scanner (Redmond, WA) and a 64-element ATL P4-2 phased array transducer were utilized to acquire the individual channel radio-frequency echoes needed to form 35 frames of image data. The frame rate of acquired data (which depended on factors like the data transfer times and the imaging depth) was approximately 7–12 frames per second.
Figure 1.
Schematic of two standard ultrasound views of the heart and associated segments of the left ventricle (LV) walls. There are six segements in the mid-level short axis view and seven segments in the apical four chamber view. Reprinted fromLang et al. (2005) with permission from Elsevier.
The transmit beam was electronically steered and focused at 50 different lateral locations, such that the sector width of each frame was 45° and the lateral beam spacing was 0.9° per line. No apodization was applied to the transmit beam. The minimum depth required to display the entire LV in each volunteer was selected from preset values of 8, 10, 12, 14, 16 or 18 cm. The transmit focus ranged from 4–10 cm, depending on the location of the heart. In the short axis views, the focus was consistent with the location of the LV, and in the apical views, it was consistent with at least two of the seven endocardial segments. The axial sampling frequency was 30 MHz, unless otherwise stated. The transducer transmit frequency was 2 MHz.
Gain settings were standardized for all volunteers. The programmed pulse sequences were below the FDA limits for spatial-peak pulse-average intensity and mechanical index (Phillps, 2008). The size of one data set (i.e the individual channel data required to make a cine loop of 35 image frames) was approximately 6–7 gigabytes.
B-mode and SLSC Image Formation
The ultrasound echo data received by the 64 individual transducer elements were processed offline to create matched (or paired) B-mode and SLSC images and cine loops. B-mode images were created by applying a delay-and-sum beamformer with dynamic receive focusing and no aperture growth. The data were then envelope-detected, normalized to the maximum value, scan converted, and log compressed using settings that were determined to be optimal by the cardiology fellow who performed the acquisitions.
SLSC images were formed by first computing a normalized spatial coherence function at one depth (i.e. one axial position) of the delayed backscattered echoes that correspond to one lateral location in an image, as described byFedewa et al. (2003):
| (1) |
where R̂(m) is the normalized spatial correlation measured across a receive aperture, m is the element separation distance (or element lag), N refers to the total number of receive elements (i.e. N = 64), and si(n) is the time-delayed signal received by the ith element at depth, or time, n, expressed in number of samples. The correlation kernel size (n2–n1) used to calculate the spatial coherence function was approximately one wavelength. The resulting coherence function was then summed over the short lag region, as described by the following equation:
| (2) |
where Rsl is the short-lag spatial coherence and M was equal to 6 lags, unless otherwise stated. Eqs. 1 and 2 were repeated for all possible axial and lateral positions to create the different pixels in a SLSC image. The SLSC image was then scan-converted and normalized to its maximum value. All SLSC images were displayed on a linear scale that ranged from 0 to 0.95 (i.e. 0 to 95% of its maximum value). No compression was applied to display SLSC images.
Endocardial Visibility and Scoring System
Cine loops of the short axis views were grouped separately from those of the apical 4 chamber views. Each group was randomized and reviewed independently by three cardiology fellows, who each had at least 3 years of experience. One reviewer was the cardiology fellow who acquired the images (Reviewer 1), and the other two reviewers were blinded to the study (Reviewers 2 and 3). Cine loops were observed in the cardiology reading room at the Duke University Hospital, with the same equipment and lighting conditions used to diagnose clinical conditions.
The observers were given the segment models shown in Fig. 1, which complied with the American Society of Echocardiography standards for short axis and apical four chamber views (Lang et al., 2005). There are six segments in the short axis view and seven segments in the apical four chamber view. Qualitative assessment of endocardial visualization of each segment of the LV during systole and diastole was performed with a visual scoring system ranging from 1 to 3 as follows: 1 = endocardial border clearly visible; 2 = endocardial border visible, but not clearly (i.e. poorly visible); and 3 = no endocardial border visible.
In the short axis and apical four chamber views, results were separated according to B-mode image quality, where good was defined as 80% or more of the endocardial segments were visualized, i.e. score = 1 or 2, by the three reviewers in systole and diastole (3 volunteers), and poor was defined as 80% or more of the endocardial segments could not be visualized, i.e. score = 3, by the three reviewers in systole or diastole (3 volunteers). The remaining volunteers were grouped as having medium-quality B-mode images (8 volunteers). The number of segments in each “score” category for each “image-quality” category was recorded for each reviewer. The same criteria were used to group SLSC images according to image quality for comparison with separations based on B-mode image quality.
Performance Metrics
For each volunteer, one B-mode image with relatively well-defined endocardial borders (i.e. relative to the quality of all B-mode images in a cine loop) was selected from the short axis view of the LV. The selected B-mode image and its matched SLSC image were used to characterize performance. Performance was evaluated by measuring contrast (C), contrast-to-noise ratio (CNR), and signal-to-noise ratio (SNR) in the same locations in the matched B-mode and SLSC images, using the following equations:
| (3) |
| (4) |
| (5) |
where Sv and Se are the mean signals in the ventricle and endocardium, respectively, and σv and σe are the standard deviations of signals in the ventricle and endocardium, respectively. All calculations were performed on uncompressed data. The signals used to measure B-mode performance metrics were taken from scan-converted, envelope-detected data, while the signals used to measure SLSC performance metrics were taken from scanconverted SLSC data. In addition, contrast, CNR, and SNR were measured as a function of the short-lag value (i.e. M in Eq. 2) for each volunteer. All performance metrics were calculated independently of the enodcardial visibility scores assigned by each reviewer. Performance metric results were then categorized by image quality after the two independent analyses were completed.
Statistical Analysis
B-mode and SLSC performance metrics (i.e. contrast, CNR, and SNR) were compared with a paired t-test to determine statistical significance. Cohen's d was calculated to determine the effect size and clinical significance of the performance metrics. Visibility scores were reported as the median and interquartile range of the percentage of total segments evaluated by each reviewer in each category. The number of segments not visible in B-mode and SLSC images (score=3) for each image-quality category was compared by a Wilcoxon signed rank test for paired data. Differences between B-mode and SLSC images were considered statistically significant for p values < 0.05 and clinically significant for Cohen's d ≥ 0.8.
Data from the apical four chamber view were also summarized as the mean visibility score of each segment in B-mode and SLSC images. Differences between the means were compared with a paired t-test, and statistical significance was maintained at p < 0.05.
To determine the level of inter-observer agreement among the visibility scores, Fleiss' kappa statistics were calculated (Cardillo, 2007). Separate statistics were calculated for the short axis and apical four chamber views. Kappa (κ) values < 0.00 were interpreted as poor agreement, values between 0 and 0.20 were interpreted as slight agreement, and values between 0.21 and 0.4 were interpreted as fair agreement, in accordance with Landis and Koch (1977).
Software
All image processing and data analyses were performed with Matlab (The Mathworks Inc., Natick, MA) software and several Matlab Executable (MEX) files that enabled the interface of C++ subroutines. The time to calculate one SLSC image was approximately 2 s with a 3.5 GHz processor, when the lag variables m and M were limited to 6, while the time to calculate one B-mode image with the same processor was approximately 20 ms.
Results
Short Axis Views
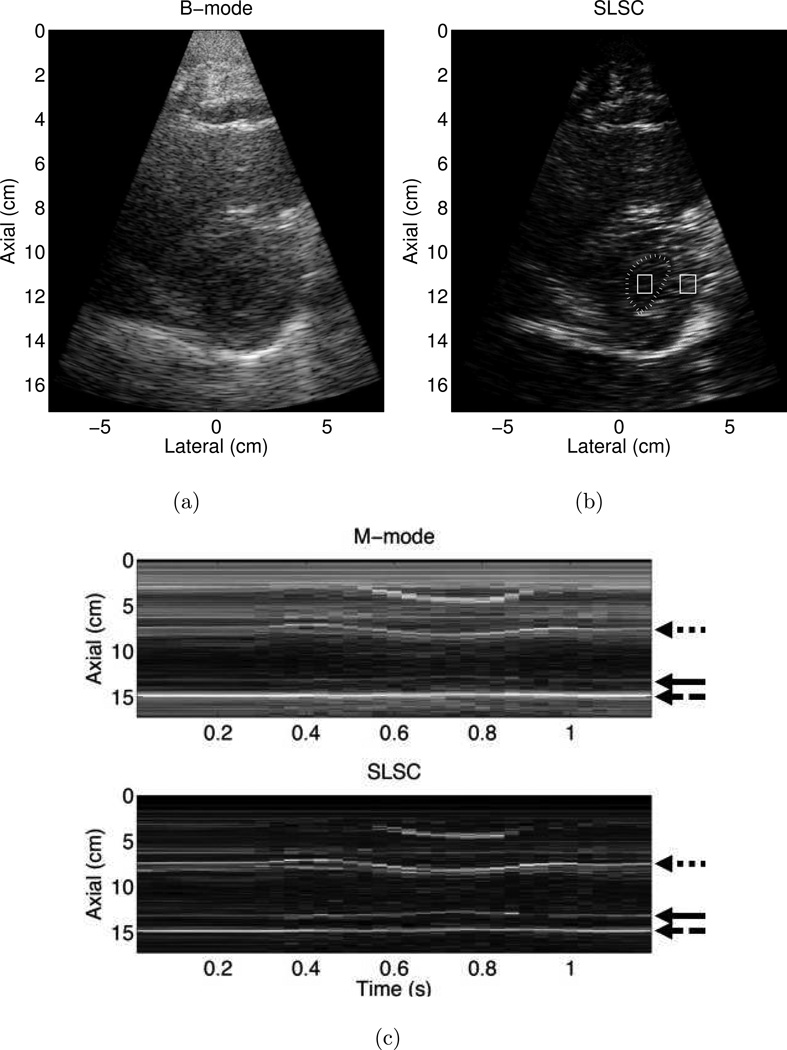
Matched B-mode and SLSC images of the LV of one volunteer are shown in Fig. 2 (a) and (b), respectively. The left ventricular and adjacent right ventricular and atrial cavities in Fig. 2 (b) contain less clutter than the respective locations in the matched B-mode image. Observation of the cine loop revealed a reduction of both stationary and nonstationary clutter, for all frames of acquired data, particularly in the near-field region. The axial sampling frequency was decreased to 10MHz to increase the frame rate of this acquisition.
Figure 2.
Matched (a) B-mode and (b) Short-Lag Spatial Coherence (SLSC) images of the left ventricle of Volunteer 2. The endocardial border was manually outlined (dotted line) with the aid of the associated cine loop, and the outlined boxes were used to calculate contrast, contrast-to-noise ratio (CNR), and signal-to-noise ratio (SNR). (c) Corresponding M-mode and SLSC images as a function of time. The arrows indicate the locations of the anterior endocardial border (dotted arrow), inferior endocardial border (solid arrow), and pericardium (dashed arrow). The axial sampling frequency was 10 MHz, and SLSC images were created with M = 10. B-mode and M-mode images are shown with 50 dB dynamic range, while SLSC images are shown on a linear scale ranging from 0 to 95% of the maximum value.
SLSC and traditional M-mode images were created from channel data by forming an image of the same lateral position as a function of time. The comparative M-modes in Fig. 2 (c) reveal that the SLSC image clarifies the inferior endocardial border (solid arrow), while the pericardium and anterior endocardial border are well visualized (dashed and dotted arrows, respectively).
The SLSC image was used to manually trace the endocardial border in the LV shown in Fig. 2 (b). Contrast, CNR, and SNR, calculated from signals in the regions of interest (ROIs) indicated in Fig. 2 (b), measured 6.6 dB, 1.1, and 2.3, respectively, in the B-mode image and 9.1 dB, 1.1, and 2.0, respectively, in the SLSC image. Thus, there is approximately a 3 dB improvement in contrast in the SLSC image, while the CNR and SNR are similar in the B-mode and SLSC images. ROIs in similar locations were used to calculate performance metrics for all of the volunteers. In this example, SLSC images were created with M = 10 to improve the resolution of the endocardial border.
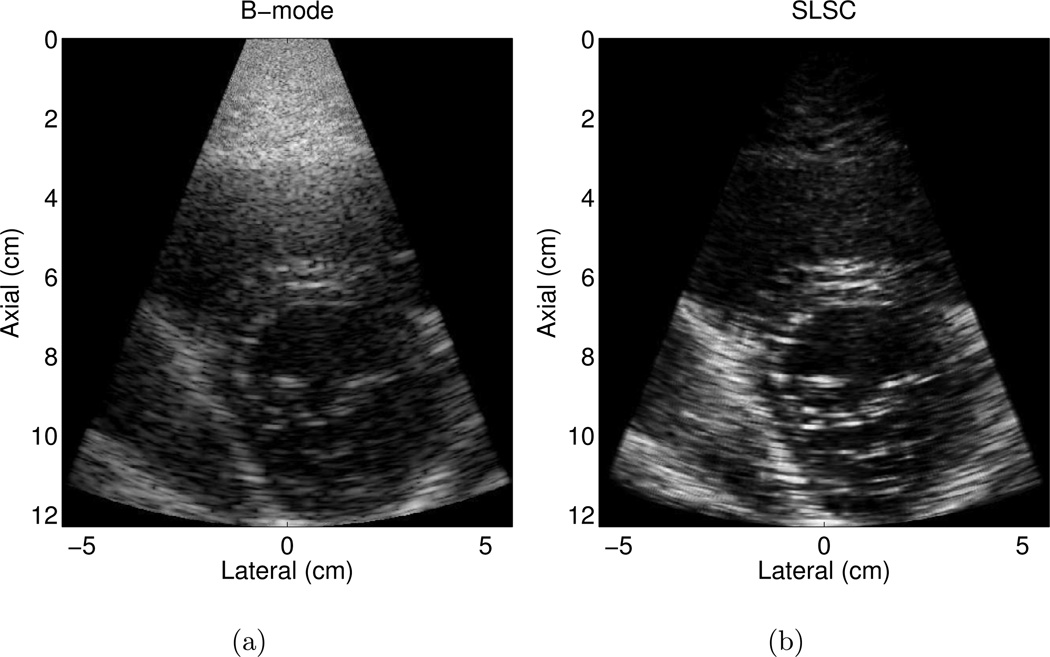
Matched B-mode and SLSC images of the LV and mitral valves in another volunteer are shown in Fig. 3 (a) and (b), respectively. The B-mode image is an example of a good quality image, where more than 80% of the endocardial border is visualized. Clutter is reduced and contrast is improved by approximately 4 dB in the SLSC image. CNR is improved by 0.5 and SNR is increased by 0.4 in the SLSC image. The SLSC image also shows more well-defined borders.
Figure 3.
Matched (a) B-mode and (b) SLSC images of the left ventricle of volunteer 5. The B-mode image is an example of a good quality image, where more than 80% of the endocardial border is visualized. The corresponding SLSC image shows reduced clutter and more well-defined borders. The B-mode image is shown with 50 dB dynamic range, while the SLSC image is shown on a linear scale ranging from 0 to 95% of the maximum value.
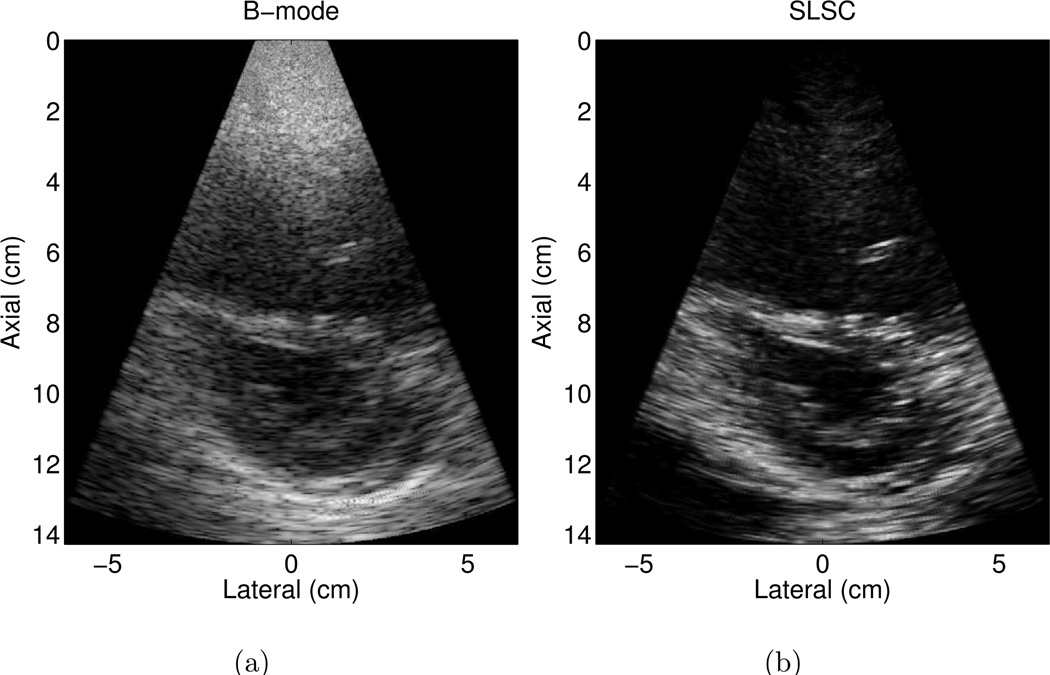
An example of a poorer quality B-mode image is shown in Fig. 4 (a), where less than 80% of the endocardial border is clearly visualized. The borders are clearer in the matched SLSC image in Fig. 4 (b). The contrast between the ventricle and the endocardium is improved by 11 dB in the SLSC image. CNR and SNR are improved by 1.5 and 1.6, respectively, in the SLSC image.
Figure 4.
Matched (a) B-mode and (b) SLSC images of the left ventricle of volunteer 7. The B-mode image is an example of a poorer quality image, where less than 80% of the endocardial border is clearly visualized. The endocardial border is better defined in the SLSC image. The B-mode image is shown with 50 dB dynamic range, while the SLSC image is shown on a linear scale ranging from 0 to 95% of the maximum value.
Performance Metrics
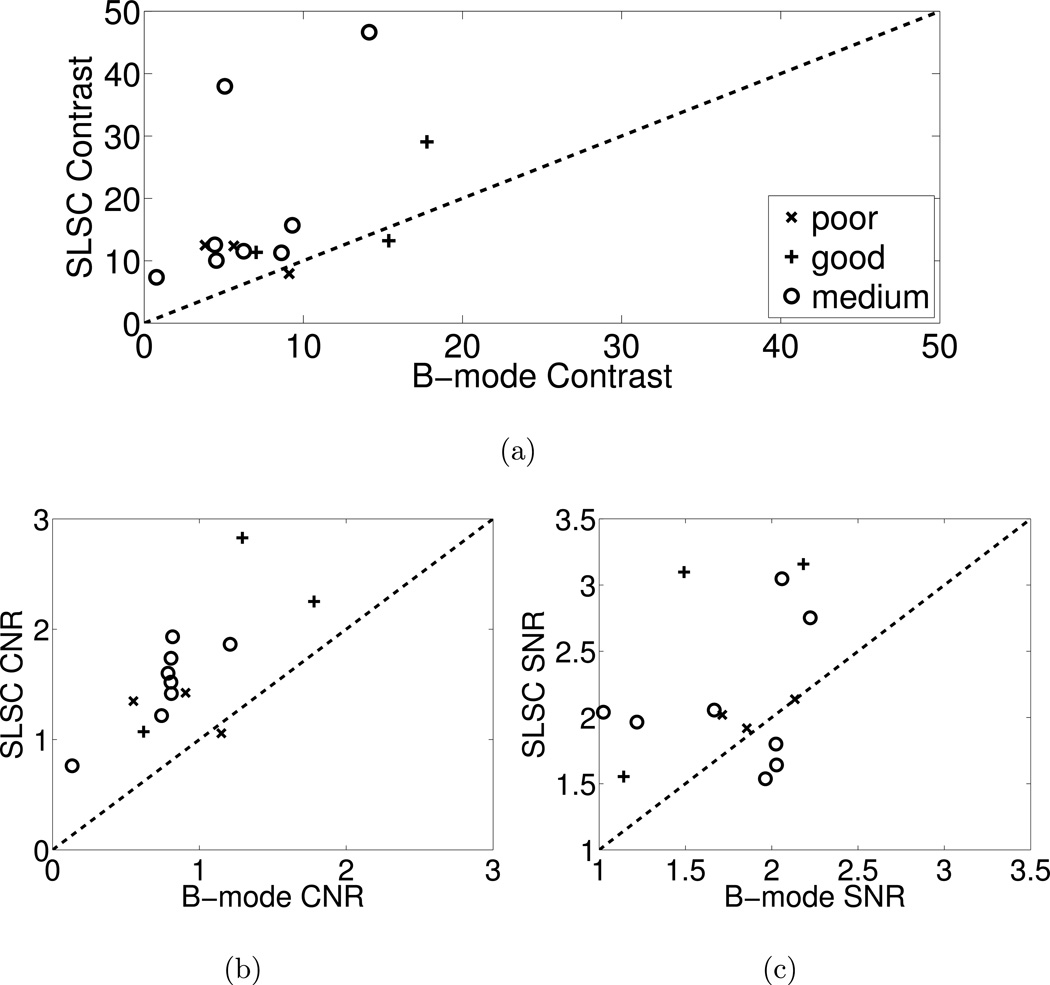
The comparative performance of B-mode and SLSC images from all volunteers was measured using contrast, CNR, and SNR metrics. These performance metrics were measured in matched B-mode and SLSC images from each volunteer. Matched values are compared in the scatter plots of Fig. 5 and categorized by the B-mode image quality determined from the endocardial visibility scores (i.e. good, medium, or poor). B-mode performance is displayed on the abscissa axis, and SLSC performance is displayed on the ordinate axis. Values above the dashed line indicate improvement with SLSC imaging. Note that contrast, CNR, and SNR are mostly improved in SLSC images for each of the three image quality categories.
Figure 5.
Scatter plots of (a) contrast, (b) CNR, and (c) SNR measured in B-mode and SLSC images from the 14 volunteers. The data points are categorized by the B-mode image quality determined from the endocardial visibility scores (i.e. good, medium, or poor). Data points above the dashed line indicate better contrast, CNR, or SNR in the SLSC image compared to the matched B-mode image. The SLSC values were calculated with M = 6.
The means of measured contrast, CNR, and SNR values are 17 dB, 1.6, and 2.2, respectively, in the SLSC images and 8 dB, 0.9, and 1.8, respectively, in the B-mode images. Thus, in the SLSC images, the average contrast is improved by 9 dB (p=0.007, Cohen's d = 1.0), the average CNR is improved by 0.7 (p=0.00001, Cohen's d = 1.5), and the average SNR is improved by 0.4 (p=0.02, Cohen's d = 0.9). The ranges of contrast, CNR, and SNR improvement with SLSC imaging were −2 dB to 33 dB, −0.1 to 1.5, and −0.4 to 1.6, respectively.
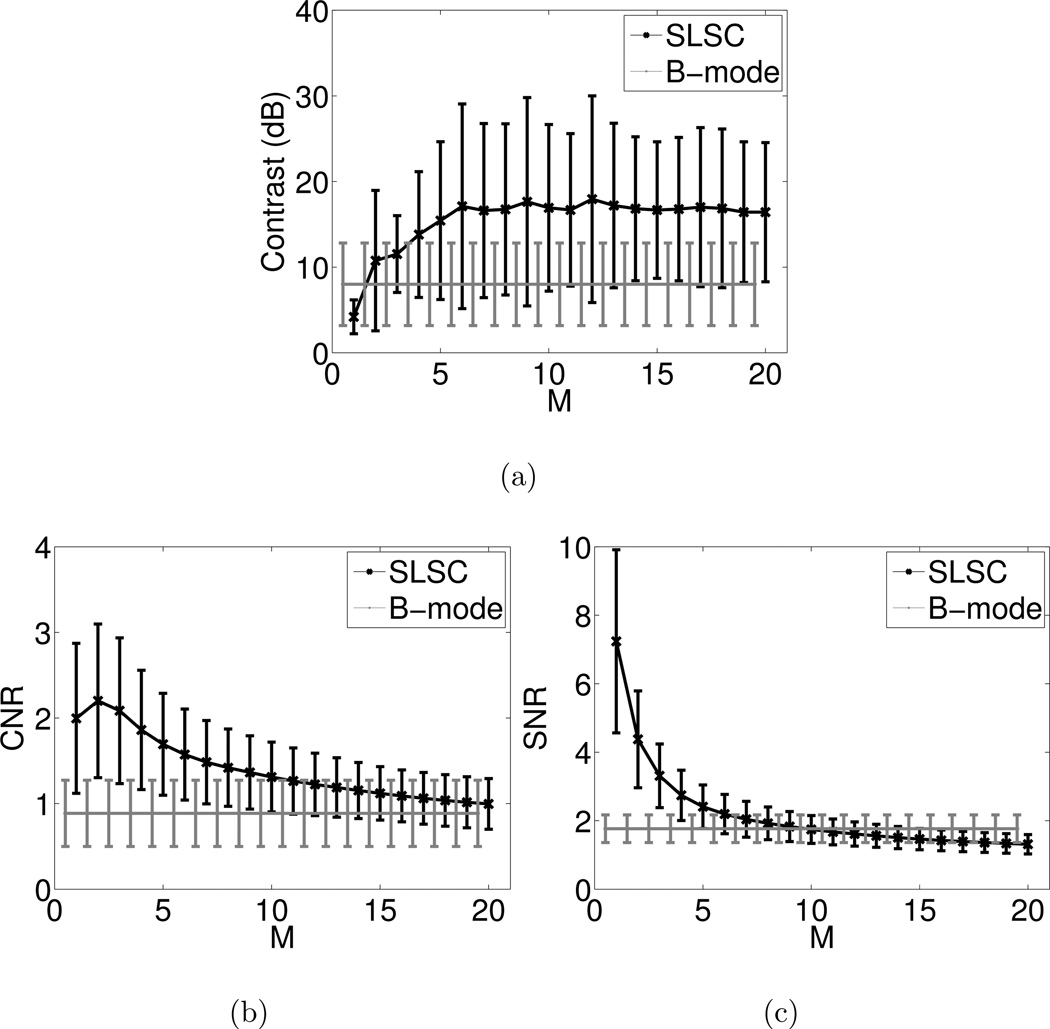
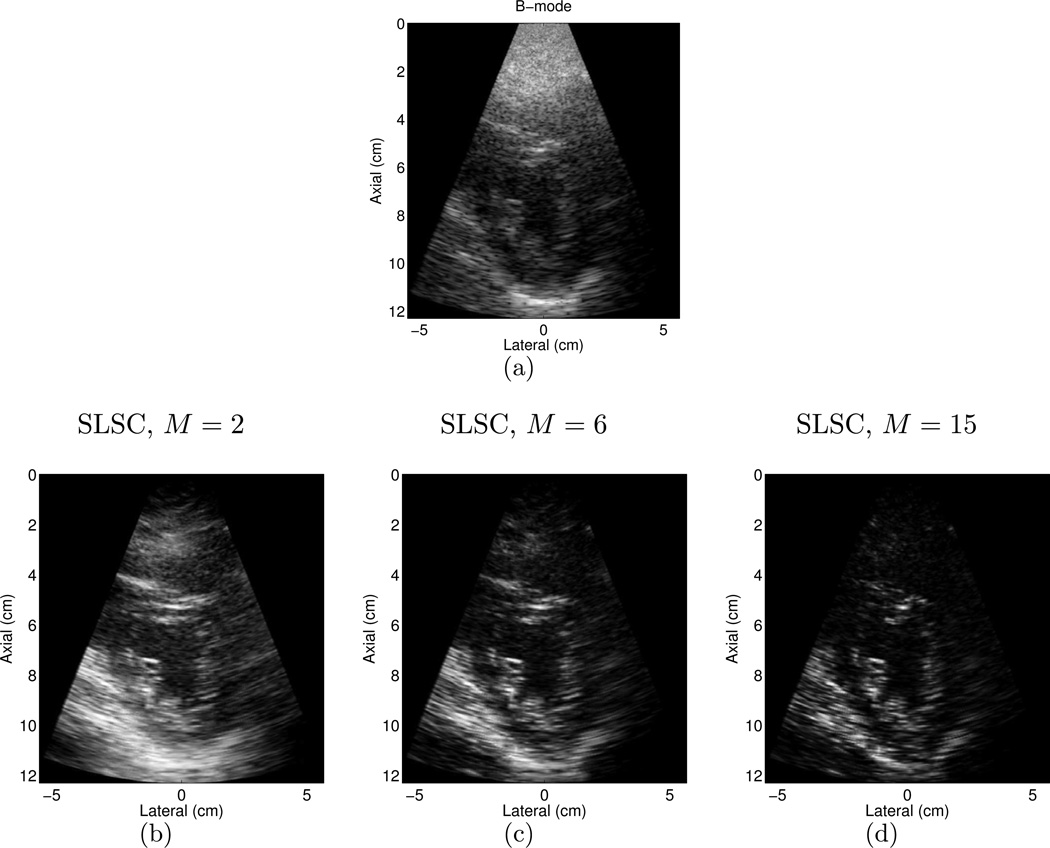
The performance metrics were measured as a function of the short-lag value M in SLSC images from the fourteen volunteers. Fig. 6 illustrates that as M is increased, the mean contrast increases for M < 6 then remains constant for M ≥ 6, the mean SNR decreases, and the mean CNR increases when M ranges from 1 to 2 and decreases for M > 2. The mean and standard deviation of B-mode measurements are shown as a reference. A value of M = 6 was chosen to display images throughout this paper (unless other wise stated), to compare performance metrics in Fig. 5, and to make the cine loops that were reviewed, because it is the lowest short-lag value with the best average contrast. Higher values of M have poorer CNR and SNR. Examples of three SLSC images formed with different values of M and the matched B-mode image are shown in Fig. 7. Note the changes in contrast, CNR, and SNR as M is varied. Lateral resolution is also improved as M increases.
Figure 6.
Mean (a) contrast, (b) CNR, and (c) SNR measured in SLSC images from the 14 volunteers, as a function of the short-lag value M. B-mode measurements are shown as a reference. Error bars indicate ± one standard deviation from the mean.
Figure 7.
(a) B-mode image of the LV of volunteer 14, and matched SLSC images created with (a) M = 2, (b) M = 6, and (c) M = 15. Note the changes in contrast, CNR, SNR, and resolution as M is varied. The B-mode image is shown with 50 dB dynamic range, while the SLSC images are shown on a linear scale ranging from 0 to 95% of the maximum value.
Observer Reviews for the Short-Axis Views
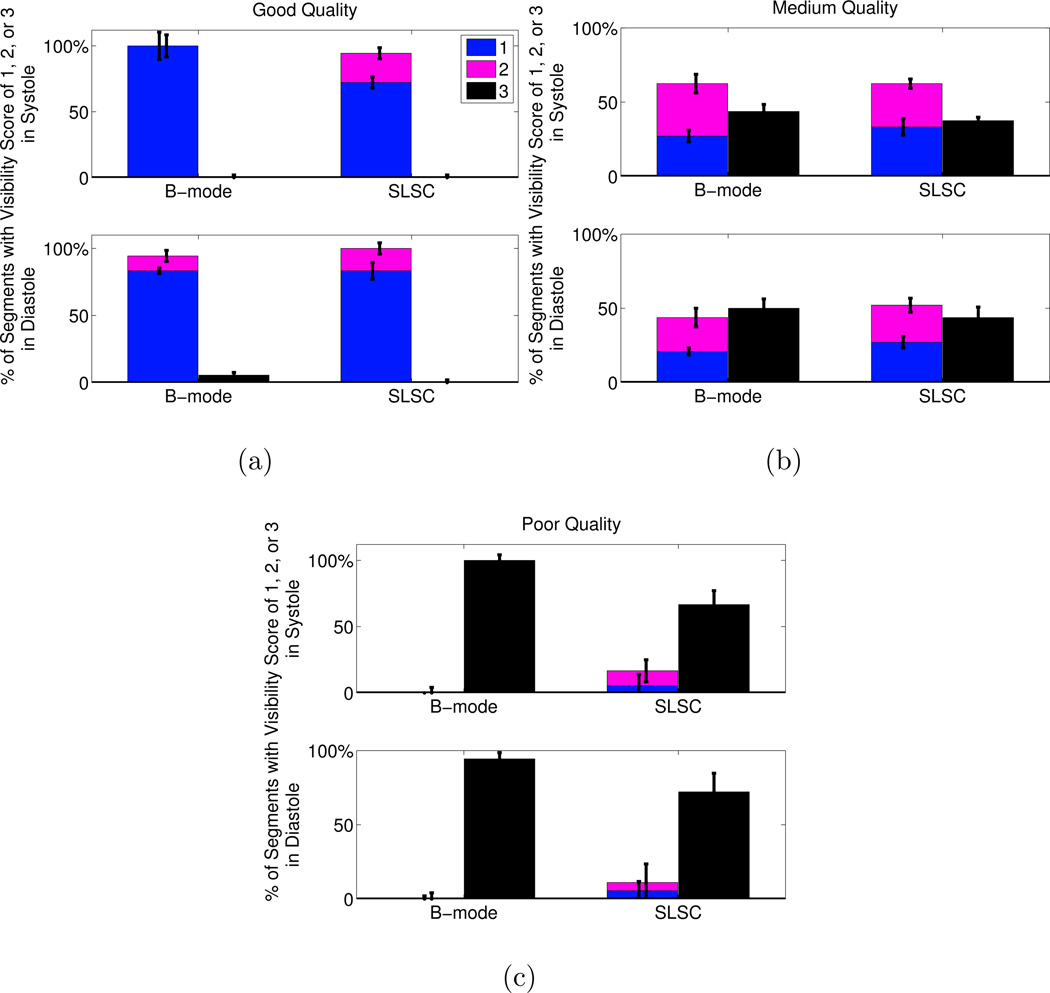
A summary of the scores assigned to each segment in the short axis view is displayed in Fig. 8. Improvement in segment visibility between B-mode and SLSC results is indicated by an increase in the height of the bars labeled with scores of 1 (clearly visible) and 2 (poorly visible), for each image quality category in systole or diastole. Improvement is also indicated by a decrease in the height of the bars labeled with a score of 3 (segments not visible). The greatest improvement with SLSC imaging was observed in poor-quality B-mode images, where the percentage of segments not visualized with B-mode imaging decreased by 33% and 22% in systole and diastole, respectively (p < 0.05). In good- and medium-quality images, there were no statistically significant improvements (i.e. no statistically significant differences in the height of the bars labeled with 1, 2, or 3).
Figure 8.
Visibility of the segments in the short axis view of the LV. The images were separated by B-mode image quality (good, medium, poor). The number of segments with each visibility score (1=clearly seen, 2=poorly seen, 3=not visible) is expressed as a percentage of the total number of segments in each image quality category. The height of the bars represent the median of the three independent observers and the error bars show the interquartile range for each score category in each image quality category in sytole and diastole. The p-values were (a) 1 in systole and diastole in good quality images, (b) 0.45 and 0.64 in systole and diastole, respectively, in medium quality images, and (c) 0.047 and 0.0078 in systole and diastole, respectively, in poor quality images. The kappa statistics indicate fair agreement among the reviewers (κ = 0.30).
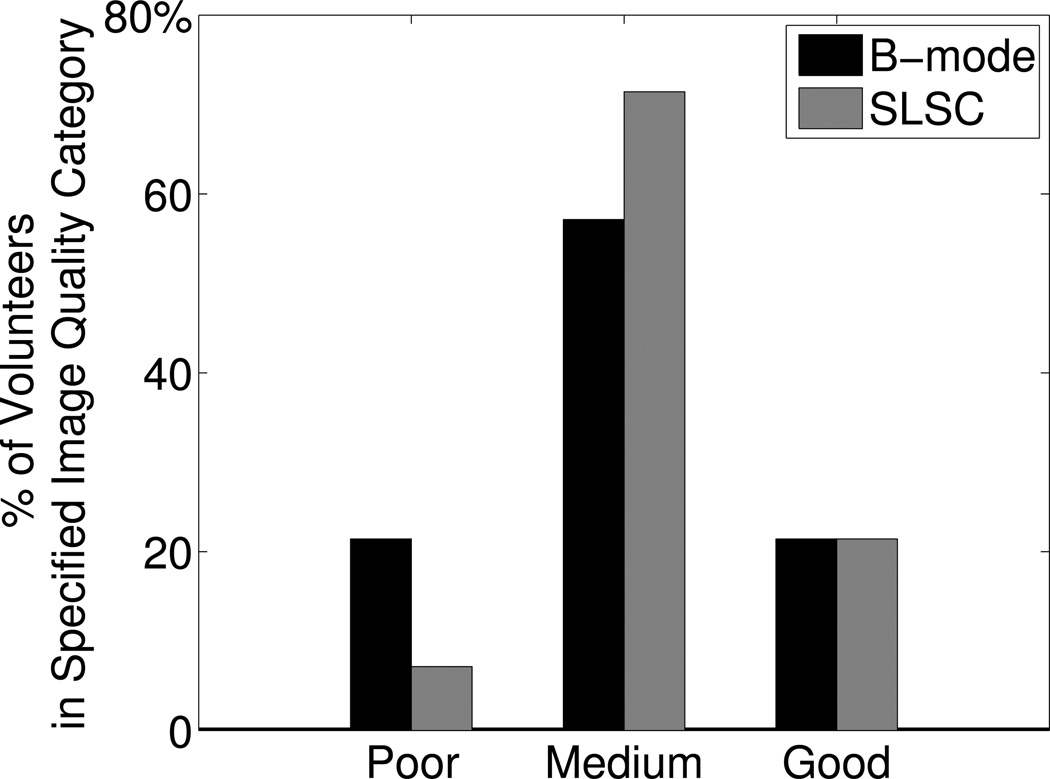
To compare the percentage of volunteers with poor-quality B-mode images to those with poor-quality SLSC images, the volunteers were separated according to SLSC image quality, using the same criteria described for separations based on B-mode image quality. The number of volunteers with poor, medium, and good quality SLSC images was 1, 10, and 3, respectively. Thus, in data from the short-axis views of the LV, SLSC imaging lowered the percentage of volunteers with poor quality images from 21% to 7%, increased the percentage of volunteers with medium quality images from 57% to 71%, and did not change the percentage of volunteers with good quality images, as shown in Fig. 9. Supplemental videos were submitted with this manuscript to show cine loops of matched B-mode and SLSC images from the short axis views of two volunteers. Supplemental Video #1 shows good quality B-mode and SLSC images, while Supplemental Video #2 shows poor quality B-mode images and medium quality SLSC images.
Figure 9.
Percentage of volunteers in each image quality category, as defined by the number of visible segments in B-mode or SLSC images of the LV short axis view. Good quality was defined as 80% or more of the endocardial segments were visualized (score = 1 or 2) by the three reviewers in systole and diastole. Poor quality was defined as 80% or more of the endocardial segments could not be visualized (score = 3) by the three reviewers in systole or diastole. Medium quality was neither poor nor good quality. SLSC imaging decreased the percentage of volunteers with poor quality images.
Apical Four Chamber Views
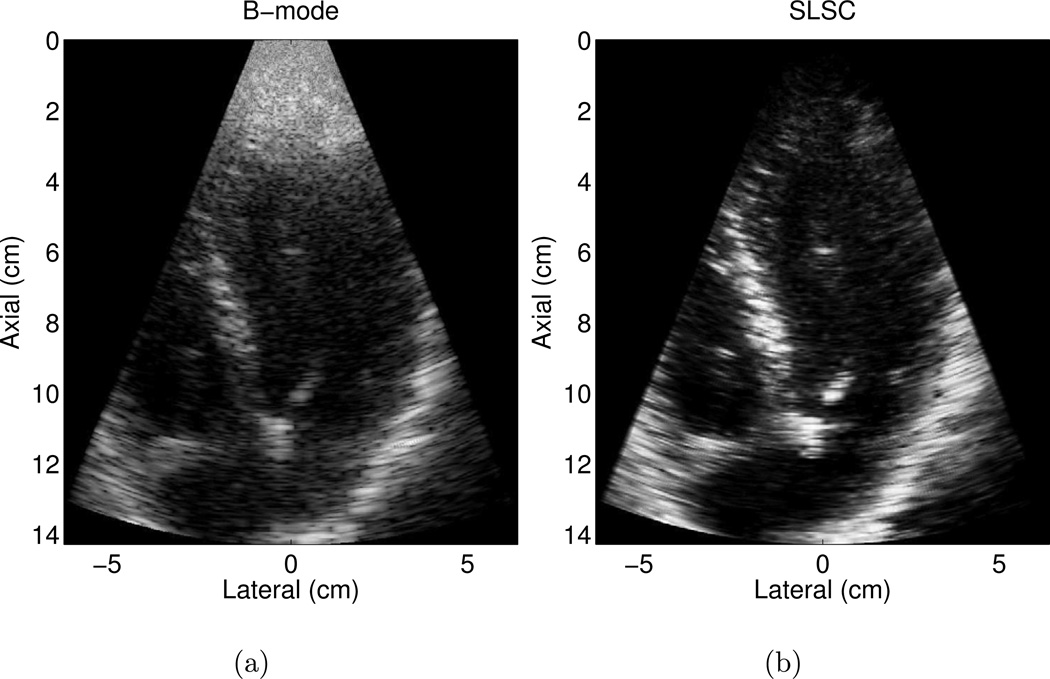
Matched B-mode and SLSC images of an apical four chamber view from one volunteer are shown in Fig. 10 (a) and (b), respectively. The images display a portion of chordae tendineae in the LV. The clutter in the near field obscures the apical endocardium segments. The three reviewers rated the apical cap as not visible (score = 3) in the B-mode image. Reviewers 1 and 2 observed better visualization of this segment (score = 2) in the SLSC image, while Reviewer 3 recorded no difference.
Figure 10.
Apical four chamber view of the left ventricle of volunteer 3 in matched (a) B-mode and (b) SLSC images. The endocardial borders are more clearly defined, particularly in the near field. The transmit focus was 8.3 cm. The B-mode image is shown with 50 dB dynamic range, while the SLSC image is shown on a linear scale ranging from 0 to 95% of the maximum value.
The three reviewers also noted that the three lateral segments (apical lateral, mid anterolateral, and basal anterolateral) were not visualized in the B-mode image. In the SLSC images, these three segments maintained no visibility by Reviewer 1 (score = 3) and were poorly visualized by Reviewer 2 (score = 2). Reviewer 3 recorded poor visibility (score = 2) of the apical lateral segment in the SLSC image during systole, but the other two lateral segments were rated as not visible by this reviewer.
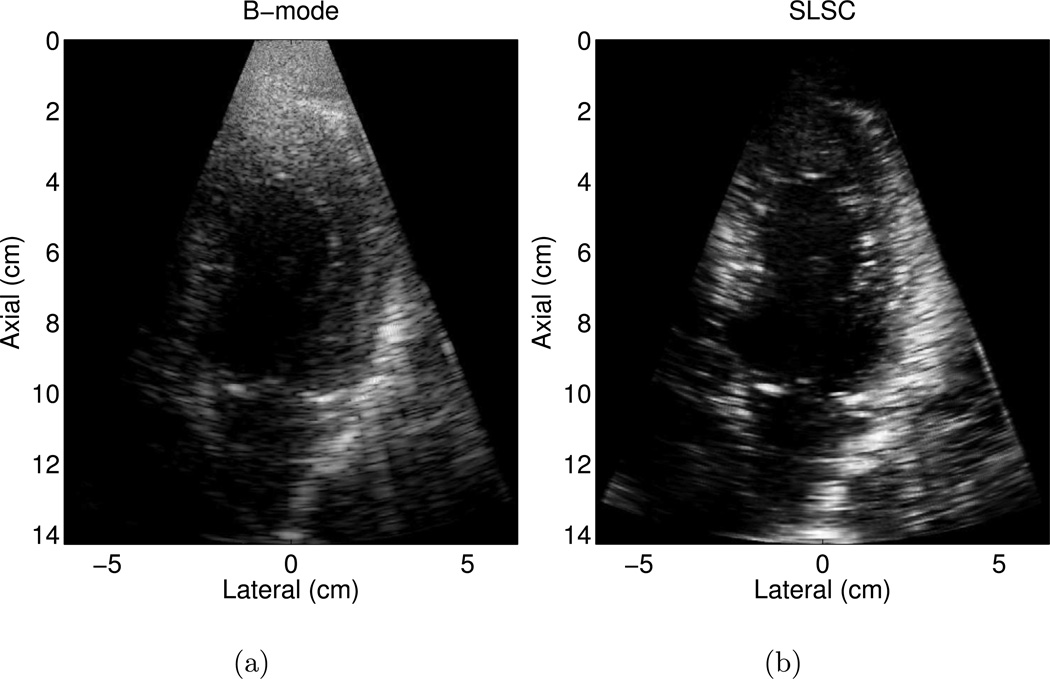
Matched B-mode and SLSC images of an apical four chamber view from another volunteer are shown in Fig. 11 (a) and (b), respectively. These images include a portion of chordae tendineae in the LV. Visibility of the apical segments is obscured by the presence of clutter in the near-field. Reviewers 1 and 3 rated the apical cap, apical septum, and mid inferoseptum as not visible with B-mode imaging during diastole (score = 3). With SLSC imaging, these segments maintained no visibility by Reviewer 3 (score = 3) and were poorly visualized by Reviewer 1 (score = 2). However, Reviewer 2 rated these three segments with the same visibility in B-mode and SLSC images (2, 2, and 1, respectively).
Figure 11.
Apical four chamber view of the left ventricle of volunteer 2 in matched (a) B-mode and (b) SLSC images. There is reduced clutter in the near field of the SLSC image, and the basal lateral segment appears to be missing in the SLSC image compared to the B-mode image (see Supplemental Video #3 for cine loops of these images). The transmit focus was 8.3 cm. The B-mode image is shown with 50 dB dynamic range, while the SLSC image is shown on a linear scale ranging from 0 to 95% of the maximum value.
It is interesting to note that the three reviewers visualized (score = 1 or 2) the basal lateral segment in the B-mode and SLSC cine loops represented in Fig. 11, but when the images are viewed side-by-side, the segment appears to be missing in the SLSC image. Two of the reviewers rated this segment with equal visibility in the B-mode and SLSC images, while one reviewer recorded that this segment was better visualized in the SLSC image. Supplemental Video #3 was submitted with this manuscript to show cine loops of these images.
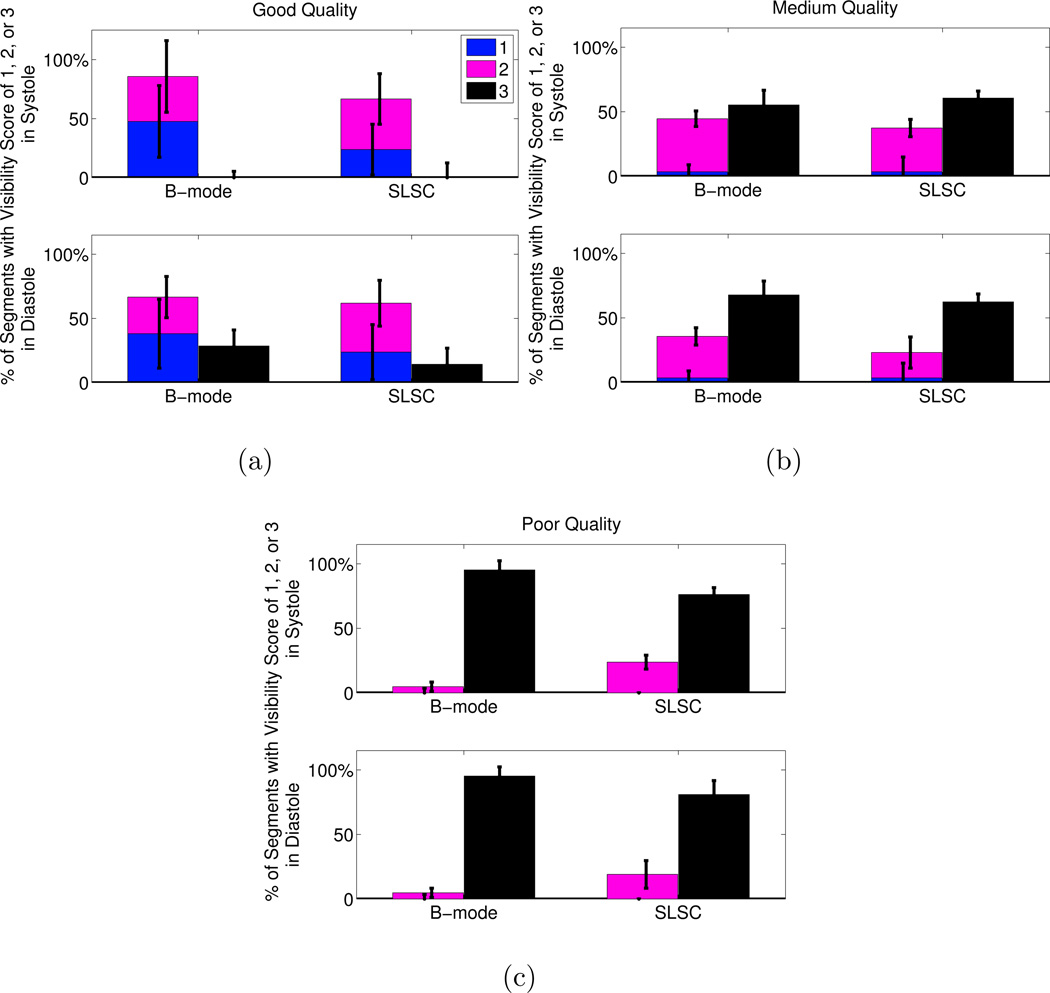
A summary of the scores assigned to each segment in the apical four chamber view is displayed in Fig. 12. The greatest improvement with SLSC imaging was observed in poor-quality B-mode images during systole, where the percentage of segments not visualized with B-mode imaging decreased by 19%, however the p-value of 0.06 indicates that this result is not statistically significant. In good- and medium-quality images, there were no statistically significant differences between endocardial border visualization with B-mode and SLSC images (p ≫ 0.05).
Figure 12.
Visibility of the segments in the apical four chamber view of the LV. The images were separated by B-mode image quality (good, medium, poor). The number of segments with each visibility score (1=clearly seen, 2=poorly seen, 3=not visible) is expressed as a percentage of the total number of segments in each image quality category. The height of the bars represent the median of the three independent observers and the error bars show the interquartile range for each score category in each image quality category in sytole and diastole. The p-values were (a) 0.50 and 1 in systole and diastole, respectively, in good quality images, (b) 0.55 and 0.35 in systole and diastole, respectively, in medium quality images, and (c) 0.06 and 0.25 in systole and diastole, respectively, in poor quality images. The kappa statistics indicate fair agreement among the reviewers (κ = 0.21).
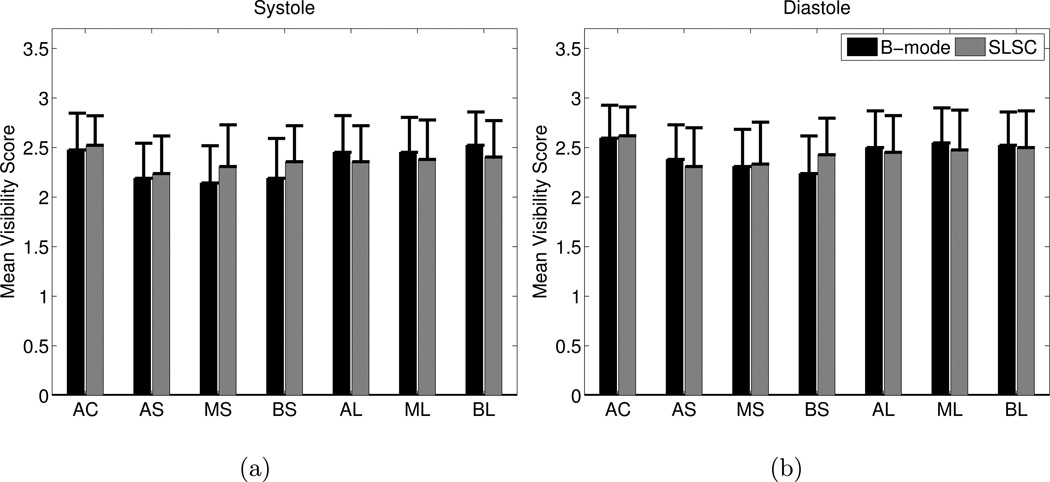
The mean of the visibility scores (1=clearly seen, 2=poorly seen, 3=not visible) for the apical four chamber views are reported in Fig. 13. The means ranged from 2.1 to 2.6, indicating that a majority of these apical views contained segments that were not visible or poorly visible. Differences between B-mode and SLSC mean visibility scores were not statistically significant.
Figure 13.
The mean of the visibility scores (1=clearly seen, 2=poorly seen, 3=not visible) of each segment in B-mode and SLSC images of the apical four chamber view in (a) systole and (b) diastole. AC=apical cap, AS=apical septum, MS=mid inferoseptum, BS=basal inferoseptum, AL=apical lateral, ML=mid anterolateral, and BL=basal anterolateral. The p values exceed 0.05 for all segments in systole and diastole, indicating no statistically significant differences.
Discussion
Improvements with and Limitations of SLSC Imaging
Examples of patients that are difficult to image with conventional B-mode beamforming methods (Figs. 2 and 4) are contrasted with examples from a less challenging patient (Fig. 3). Clutter is noticeably reduced in the matched SLSC images. Clutter reduction was observed in a majority of SLSC images from the fourteen volunteers, as evidenced by the improved contrast values reported in Fig. 5 (a). These results suggest that SLSC imaging has the potential to reduce clutter when conventional beamforming methods produce good, medium, or poor B-mode image quality. Although clutter was reduced and contrast was improved in medium- and good-quality B-mode images, no statistically significant differences in segment visibility were observed in these cases.
Statistically significant improvements in segment visibility were observed in the short-axis views of patients with poor-quality B-mode images, as illustrated in Fig. 8(c), where SLSC imaging decreased the percentage of myocardial segments not visualized with B-mode imaging by 22–33%. These results indicate that SLSC imaging improves endocardial border visibility in poor-quality B-mode images without degrading that of medium and good quality images. The percentage of volunteers with poor quality images decreased from 21% with B-mode imaging to 7% with SLSC imaging, as shown in Fig. 9.
When low-amplitude signals are adjacent to structures with higher amplitudes, the coherence of the lower amplitude signal is decreased relative to that of the higher amplitude signal, thus providing a source of contrast in SLSC images. This occurs because the off-axis reflections from the higher-amplitude structures add incoherently with the on-axis reflections from the lower amplitude structures (Lediju et al., 2011). With regard to implications for endocardial border detection, this effect can be beneficial in the presence of the mitral valve (e.g. Fig. 3) and detrimental in the presence of a bright pericardium (e.g. Fig. 11).
In SLSC images, there is a known trade-off among contrast, CNR, SNR, and lateral resolution that varies with the selected short-lag value, M (Lediju et al., 2011). Although resolution is degraded at lower values of M, the spatial correlation between structures in SLSC and B-mode images is expected to be similar if the value of M is increased to optimize resoluion, as illustrated in Fig. 7 and demonstrated with theoretical predictions and simulated and experimental results in initial publications on SLSC imaging (Lediju et al., 2011; Dahl et al., 2011). However, while selecting the highest short-lag value offers the best resolution, the CNR and SNR are degraded at higher values of M, as shown in Fig. 6. The variation in these measurements as a function of M is likely due to the increased spatial frequency content with the inclusion of more lags (Lediju et al., 2011).
Study Limitations
B-mode and SLSC endocardial segment scores were based on visual semi-quantitative estimates, introducing a degree of reviewer subjectivity. Yet, statistically significant improvements with SLSC imaging of poor-quality B-mode data were achieved with the subjective analysis. In addition, objective measurements of contrast, CNR, and SNR were performed on the raw data. Additional contrast enhancement and improvements in endocardial border detection may have been achieved with harmonic data (Becher et al., 1998; Kasprzak et al., 1999; Dahl et al., 2012).
Contrast, CNR, and SNR measurements were potentially biased toward B-mode images, particularly for the volunteers with poor-quality B-mode images, because the image selection criteria for calculating these performance metrics was based on B-mode images. An alternative would have been to select good SLSC images and make comparisons to matched B-mode images created from the same data. This choice would likely improve the contrast and CNR measurements of SLSC images. However, to prevent bias toward SLSC imaging, selections were based on B-mode images. In addition, the size of the ROIs used to calculate these measurements was limited by the size of the left ventricle. If larger ROIs could be used, the measurements would be independent of additional image statistics (e.g. number of speckles in each ROI and the spacing between them), and the results would be more accurate. Despite the ROI size limitations and the potential biases toward B-mode imaging, the SLSC measurements outperformed B-mode measurements in a majority of cases.
Although segment visibility, contrast, CNR, and SNR were quantitatively assessed in B-mode and SLSC images, it is difficult to quantify resolution. SLSC resolution is dependent on an array of factors, including target size and location, short-lag value (M), and the magnitude of clutter noise present (Lediju Bell et al., 2011).
Prospective studies with larger numbers of patients are required to fully assess the clinical role of SLSC imaging. For example, the high mean visibility scores in Fig. 13 indicate that there were few images with visible segments in the apical four chamber views. This is likely due to the presence of clutter in B-mode images. In SLSC images, the poor visibility is due to a complicated combination of the presence of bright extracardiac scatterers, the absence of intracardiac structures in the image plane, and the location of the focus. The poor visibility in SLSC images is also potentially due to the low SNR of the channel signals as a result of the high-amplitude clutter signals (Dahl et al., 2012). Nonetheless, the examples presented in Figs. 10 and 11 show improved endocardial visualization in the apical segments in the presence of high-amplitude clutter.
Note that the apical 4-chamber systolic results in Fig. 12 (c) are statistically significant at a significance level of 10% (p < 0.1), while conclusions about other results remain the same at this higher significance level. It is promising that statistical significance is achieved at the 10% significance level with the limited number of visible segments and the small sample size of 3 volunteers in the poor-quality image category.
Real-time Feasibility
Although one frame of data was acquired and processed in approximately 2s, real-time SLSC imaging requires faster processing times, which could potentially be achieved with optimized correlation algorithms, advanced processors, and graphics processing unit (GPU)-based computing. With access to real-time SLSC imaging, the sonographer or cardiologist performing a scan would have the ability to adjust the short-lag value (M) to optimize SLSC images.
Clinical Implications
Visualization of endocardial borders is essential to determining LV function. In several studies, 50–64% of patients had inadequate visualization of the heart and the LV endocardial border, resulting in inconclusive diagnoses of abnormal cardiac conditions, such as congestive heart failure, endocarditis, mitral regurgitation, thrombi, and aortic dissection (Pavlides et al., 1990; Hwang et al., 1993; Heidenreich et al., 1999).
SLSC imaging reduces clutter and significantly improves endocardial visualization of the LV short axis view in patients with poor-quality B-mode images. Thus, there is potential for SLSC imaging to improve qualitative clinical assessments of LV function. There may also be potential to improve cardiac measurements that rely on endocardial border detection, such as volume, mass, and ejection fraction. In addition, the reduced clutter in the near field region of the apical four chamber views suggests that SLSC might be a preferred method for imaging apical cardiac masses like tumors or thrombi.
Conclusion
Short-lag spatial coherence imaging improves endocardial border detection when B-mode images contain a majority of poorly-visualized endocardial segments due to clutter. Quantitative metrics revealed better contrast, CNR, and SNR with SLSC imaging in most patients. Three cardiology fellows reviewed and scored the images independently, and their scores revealed that SLSC imaging lowered the percentage of volunteers with poor quality images from 21% to 7%. This work demonstrates SLSC imaging's potential to reduce cardiac clutter, clarify endocardial borders, and thereby enhance subjective analyses of left ventricular function. There is also potential to improve visualization of cardiac abnormalities and calculations of border-dependent cardiac performance metrics.
Supplementary Material
Figure 1: Video of good quality B-mode cine loop and matched SLSC cine loop from the short axis view of the left ventricle of volunteer 4. B-mode images are shown with 50 dB dynamic range, while SLSC images are shown on a linear scale ranging from 0 to 95% of the maximum value. SLSC images were created with M = 6.
Figure 2: Video of poor quality B-mode cine loop and matched medium-quality SLSC cine loop from the short axis view of the left ventricle of volunteer 13. B-mode images are shown with 50 dB dynamic range, while SLSC images are shown on a linear scale ranging from 0 to 95% of the maximum value. SLSC images were created with M = 6.
Figure 3: Video of matched B-mode and SLSC cine loops from the apical four-chamber view of the left ventricle of volunteer 2. B-mode and M-mode images are shown with 50 dB dynamic range, while SLSC images are shown on a linear scale ranging from 0 to 95% of the maximum value. SLSC images were created with M = 6.
Acknowledgements
This work was supported by the UNCF-Merck Graduate Science Research Dissertation Fellowship and NIH Grants R37-HL096023 and R01-EB013661. Special thanks to Dongwoon Hyun, Vaibhav Kakkad, and Mark Palmeri for assistance with various clinical study preparation tasks and to cardiology fellows Prateeti Khazanie and Sreekanth Vemulapalli for scoring the images.
Footnotes
Publisher's Disclaimer: This is a PDF file of an unedited manuscript that has been accepted for publication. As a service to our customers we are providing this early version of the manuscript. The manuscript will undergo copyediting, typesetting, and review of the resulting proof before it is published in its final citable form. Please note that during the production process errors may be discovered which could affect the content, and all legal disclaimers that apply to the journal pertain.
References
- Al-Mansour H, Mulvagh S, Pumper G, Klarich K, Foley D. Usefulness of harmonic imaging for left ventricular opacification and endocardial border delineation by optison. The American Journal of Cardiology. 2000;856:795–799. doi: 10.1016/s0002-9149(99)00868-1. [DOI] [PubMed] [Google Scholar]
- Bamber J, Mucci R, Orofino D. Spatial Coherence and Beamformer Gain. Acoustical Imaging. 2000;24:43–48. [Google Scholar]
- Becher H, Tiemann K, Schlosser T, Pohl C, Nanda N, Averkiou M, Powers J, Luderitz B. Improvement in endocardial border delineation using tissue harmonic imaging. Echocardiography. 1998;155:511–517. doi: 10.1111/j.1540-8175.1998.tb00642.x. [DOI] [PubMed] [Google Scholar]
- Bezante G, Rosa G, Bruni R, Chen X, Villa G, Scopinaro A, Balbi M, Barsotti A, Schwarz K. Improved assessment of left ventricular volumes and ejection fraction by contrast enhanced harmonic color Doppler echocardiography. The International Journal of Cardiovascular Imaging (formerly Cardiac Imaging) 2005;216:609–616. doi: 10.1007/s10554-005-4519-2. [DOI] [PubMed] [Google Scholar]
- Caiati C, Zedda N, Montaldo C, Montisci R, Iliceto S. Contrast-enhanced transthoracic second harmonic echo doppler with adenosine A noninvasive, rapid and effective method for coronary flow reserve assessment. Journal of the American College of Cardiology. 1999;341:122–130. doi: 10.1016/s0735-1097(99)00164-3. [DOI] [PubMed] [Google Scholar]
- Cardillo G. Fleisses kappa: compute the Fleiss'es kappa for multiple raters. 2007 URL http://www.mathworks.com/matlabcentral/fileexchange/15426. [Google Scholar]
- Chirillo F, Pedrocco A, De Leo A, Bruni A, Totis O, Meneghetti P, Stritoni P. Impact of harmonic imaging on transthoracic echocardiographic identification of infective endocarditis and its complications. British Medical Journal. 2005;913:329–333. doi: 10.1136/hrt.2003.031583. [DOI] [PMC free article] [PubMed] [Google Scholar]
- Cloutier G, Chen D, Durand L. A new clutter rejection algorithm for Doppler ultrasound. IEEE Transactions on Medical Imaging. 2003;224:530–538. doi: 10.1109/TMI.2003.809059. [DOI] [PubMed] [Google Scholar]
- Dahl J, Jakovljevic M, Pinton G, Trahey G. Harmonic spatial coherence imaging: an ultrasonic imaging method based on backscatter coherence. Ultrasonics, Ferroelectrics and Frequency Control, IEEE Transactions on. 2012;594:648–659. doi: 10.1109/TUFFC.2012.2243. [DOI] [PMC free article] [PubMed] [Google Scholar]
- Dahl JJ, Hyun D, Lediju MA, Trahey GE. Lesion detectability in diagnostic ultrasound with short-lag spatial coherence imaging. Ultrasonic Imagaing. 2011;332:119. doi: 10.1177/016173461103300203. [DOI] [PMC free article] [PubMed] [Google Scholar]
- Fedewa RJ, Wallace KD, Holland MR, Jago JR, Ng GC, Rielly MR, Robinson BS, Miller JG. Spatial coherence of the nonlinearly generated second harmonic portion of backscatter for a clinical imaging system. IEEE Transactions on Ultrasonics, Ferroelectrics and Frequency Control. 2003;508:1010–1022. doi: 10.1109/tuffc.2003.1226545. [DOI] [PubMed] [Google Scholar]
- Gallippi C, Trahey G. Adaptive clutter filtering via blind source separation for two-dimensional ultrasonic blood velocity measurement. Ultrasonic Imaging. 2002;244:193–214. doi: 10.1177/016173460202400401. [DOI] [PubMed] [Google Scholar]
- Hanrath P. Transoesophageal echo-Doppler in cardiology. British Medical Journal. 2001;865:586–592. doi: 10.1136/heart.86.5.586. [DOI] [PMC free article] [PubMed] [Google Scholar]
- Heidenreich PA, Masoudi FA, Maini B, Chou TM, Foster E, Schiller NB, Owens DK. Echocardiography in patients with suspected endocarditis: A cost-effectiveness analysis. Am J Med. 1999;1073:198–208. doi: 10.1016/s0002-9343(99)00216-8. [DOI] [PubMed] [Google Scholar]
- Hinkelman L, Szabo T, Waag R. Measurements of ultrasonic pulse distortion produced by human chest wall. The Journal of the Acoustical Society of America. 1997;101:2365. doi: 10.1121/1.418248. [DOI] [PubMed] [Google Scholar]
- Hwang JJ, Shyu KG, Chen JJ, Tseng YZ, Kuan P, Lien WP. Usefulness of transesophageal echocardiography in the treatment of critically ill patients. Chest. 1993;1043:861–866. doi: 10.1378/chest.104.3.861. [DOI] [PubMed] [Google Scholar]
- Kasprzak J, Paelinck B, Ten Cate F, Vletter W, de Jong N, Poldermans D, Elhendy A, Bouakaz A, Roelandt J. Comparison of native and contrast-enhanced harmonic echocardiography for visualization of left ventricular endocardial border. The American Journal of Cardiology. 1999;832:211–217. doi: 10.1016/s0002-9149(98)00826-1. [DOI] [PubMed] [Google Scholar]
- Landis J, Koch G. The measurement of observer agreement for categorical data. Biometrics. 1977:159–174. [PubMed] [Google Scholar]
- Lang R, Bierig M, Devereux R, Flachskampf F, Foster E, Pellikka P, Picard M, Roman M, Seward J, Shanewise J, Solomon S, Spencer K, Sutton M, Stewart W. Recommendations for chamber quantification: a report from the american society of echocardiography's guidelines and standards committee and the chamber quantification writing group, developed in conjunction with the european association of echocardiography, a branch of the european society of cardiology. Journal of the American Society of Echocardiography: official publication of the American Society of Echocardiography. 2005;1812:1440. doi: 10.1016/j.echo.2005.10.005. [DOI] [PubMed] [Google Scholar]
- Lediju MA, Byram BC, Trahey GE. Sources and characterization of clutter in cardiac b-mode images. Proceedings of the IEEE Ultrasonics Symposium. 2009a:1419–1422. [Google Scholar]
- Lediju MA, Pihl MJ, Dahl JJ, Trahey GE. Quantitative assessment of the magnitude, impact, and spatial extent of ultrasonic clutter. Ultrasonic Imaging. 2008;303:151–168. doi: 10.1177/016173460803000302. [DOI] [PMC free article] [PubMed] [Google Scholar]
- Lediju MA, Pihl MJ, Hsu SJ, Dahl JJ, Gallippi CM, Trahey GE. A motion-based approach to abdominal clutter reduction. IEEE Transactions on Ultrasonics, Ferroelectrics and Frequency Control. 2009b;5611:2437. doi: 10.1109/TUFFc.2009.1331. [DOI] [PMC free article] [PubMed] [Google Scholar]
- Lediju MA, Trahey GE, Byram BC, Dahl JJ. Short-Lag Spatial Coherence of Backscattered Echoes: Imaging Characteristics. IEEE Transactions on Ultrasonics, Ferroelectrics and Frequency Control. 2011;587:1337. doi: 10.1109/TUFFC.2011.1957. [DOI] [PMC free article] [PubMed] [Google Scholar]
- Lediju Bell MA, Dahl JJ, Trahey GE. Comparative Resolution and Tracking Performance in B-mode and Short-Lag Spatial Coherence (SLSC) Images. Proceedings of the IEEE Ultrasonics Symposium. 2011:1985–1988. [Google Scholar]
- Mauldin F, Lin D, Hossack J. The singular value filter: A general filter design strategy for pca-based signal separation in medical ultrasound imaging. IEEE Transactions on Medical Imaging. 2011;99:1–1. doi: 10.1109/TMI.2011.2160075. [DOI] [PMC free article] [PubMed] [Google Scholar]
- Mele D, Soukhomovskaia O, Pacchioni E, Merli E, Avigni N, Federici L, Levine R, Ferrari R. Improved detection of left ventricular thrombi and spontaneous echocontrast by tissue harmonic imaging in patients with myocardial infarction. Journal of the American Society of Echocardiography. 2006;1911:1373–1381. doi: 10.1016/j.echo.2006.05.011. [DOI] [PubMed] [Google Scholar]
- Moir S, Marwick T. Combination of contrast with stress echocardiography: A practical guide to methods and interpretation. Cardiovascular Ultrasound. 2004;21 doi: 10.1186/1476-7120-2-15. [DOI] [PMC free article] [PubMed] [Google Scholar]
- Muir T, Carstensen E. Prediction of nonlinear acoustic effects at biomedical frequencies and intensities. Ultrasound in Medicine and Biology. 1980;64:345–357. doi: 10.1016/0301-5629(80)90004-6. [DOI] [PubMed] [Google Scholar]
- Ophir J, Parker K. Contrast agents in diagnostic ultrasound. Ultrasound in Medicine and Biology. 1989;154:319–333. doi: 10.1016/0301-5629(89)90044-6. [DOI] [PubMed] [Google Scholar]
- Patel A, Moorthy A, Yap V, Thomsen J. Cardiac metastasis from transitional cell carcinoma: a subtle echocardiographic entity. Journal of Clinical Ultrasound. 1980;81 doi: 10.1002/jcu.1870080111. [DOI] [PubMed] [Google Scholar]
- Pavlides GS, Hauser AM, Stewart JR, O'Neill WW, Timmis GC. Contribution of transesophogeal echocardiography to patient diagnosis and treatment: A prospective analysis. American Heart Journal. 1990;1204:910–914. doi: 10.1016/0002-8703(90)90209-g. [DOI] [PubMed] [Google Scholar]
- Phillps R, Harris G. Information for manufacturers seeking marketing clearance of diagnostic ultrasound systems and transducers. Food and Drug Administration, Center for Devices and Radiological Health. 2008 [Google Scholar]
- Ragland M, Tak T. The role of echocardiography in diagnosing space-occupying lesions of the heart. Clinical Medicine & Research. 2006;41:22–32. doi: 10.3121/cmr.4.1.22. [DOI] [PMC free article] [PubMed] [Google Scholar]
- Shapiro R, Wagreich J, Parsons R, Stancato-Pasik A, Yeh H, Lao R. Tissue harmonic imaging sonography: evaluation of image quality compared with conventional sonography. American Journal of Roentgenology. 1998;1715:1203–1206. doi: 10.2214/ajr.171.5.9798848. [DOI] [PubMed] [Google Scholar]
- Skolnick D, Sawada S, Feigenbaum H, Segar D. Enhanced endocardial visualization with noncontrast harmonic imaging during stress echocardiography. Journal of the American Society of Echocardiography. 1999;127:559–563. doi: 10.1016/s0894-7317(99)70003-9. [DOI] [PubMed] [Google Scholar]
- Starritt H, Duck F, Hawkins A, Humphrey V. The development of harmonic distortion in pulsed finite-amplitude ultrasound passing through liver. Physics in Medicine and Biology. 1986;3112:1401–1409. doi: 10.1088/0031-9155/31/12/007. [DOI] [PubMed] [Google Scholar]
- Teske A, De Boeck B, Melman P, Sieswerda G, Doevendans P, Cramer M. Echocardiographic quantification of myocardial function using tissue deformation imaging, a guide to image acquisition and analysis using tissue Doppler and speckle tracking. Cardiovascular Ultrasound. 2007;51:27. doi: 10.1186/1476-7120-5-27. [DOI] [PMC free article] [PubMed] [Google Scholar]
- Tranquart F, Grenier N, Eder V, Pourcelot L. Clinical use of ultrasound tissue harmonic imaging. Ultrasound in Medicine and Biology. 1999;256:889–894. doi: 10.1016/s0301-5629(99)00060-5. [DOI] [PubMed] [Google Scholar]
- Vandenberg B, Rath L, Stuhlmuller P, Melton H, Skorton D. Estimation of left ventricular cavity area with an on-line, semiautomated echocardio-graphic edge detection system. Circulation. 1992;861:159–166. doi: 10.1161/01.cir.86.1.159. [DOI] [PubMed] [Google Scholar]
- Ward R, Collins K, Balasia B, Spencer K, DeCara J, Mor-Avi V, Sugeng L, Lang R. Harmonic imaging for endocardial visualization and myocardial contrast echocardiography during transesophageal echocardiography. Journal of the American Society of Echocardiography. 2004;171:10–14. doi: 10.1016/j.echo.2003.09.007. [DOI] [PubMed] [Google Scholar]
- Yeh E. Reverberations in echocardiograms. Journal of Clinical Ultrasound. 1977;52 doi: 10.1002/jcu.1870050207. [DOI] [PubMed] [Google Scholar]
- Zwirn G, Akselrod S. Stationary clutter rejection in echocardiography. Ultrasound in Medicine and Biology. 2006;321:43–52. doi: 10.1016/j.ultrasmedbio.2005.08.012. [DOI] [PubMed] [Google Scholar]
- Zwirn G, Beeri R, Gilon D, Friedman Z, Akselrod S. Quantitative evaluation of local myocardial blood volume in contrast echocardiography. Medical Image Analysis. 2009;131:62–79. doi: 10.1016/j.media.2008.06.009. [DOI] [PubMed] [Google Scholar]
Associated Data
This section collects any data citations, data availability statements, or supplementary materials included in this article.
Supplementary Materials
Figure 1: Video of good quality B-mode cine loop and matched SLSC cine loop from the short axis view of the left ventricle of volunteer 4. B-mode images are shown with 50 dB dynamic range, while SLSC images are shown on a linear scale ranging from 0 to 95% of the maximum value. SLSC images were created with M = 6.
Figure 2: Video of poor quality B-mode cine loop and matched medium-quality SLSC cine loop from the short axis view of the left ventricle of volunteer 13. B-mode images are shown with 50 dB dynamic range, while SLSC images are shown on a linear scale ranging from 0 to 95% of the maximum value. SLSC images were created with M = 6.
Figure 3: Video of matched B-mode and SLSC cine loops from the apical four-chamber view of the left ventricle of volunteer 2. B-mode and M-mode images are shown with 50 dB dynamic range, while SLSC images are shown on a linear scale ranging from 0 to 95% of the maximum value. SLSC images were created with M = 6.


