

Abstract
We investigated whether and to what extent children who are racial/ethnic minorities are disproportionately represented in early intervention and/or early childhood special education (EC/ECSE). We did so by analyzing a large sample of 48-month-olds (N=7,950) participating in the Early Childhood Longitudinal Study-Birth Cohort (ECLS-B), a nationally representative dataset of children born in the U.S. in 2001. Multivariate logistic regression analyses indicate that boys (OR=1.66), children born at very low birthweight (OR=3.98) or with congenital anomalies (OR=2.17), and children engaging in externalizing problem behaviors (OR=1.10) are more likely to be represented in EI/ECSE. Children from low SES households (OR=.48), those displaying greater numeracy or receptive language knowledge (ORs=.96 and .76, respectively), and children being raised in households where a language other than English is primarily spoken (OR=.39) are less likely to be represented in EI/ECSE. Statistical control for these and an extensive set of additional factors related to cognitive and behavioral functioning indicated that 48-month-old children who are Black (OR=.24) or Asian (OR=.32) are disproportionately under-represented in EI/ECSE in the U.S.
Keywords: Minority disproportionate representation, racial/ethnic disparities, special education, early intervention, preschool
Providing children with or at risk for delays or disabilities with high quality early intervention services prior to school entry can help improve their long-term educational and societal opportunities. This is because receipt of these services, if of high and sustained quality, can increase children’s cognitive, behavioral, and physical capabilities by mitigating the effects of their delays or disabilities (Duncan, Ludwig, & Magnuson, 2007; Martin et al., 1990; Weikart, 1998; Zigler, Taussing, & Black, 1992). As a result, receipt of these services can increase children’s capacity to thrive. For example, at-risk children participating in high-quality early intervention services are more likely to later display higher levels of academic achievement, complete high school, obtain health insurance, and be less likely than peers to engage in substance abuse, be depressed, or be arrested as juveniles (McCormick et al., 2006; Reynolds et al., 2001; Reynolds et al., 2011; Walker, Chang, Vera-Hernandez, Gratham-McGregor, 2011). Estimates of the resulting returns to society for sustained early intervention programs range from $8–14 of every $1 spent in increased earnings and tax revenue and decreased criminal justice system costs (Duncan et al.; Heckman, Grunewald, & Reynolds, 2006; Heckman, Moon, Pinto, Savalyev, & Yavitz, 2010; Reynolds, Temple, White, & Robertson. 2011).
The Individuals with Disabilities Education Act (IDEA) provides U.S. states with funding for coordinated, multidisciplinary, and interagency systems to deliver specialized early intervention services, termed early intervention or early childhood special education (EI/ECSE), to all eligible children displaying cognitive, behavioral, and/or physical developmental delays or disabilities. In 2008, 342,985 children aged 0–2 received EI services through Part C of IDEA, and 709,004 children aged 3–5 received ECSE services through Part B (U.S. Department of Education, 2011a). The federal government provides substantial funds to help ensure the high quality of EI/ECSE services. For example, the U.S. Department of Education (2011b) anticipates providing states with $374,099,000 for Part B and $489,427,000 for Part C in 2012. Preliminary evidence indicates that EI/ECSE services positively impact children’s development (Hebbeler et al., 2007). For example, 74% and 82% of children receiving EI and ECSE, respectively, display greater than expected growth in their reasoning, problem solving, and early literacy and mathematics knowledge, and 54% and 52% of children exiting EI and ECSE, respectively, display age appropriate levels of cognitive, behavioral, and socio-emotional functioning (Early Childhood Outcomes Center, 2011).
Are Minority Children Disproportionately Represented in EI/ECSE?
Yet some groups of children may be disproportionately represented in EI/ECSE. This may be particularly the case for racial/ethnic minorities (Harry, 1994; Hosp & Reschly, 2003, 2004; Oswald et al, 1999). Evidence of minority disproportionate representation has resulted in the commission of two National Research Council reports (Donovan & Cross 2002; Heller et al, 1982), policy briefs by professional organizations (e.g., National Education Association, 2007), and over 40 years of compliance monitoring (e.g., U.S. Department of Education’s Office of Civil Rights, 2009). It has recently been characterized as one of the special education field’s “most long-standing and intransigent” problems (Skiba et al., 2008, p. 264). Minority disproportionate representation is currently the target of federal legislation. For example, the reauthorization of IDEA legislation in 2004 included amendments mandating that local education agencies in the U.S. use 15% of their Part B funding to provide additional academic and behavioral services to members of over-identified groups.
However, whether and to what extent children who are racial/ethnic minorities are disproportionately represented in EI/ECSE—and, critically, the direction of this disproportionality—is largely unknown. Existing U.S. population-based datasets of children receiving EI/ECSE services (e.g., the National Early Intervention Longitudinal Study, the Pre-Elementary Educational Study; Hebbeler et al., 2007; Scarborough et al., 2004) typically do not include “control” groups of children who were not identified for these services, constraining statistical control for confounding factors. Most studies have used school-aged rather than preschool-aged samples (Donovan & Cross, 2002) and, of these studies, most have not statistically controlled for confounding factors (Waitoller et al., 2010). Those few studies that have controlled for such factors (e.g., SES) typically rely on aggregated district- or state-level controls (e.g., Artiles et al., 2005; Hosp & Reschley, 2004; Oswald et al., 1999; Skiba et al., 2005), instead of individual-level data. Doing so can introduce substantial measurement error and so bias the reported estimates (e.g., Harwell & LeBeau, 2010). Prior work has also not been able to control for strong confounders including gestational or birth risk factors, SES, prior histories of delayed cognitive and behavioral functioning, residential location, and limited access to health services (Hibel et al., 2010; Mann et al., 2007).
Estimating disproportionate representation attributable to children’s race/ethnicity necessitates controlling for confounding factors (e.g., Delgado & Scott, 2006; Delgado et al., 2005; Donovan & Cross, 2002; Flores and the Committee on Pediatric Research, 2010). Failing to do so may greatly over-estimate the risk attributable to children’s race/ethnicity because these same children are also more likely to be exposed to health-related, environmental, nutritional, social, and economic factors that themselves increase the likelihood of developmental delays or disabilities (e.g., Donovan & Cross; Hosp & Reschly, 2003; Farkas, 2003). Despite having far-reaching implications for U.S. educational policy, research, and practice, whether and to what extent minority disproportion representation (a) is initially observed in EI/ECSE and (b) continues to be observed following extensive statistical control for confounding factors has yet to be systematically investigated.
Theoretically, there are several mechanisms that might result in children who are racial/ethnic minorities being disproportionately over-represented. An aforementioned mechanism is that these children are more likely to be exposed to risk factors that impair cognitive, academic, and behavioral functioning, thereby increasing the likelihood that they will be referred for EI/ECSE (Coutinho & Oswald, 2000; Coutinho et al., 2002; Donovan & Cross, 2002; Skiba et al., 2008). For instance, Scarborough et al. (2004) reported that 50% of African American children receiving EI services lived in poverty or were born at low birthweight—factors that themselves increase the risk of delays or disabilities (e.g., Hogan & Park, 2000) and so should make participation in EI/ECSE more likely. Cultural, linguistic, and racial bias, which may result in minority children’s abilities and behaviors being considered relatively more problematic, is a second possible mechanism (Coutinho & Oswald; Harry et al., 2008; Hays, Prosek, & McLeod, 2010). For instance, teachers have sometimes been reported to be more likely to refer children who are minorities for special education (e.g., Hosp & Reschley, 2003). This can occur even when the academic and behavioral functioning of minority and non-minority children is closely matched (Bahr et al., 1991).
Alternatively, it may be that minority children are disproportionately under-represented. This may be especially likely among younger children (Rosenberg, Zhang, & Robinson, 2008; Samson & Lesaux, 2009). One theorized possibility is the underutilization of EI/ECSE services by minority families due to socio-economic, linguistic, and/or cultural obstacles (Blanchett et al., 2009; Danesco, 1997; Garcia Coll et al., 1996; Harry, 1992; O’Hara, 2003; Pena & Fiestas, 2009). For example, Blanchett et al. (2009) posit that the U.S. special education system’s emphasis on racial/ethnic and cultural majority values regarding communication, language, and performance may disproportionately favor children in native, English-speaking families. Cultural differences in beliefs about disability are also an important consideration. Some groups may not identify problematic behaviors or symptoms as indicative of developmental delay or disability (Danesco, 1997). Attitudes toward help seeking for children outside of the family can also differ among racial/ethnic groups, with some preferring to rely on the social support of extended families (Garcia Coll et al., 1996). Racial/ethnic and cultural attitudes, particularly an aversion to the stigma associated with disability identification, is an additional possible mechanism (O’Hara, 2003). It may also be that practitioners are reluctant to refer minority children due to fear of being viewed as racially biased (Hibel et al., 2010; Skiba et al., 2006).
Another potential mechanism is that young children who are minorities may be under-represented in EI/ECSE because they are less likely to receive delay or disability evaluations and diagnoses as a result of lower health care access (Flores et al., 2010). Pediatricians and other physicians routinely initiate EI/ECSE eligibility evaluations. Palfrey et al. (1987) estimated that physicians diagnosed 99%, 78%, and 44% of children receiving EI services for Down syndrome, mental retardation, and hyperactivity, respectively. This lower health care access may delay some minority children’s identification as delayed or disabled. Children identified by physicians receive a diagnosis one to two years earlier on average than those identified by other practitioners such as preschool teachers (Palfrey et al.; Smedley et al., 2003). Black children are less likely to receive an attention disorder diagnosis (Pastor & Reuben, 2005), and, when receiving an autism diagnosis, do so on average a year later than White children (Mandell et al., 2002). Delgado and Scott’s (2006) analysis of EI/ECSE referrals in Florida indicated that children born preterm or low birthweight, or who were raised by less educated mothers were more likely to be referred for special education by age 4. After statistically controlling for these factors, Black and Asian children were less likely to be referred. These mechanisms may also result in children from lower-SES households being under-represented in EI/ECSE.
Thus, there are competing theoretical mechanisms that might result in minority disproportionate representation in EI/ECSE. One set of mechanisms posits over-representation; another set predicts under-representation. Yet the directionally of the disproportionality has not been empirically established. Finding such disproportionate representation would have important theoretical and applied implications, particularly given the benefits of intervening early for increasing the cognitive, behavioral, and physical functioning of children with or at risk for delays or disabilities. For example, it may be that the many disparities reported for racial/ethnic minorities in adult health, education, and general well-being result in part from their earlier systemic lack of access to EI/ECSE services before school entry. Yet whether and to what extent such disproportionate representation is occurring in the U.S., particularly just prior to school entry, is not currently known.
Purpose
We used a large, nationally representative sample of 48-month-olds to estimate whether and to what degree children who are minorities are disproportionately represented in EI/ECSE. We investigated three inter-related questions. First, to what extent are children who are minorities at greater risk for low levels of numeracy and receptive language knowledge? These analyses help quantify these children’s relative “need” for EI/ECSE. Second, are children who are minorities disproportionately represented in EI/ECSE generally, and if so, are they over- or under-represented? Because these analyses statistically control for a wide range of confounding factors, they provide rigorously derived estimates of the extent to which any observed disproportionate representation can be attributed uniquely to children’s status as racial/ethnic minorities. Third, do professionals disproportionately diagnose children who are minorities as having communication, attention, or learning delays or disorders? These analyses function as a type of replication if they indicate that any disproportionate representation in EI/ECSE generally also is evident in reported diagnoses for these more specific conditions.
Method
Sample
Data are from the ECLS-B, a nationally representative, longitudinal cohort study of U.S. children born in 2001. The ECLS-B sample was drawn from birth certificate files, and oversampled Asian and Pacific Islanders, Native Americans and Alaska Natives, moderately low and very low birthweight children, and twins. At approximately 9, 24, and 48 months after birth, parents were interviewed and a battery of cognitive, behavioral, and physical measures was administered. Our analytical sample includes 7,950 children with and without developmental delays or disabilities with complete data on developmental measures at 48 months.1 No statistically significant differences were observed between the full and analytical ECLS-B samples (results available from the study’s first author).
Measures
We control for four types of confounds when estimating the extent to which any observed disproportionate representation in EI/ECSE services is attributable to children’s race/ethnicity. The first type is socio-demographic characteristics, including gender, SES, marital status, maternal age, primary language other than English, and residential characteristics including U.S. region and rural/urban location. Boys are known to be two to three times more likely to be identified as learning disabled than girls (Katusic et al., 2001). SES, parental marital status, and maternal age have also been associated with special education receipt (e.g., Hosp & Reschley, 2004; Mann et al., 2007). The second category includes gestational and birth characteristics. Mannerkoski et al. (2007) estimated that very low birthweight children were 3–5 times more likely to receive special education. The third category is academic or pre-academic knowledge, and the frequency of problem behaviors (Mann et al. 2007; Merrell & Shinn, 1990). Hibel et al. (2010) reported that kindergarten children with greater reading and mathematics proficiency were less likely to subsequently receive special education. The final category is access to health care services. Limited health care access can delay a diagnosis and referral for services (Flores et al., 2010).
Child’s Status as Disabled or Delayed
NCES field staff interviewed a child’s parent about whether their child was participating in EI/ECSE.2 Field staff were recruited from the same geographical area as interviewed parents. Field staff administered the parent interviews (as well as the numeracy and receptive language measures) in English or Spanish. They began by stating that there are special services available to families with children who had been diagnosed as disabled or delayed. Next, the parent was asked whether the child or family was currently receiving such special services, as indicated by the child’s receipt of an Individualized Education Program (IEP) or the family’s participation in an Individual Family Services Plan (IFSP). Federal legislation requires the IEP or IFSP, which is a written and signed document detailing the specific EI/ECSE services to be provided. We coded the parent’s response of “no” as 0 and “yes” as 1. We identified about 450 children whose parents indicated that they were currently participating in EI/ECSE. These children also had complete sampling weight data, as well as complete data on their socio-demographic, gestational, birth characteristics, and numeracy and receptive language knowledge. Parents also reported the condition for which the child was receiving special services (e.g. ADHD, autism, mental retardation). We also conducted follow up analyses of parent responses to two additional sets of questions about the child’s delay or disability status between 2 and 4 years of age. The first analysis asked whether a professional had evaluated the child for his or her ability to communicate and, if so, whether the parent had obtained a professional’s diagnosis. The second set of questions asked whether a professional had evaluated the child for his or her ability to pay attention or learn and, if so, whether the parent had obtained a professional’s diagnosis.
Our analyses rely on parental report of child’s participation in EI/ECSE. Prior work repeatedly indicates that parents can reliably identify whether their children display cognitive or behavioral delays, and so are likely to be identified as disabled (Chen, Lin, Wen, & Wu, 2007; Glascoe & Dworkin, 1995; Johnson et al., 2004; Johnson, Wolke, Marlow, & the Preterm Infant Parenting Study Group, 2008). For instance, Glascoe (1999) reported sensitivity and specificity rates of 74–79% and 70%–80%, respectively, between parent interviews and results from standardized test batteries. Chen, Lee, Yeh, Lai, and Chen (2004) reported a sensitivity rate between parent’s report and a professional’s diagnosis (that itself resulted from the child’s performance on independently administered speech, motor, behavioral, cognitive, or global measures) of developmental delay to be 77%–89%. Parents are an appropriate source of disability identification, particularly for children who have not yet entered school. Collectively, the extant research indicates that parent interviews “are as accurate as high quality screening tests” (Glascoe, p. 24) in identifying delays or disabilities in young children.
Multiple features of this study’s data also indicate that parents reliably reported their child’s participation in EI/ECSE. First, the parent-reported prevalence rate was 5%. This rate closely approximates the 5.8% prevalence rate for young children participating in Part B ECSE in the U.S. (e.g., U.S. Department of Education, 2011c). Second, follow up analyses indicated that children reported by their parents to be participating in EI/ECSE were more likely to display delays in both numeracy and receptive language. Specifically (and as indicated in Table 2 below), the odds that a child with a parent-reported IEP or IFSP was performing in the bottom 10% of the distribution of scores on the individually administered numeracy and receptive language measures were 2.24 and 3.99 times, respectively, higher than the odds that a child without a parent-reported IEP or IFSP was performing in the bottom 10%. These clinically and statistically significant estimates were derived after extensive control for potential confounds. Thus, these estimates provide another indication that parents accurately identified their children as participating in EI/ECSE. Children receiving EI/ECSE are known to be more likely to display lower numeracy and receptive vocabulary knowledge (Markowitz et al., 2006). Third, NCES conducted extensive analyses of non-response bias by the interviewed parents. These analyses evaluated in part whether parents of various racial/ethnic groups were more likely to systematically not respond to any particular items (e.g., their child’s disability status) during the interviews. These analyses yielded no evidence of racial differences in non-response (e.g., Chernoff, Flanagan, McPhee, & Park, 2007, pp. 22–23). Fourth, our own supplemental analyses of the ECLS-B data indicated good overall agreement between 48-month parent report of their children’s delay or disability status and 60-month teacher reports of children’s receipt of special services. Specifically, for those children whose parents reported that they were participating in EI/ECSE at 48-months-of-age, the great majority (i.e., 80%) of these children were later reported by their kindergarten teachers to be participating in special education, pull out speech services, or individual tutoring in reading or mathematics.
Table 2.
Logistic Regression Models (Odds Ratios) of Very Low Numeracy or Receptive Language Knowledge (lowest 10%) at 48 Months (N=7,950a)
| Very low numeracy knowledge | Very low receptive language knowledge | |||
|---|---|---|---|---|
|
| ||||
| Model 1 | Model 2 | Model 1 | Model 2 | |
| Child is male | 1.52 *** | 1.37 ** | 1.54 *** | 1.42 ** |
| Child’s age | 0.84 *** | 0.83 *** | 0.90 *** | 0.87 *** |
| Black | 2.65 *** | 1.42 * | 1.36 | 0.81 |
| Hispanic | 2.67 *** | 1.37 * | 8.60 *** | 1.97 *** |
| Asian | 0.76 | 0.73 | 4.49 *** | 1.21 |
| Native American | 6.80 *** | 3.53 *** | 3.27 *** | 1.86 |
| Other | 2.11 *** | 1.65 ** | 0.62 | 0.46 * |
| SES, lowest quintile | 6.46 *** | 5.48 *** | ||
| SES, second lowest quintile | 3.53 *** | 3.96 *** | ||
| SES, middle quintile | 2.55 *** | 2.19 ** | ||
| SES, second highest quintile | 1.61 | 1.64 | ||
| Maternal age at child’s birth | 0.98 * | 0.99 | ||
| Not married at 48 months | 1.18 | 0.92 | ||
| Medical risks | 1.14 | 1.15 | ||
| Behavioral risks | 1.02 | 0.78 | ||
| Obstetric procedures | 0.91 | 1.02 | ||
| Labor complications | 1.08 | 1.04 | ||
| Very pre-term | 1.06 | 0.89 | ||
| Moderately pre-term | 1.04 | 1.00 | ||
| Very low birthweight | 2.35 ** | 2.28 * | ||
| Moderately low birthweight | 1.48 ** | 1.35 | ||
| Congenital anomalies | 0.88 | 1.16 | ||
| Externalizing problem behaviors, 48 months | 1.06 *** | 1.03 * | ||
| Internalizing problem behaviors, months | 0.90 * | 1.04 | ||
| IEP or IFSP | 2.24 *** | 3.99 *** | ||
| Midwest residence | 1.60 * | 1.35 | ||
| South residence | 1.61 * | 1.81 ** | ||
| West residence | 1.84 ** | 1.92 ** | ||
| Urban residence | 0.74 | 1.12 | ||
| Non-English primary language | 1.70 * | 7.20 *** | ||
| Low number of well-child checkups | 0.84 | 0.88 | ||
Note. SES=Socioeconomic status; IEP=Individualized Education Program; IFSP=Individualized Family Services Plan.
p<.05;
p<.01;
p<.001.
Rounded to the nearest 50.
Attributing any observed disproportionality to mistaken recall is unlikely, as delay or disability identification “is so salient to families that parent recall is likely to be accurate” (Palfrey et al., 1987, p. 653). Mistaken recall is also unlikely given that EI/ECSE services are not provided until an eligibility evaluation has been conducted—which itself is a multi-stage process involving multiple professionals commonly conducting evaluations in the child’s home—and resulting in oral and written documentation of the results of the evaluation, as well as of the parent-agreed upon and -signed IEP or IFSP.
Child’s Gender, Race/Ethnicity, Age
Parents identified their child’s gender. The child’s race/ethnicity was provided in the ECLS-B in 98% of cases. This information was obtained from the child’s birth certificate in accordance with National Center for Health Statistics procedures (Martin et al., 2010). For the remaining 2% of case in which the child’s race/ethnicity was missing, we used the mother’s race/ethnicity to identify the child’s race/ethnicity. We used Non-Hispanic White as the reference category. The other categories were as follows: (a) Black or African American; (b) Hispanic; (c) Asian (e.g., Korean, Chinese, Indian, Japanese); (d) Native American, or (e) “Other” race or ethnicity. Age in months was included to control for variation around the 48-month data collection time point.
Family’s SES
We used an NCES-constructed composite SES measure incorporating father’s education, mother’s education, father’s occupation, mother’s occupation, and household income. The composite averaged these variables after each had been transformed into a Z-score. In cases where only one parent was interviewed, not all the survey information was obtained and so the family’s SES was computed by averaging the obtained information. A small percentage of data for each SES component was missing because not all respondents answered every question. This occurred most frequently for household income (i.e., 3.39% of these data were missing). NCES used a hot deck methodology to impute the missing data. In our logistic regression modeling, the five-category variable used here represents quintiles of the SES distribution. We coded SES in dummy variables for these categories so as to allow for non-linearity. (Such nonlinearity was observed.) The first quintile represents the lowest category, and the fifth quintile represents the highest (and reference) category.
Mother’s Age and Marital Status
Mother’s age at the child’s birth was a continuous variable measured in years; marital status was included as a dichotomous variable (i.e., married/not married).
Primary Language
A dichotomous variable was included to indicate whether a language other than English was the primary language spoken at home as reported by the parent.
Residence Characteristics
Region of residence (Northeast, Midwest, South, or West) was indicated by a set of dichotomous variables, and an additional dichotomous variable captured whether the residence was in an urban or rural area.
Child’s Gestational and Birth Characteristics
We summed these pregnancy risk factors: incompetent cervix; acute or chronic lung disease; chronic hypertension; pregnancy-induced hypertension; eclampsia, diabetes; hemoglobinopathy; cardiac disease; anemia; renal disease; genital herpes; oligohydramnios; uterine bleeding; Rh sensitization; previous birth weighing 4000+ grams; and previous preterm birth.
We included a count of maternal behavioral risks in pregnancy, including maternal use of alcohol or tobacco. We computed a count of the following obstetric procedures: induction of labor; stimulation of labor; tocolysis; amniocentesis, and cesarean section. We used a count of the number of labor complications including: abruptio placenta; anesthetic complications; dysfunctional labor; breech/malpresentation; cephalopelvic disproportion; cord prolapse; fetal distress; excessive bleeding; fever of >100 degrees; moderate/heavy meconium; precipitous labor (<3 hours); prolonged labor (>20 hours); placenta previa; or seizures.
We used two indicators of prematurity: very preterm birth (≤32 weeks) and moderately preterm birth (33–36 weeks). We also used indicator variables to represent very low (≤1500 grams) and moderately low (1,501–2,500 grams) birthweight. A dummy variable was included to indicate the presence of any congenital anomaly.
Child’s Early Academic Skills Proficiency
We used two indicators of the children’s academic skills at 48 months—numeracy and receptive language knowledge. Early learning of numeracy (e.g., number identification, counting) and receptive language are theorized to be (e.g., Baroody, Lai, & Mix, 2006; Gersten, Jordan, & Flojo, 2005; Scarborough, 1990) and empirically established (e.g., Aunola, Leskinen, Lerkkanen, & Nurmi, 2004; Bodovski & Farkas, 2007; Wise, Sevcik, Morris, Lovett, & Wolf, 2007) as strongly related to disabled or delayed children’s later reading or mathematics achievement. Items were adopted from standardized measures such as the Peabody Picture Vocabulary Test-III and the Test of Early Mathematics Ability-3, and from the Family and Child Experiences Study (FACES) and the Head Start Impact Study. Field staff administered each measure individually, using an untimed format. The numeracy measure included 46 items. Specifically, the measure evaluated preschool children’s number sense (10 items), counting ability (14 items), knowledge of operations (8 items), understanding of geometry (10 items), and pattern understanding (4 items). The receptive language measure evaluated children’s receptive language skills and vocabulary. Children initially responded to 15 items. Based on the accuracy of their responses, the children were administered additional items or routed out of the English version. Thus, a portion of the measure was also used to assess children’s English-language proficiency. Children routed out of the English version were routed to the Spanish version if their parent had indicated that the children had knowledge of Spanish. The 48-month reliabilities of the IRT scores of the numeracy and receptive language were .89 and .83, respectively (Najarian, Snow, Lennon, & Kinsey, 2010).
Child’s Frequency of Problem Behaviors
Behavior problems at 48 months were assessed using a modified version of the Preschool and Kindergarten Behavior Scales, 2nd ed. (PKBS-2; Merrell, 2003). Internal consistency estimates of the PKBS-2 range from .96 to .97 (Merrell, 2003). Field staff administered the behavior measure by asking a parent to consider the child’s behavior in the last three months. For those items that ask about how the parent’s child behaves with other children, field staff asked the parent to think about the child’s behavior during interaction with children who are no more than 2 years older or younger than the child. Parents reported whether each problem behavior had been observed “very often,” “often,” “sometimes,” “rarely,” or “never” within the past three months. Selected problem behaviors were classified as externalizing and internalizing. Parent’s responses were summed for the following 8 externalizing behaviors: “displays anger;” “displays aggressiveness;” “is impulsive;” “is overly active;” “has a bad temper;” “has trouble concentrating;” “annoys other children;” and “destroys other children’s things.” Parent responses were also summed for 2 internalizing behaviors: “child is unhappy;” and “child worries.” Item-to-total correlations ranged from .60–.70 and .70–.85 for the externalizing and internalizing problem behavior scales, respectively.
Access to Well-Child Care
At the 48-month ECLS-B assessment, parents reported the number of visits made to a health care provider for well-child care since the 2- month assessement. Because the American Academy of Pediatrics (2008) recommends at least 2 well-child care visits in that interval, children who received 1 or 0 visits were classified as having a low number of visits.
Analyses
Our analyses estimated two sets of logistic regression models. The first set identified factors predictive of or associated with very low levels of numeracy and, separately, receptive language knowledge. We operationalized a very low level of knowledge as having a score in the bottom 10% of scores on either measure when administered at 48 months. A 10% cut-off score is a conservative criterion for identifying a child as possibly delayed or disabled (e.g., Catts, Fey, Tomblin, & Zhang, 2002; Geary, 2004; Mazzocco & Myers, 2003; Skibbe et al., 2008). Model 1 included only gender, age, and race/ethnicity. Model 2 added the family’s socio-demographic characteristics, the child’s frequency of externalizing and internalizing problem behaviors, whether the child’s parents had reported the child was participating in EI/ECSE, residence characteristics, and access to well-child care. The second set of logistic regression models identified factors predictive of or associated with (a) preschool children’s participation in EI/ECSE, (b) receipt of a professional’s diagnosis of a communication problem, or (c) receipt of a professional’s diagnosis of attention or learning problems. Models 1 and 2 were estimated as described above. All analyses were performed with SAS 9.2. We incorporated sampling weights and design effects to account for oversampling of some population subgroups and for the stratified cluster design of the ECLS-B.
Results
Table 1 displays descriptive statistics for children who were (n=450) and were not (n=7,500) participating in EI/ECSE. Figure 1 displays the simple means for the racial/ethnic groups. Children in EI/ECSE were more likely to be male, White, born to mothers who engaged in behavioral risks during the pregnancy, born very pre-term and/or with moderate or very low birthweight, display lower numeracy and/or receptive language knowledge, and engage in externalizing problem behaviors. These children were less likely to be Black, Hispanic, or Asian, or primarily speak a language other than English in their households. These descriptive statistics indicate possible minority disproportionate representation in EI/ECSE. Children who are White constitute 56% of the general population of 48-month-old children but 70% of those receiving EI/ECSE services. In contrast, children who are Black, Hispanic, or Asian constitute 15%, 23%, and 3% of this general population, respectively, but 7%, 17%, and 1% of those receiving services. Children being raised in households where a language other than English is primarily spoken constitute 16% of the general population, but 8% of those receiving services. However, these estimates are not yet adjusted for confounding factors.
Table 1.
Descriptive Statistics (weighted) of ECLS-B Analytical Sample for Children without and with Parent-Reported IEPs or IFSPs (N=7,950a).
| Children without parent-reported IEPs or IFSPs (n=7,500 a) | Children with parent- reported IEPs or IFSPs (n=450 a) | t-test | |||
|---|---|---|---|---|---|
|
| |||||
| M or Proportion | SD | M or Proportion | SD | ||
| Child is male | 0.50 | 0.68 | * | ||
| Child’s age | 52.47 | 4.14 | 52.99 | 3.99 | |
| White | 0.56 | 0.70 | * | ||
| Black | 0.15 | 0.07 | * | ||
| Hispanic | 0.23 | 0.17 | * | ||
| Asian | 0.03 | 0.01 | * | ||
| Native American | 0.0 | 0.01 | |||
| Other | 0.04 | 0.04 | |||
| SES, lowest quintile | 0.18 | 0.15 | |||
| SES, second lowest quintile | 0.20 | 0.23 | |||
| SES, middle quintile | 0.20 | 0.23 | |||
| SES, second highest quintile | 0.21 | 0.21 | |||
| SES, highest quintile | 0.21 | 0.19 | |||
| Maternal age at child’s birth | 27.31 | 6.37 | 27.89 | 6.10 | |
| Not married at 48 months | 0.33 | 0.34 | |||
| Medical risks | 0.18 | 0.22 | |||
| Behavioral risks | 0.12 | 0.20 | * | ||
| Obstetric procedures | 0.59 | 0.61 | |||
| Labor complications | 0.36 | 0.40 | |||
| Very pre-term | 0.02 | 0.06 | * | ||
| Moderately pre-term | 0.09 | 0.10 | |||
| Very low birthweight | 0.01 | 0.05 | * | ||
| Moderately low birthweight | 0.06 | 0.09 | * | ||
| Congenital anomalies | 0.05 | 0.13 | * | ||
| Numeracy score, 48 months | 22.62 | 7.47 | 19.75 | 7.42 | * |
| Receptive language score, 48 months | 8.60 | 1.93 | 7.85 | 1.89 | * |
| Externalizing problem behaviors, 48 months | 18.85 | 4.78 | 21.80 | 5.40 | * |
| Internalizing problem behaviors, 48 months | 4.05 | 1.34 | 4.20 | 1.41 | |
| Non-English primary language | 0.16 | 0.08 | * | ||
| Northeast residence | 0.17 | 0.17 | |||
| Midwest residence | 0.22 | 0.31 | * | ||
| South residence | 0.38 | 0.31 | * | ||
| West residence | 0.23 | 0.21 | |||
| Rural residence | 0.17 | 0.20 | |||
| Urban residence | 0.83 | 0.80 | |||
| Number of well-child checkups | 2.06 | 0.91 | 2.10 | 0.94 | |
Note. SES=Socioeconomic status; IEP=Individualized Education Program; IFSP=Individualized Family Services Plan;
Rounded to the nearest 50.
Significant at p<.05.
Figure 1.
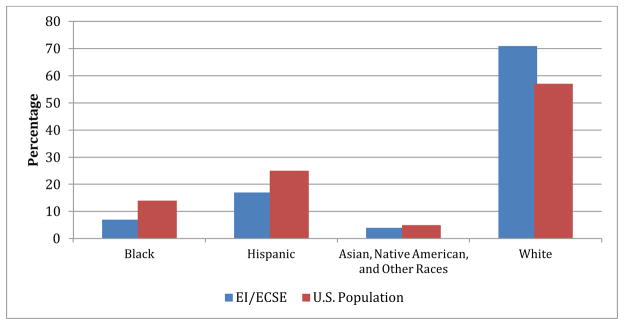
Unadjusted race/ethnicity percentage breakdown of (a) children participating in EI/ECSE and (b) the general U.S. population (Source: ECLS-B data).
To What Extent are Minority Children at Greater Risk for Numeracy or Receptive Language Delays?
Table 2 displays estimates from the first set of logistic regression models. Results indicate that Blacks, Hispanics, and Native Americans are more likely than Whites to display very low numeracy. Controlling for SES and other variables in Model 2 reduces the magnitudes of these coefficients, but they remain statistically significant. For receptive language, both Models 1 and 2 indicate Hispanics experience significantly higher odds than Whites of having scores in the bottom of the two score distributions. The Model 2 results for receptive language show no significant differences between Whites and either Blacks or Native Americans. In sum, the minority race/ethnic groups generally have similar or higher odds than Whites of displaying very low numeracy and receptive language knowledge. Thus, these results provide no reason to expect lower IEP or IFSP rates for these groups than for Whites.
These results also indicate very strong and monotonic relations between SES and children’s likelihood of displaying very low levels of pre-academic knowledge. The ORs for the lowest SES quintile are 6.46 and 5.48 (both p<.001), indicating these children are over five times more likely to display very low numeracy and receptive language knowledge, respectively, than children in the highest SES quintile. Children from households where a language other than English is primarily spoken are 1.7 and 7.2 times more likely to display very low numeracy and receptive language knowledge, respectively.
Are Minority Children Disproportionately Represented in EI/ECSE?
The first two columns of Table 3 display estimates from logistic regression models of children’s representation in EI/ECSE (i.e., parent-reported IEP or IFSP) by 48-months-of-age. Model 1 uses children’s social-demographic characteristics to estimate this likelihood. Boys are 2.08 times (p<.001) more likely to be identified as disabled or delayed than girls. Results indicate that 48-month-old children in the U.S. who are Black, Hispanic, or Asian are disproportionately under-represented in EI/ECSE (OR range= .23–.56). For instance, the odds of being identified for children who are Black are approximately one third as large as the odds for children who are White. The effects for children who are Native American or of other race/ethnicity are directionally consistent but not statistically significant. These estimated ORs for children’s racial/ethnic status are derived after statistically controlling for variation due only to gender or age. Thus, and prior to accounting for the study’s other controls, we observe that children who are Black, Hispanic, or Asian are disproportionately under-represented in EI/ECSE in the U.S.
Table 3.
Logistic Regression Models (Odds Ratios) Estimating Child’s Likelihood of Parent-Reported IEP or IFSP, Professional’s Diagnosis of Communication Problem, or Professional’s Diagnosis of Attention/Learning Problems all at 48 months, ECLS-B data (N=7,950a)
| Parent-reported IEP or IFSP | Professional’s diagnosis of communication problem | Professional’s diagnosis of attention or learning problems | ||||
|---|---|---|---|---|---|---|
|
| ||||||
| Model 1 | Model 2 | Model 1 | Model 2 | Model 1 | Model 2 | |
| Child is male | 2.08 *** | 1.66 ** | 2.15 *** | 1.87 *** | 2.12 *** | 1.52 * |
| Child’s age | 1.04 | 1.10 *** | 1.01 | 1.05 * | 1.03 | 1.09 ** |
| Black | 0.36 *** | 0.24 *** | 0.49 *** | 0.40 *** | 0.65 | 0.42 * |
| Hispanic | 0.56 ** | 0.60 | 0.66 ** | 0.70 | 0.95 | 0.77 |
| Asian | 0.23 *** | 0.32 ** | 0.23 *** | 0.28 *** | 0.23 *** | 0.20 ** |
| Native American | 1.57 | 0.94 | 1.22 | 0.89 | 1.80 | 0.91 |
| Other | 0.74 | 0.60 | 0.77 | 0.69 | 0.75 | 0.56 * |
| SES, lowest quintile | 0.48 * | 0.47 ** | 0.23 *** | |||
| SES, second lowest quintile | 0.69 | 0.68 | 0.35 *** | |||
| SES, middle quintile | 0.81 | 0.82 | 0.48 * | |||
| SES, second highest quintile | 0.80 | 0.90 | 0.60 | |||
| Maternal age at child’s birth | 1.03 * | 1.02 | 1.00 | |||
| Not married at 48 months | 1.23 | 1.18 | 1.63 | |||
| Medical risks | 1.06 | 1.16 | 1.02 | |||
| Behavioral risks | 1.26 | 1.21 | 1.91 ** | |||
| Obstetric procedures | 0.92 | 0.86 | 1.04 | |||
| Labor complications | 1.04 | 1.06 | 0.99 | |||
| Very pre-term | 0.83 | 1.36 | 0.46 * | |||
| Moderately pre-term | 0.80 | 1.15 | 1.27 | |||
| Very low birthweight | 3.98 *** | 2.08 | 4.81 *** | |||
| Moderately low birthweight | 1.59 * | 0.98 | 0.96 | |||
| Congenital anomalies | 2.17 *** | 1.82 ** | 1.37 | |||
| Numeracy score, 48 months | 0.96 ** | 0.98 * | 0.97 * | |||
| Receptive language score, 48 months | 0.76 *** | 0.80 *** | 0.64 *** | |||
| Externalizing problem behaviors, 48 months | 1.10 *** | 1.05 *** | 1.17 *** | |||
| Internalizing problem behaviors, 48 months | 0.92 | 1.04 | 0.95 | |||
| Midwest residence | 1.17 | 0.91 | 0.80 | |||
| South residence | 0.66 | 0.69 | 0.39 * | |||
| West residence | 0.74 | 0.63 * | 0.36 ** | |||
| Urban residence | 1.10 | 1.31 | 0.81 | |||
| Non-English primary | 0.39 ** | 0.50 ** | 0.94 | |||
Note. Parent reported IEP or IFSP n=450a; Communication problem diagnosis, n=600a, Attention or learning problem diagnosis, n=250a SES=Socioeconomic status; IEP=Individualized Education Program; IFSP=Individualized Family Services Plan; IRT=item response theory;
p<.05;
p<.01;
p<.001.
Rounded to the nearest 50.
Model 2 adds additional controls for SES and other sociodemographic factors, residential characteristics, gestational- and birth-related factors, numeracy and receptive language scores, externalizing and internalizing problem behaviors, and low number of well-child check-ups. Children’s odds of participating in EI/ECSE are significantly increased with older maternal age, very low and moderately low birthweight, being born with congenital anomalies, and among children with externalizing behavior problems. The odds of EI/ECSE participation are significantly decreased with higher numeracy and receptive language scores, and among children whose families are in the lowest SES quintile and who speak a language other than English at home. Model 2’s controls, including language spoken in the home, reduce the under-representation of Hispanic children to statistical insignificance (although the Hispanic children’s odds, at 0.6, are still well below those of White children). However, even after these controls, otherwise identical 48-month-old children who are Black or Asian are significantly less likely than children who are White to participate in EI/ECSE (OR=.24 and .32, respectively). Children raised in households where a language other than English is primarily spoken are also under-represented in EI/ECSE (OR=.39).
Are Minority Children Disproportionately Diagnosed by Professionals as Having Communication, or Attention/Learning Problems?
Columns 3–6 of Table 3 display results from follow up analyses of the two most frequent parent-reported disability or delay conditions. These are a professional’s evaluation and diagnosis of either (a) communication problems or (b) attention or learning problems. The results indicate a consistent pattern of minority under-identification for communication problems. In Model 2, the ORs for children who are Black or Asian are .40 and .28, respectively. Being male, older, born with congenital anomalies, engaging in externalizing problem behaviors, and experiencing a low number of well-child check-ups increases a child’s likelihood of being evaluated and diagnosed by a professional for a communication problem (OR=1.87, 1.05, 1.82, 1.05, 1.42, respectively). Children with greater numeracy or receptive language knowledge are less likely to be evaluated and diagnosed (OR=.98 and .80, respectively). Children from lower SES families are again under-identified. Specifically, and controlling for a range of additional variables, children of the lowest SES were .47 as likely to be evaluated and diagnosed by a professional as having a communication problem as children of the highest SES.
Table 3 also indicates that minority children are under-identified for attention or learning problems. Children who are older, whose mothers drank or smoked during their pregnancy, who were born with very low birthweight, and who display externalizing problem behaviors are more likely to be evaluated and receive a diagnosis by a professional as having attention or learning problems. In contrast, those who were born very preterm or who displayed greater numeracy or receptive language knowledge were less likely to be evaluated and diagnosed. Statistically controlling for these and other factors, children who are Black, Asian, or of other race/ethnicity are less likely than children who are White to be evaluated and diagnosed for an attention or learning problem (OR range=.20–.56). The results also indicate that children from the lowest three SES quintiles are less likely to be identified as having an attention or learning problem as children from the highest SES quintile (OR range=.23 to .48).
Discussion
We investigated whether and to what extent children who are racial/ethnic minorities are disproportionately represented in EI/ECSE in the U.S. Prior theoretical and empirical work identifies possible mechanisms that may result in these children being disproportionately represented in EI/ECSE. Yet the direction of this disproportionality is unclear as to whether the hypothesized mechanisms result in over- or under-representation. Prior research has not been able to establish rigorously derived and generalizable estimates of disproportionate representation in EI/ECSE because very few studies have controlled for the socio-demographic, gestational and birth, and learner characteristics (e.g., pre-academic and behavioral functioning) that also elevate children’s likelihood of being identified for EI/ECSE, and so potentially confound any estimates of observed disproportionate representation attributable to race/ethnicity.
Our results indicated that, by 48 months of age, minority children are disproportionately under-represented in EI/ECSE. Under-representation was evident both before and after statistical control for a wide range of potentially confounding factors (e.g., gender, SES, low birthweight, relative numeracy and receptive language knowledge, frequency of problem behavior. Our follow-up analyses yield consistent evidence of under-representation; racial/ethnic minorities were less likely than Whites to be evaluated and diagnosed by professionals as having communication, attention, or learning problems.
Study Limitations
This study investigated representation in EI/ECSE by 48 months, but this rate likely varies by age. Our study relied on parental report at 48 months that the child or family was receiving services related to an IEP or IFSP. We are unable to independently confirm the extent to which parents reliably reported such status. However, multiple features of these data (e.g., the observed prevalence rate, the children with IEPs or IFSPs having greater likelihoods of displaying very low levels of numeracy and receptive language knowledge) provided consistent supporting evidence that parents accurately identified whether their children had IEPs or IFSPs and so were participating in EI/ECSE.
Further, some of our estimated effects may be biased by reverse causality. Children’s gender, racial/ethnic status, and low birthweight can be characterized as exogenous to their participation in EI/ECSE by 48 months-of-age. However, other factors included in our analyses, such as receptive language or numeracy knowledge and the frequency of children’s problem behaviors may be endogenous. For instance, it is possible that children’s participation in EI/ECSE earlier on might itself have increased their frequency of externalizing problem behaviors (Morgan et al., 2010). Our study extends prior work by establishing whether children who are racial/ethnic minorities are disproportionately represented in EI/ECSE. However, our study cannot directly evaluate why children who are minorities are disproportionately under-represented in EI/ECSE. Further work identifying the underlying causal mechanisms resulting in minority under-representation in EI/ECSE is clearly warranted (Garcia Coll et al., 1996; Skiba et al., 2008).
Study’s Contributions and Implications
Our estimates support theoretical accounts of minority under- but not over-representation in EI/ECSE. Previously theorized mechanisms resulting in these disparities include minority families underutilizing EI/ECSE services because of socio-economic, linguistic, and cultural obstacles (Blanchett et al, 2009; Danesco, 1997; Garcia Coll et al., 1996; Harry, 1992; Pena & Fiestas, 2009). These children may also be less likely to be represented in EI/ECSE as a result of their lower health care access (Flores & the Committee on Pediatric Research, 2010). Our results are also consistent with prior work indicating that those minority children who are able to access a physician often receive delayed diagnoses (Mandell et al., 2002; Pastor & Reuben, 2005). We found no evidence to support theoretical accounts in which racial/ethnic minority children are disproportionately over-represented as a result of cultural, linguistic, or racial bias by educational professionals (Harry et al., 2008; Hayes et al., 2010).
Our results have important policy implications. For instance, the 2004 reauthorization of the Individuals with Disabilities Education Act includes amendments (e.g., Section 618) requires states and localities to monitor children’s placement into special education by race/ethnicity. Corrective action is mandated because disproportionate representation is taken as evidence of bias and potential discrimination (Coutinho & Oswald, 2000). However, most prior investigations indicate that minority children are disproportionately over-identified as disabled or delayed (e.g., Scarborough et al., 2004). The resulting policy emphasis has been on issues relating to over-representation. Yet our results, as well as those of a handful of additional studies, indicate that minority children may instead be under-represented (e.g., Delgado & Scott, 2006), even as they enter kindergarten and continue through elementary school (Hibel et al., 2010). Our findings are consistent with minority children’s greater exposure to risk factors (e.g., low birthweight) for delay or disability conditions (e.g., Table 1). However, these children’s greater or statistically equivalent risk of receptive and numeracy delays was not consistent with their much lower likelihood of receiving EI/ECSE services. Current policy and legislation attempting to prevent over-representation may therefore be incorrectly targeted. What instead may be needed are policies and legislation establishing procedures ensuring that minority children are afforded the same opportunities to benefit from EI/ECSE services as children who are White. Our study establishes that under-representation occurs by 48-months-of-age—well before children enter school.
Results of our study should contribute to the targeting of more effective screening and service delivery efforts on children who are racial/ethnic minorities. This may require community-based outreach efforts that are culturally and linguistically sensitive. For example, Flores et al.’s (2005) randomized control trial indicated that use of community-based case managers who were bilingual and who resided in the same localities as the study’s participants doubled the percent insured among previously uninsured Latino children. Community-based outreach procedures characterize interventions that effectively reduce racial/ethnic disparities in children’s health and health care access (Flores, 2009). It may also be that education practitioners have become overly sensitive to being perceived as biased against racial/ethnic minorities in referrals, resulting in an over-reluctance to identify minority children as delayed or disabled (Hibel et al., 2010; Skiba et al., 2006).
Our results contradict those reported by Hebbeler et al. (2007) and Scarborough et al. (2004). We believe that methodological differences between the studies may account for these conflicting findings. Analyses of the ECLS-B provided us with a group of “control” children who did not participate in EI/ECSE, allowing us to statistically account for many confounding factors including children’s pre-academic knowledge and behavioral functioning. Further, our results are consistent with those of other studies using rigorous methodology. Hibel et al.’s (2010) analyses controlled for school-aged children’s SES, as well as their relative reading and mathematics achievement, and found that minority children are under-represented in special education. Foran’s (2007) use of statistical control also found that minority children were less likely than White children to receive special education services. Rosenberg et al. (2008) reported that Black and Hispanic children were less likely than White children to receive EI by 24 months of age. Delgado and Scott’s (2006) analyses of a birth cohort indicated that both Black and Asian children were less likely than Whites to be referred for special education services by 4-years-of-age. Our study extends knowledge about “timing,” in that under-representation in EI/ECSE occurs by 48-months-of-age, and this under-representation is evident both prior to and following extensive statistical control. Our estimates should better generalize to the population of U.S. preschool-aged children because they are based on analyses of a nationally representative sample.
Our analyses indicate that efforts to ensure children’s participation in EI/ECSE in the U.S. can be characterized as in some ways “working,” and in other ways “not working.” These delivery efforts appear to be working in that EI/ECSE services are more likely to be provided to groups of children whose characteristics would reasonably elevate their likelihood of having delays or disabilities. Yet, these efforts appear not to be working for minority children. This is despite minority children’s sometimes greater risk for lower numeracy and receptive language knowledge. Similarly, children from low SES families are at great risk of displaying low levels of knowledge in both numeracy and receptive language knowledge, but are less likely than higher SES children to be diagnosed by professionals as having communication, attention, or learning problems. Our findings support repeated calls (e.g., Blanchett et al., 2009; O’Hara, 2003; Pena & Fiestas, 2009) to ensure that EI/ECSE services are delivered in ways that are culturally and linguistically responsive to the diverse needs of minority children and their families. Doing so should help ensure that minority children with or at risk for developmental delays and disabilities are able to benefit from the early provision of services that are specifically designed to minimize short- and long-term disparities in health and well being, and, as a result, help ensure that children with or at risk for delays or disabilities experience the fullest range of educational and societal opportunities.
Footnotes
All sample sizes have been rounded to nearest 50 in accordance with NCES-mandated confidentiality procedures.
Children aged 0–2 and 3–5 are eligible to receive services provided through Part C (i.e., EI) and Part B (i.e., ECSE) of IDEA, respectively. However, NCES broadly surveyed parents of 48-month-olds by asking whether their child had received special education and/or related services through either an IFSP or IEP following a diagnosis for a disability or developmental delay. Our study therefore uses the term EI/ECSE to be consistent with how parents were surveyed about their child’s receipt of special education and/or related services due to a disability or developmental delay diagnosis.
References
- American Academy of Pediatrics. [Accessed 5/30/12];Recommendations for preventive pediatric health care. 2008 at: http://brightfutures.aap.org/pdfs/AAP%20Bright%20Futures%20Periodicity%20Sched%20101107.pdf.
- Artiles AJ, Rueda R, Salazar JJ, Higareda I. Within-group diversity in minority disproportionate representation: English language learners in urban school districts. Exceptional Children. 2005;71(3):283–300. [Google Scholar]
- Bahr MW, Fuchs D, Stecker PM, Fuchs LS. Are teachers’ perceptions of difficult-to teach students racially biased? School Psychology Review. 1991;20(4):599–608. [Google Scholar]
- Blanchett WJ, Klingner JK, Harry B. The intersection of race, culture, language, and disability: Implications for urban education. Urban Education. 2009;44:389–409. doi: 10.1177/0042085909338686. [DOI] [Google Scholar]
- Bodovski K, Farkas G. Mathematics growth in early elementary school: The roles of beginning knowledge, student engagement, and instruction. The Elementary School Journal. 2007;108:115–130. doi: 10.1086/525550. [DOI] [Google Scholar]
- Chen IC, Lee HC, Yeh GC, Lai CH, Chen SC. The relationship between parental concerns and professional assessment in developmental delay in infants and children—a hospital-based study. Journal of the Chinese Medical Association. 2004;67:239–244. [PubMed] [Google Scholar]
- Chen IC, Lin CH, Wen SH, Wu CH. How effectively do parents discern their children’s cognitive deficits at a preschool age? Journal of the Chinese Medical Association. 2007;70:445–450. doi: 10.1016/S1726-4901(08)70036-4. [DOI] [PubMed] [Google Scholar]
- Chernoff JJ, Flanagan KD, McPhee C, Park J. Preschool: First findings from the Preschool Follow-up of the Early Childhood Longitudinal Study, Birth Cohort (ECLS-B) National Center for Education Statistics, Institute of Education Sciences, U.S. Department of Education; Washington, DC: 2007. (NCES 2008-025) Retrieved from http://nces.ed.gov/help/orderinfo.asp. [Google Scholar]
- Coll CG, Crnic K, Lamberty G, Wasik BH. An integrative model for the study of developmental competencies in minority children. Child Development. 1996;67:1891–1914. doi: 10.2307/1131600. [DOI] [PubMed] [Google Scholar]
- Coutinho M, Oswald DP. Disproportionate Representation in Special Education: A Synthesis and Recommendations. Journal of Child and Family Studies. 2000;9:135–156. doi: 10.1023/A:1009462820157. [DOI] [Google Scholar]
- Coutinho MJ, Oswald DP, Best AM. The influence of socio-demographics and gender on the disproportionate identification of minority students as learning disabled. Remedial and Special Education. 2002;23:49–59. [Google Scholar]
- Danesco ER. Parental beliefs on childhood disability: Insights on culture, child development, and intervention. International Journal of Disability, Development, and Education. 1997;44:41–52. doi: 10.1080/0156655970440104. [DOI] [Google Scholar]
- Delgado CEF, Scott KG. Comparison of referral rates for preschool children at risk for disabilities using information obtained from birth certificate records. Journal of Special Education. 2006;40:28–35. doi: 10.1177/00224669060400010301. [DOI] [Google Scholar]
- Delgado CEF, Vagi SJ, Scott KG. Early risk factors for speech and language impairments. Exceptionality. 2005;13:173–191. doi: 10.1207/s15327035ex1303_3. [DOI] [Google Scholar]
- Donovan MS, Cross CT. Minority students in special and gifted education. Washington, DC: National Academy Press; 2002. [Google Scholar]
- Duncan GJ, Ludwig J, Magnuson KA. Reducing poverty through preschool interventions. Future of Children. 2007;17:143–160. doi: 10.1353/foc.2007.0015. [DOI] [PubMed] [Google Scholar]
- Early Childhood Outcomes Center. Outcomes for children served through IEDA’s Early Childhood Program. 2011 Retrieved from http://www.fpg.unc.edu/~eco/assets/pdfs/outcomesforchildrenfinal.pdf.
- Farkas G. Racial disparities and discrimination in education: What do we know, how do we know it, and what do we need to know? Teachers College Record. 2003;105:1119–1146. doi: 10.1111/1467-9620.00279. [DOI] [Google Scholar]
- Flores G. Devising, implementing, and evaluating successful interventions to eliminate racial/ethnic disparities in children’s health and healthcare: tips, pitfalls, and a research agenda. Pediatrics. 2009;124:214–223. doi: 10.1542/peds.2009-1100J. [DOI] [PMC free article] [PubMed] [Google Scholar]
- Flores G, Abreu M, Chaisson CE, Meyers A, Sachdeva RC, Fernandez H, Santos-Guerrero I. A randomized trial of the effectiveness of community-based case management in insuring uninsured Latino children. Pediatrics. 2005;116:1433–1441. doi: 10.1542/peds.2005-0786. [DOI] [PubMed] [Google Scholar]
- Flores G the Committee on Pediatric Research. Technical report—Racial and ethnic disparities in health and health care of children. Pediatrics. 2010;125:979–1020. doi: 10.1542/peds.2010-0188. [DOI] [PubMed] [Google Scholar]
- Foran MO. Island (Unpublished doctoral dissertation) University of Rhode Island; Kingston, Rhode Island: 2007. Representational status of minority students in special education in the state of Rhode. [Google Scholar]
- Geary DC. Mathematics and learning disabilities. Journal of Learning Disabilities. 2004;37:4–15. doi: 10.1177/00222194040370010201. [DOI] [PubMed] [Google Scholar]
- Glascoe FP. Using parents’ concerns to detect and address developmental and behavioral problems. Journal of the Society of Pediatric Nurses. 1999;4:24–35. doi: 10.1111/j.1744-6155.1999.tb00077.x. [DOI] [PubMed] [Google Scholar]
- Glascoe FP, Dworkin PH. The role of parents in the detection of developmental and behavioral problems. Pediatrics. 1995;95(6):829–836. [PubMed] [Google Scholar]
- Harry B. Restructuring the participation of African-American parents in special education. Exceptional Children. 1992;59(2):123–131. [Google Scholar]
- Harry B. The disproportionate representation of minority students in special education: Theories and recommendations. Alexandria, VA: National Association of State Directors of Special Education; 1994. [Google Scholar]
- Harry B, Arnaiz P, Klingner J, Sturges K. Schooling and the construction of identity among minority students in Spain and the United States. Journal of Special Education. 2008;42:15–25. 101177/0022466907313605. [Google Scholar]
- Hays DG, Prosek EA, McLeod AL. A mixed methodological analysis of the role of culture in the clinical decision-making process. Journal of Counseling. 2010;88:114–121. [Google Scholar]
- Hebbeler K, Spiker D, Bailey D, Scarborough A, Mallik S, Simeonsson R, Singer M, Nelson L. Final report of the National Early Intervention Longitudinal Study (NEILS) Menlo Park, CA: SRI International; 2007. Early intervention for infants and toddlers with disabilities and their families: Participants, services, and outcomes. [Google Scholar]
- Heckman J, Grunewald R, Reynolds A. The dollar and cents of investing early: Cost-benefit analysis in early care and education. Zero to Three. 2006;26:10–17. [Google Scholar]
- Heckman JJ, Moon SH, Pinto R, Savelyev PA, Yavitz AQ. The rate of return to the High Scope Perry Preschool Program. Journal of Public Economics. 2010;94:114–128. doi: 10.1016/j.jpubeco.2009.11.001. [DOI] [PMC free article] [PubMed] [Google Scholar]
- Heller KA, Holtzman WH, Messick S, editors. Placing children in special education: A strategy for equity. Washington, DC: National Academy Press; 1982. [Google Scholar]
- Hibel J, Farkas G, Morgan PL. Who is placed into special education? Sociology of Education. 2010;83:312–332. doi: 10.1177/0038040710383518. [DOI] [PMC free article] [PubMed] [Google Scholar]
- Hogan DP, Park JM. Family factors and social support in the developmental outcomes of very low birthweight children. Clinical Perinatology. 2000;27:433–459. doi: 10.1016/s0095-5108(05)70030-0. [DOI] [PubMed] [Google Scholar]
- Hosp JL, Reschly DJ. Referral rates for intervention or assessment: A meta-analysis of racial differences. The Journal of Special Education. 2003;37:67–80. doi: 10.1177/00224669030370020201. [DOI] [Google Scholar]
- Hosp JL, Reschly DJ. Disproportionate representation of minority students in special education: Academic, demographic, and economic predictors. Exceptional Children. 2004;70(2):185–99. [Google Scholar]
- Johnson S, Marlow N, Wolke D, Marston L, O’Hare A, Schulte J. Validation of a parent report measure of cognitive development in very preterm infants. Developmental Medicine and Child Neurology. 2004;46:389–397. doi: 10.1017/s0012162204000635. [DOI] [PubMed] [Google Scholar]
- Johnson S, Wolke D, Marlow N the Preterm Infant Parenting Study Group. Develomental assessments of preterm infants at 2 years: Validity of parent reports. Developmental Medicine and Child Neurology. 2008;50:58–62. doi: 10.1111/j.1469-8749.2007.02010.x. [DOI] [PubMed] [Google Scholar]
- Katusic SK, Colligan RC, Barbaresi WJ, Schaid DJ, Jacobsen SJ. Incidence of reading disability in a population-based birth cohort, 1976–1982, Rochester, Minn. Mayo Clinic Proceedings. 2001;76:1081–1092. doi: 10.4065/76.11.1081. [DOI] [PubMed] [Google Scholar]
- Mandell DS, Listerud J, Levy SE, Pinto-Martin JA. Race differences in the age at diagnosis among Medicaid-eligible children with autism. Journal of the American Academy of Child and Adolescent Psychiatry. 2002;41:1447–1453. doi: 10.1097/00004583-200212000-00016. [DOI] [PubMed] [Google Scholar]
- Mann EA, McCartney K, Park JM. Preschool predictors of the need for early remedial and special education services. Elementary School Journal. 2007;107:273–285. doi: 10.1086/511707. [DOI] [Google Scholar]
- Mannerkoski MK, Aberg LE, Auti TH, Hoikkala M, Sarna S, Heiskala HJ. Newborns at risk for special-education placement: A population-based study. European Journal of Pediatric Neurology. 2007;11:223–231. doi: 10.1016/j.ejpn.2007.01.005. [DOI] [PubMed] [Google Scholar]
- Markowitz J, Carlson E, Frey W, Riley J, Shimshak A, Heinzen H, Lee H. Preschoolers with disabilities, characteristics, services, and results: Wave 1 overview report from the Pre-elementary Education Longitudinal Study (PEELS) Washington, DC: U.S. Department of Education; 2006. [Google Scholar]
- Martin SL, Ramey CT, Ramey S. The prevention of intellectual impairments in children of impoverished families: Findings of a randomized trial of educational daycare. American Journal of Public Health. 1990;80:844–847. doi: 10.2105/ajph.80.7.844. [DOI] [PMC free article] [PubMed] [Google Scholar]
- McCormick MC, Brooks-Gunn J, Buka SL, Goldman J, Yu J, Salganik M, Scott DT, Casey PH. Early intervention in low birth weight premature infants: Results at 18 years of age for the Infant Health and Development Program. Pediatrics. 2006;117:771–780. doi: 10.1542/peds.2005-1316. [DOI] [PubMed] [Google Scholar]
- Merrell KW. Preschool and Kindergarten Behavior Scales. 2. Austin, TX: PRO-ED; 2003. [Google Scholar]
- Merrell KW, Shinn MR. Critical variables in the learning disabilities identification process. School Psychology Review. 1990;19(1):74–82. [Google Scholar]
- Morgan PL, Frisco M, Farkas G, Hibel J. A propensity score matching analysis of the effects of special education. Journal of Special Education. 2010;43:236–254. doi: 10.1177/0022466908323007. [DOI] [PMC free article] [PubMed] [Google Scholar]
- Najarian M, Snow K, Lennon J, Kinsey S. Early Childhood Longitudinal Study, Birth Cohort (ECLS-B). Preschool-Kindergarten 2007 psychometric report. National Center for Health Statistics, Institute of Education Sciences. US Department of Education; Washington, DC: 2010. (NCES 2010-009) [Google Scholar]
- National Education Association. Truth in labeling: Disproportionality in special education. 2007 Retrieved from http://www.nea.org/assets/docs/HE/EW-TruthinLabeling.pdf.
- O’Hara J. Learning disabilities and ethnicity: Achieving cultural competence. Advances in Psychiatric Treatment. 2003;9:166–174. doi: 10.1192/apt.9.3.166. [DOI] [Google Scholar]
- Oswald DP, Coutinho MJ, Best AM, Singh NN. Ethnic representation in special education: The influence of school-related economic and demographic variables. Journal of Special Education. 1999;32:194–206. doi: 10.1177/002246699903200401. [DOI] [Google Scholar]
- Palfrey JS, Singer JD, Walker DK, Butler JA. Early identification of children’s special needs: A study in five metropolitan communities. Journal of Pediatrics. 1987;111:651–659. doi: 10.1016/s0022-3476(87)80238-x. [DOI] [PubMed] [Google Scholar]
- Pastor PN, Reuben CA. Racial and ethnic differences in ADHD and LD in young school-age children: Parental reports in the National Health Interview Survey. Public Health Report. 2005;120:383–392. doi: 10.1177/003335490512000405. [DOI] [PMC free article] [PubMed] [Google Scholar]
- Pena ED, Fiestas C. Talking across cultures in early intervention: finding common ground to meet children’s communication needs. Perspectives on Culturally and Linguistically Diverse Populations. 2009;16:79–85. [Google Scholar]
- Reynolds AJ, Temple JA, Robertson DL, Mann EA. Long-term effects of an early childhood intervention on educational achievement and juvenile arrest. Journal of the American Medical Association. 2001;285:2339–2346. doi: 10.1001/jama.285.18.2339. [DOI] [PubMed] [Google Scholar]
- Reynolds AJ, Temple JA, Ou SR, Arteaga IA, White BAB. School-based early childhood education and age-28 well-being: Effects by timing, dosage, and subgroups. Science. 2011;333:360–364. doi: 10.1126/science.1203618. [DOI] [PMC free article] [PubMed] [Google Scholar]
- Reynolds AJ, Temple JA, White BA, Ou SR, Robertson DL. Age 26 cost-benefit analysis of the Child-parent Center Early Education Program. Child Development. 2011;82:379–404. doi: 10.1111/j.1467-8624.2010.01563.x. [DOI] [PMC free article] [PubMed] [Google Scholar]
- Rosenberg SA, Zhang D, Robinson CC. Prevalence of developmental delay and participation in early intervention services for young children. Pediatrics. 2008;121:e1503–e1509. doi: 10.1542/peds.2007-1680. [DOI] [PubMed] [Google Scholar]
- Samson JF, Lesaux NK. Language-minority learners in special education: Rates and predictors of identification for services. Journal of Learning Disabilities. 2009;42:148–162. doi: 10.1177/0022219408326221. [DOI] [PubMed] [Google Scholar]
- Scarborough AA, Spiker D, Mallik S, Hebbeler KM, Bailey DB, Simeonsson RJ. A national look at children and families entering early intervention. Exceptional Children. 2004;70(4):469–483. [Google Scholar]
- Scarborough HS. Very early language deficits in dyslexic children. Child Development. 1990;61(6):1728–1743. [PubMed] [Google Scholar]
- Shi L, Stevens GD. Disparities in access to care and satisfaction among U.S. children: The roles of race/ethnicity and poverty status. Public Health Reports. 2005;120:431–441. doi: 10.1177/003335490512000410. [DOI] [PMC free article] [PubMed] [Google Scholar]
- Skiba RJ, Poloni-Staudinger L, Simmons AB, Feggins-Azziz LR, Chung CG. Unproven links: Can poverty explain ethnic disproportionality in special education? Journal of Special Education. 2005;39:130–144. doi: 10.1177/00224669050390030101. [DOI] [Google Scholar]
- Skiba RJ, Simmons A, Ritter S, Kohler K, Henderson M, Wu T. The context of minority disproportionality: Practitioner perspectives on special education referral. Teachers’ College Record. 2006;108:1424–1459. doi: 10.1111/j.1467-9620.2006.00699.x. [DOI] [Google Scholar]
- Skiba RJ, Simmons AB, Ritter S, Gibb AC, Rausch MK, Cuadrado J, Chung CG. Achieving equity in special education: History, status, and current challenges. Exceptional Children. 2008;74(3):264–288. [Google Scholar]
- Smedley BD, Stith AY, Nelson AR, editors. Unequal treatment: Confronting racial and ethnic disparities in health care. Washington, DC: National Academies Press; 2003. [PubMed] [Google Scholar]
- U.S. Department of Education, Office of Civil Rights. Annual report to Congress of the Office of Civil Rights: Fiscal Year 2007–2008; Washington, DC. 2009. [Google Scholar]
- U.S. Department of Education. Individuals with Disabilities Act data: State-level data files: Child count. 2011a Retrieved from http://www.ideadata.org/StateLevelFiles.asp.
- U.S. Department of Education. Fiscal Year 2010 President’s budget state tables for the U.S. Department of Education. 2011b Retrieved from http://www2.ed.gov/about/overview/budget/statetables/index.html#update.
- U.S. Department of Education, Office of Special Education and Rehabilitative Services, Office of Special Education Programs. 30th Annual Report to Congress on the Implementation of the Individuals with Disabilities Education Act, 2008; Washington, D.C. 2011.2011c. [Google Scholar]
- Waitoller FR, Artiles AJ, Cheney DA. The miner’s canary: A review of overrepresentation research and explanations. Journal of Special Education. 2010;44:29–49. doi: 10.1177/0022466908329226. [DOI] [Google Scholar]
- Walker SP, Chang SM, Vera-Hernandez M, Grantham-McGregor S. Early childhood stimulation benefits adult competence and reduces violent behavior. Pediatrics. 2011;127(5):849–857. doi: 10.1542/peds.2010-2231. [DOI] [PubMed] [Google Scholar]
- Weikart DP. Changing early childhood development through educational intervention. Preventive Medicine. 1998;27:233–237. doi: 10.1006/pmed.1998.0280. [DOI] [PubMed] [Google Scholar]
- Zigler E, Taussing C, Black K. Early childhood intervention: A promising preventative for juvenile delinquency. American Psychologist. 1992;47(8):997–1006. doi: 10.1037//0003-066x.47.8.997. [DOI] [PubMed] [Google Scholar]