

Abstract
Protein G is an IgG binding protein that has been widely exploited for biotechnological purposes. Rosetta protein modeling identified a set of favorable polar mutations in Protein G, at its binding interface with the Fc domain of Immunoglobulin G, that were predicted to increase the stability and tighten the binding relative to native Protein G, with only a minor perturbation of the binding mode seen in the crystal structure. This triple mutant was synthesized and evaluated experimentally. Relative to the native protein G, the mutant showed a 3.5-fold enhancement in display level on the surface of yeast and a 5-fold tighter molar affinity for rabbit and human IgG. We attribute the improved affinity to a network of hydrogen bonds exploiting specific polar groups on human and rabbit Fc. The relative specificity increased as well since there was little affinity enhancement for goat and mouse Fc, while the affinity for rat Fc was poorer by half. This designed Protein G will be useful in biotechnological applications as a recombinant protein, where its improved affinity, display and specificity will increase antibody capture sensitivity and capacity. Furthermore, the display of this protein on the surface of yeast introduces the concept of the use of yeast as an affinity matrix.
Keywords: Computational protein design, Fc domain, Immunoglobulin G, Polar interaction, Protein G
Introduction
Protein G (PrG) is an immunoglobulin G (IgG) binding protein found on the surface of group G streptococci (Fahnestock et al., 1986). It is thought to be involved in pathogenesis, facilitating evasion of the immune system by binding host IgG and thereby camouflaging the bacterial surface with host proteins (Goward et al., 1993) and/or by inhibiting signal transduction by masking the Fc from the immune system. PrG consists of three Fc-binding domains (C1, C2 and C3), as well as an albumin binding portion (Akerstrom et al., 1987). The Fc domain is common to all antibodies and plays a role in antibody effector function, signaling and antibody fate. The crystal structure of the C2 domain bound to an Fc domain (Sauer-Eriksson et al., 1995) shows that it involves predominantly polar interactions across the interface with multiple hydrogen bonds and salt bridges. Indeed, there are only three significant hydrophobic interactions: burial of two methionine residues and one isoleucine on the Fc domain side. In comparison, the interaction between protein A and Fc is mediated predominantly by hydrophobic interactions (Deisenhofer, 1981).
The Fc-binding property of PrG has led to numerous biotechnological applications of PrG as an affinity reagent. These include antibody purification or detection (Stahl et al., 1993), siRNA delivery (Bae et al., 2013) and immuno-rolling circle amplification (Akter et al., 2011). Higher affinity variants of PrG's Fc-binding domain would significantly enhance the biotechnological utility of this potent reagent. We sought to improve the interaction between PrG and the Fc domains of rabbit and human IgG antibodies by using Rosetta (Rohl et al., 2004; Leaver-Fay et al., 2011) to identify interface amino acids that could improve affinity if mutated, and then experimentally examining the effects of these mutations on Fc binding.
Design of novel protein–protein interactions is a current challenge that paves the way for advanced therapeutics, affinity reagents and self-assembling systems. Recent years have seen advances in computational redesign of protein–protein interfaces as well as the de novo design of binding partners (Fleishman et al., 2011c). However, protein interface design efforts often fail, and inaccuracy in modeling buried polar interactions appears to be a major failure mode (Der et al., 2013; Stranges and Kuhlman, 2013). Instead of enhanced polar interaction, most successful examples of protein interface redesign have relied upon steric and hydrophobic interactions; including a hydrophobic cleft (Jha et al., 2010), a designed hydrophobic motif (Karanicolas et al., 2011), a designed hydrophobic hotspot (Fleishman et al., 2011b), mutating polar to non-polar amino acids, or extending the side chain in non-polar amino acids (Liu et al., 2007; Sammond et al., 2007; Fridman et al., 2013). Examples of de novo designs exploiting polar mutations are rare. Polar interactions have resulted in antibody-affinity improvement (Lippow et al., 2007) and in some cases have been used to confer specificity (Havranek and Harbury, 2003). In two other recent notable successes, the polar mutants emerged from random directed evolution techniques not by blind computational determination (Fleishman et al., 2011b; Karanicolas et al., 2011). Polar interactions are attractive because of the potential for a large gain in both binding energy and specificity from very few mutations (Joachimiak et al., 2006; Stranges et al., 2011; Der et al., 2012; Procko et al., 2013). Here, we present a successful polar residue redesign strategy that improves an important, ubiquitous, biotechnology reagent.
Most reports involving antibodies and improved affinity are concerned with finding a better affinity antibody for a specific target. Instead, here we are modifying PrG, which interacts with the Fc domain of the antibody, well away from the variable region that is responsible for antigen binding. Thus, our recombinant PrG is aimed at enhancing a general-purpose affinity reagent for human/rabbit antibodies.
Our redesign problem is one-sided: we are engineering PrG while leaving its target human IgG-Fc protein in its unmodified native form. This restriction increases the difficulty as it denies convenient strategies possible in two-sided design, such as swapping a polar pair across the interface, or entirely erasing troublesome polar interactions. Since the prospect of a redesign further improving upon a natural, highly evolved, tight binder (sub micro molar) is challenging for in silico design, we are pleased to report success here.
Materials and methods
Refining the structure of the complex
The crystal structure (PDB code 1FCC) (Sauer-Eriksson et al., 1995) is a relatively low resolution structure (3.20 Å) containing the bound form of human Fc (hFc; Chain A) and PrG (Chain C). The structure of the complex was refined using the ‘constrained relax’ protocol of the Rosetta macromolecular modeling suite to prepare a template free of clashes in the Rosetta potential (Nivon et al., 2013); this was the starting point for all subsequent in silico mutagenesis. Ten relaxation trajectories were performed and the lowest energy structure was then used for the sequence redesign.
Redesign of the interface sequence
We used the protein interface design protocol (Fleishman et al., 2011a) in release 3.4 of the Rosetta macromolecular modeling suite (Bonneau et al., 2001; Rohl et al., 2004; Leaver-Fay et al., 2011) to predict mutations that can improve binding affinity. ‘Interface residues’ were defined as any pair of residues between the hFc and PrG whose side chains' centroids were within 8 Å. The interface redesign protocol cycles through four steps. In the first step, PrG is further refined with small backbone perturbations and side chain rotamer variations focused on the interface region, along with rigid body minimization of the two domains. In the second step, the interface sequence is modified and the interface repacked by side chain rotamer sampling and rigid body minimization of the total Rosetta energy (Gray et al., 2003). During the first two steps the energy function is softened to tolerate small clashes in the repulsive Lennard-Jones potential term (‘soft-rep’ protocol), which greedily accelerates sequence changes. The third step repeats the second step with a repulsive Lennard-Jones potential term to anneal the residual atomic clashes. In the final step, small torsion angle changes to the backbone are allowed as well. Ten cycles of steps 2–4 are applied to generate each model. Around 1900 models were generated.
Estimation of binding energy from computation
Binding energies are computed from the difference of the Rosetta energy in the bound and unbound forms. An implicit assumption is that the backbone structure of the unbound domain is unchanged from the bound form though the rotamers may vary. While that assumption could be problematic for proteins with large allosteric rearrangements upon binding, it is appropriate here where the feature of interest is the difference in binding energy between the native and the near native designed interactions.
Selection of mutations for experiments
We screened the design ensemble, keeping the 10% of the 1900 models with the lowest total Rosetta energy. We further filtered these high stability complexes by binding energy, keeping 30 with the tightest binding energy. Models were inspected by eye using the PyMOL molecular graphics tool (Schrödinger, LLC) and, as described below, we further narrowed our focus to five mutation sites. The sequence diversity in the 30 models at these positions is shown in Fig. 1.
Fig. 1.

Position-specific sequence diversity in the ensemble of models. The histogram (LOGO) shows the sequence recurrence frequency at five positions based on the best 1.5% of 1900 design models for PrG. There is a distinct preference for mutation of two residues to highly polar residues (A24E and K28R). Our experimental structure also included the less abundant mutation V29H. Each column header indicates the native PrG sequence.
Comparison with the native sequence
As a basis for comparison, we followed the same protocols above without letting the sequence vary from the native. This restriction reduces the search space, so for this we generated 30 models. As mentioned above, we chose the 10% of the 30 models by the total Rosetta energy. Figure 2B shows the model with the lowest binding energy out of top three models based on total Rosetta energy.
Fig. 2.
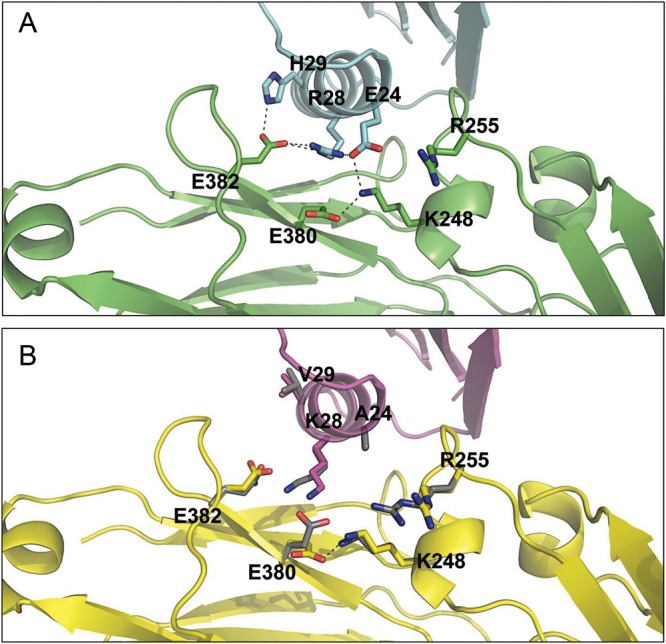
Predicted structure of the PrG and hFc interface. (A) A Rosetta predicted model of the hFc (green) bound to the designed ERH mutant of PrG (cyan) shows a partially buried, polar network forming connections across the interface. (B) The Rosetta-relaxed structure of native-sequence PrG (magenta) and hFc (yellow). The overlaid (3.2 Å resolution) crystal structure before refinement (gray) shows the Fc polar groups along the rim of the interface have fewer interactions to the PrG than the mutant.
Comparative modeling of goat, mouse and rat IgG Fc domain
Using the PrG and hFc as a template, we substituted the amino acids on Fc, which were within 5 Å of the PrG chain with the corresponding amino acids of goat, mouse and rat (based on multiple sequence alignment, Supplementary Fig. S1). For each fixed sequence, 30 trajectories were carried out by using both the native and mutated PrG sequences. The binding energy reported (Supplementary Table SI) is the average of the top three models based on total Rosetta energy for each subtype. Mouse and rat had identical interface substitutions and thus are indistinguishable at the level of comparative modeling.
Random protein–protein docking to estimate the energy funnel
On the hFc interface, 10 200 protein–protein docking trajectories (Wang et al., 2007; Chaudhury et al., 2011) were sampled with both the native and mutated PrG. Each docking trajectory was initialized with a random rigid body translational and rotational perturbation of the PrG domain over a standard deviation of 3 Å and 8°, respectively. After rotamer relaxation, the total energy and binding energy were tabulated (Fig. 3).
Fig. 3.

Scatter plot of predicted model energy versus deviation from the designed structure for a series of docking perturbations. Each point on the plot is a Rosetta model perturbed from the selected minimum energy conformation for mutant complex or relaxed native complex and their backbone deviation referenced to the selected mutant complex with lowest binding energy. Both the triple mutant ERH PrG (black/left) and the relaxed native (gray/right) show the onset of a strong correlation between model's energy and its atomic deviation from the structure of our designed model. This ‘funnel’ is deeper, sustained over a wider range, and more populated for the mutant than the native. For expository convenience, the native models are shown referenced to the designed structure not their relaxed native structure: none of the low energy native models are within ∼1 Å of the designed mutant model (RMS C-alpha superposition) so their funnel minimum is displaced. (A and B): The total energy indicates the relative stability of the complex. (C and D): The interface score is the bound minus unbound total energy.
Yeast surface display of PrG and ERH mutant
The C2 binding domain gene from Streptococcal PrG (PrG-WT) was synthesized by Genscript with the codon usage optimized for yeast expression (Saccharomyces cerevisiae strain). A secretion tag to promote display was placed at the N-terminal and the strand 11 tag from split green fluorescent protein (GFP) (Cabantous et al., 2005) was added to the C-terminal to allow quantitative normalization of the display of full-length PrG. The mutant ERH (PrG-ERH—named for the three altered amino acids) was generated using two oligos and the Phusion site-directed mutagenesis kit (Thermo Scientific). The two genes were subcloned into pDNL6-GFP11 (Ferrara et al., 2011), transformed into EBY100 yeast strain following the Yeast transformation kit protocol (Sigma) and verified by sequencing. Growing conditions and strands 1–10 GFP complementation assays were performed as previously described (Ferrara et al., 2011).
Measurement of binding affinity
The molecular affinities (dissociation constant or Kd) of wild-type (PrG-WT) and mutant (PrG-ERH) towards IgG were calculated directly on the yeast surface by fitting the display-normalized fluorescence of serial titrations of fluorescently labeled antibody (Chao et al., 2006) to yeast cells displaying the different PrG forms. This method of calculating affinity (Boder and Wittrup, 2000) shows consistency with other techniques (Gai and Wittrup, 2007). The AlexaFluor 647-conjugated IgGs, purchased from Jackson Immuno Research, were determined to have no fluorescent crosstalk with the GFP, allowing two-channel flow cytometer assays to separately measure display and antibody capture. Figure 4D–F show un-normalized data and the supplementary material contains normalized curves. This process was repeated for five Fc species: human, rabbit, mouse, rat and goat.
Fig. 4.

Experimental yeast display of the native and mutant PrG measures affinity and display levels by flow cytometry. (A) PrG displayed on the surface of yeast binds the Fc stalk region of a fluorescently labeled IgG antibody. The PrG C-terminal strand 11 tag complements with exogenous split GFP providing an independent channel to monitor display. (B) Histogram of cell-to-cell variation in GFP fluorescence shows mutant ERH PrG has higher display level than native (WT). (C) Histogram of antibody fluorescence tag shows increased capture by mutant relative to WT. (D) The two-axis plot shows each cell's simultaneous antibody tag fluorescence versus the displayed GFP tag fluorescence. The population of cells both displaying PrG (or the mutant) and binding IgG are gated to compute the mean affinity per molecule after normalization for display. (E) and (F) Titration series of the (un-normalized) mean antibody fluorescence as a function of IgG concentration for human (E) and rabbit (F) shown for both mutant (ERH) and native (WT) PrGs. See Table I for a summary for affinity changes for five species.
Results
Interface redesign of PrG and hFc
The crystal structure of the bound form of PrG and hFc was our starting template structure (PDB code: 1FCC) (Sauer-Eriksson et al., 1995). Since it was low resolution (3.2 Å), and, generally, crystal structures are not an exact local minimum of the Rosetta potential, we refined this to relieve artifactual clashes that would mask the subsequent smaller improvements arising from in silico mutations. The lowest energy refined native deviated only 0.15 Å root mean square deviation (RMSD) from the crystal structure backbone.
As detailed in the Materials and methods section, we redesigned the PrG sequence at its interface with Fc. This produced an ensemble of 1900 model structures, each of which is a local minimum of the Rosetta energy found by a Monte Carlo search of sequence and structure. From these we chose the 30 best models that had improved both the binding affinity and overall stability. Intriguingly, the binding mode of the designed structures had shifted by 1.5 Å (RMSD) from the crystal structure binding mode; this predicted shift may be what enables the new hydrogen bonding interactions we describe below.
Selection of one sequence for experimental analysis
At this point, the small spread in energies among the top models was not usefully discriminative as a sole criterion for selecting a minimal set of mutations. We examined the overall position-specific substitution frequencies observed across this ensemble of low energy models: 19 residue positions had designed mutations. The most intriguing consensus was a consecutive epitope of six amino acids from position 24 to 29 on PrG, which showed a very strong propensity for polar amino acids (Fig. 1).
From these six sites we chose a triple mutant for experimental study as follows. As seen in the Logo plot (Crooks et al., 2004) (Fig. 1), E27 had a strong propensity for its native residue, so conservative parsimony dictated leaving it unchanged in our experimental sequence. Residue T25 had its propensity dispersed across many amino acid types, so we avoided experimental mutation at this ambiguous site. This is also in accordance to the observation made earlier with respect to PrG mutations, where E27 was shown to be important for binding while T25 was tolerant to mutations (Sloan and Hellinga, 1998). Position 26 was also omitted because the buried side chain is directed away from the interface.
This left us with three positions which showed mutations from the non-polar to polar amino acids (A24, V29) or from the polar to more polar amino acids (K28). The most intriguing substitution was K28R. Our designs remodeled the existing inter-domain K28-E380 interaction to a more robust hydrogen bonding network (Fig. 2A). The weakness of this original interaction in the crystal structure is inferred from the Rosetta potential's tendency to flip the E380 rotamer to a different, intra-domain, interaction E380-K248 (Fig. 2B). Thus, even though this position had an imperfect consensus in the models (Fig. 1), the prospect of forming this enhanced hydrogen bonding network was attractive, hence we selected K28R.
The Logo plot (Fig. 1) shows only a weak propensity for our selected mutant V29H. However, the T and K model mutations at position 29 were involved in intra-domain hydrogen bonding which stabilized PrG but did not contribute to the binding energy to the Fc domain. Hence, we chose the V29H mutation over the T and K mutations, despite their higher model propensity, because it showed an inter-domain interaction. Moreover, in models that contained our other four selections (A24E, T25, E27 and K28R), it balanced the R28-E382 hydrogen bond. In the native crystal structure position, V29 appeared to have an unfilled void at the interface.
Models containing polar mutations A24E as well as K28R and V29H, dubbed PrG-ERH, showed formation of a hydrogen bond network in some of the models (Fig. 2A). In both the crystal structure and in the relaxed native complex, this strongly defined hydrogen bond network appeared to be absent (Fig. 2B). The inter-domain network offered the prospect of large energetic gain over the native in both the stability and affinity (Fig. 3).
Evidence for a strong basin of attraction around the lowest energy model
Experience has shown that a hallmark of a well-predicted protein–protein interaction is a deep energy well in the vicinity of the lowest energy conformation (Smith and Sternberg, 2002; Gray et al., 2003; London and Schueler-Furman, 2008). This may be assessed by random perturbations of the docking of the domains, and graphically exhibited by a scatterplot of each perturbed model's energy versus root mean square (RMS) C-alpha distance from the reference structure. Characteristically, after thousands of docking trajectories, one observes a large cloud of points (models) at high energy and large deviations that show no correlation to energy. The signature of a good interface is a subset of models forming an energy ‘funnel’ that descends from that larger cloud to much lower energy, converging close to the designed structure at the lowest energy. Also, anticipated is an absence of additional low energy funnels representing competing interface geometries. The deeper and more populated the basin of attraction, the more confident we are that our design structure will be the low energy experimental conformation.
The scatter plot (Fig. 3) of 10 200 randomly docked models shows the binding energy funnel of the native (gray circles) and redesigned A24E, K28R, V29H mutant PrG (black squares). Since they share similar overall interfaces, both native and redesigned PrG show qualitatively similar funnel shapes. However, the redesigned PrG (PrG-ERH) shows a quantitatively deeper, broader and more densely populated funnel than the native PrG (PrG-WT), which we attribute to the large energy gain of the new hydrogen bonding network.
The basin of attraction of the native deviated ∼1 Å from the best binding model of our mutant design. While small, the shift is wider than the width of the funnel, making it significant. This indicates a rigid body twist between the binding partners driven by these strong polar interface groups. Despite the shift, the mutant's funnel itself was deeper and more heavily sampled than the native, in both the scatter plots for total energy and binding energy. This dominating basin of attraction increases our confidence in the model precision.
Our Rosetta relaxed structures of both the native sequence and redesigned protein sequence showed a docked complex that deviated from the crystal structure by 1.5 Å (Supplementary Fig. S2). Essentially all of this deviation arises in a rigid body shift of the inter-domain binding mode, not in our small changes to the interface backbone and side chains. While surprisingly large, this deviation is within the 3.2 Å resolution of the 1FCC crystal structure. It has been seen that Rosetta relaxation can often improve (refine) the accuracy of a low resolution cryoEM density maps, nuclear magnetic resonance or crystal structure when the starting point is within a few angstroms of being correct (Qian et al., 2007; DiMaio et al., 2009). However, we must cautiously note that while we are optimistic that we have refined the model to higher accuracy at the interface, it is possible that 1.5 Å might exceed the convergence zone in which Rosetta can globally refine the X-ray structure of a large complex.
Experimental measurements
In order to assess the Rosetta predictions described above, separate genes for the native and mutant PrG were synthesized using yeast-preferred codons and cloned into a yeast display vector (Ferrara et al., 2012). This allows PrG to be displayed on the surface where it is able to bind exogenous, fluorescently labeled antibody (Fig. 4A). The displayed PrG also contained at its C-terminus a short GFP strand 11 (S11) tag. This can be complemented with exogenously added GFP strands 1–10, which is non-fluorescent until it binds to S11 (Cabantous et al., 2005). S11 has been engineered to avoid disruption of expression, folding, export or display in the yeast, and has been previously used to normalize protein display on yeast (Ferrara et al., 2011). The asymptotic affinity (Kd) is calculated from a titration series of antibody concentrations normalized to the concentration of the displayed PrG, assuring that the increased IgG binding activity obtained on yeast cells is not an artifact of the higher PrG ERH display (Colby et al., 2004) (Supplementary Fig. S3).
The GFP fluorescence histogram of cell-to-cell variation shown in Fig. 4B indicates that the per-cell display of mutant PrG (bottom panel) is increased by about 3.5-fold relative to the native (top panel). Figure 4D shows that the fluorescently labeled antibody captured by PrG varies linearly with the display levels and thus there is negligible non-specific binding. Table I summarizes the molar affinities (asymptotic binding constant Kd) derived from fits to the mean fluorescence in an antibody titration series (examples shown in Fig. 4E and F for human and rabbit IgGs).
Table I.
Measured molar binding constant for mutant (ERH) and native (WT) PrG against five IgG species.
|
Kd PrG-WT, (nM) |
Kd PrG-ERH, (nM) |
Affinity gain | Correlation coefficient | |
|---|---|---|---|---|
| Rabbit | 77 | 16 | 5x | 0.98 |
| Human | 250 | 49 | 5x | 0.94 |
| Goat | 320 | 300 | 1x | 0.97 |
| Rat | 670 | 1300 | 0.5x | 0.97 |
| Mouse | 920 | 640 | 1.5x | 0.99 |
The mutations also increased specificity to human IgG. Table I presents the binding affinity of the native and mutant PrG variants for IgGs from five species: rabbit, human, rat, mouse and goat. The ERH mutant shows 5-fold higher binding affinity than the native protein against human and rabbit antibodies, but little or no improvement for mouse, rat and goat IgGs.
There are no published structures of PrG complexed with goat, rat, mouse or rabbit Fc. Nevertheless, we endeavored to model the relative affinity of the new ERH mutant to goat and rat Fc by naively threading their unique interface residues onto the hFc structure. The predicted binding energies for these were negligibly different from hFc, which is contrary to the large experimentally measured affinity differences (Supplementary Table SI). To explain this, we note that while the human and rabbit share identical Fc interface residues, their measured Kd is quite different, indicating that strong differences can arise from residues outside the modeled interface region. Thus, comparative modeling restricted to just the interface is invalidated for these unknown structures.
Discussion
Our methodology relied on a computational Monte Carlo search across the structure and sequence of about 20 residue positions in PrG to optimize the Rosetta all-atom energy (Rohl et al., 2004). Because the Rosetta design process does not use molecular dynamics, explicit waters or exhaustive enumeration, it can efficiently explore a large combinatorial space of structure and sequence with relatively modest computing effort.
A dual criteria of improving both the complex stability and the binding affinity was imposed on the model selection. We parsimoniously down-selected to a set of three PrG mutations in close proximity (A24E, K28R and V29H), which were predicted to form a highly interconnected hydrogen bond network in the Rosetta generated de novo computational models.
Importantly, this was a blind design, based solely on the potential energy model, without directly imposing information about naturally occurring mutations at these sites. It was therefore reassuring to see that the same glutamate mutation (24E) has evolved in many natural variants of PrG. A Psiblast alignment (Altschul et al., 1997) finds ∼30% of the closest 100 sequence matches to PrG contain A24E; a few percent contain K28R, but none contain V29H.
Polar mutations can provide large gains in binding (Fleishman et al., 2011b; Karanicolas et al., 2011). However, the literature indicates that in silico design including a polar substitution is hazardous (Stranges and Kuhlman, 2013). The key impediment is that each polar residue adds a desolvation cost against binding that must be compensated with a sufficiently good interfacial interaction. Accurate calculation of both of these large energy terms is currently difficult often making their small difference, the predicted binding energy, unreliable even in sign. For a buried polar interaction, the solvation penalty is unforgiving, since it is paid regardless of whether a compensating polar interaction was well designed or not.
Our success with a triple polar mutation suggests an insight to overcome this hurdle: target long flexible polar groups at the rim of the binding interface. Our utilitarian definition of ‘rim’ is any residue buried by cross-interface contacts that could, after plausible side chain rearrangement, stretch its polar groups into a solvated region. Our polar mutations in PrG were along the interface rim. If the design turns out to be accurate, then one gets the full enthalpy benefit of the satisfied interfacial polar interactions, but otherwise, if a designed polar interaction fails, the rim location may allow flexible polar residues to rotate into contact with water molecules. Our hypothesis is that this rescues it from the desolvation penalty and thereby tolerates an imperfect design.
This ‘rim’ strategy offers the designer latitude to risk more polar substitutions. For example, we were concerned that the V29H mutation could be deleterious; in some Rosetta models histidine is seen in alternate conformation and not hydrogen bonding with E382. However, being at the rim of the interface, potential rotamer variations would allow the residue to solvate, potentially tolerating this hydrophobic-to-polar mutation. Indeed, the native complex appears to use this strategy as well: the native Fc interface has polar residues uncompensated by the native PrG but these lie along the rim of the binding patch.
Why does the native PrG lack this optimization? Given its role in pathogenesis, it is likely that for Streptococci expressing PrG, promiscuity with respect to Fc subtypes would be preferable to specific high affinity binding to the Fc from any single species. Consequently, the sequence and structure would be expected to forgo optimization for the human/rabbit-Fc specific polar groups we targeted. The empirical selectivity improvement for human and rabbit Fc relative to other species is consistent with this hypothesis. Indeed, since some of our inferred mutations are found in sequence homologs, it may be that some of those homologs belong to specialists for the human/rabbit subtype Fc.
Experimental evaluation showed a 5-fold affinity improvement for binding to Fc from human and rabbit, achieving <16 nM Kd in rabbit IgG and <49 nM Kd human IgG. We also observed a 3.5-fold increase in yeast display, likely reflecting increased solubility from the polar surface. This results in a yeast antibody capture system with >17-fold higher efficiency, and improved selectivity compared with native PrG. In addition to being useful as a replacement for PrG in many biotechnological applications, the display of this mutant PrG on the surface of yeast, also introduces the concept of renewable affinity matrices, akin to the use of Staphylococci to purify proteins based on the natural expression of protein A, but using improved recombinant proteins instead.
Conclusion
Polar interactions can help increase the specificity and sensitivity of protein–protein interactions and the present example succeeds in designing hydrogen bonds and salt bridges at the rim of an interface, yielding a novel PrG variant with improved IgG Fc-binding capacity.
Supplementary data
Funding
This work was supported by the Defense Threat Reduction Agency [CBCALL12-LS-6-0622 to C.E.M.S.], LANL Institutional Computing [W11_SynBio to C.E.M.S.] and LANL Laboratory Directed Research and Development program [20120029DR to C.E.M.S.], and by the National Institute of Health [5U54DK093500-02 to A.R.M.B.]
Supplementary Material
References
- Akerstrom B., Nielsen E., Bjorck L. J. Biol. Chem. 1987;262:13388–13391. [PubMed] [Google Scholar]
- Akter F., Mie M., Kobatake E. Anal. Biochem. 2011;416:174–179. doi: 10.1016/j.ab.2011.05.004. doi:10.1016/j.ab.2011.05.004. [DOI] [PubMed] [Google Scholar]
- Altschul S.F., Madden T.L., Schaffer A.A., Zhang J., Zhang Z., Miller W., Lipman D.J. Nucleic Acids Res. 1997;25:3389–3402. doi: 10.1093/nar/25.17.3389. [DOI] [PMC free article] [PubMed] [Google Scholar]
- Bae J., Mie M., Kobatake E. Biotechnol. Lett. 2013;35:2081–2089. doi: 10.1007/s10529-013-1299-y. doi:10.1007/s10529-013-1299-y. [DOI] [PubMed] [Google Scholar]
- Boder E.T., Wittrup K.D. Methods Enzymol. 2000;328:430–444. doi: 10.1016/s0076-6879(00)28410-3. [DOI] [PubMed] [Google Scholar]
- Bonneau R., Tsai J., Ruczinski I., Chivian D., Rohl C., Strauss C.E.M., Baker D. Proteins. 2001;(Suppl 5):119–126. doi: 10.1002/prot.1170. [DOI] [PubMed] [Google Scholar]
- Cabantous S., Terwilliger T.C., Waldo G.S. Nat. Biotechnol. 2005;23:102–107. doi: 10.1038/nbt1044. [DOI] [PubMed] [Google Scholar]
- Chao G., Lau W.L., Hackel B.J., Sazinsky S.L., Lippow S.M., Wittrup K.D. Nat. Protoc. 2006;1:755–768. doi: 10.1038/nprot.2006.94. doi:10.1038/nprot.2006.94. [DOI] [PubMed] [Google Scholar]
- Chaudhury S., Berrondo M., Weitzner B.D., Muthu P., Bergman H., Gray J.J. PLoS ONE. 2011;6:e22477. doi: 10.1371/journal.pone.0022477. doi:10.1371/journal.pone.0022477. [DOI] [PMC free article] [PubMed] [Google Scholar]
- Colby D.W., Kellogg B.A., Graff C.P., Yeung Y.A., Swers J.S., Wittrup K.D. Methods Enzymol. 2004;388:348–358. doi: 10.1016/S0076-6879(04)88027-3. doi:10.1016/S0076-6879(04)88027-3S0076687904880273[pii] [DOI] [PubMed] [Google Scholar]
- Crooks G.E., Hon G., Chandonia J.M., Brenner S.E. Genome Res. 2004;14:1188–1190. doi: 10.1101/gr.849004. [DOI] [PMC free article] [PubMed] [Google Scholar]
- Deisenhofer J. Biochemistry. 1981;20:2361–2370. [PubMed] [Google Scholar]
- Der B.S., Machius M., Miley M.J., Mills J.L., Szyperski T., Kuhlman B. J. Am. Chem. Soc. 2012;134:375–385. doi: 10.1021/ja208015j. doi:10.1021/ja208015j. [DOI] [PMC free article] [PubMed] [Google Scholar]
- Der B.S., Jha R.K., Lewis S.M., Thompson P.M., Guntas G., Kuhlman B. Proteins. 2013;81:1245–1255. doi: 10.1002/prot.24280. doi:10.1002/prot.24280. [DOI] [PMC free article] [PubMed] [Google Scholar]
- DiMaio F., Tyka M.D., Baker M.L., Chiu W., Baker D. J. Mol. Biol. 2009;392:181–190. doi: 10.1016/j.jmb.2009.07.008. doi:10.1016/j.jmb.2009.07.008. [DOI] [PMC free article] [PubMed] [Google Scholar]
- Fahnestock S.R., Alexander P., Nagle J., Filpula D. J. Bacteriol. 1986;167:870–880. doi: 10.1128/jb.167.3.870-880.1986. [DOI] [PMC free article] [PubMed] [Google Scholar]
- Ferrara F., Listwan P., Waldo G.S., Bradbury A.R. PLoS ONE. 2011;6:e25727. doi: 10.1371/journal.pone.0025727. doi:10.1371/journal.pone.0025727. [DOI] [PMC free article] [PubMed] [Google Scholar]
- Ferrara F., Naranjo L.A., Kumar S., Gaiotto T., Mukundan H., Swanson B., Bradbury A.R. PLoS ONE. 2012;7:e49535. doi: 10.1371/journal.pone.0049535. doi:10.1371/journal.pone.0049535. [DOI] [PMC free article] [PubMed] [Google Scholar]
- Fleishman S.J., Leaver-Fay A., Corn J.E., et al. PLoS ONE. 2011a;6:e20161. doi: 10.1371/journal.pone.0020161. doi:10.1371/journal.pone.0020161. [DOI] [PMC free article] [PubMed] [Google Scholar]
- Fleishman S.J., Whitehead T.A., Ekiert D.C., Dreyfus C., Corn J.E., Strauch E.M., Wilson I.A., Baker D. Science. 2011b;332:816–821. doi: 10.1126/science.1202617. doi:10.1126/science.1202617. [DOI] [PMC free article] [PubMed] [Google Scholar]
- Fleishman S.J., Whitehead T.A., Strauch E.M., et al. J. Mol. Biol. 2011c;414:289–302. doi: 10.1016/j.jmb.2011.09.031. doi:10.1016/j.jmb.2011.09.031. [DOI] [PMC free article] [PubMed] [Google Scholar]
- Fridman Y., Gur E., Fleishman S.J., Aharoni A. Proteins. 2013;81:341–348. doi: 10.1002/prot.24190. doi:10.1002/prot.24190. [DOI] [PubMed] [Google Scholar]
- Gai S.A., Wittrup K.D. Curr. Opin. Struct. Biol. 2007;17:467–473. doi: 10.1016/j.sbi.2007.08.012. doi:10.1016/j.sbi.2007.08.012. [DOI] [PMC free article] [PubMed] [Google Scholar]
- Goward C.R., Scawen M.D., Murphy J.P., Atkinson T. Trends Biochem. Sci. 1993;18:136–140. doi: 10.1016/0968-0004(93)90021-e. [DOI] [PubMed] [Google Scholar]
- Gray J.J., Moughon S., Wang C., Schueler-Furman O., Kuhlman B., Rohl C.A., Baker D. J. Mol. Biol. 2003;331:281–299. doi: 10.1016/s0022-2836(03)00670-3. [DOI] [PubMed] [Google Scholar]
- Havranek J.J., Harbury P.B. Nat. Struct. Biol. 2003;10:45–52. doi: 10.1038/nsb877. doi:10.1038/nsb877. [DOI] [PubMed] [Google Scholar]
- Jha R.K., Leaver-Fay A., Yin S., Wu Y., Butterfoss G.L., Szyperski T., Dokholyan N.V., Kuhlman B. J. Mol. Biol. 2010;400:257–270. doi: 10.1016/j.jmb.2010.05.006. doi:10.1016/j.jmb.2010.05.006. [DOI] [PMC free article] [PubMed] [Google Scholar]
- Joachimiak L.A., Kortemme T., Stoddard B.L., Baker D. J. Mol. Biol. 2006;361:195–208. doi: 10.1016/j.jmb.2006.05.022. doi:10.1016/j.jmb.2006.05.022. [DOI] [PubMed] [Google Scholar]
- Karanicolas J., Corn J.E., Chen I., et al. Mol. Cell. 2011;42:250–260. doi: 10.1016/j.molcel.2011.03.010. doi:10.1016/j.molcel.2011.03.010. [DOI] [PMC free article] [PubMed] [Google Scholar]
- Leaver-Fay A., Tyka M., Lewis S.M., et al. Methods Enzymol. 2011;487:545–574. doi: 10.1016/B978-0-12-381270-4.00019-6. doi:10.1016/B978-0-12-381270-4.00019-6. [DOI] [PMC free article] [PubMed] [Google Scholar]
- Lippow S.M., Wittrup K.D., Tidor B. Nat. Biotechnol. 2007;25:1171–1176. doi: 10.1038/nbt1336. doi:10.1038/nbt1336. [DOI] [PMC free article] [PubMed] [Google Scholar]
- Liu S., Zhu X., Liang H., Cao A., Chang Z., Lai L. Proc. Natl Acad. Sci. USA. 2007;104:5330–5335. doi: 10.1073/pnas.0606198104. doi:10.1073/pnas.0606198104. [DOI] [PMC free article] [PubMed] [Google Scholar]
- London N., Schueler-Furman O. Biochem. Soc. Trans. 2008;36:1418–1421. doi: 10.1042/BST0361418. doi:10.1042/BST0361418. [DOI] [PubMed] [Google Scholar]
- Nivon L.G., Moretti R., Baker D. PLoS ONE. 2013;8:e59004. doi: 10.1371/journal.pone.0059004. doi:10.1371/journal.pone.0059004. [DOI] [PMC free article] [PubMed] [Google Scholar]
- Procko E., Hedman R., Hamilton K., et al. J. Mol. Biol. 2013;425:3563–3575. doi: 10.1016/j.jmb.2013.06.035. doi:10.1016/j.jmb.2013.06.035. [DOI] [PMC free article] [PubMed] [Google Scholar]
- Qian B., Raman S., Das R., Bradley P., McCoy A.J., Read R.J., Baker D. Nature. 2007;450:259–264. doi: 10.1038/nature06249. doi:10.1038/nature06249. [DOI] [PMC free article] [PubMed] [Google Scholar]
- Rohl C.A., Strauss C.E., Misura K.M., Baker D. Methods Enzymol. 2004;383:66–93. doi: 10.1016/S0076-6879(04)83004-0. doi:10.1016/S0076-6879(04)83004-0. [DOI] [PubMed] [Google Scholar]
- Sammond D.W., Eletr Z.M., Purbeck C., Kimple R.J., Siderovski D.P., Kuhlman B. J. Mol. Biol. 2007;371:1392–1404. doi: 10.1016/j.jmb.2007.05.096. doi:10.1016/j.jmb.2007.05.096. [DOI] [PMC free article] [PubMed] [Google Scholar]
- Sauer-Eriksson A.E., Kleywegt G.J., Uhlen M., Jones T.A. Structure. 1995;3:265–278. doi: 10.1016/s0969-2126(01)00157-5. [DOI] [PubMed] [Google Scholar]
- Sloan D.J., Hellinga H.W. Protein Eng. 1998;11:819–823. doi: 10.1093/protein/11.9.819. [DOI] [PubMed] [Google Scholar]
- Smith G.R., Sternberg M.J. Curr. Opin. Struct. Biol. 2002;12:28–35. doi: 10.1016/s0959-440x(02)00285-3. [DOI] [PubMed] [Google Scholar]
- Stahl S., Nygren P.A., Sjolander A., Uhlen M. Curr. Opin. Immunol. 1993;5:272–277. doi: 10.1016/0952-7915(93)90017-m. [DOI] [PubMed] [Google Scholar]
- Stranges P.B., Kuhlman B. Protein Sci. 2013;22:74–82. doi: 10.1002/pro.2187. doi:10.1002/pro.2187. [DOI] [PMC free article] [PubMed] [Google Scholar]
- Stranges P.B., Machius M., Miley M.J., Tripathy A., Kuhlman B. Proc. Natl Acad. Sci. USA. 2011;108:20562–20567. doi: 10.1073/pnas.1115124108. doi:10.1073/pnas.1115124108. [DOI] [PMC free article] [PubMed] [Google Scholar]
- Wang C., Bradley P., Baker D. J. Mol. Biol. 2007;373:503–519. doi: 10.1016/j.jmb.2007.07.050. doi:10.1016/j.jmb.2007.07.050. [DOI] [PubMed] [Google Scholar]
Associated Data
This section collects any data citations, data availability statements, or supplementary materials included in this article.