

Abstract
Objectives. We assessed the extent to which living near foreclosed properties is associated with individuals’ subsequent weight gain.
Methods. We linked health and address information on 2068 Framingham Offspring Cohort members (7830 assessments) across 5 waves (1987–2008) to records of all Massachusetts foreclosures during that period. We used counts of lender-owned foreclosed properties within 100 meters of participants’ homes to predict body mass index (BMI; defined as weight in kilograms divided by the square of height in meters) and the odds of being overweight (BMI ≥ 25), adjusted for individual and area-level covariates.
Results. Mean BMI increased from 26.6 in 1987–1991 to 28.5 in 2005–2008; overweight prevalence increased from 59.0% to 71.3%. Foreclosures were within 100 meters of 159 (7.8%) participants’ homes on 187 occasions (1.8%), in 42 municipalities (21%). For each additional foreclosure, BMI increased by 0.20 units (95% confidence interval [CI] = 0.03, 0.36), and the odds ratio for being overweight associated with proximity to a foreclosure was 1.77 (95% CI = 1.02, 3.05).
Conclusions. We found a robust association between living near foreclosures and BMI, suggesting that neighbors’ foreclosures may spur weight gain.
More than 6 million mortgages were involved in foreclosure between 2007 and 2010,1 and more than 1.8 million US homes (1.5% of all housing units) were subject to a foreclosure filing in 2011 alone.2 Researchers have expressed concerns about the impact of the housing crisis on the public’s health,3–5 identifying housing distress and many of its sequelae as health risk factors.6–10 However, robust empirical evidence regarding the association between foreclosure and health remains sparse (Table A, available as a supplement to this article at http://www.ajph.org).11–18 Current studies, though useful, are limited by cross-sectional data,11,12,18 ecologic study designs,16 retrospective reporting,15,17 and self-reported measures.11–15,18 Although it is crucial that living close to foreclosed properties (i.e., homes that have been repossessed by lenders for nonpayment of mortgages) could affect the health of individuals not personally experiencing foreclosure, only 2 existing papers conceptualize foreclosure as a community-level health risk factor.11,16
Because they are typically vacant, bank-owned foreclosures can be unsightly or dangerous if poorly maintained or unsecured. They also compete with nearby properties for sale. Both these disamenity and supply-side impacts are thought to lower nearby home values,19–22 potentially provoking fears of reduced home equity among neighbors. Foreclosures have also been shown to encourage crime,23 to disrupt neighborhood social networks and strain social support systems,4 and to degrade the quality of the built environment as a form of blight.
Many of these economic, social, and physical impacts are, in turn, documented health risk factors, and in some studies, associated with higher BMI.24–29 With the Framingham Offspring Cohort data between years 1987 and 2008, and linking these to geocoded data on foreclosed properties, we tested the hypothesis that living near foreclosures is a risk factor for higher objectively measured body mass index (BMI; defined as weight in kilograms divided by the square of height in meters) and odds of being overweight.
METHODS
The Framingham Offspring Cohort study was initiated in 1971 with 5124 participants. It comprises children of the Framingham Study’s Original Cohort and the spouses of these children.30 Participants have completed 8 waves of surveys and medical examinations, conducted approximately every 4 years, to date. This analysis relied on the 5 most recent waves of examinations, waves 4 through 8 (1987–2008), covering the time period for which detailed housing data were available. We excluded from main models individuals who did not participate in any wave 4 through 8 with a Massachusetts address (n = 1483), who could not be assigned area-level covariates via geocoding (n = 107), or who were missing key covariate information (n = 1456; Figure A, available as a supplement to this article at http://www.ajph.org). The resulting sample included 7830 observations across 2068 participants, averaging 3.8 observations per individual, geocoded at each wave.31 Participants were observed in 203 municipalities over the course of the study.
Characterization of Foreclosure Activity
We used address-level data on all foreclosure deeds filed in Massachusetts between 1987 and 2008 to assess proximity to foreclosure activity. These data were compiled by the Warren Group, a private Boston-based real estate research company that collects public record foreclosure deeds sourced from government records and legally required public notification channels (e.g., newspaper postings). Property owner information from the foreclosure deeds allowed us to identify foreclosed properties that were bank‐owned (i.e., transferred back to the lender after homeowner default), also known as real estate–owned properties, and referred to as “foreclosures” throughout this article. We used each deed’s sale date to construct time-varying measures of proximity to foreclosure activity for each cohort member. The Federal Reserve Bank of Boston provided access to these data and assigned geographic coordinates to properties in the data set.
The outcome variables for the analysis were BMI, calculated from height and weight measured at each examination wave, and overweight (inclusive of obesity), defined as a BMI of 25 or higher.
Exposure
The primary exposure variable was the number of bank-owned foreclosures within 100 meters (i.e., the length of a standard block)32,33 of a participant’s home in the year preceding the participant’s examination date. We selected this distance on the basis of real estate studies that document financial spillover effects specifically within 100 meters of foreclosed properties.19–22 We included in the foreclosure count properties that were lender-owned during any of the 365 days before the examination. We report findings based on alternative time lags as sensitivity analyses. Specifying foreclosure exposure according to each participant’s exact address and examination date rather than at the neighborhood level allowed us to explore the effects of living near proximate foreclosures within neighborhoods.
We calculated exact distances between participants and foreclosures with geocoded addresses in SAS version 9.2 (SAS Institute, Cary, NC). Maximum residential frontage requirements (available for 93% of observations), which regulate property lot widths, averaged 44.5 meters,34 such that a 100-meter buffer would roughly encompass 2 properties on either side of the participant’s home and those directly behind and across the street from it.
Covariates
Individual demographic covariates included income (12 categories) and years of education, both reported at 1983 through 1987, before this study’s observational period, as well as age, race, and gender. We also constructed a series of environmental covariates to control for broad residential environment of the participants. To assess whether the presence of foreclosures within 100 meters of a participant’s home was simply a marker of local residential conditions, we quantified foreclosure activity in areas 0.2 to 0.5 kilometers from participant’s homes, counted in 100-meter distance bands (Figure A, available as a supplement to this article at http://www.ajph.org). We also counted the total number of housing units with recent (i.e., within a year of the examination) foreclosure sale deeds of any kind that were located within a kilometer of the participants’ homes.
To assess whether foreclosure activity within 100 meters of a participant’s home was simply a marker of municipal-level economic conditions, we gathered municipal-level poverty rates based on US Census data.35 We also calculated annual municipal-level foreclosure rates, defined as the percentage of housing units with any foreclosure sales deed that year. Housing unit counts, our denominator, came from the Massachusetts Department of Revenue.36
To control for potential confounding by urbanicity, we calculated the number of housing units per residential acre for each municipality. We employed ESRI’s ArcMap 9.3 (Environmental Systems Resource Institute, Redlands, CA) to process land use information provided by the Metropolitan Area Planning Council,37 Greater Boston’s regional planning agency. We excluded water, open space, commercial, industrial, and institutional acreage from land area before calculation so that our density measure described residential areas specifically.
Statistical Analysis
To assess the relationship between nearby foreclosures and BMI, we fit a series of regression models that accounted for the nonhierarchical structure of the data resulting from participants moving across neighborhoods over the course of the study (Figure B, available as a supplement to this article at http://www.ajph.org). This generated a structure whereby individuals’ memberships to neighborhoods changed over a period of time necessitating a 3-level cross-classified model of the following specification38: BMI measured at each wave (indexed by i) was conceptualized at level 1, nested within both individuals (indexed as j1), and municipalities (indexed as j2), at level 2.39 Because we measured proximate foreclosure count as a time-varying individual-level exposure, it also took the form of a level-1 variable. We specified the general form of the model as follows:
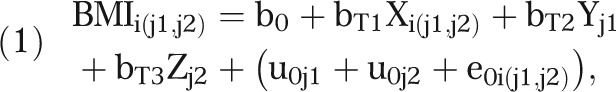 |
where  represents a vector of regression coefficients of time-varying covariates, including foreclosure exposure,
  a vector of regression coefficients of time-invariant individual-level covariates,
  regression coefficients of time-invariant municipal covariates, and error components of the model are bracketed. We allowed a random intercept to vary over every individual–municipality combination, and a fixed quadratic time effect accounted for secular trends in BMI.
We also conducted 6 sensitivity analyses. Incorporating individual weight trajectories into our main model led to convergence problems, likely because of model overspecification,40 so we fit a simpler 2-level model, with waves nested in individuals, that did allow slopes to vary for each individual over time, modeling individual weight trajectories. Municipalities (n = 204) were added to the fixed part of this model to account for shared municipal environment.
Next, we employed this approach to model odds of being overweight. Third, we examined the foreclosure–BMI relationship under alternative lag times, considering foreclosures created 3 years and 5 years before the examination date. We hypothesized that the foreclosure–BMI relationship would be attenuated as we expanded the time window. Fourth, we counted proximate foreclosure in the year following examinations and tested the predictive power of this explanatory variable. If recent, proximate foreclosures were markers of microenvironment distress (e.g., a particularly neglected block) uncontrolled by other covariates, we would expect that counts taken the year before and after examination dates would be similarly useful in explaining BMI. This is because street-level conditions, as indicated by foreclosure counts, would not be expected to vary in relation to examination date. In other words, within each wave, exact examination date assignments have no relationship to the timing of foreclosure activity on participants’ blocks. However, if the presence of foreclosures were causally associated with BMI, we would expect only past, not future, foreclosure counts to predict future BMI.
Fifth, we allowed the BMI–foreclosure exposure relationship to vary across municipalities such that the impact of living near an additional foreclosure could differ on the basis of municipality of residence. We accomplished this by adding to our main model a random slope for each municipality over proximate foreclosure count. We hypothesized that we would detect no variation by municipality if the observed relationship between foreclosures and BMI were plausibly causal. Finally, to assess the possibility that missing data might bias our results, we (1) compared BMI and foreclosure exposure for participants with existing versus missing covariates, and (2) fit an age-only adjusted model to explore the effect of proximate foreclosures on BMI with data from all geocoded Massachusetts participants.
All models were fit in SAS version 9.2.
RESULTS
Mean BMI was 26.6 in 1987 through 1991, and increased to 28.5 in 2005 through 2008. Prevalence of overweight, during the same time, increased from 59.0% to 71.3%. Overall, participants experienced the highest exposure to foreclosure activity during 1991 through 1995, reflecting the statewide foreclosure crisis of the early 1990s. Specifically, the number of participants exposed to foreclosures within a 1-kilometer buffer and to foreclosures within 100 meters of their homes was highest during 1991 through 1995, and municipal foreclosure rates were also at their highest during these years. For those with foreclosures in the neighborhood, the distance to the closest foreclosure was shortest during 1991 through 1995.
During the study period, we observed foreclosures within 100 meters of participant homes on 187 occasions (1.8%) in 159 unique participants (7.8%), distributed across 42 municipalities (21%). Over the study period, 1644 (80%) unique participants were exposed to foreclosures within 1 kilometer of their homes (Table 1).
TABLE 1—
Prevalence of Exposure to, Distance to, and Value of Proximate Real Estate–Owned Properties and Municipal-Level Housing and Economic Distress, According to Wave: Framingham Offspring Cohort, Massachusetts, 1987–2008
| Wave |
|||||
| Variable | 1987–1991 | 1991–1995 | 1995–1998 | 1998–2001 | 2005–2008 |
| No foreclosures present within 1 km, no. | 1983 | 692 | 998 | 1375 | 1442 |
| Participants with foreclosures present within 1-km, no. | 52 | 1339 | 999 | 583 | 431 |
| Distance to closest foreclosure within 1-km, km | 0.53 | 0.48 | 0.52 | 0.60 | 0.58 |
| Participants with foreclosures present within 100 m, no. | 2 | 94 | 48 | 29 | 14 |
| Participants with more than 1 foreclosure within 100 m, no. | 1 | 22 | 7 | 2 | 0 |
| Mean assessed value of foreclosures within 100 m of participants, US$ | 244 450 | 290 492 | 244 304 | 199 295 | 229 236 |
| Municipal-level foreclosure rate, % | 0.16 | 0.48 | 0.16 | 0.06 | 0.12 |
| Municipal-level poverty rate, % | 5.4 | 4.6 | 4.6 | 4.9 | 5.6 |
Municipal-level foreclosure rates were not highly correlated with housing unit density nor with poverty rate (r = 0.12 and 0.18, respectively; P < .001). Housing unit density was not correlated with exposure to proximate, recent foreclosures (r = 0.019; P = .09), suggesting that urbanicity41 was an unlikely confounder of the BMI–foreclosure relationship. The study population in the Framingham Heart Study was overwhelmingly White; only 10 of 2068 participants included in this study were members of racial minority groups. Multivariate analyses of variance showed no differences in time-invariant sociodemographic covariates nor baseline BMI according to ever-exposure to proximate foreclosures (P = .51), and no differences according to ever-exposure to foreclosures within 1 kilometer (P = .40; Table 2).
TABLE 2—
Baseline Socioeconomic and Demographic Characteristics of Participants and Their Neighborhoods, According to Exposure to Proximate Real Estate–Owned Property: Framingham Offspring Cohort, Massachusetts, 1987–2008
| Characteristic | All Participants (n = 2068), Mean (SD) or % | Never Exposed to Foreclosures Within 100 Meters (n = 1909), Mean (SD) or % | Ever Exposed to Foreclosures Within 100 Meters (n = 159), Mean (SD) or % | Never Exposed to Foreclosures Within 1 Kilometer (n = 424), Mean (SD) or % | Ever Exposed to Foreclosures Within 1 Kilometer (n = 1644), Mean (SD) or % |
| Years of education (1983–1987) | 13.8 (2.2) | 13.8 (2.2) | 13.7 (2.1) | 13.8 (2.3) | 13.7 (2.2) |
| Income category (1983–1987) | 6.4 (3.2) | 6.5 (3.2) | 6.1 (3.1) | 6.1 (3.3) | 6.5 (3.2) |
| Year of birth | 1938.3 (9.2) | 1938.3 (9.2) | 1938.1 (9.4) | 1938.1 (9.6) | 1938.4 (9.1) |
| BMI (1987–1991) | 26.7 (4.8) | 26.7 (4.8) | 26.3 (4.5) | 26.8 (4.7) | 26.6 (4.8) |
| Municipal poverty rate (1987–1991) | 5.4 (2.4) | 5.3 (2.4) | 5.8 (2.5) | 5.9 (3.3) | 5.2 (2.2) |
| Municipal foreclosure rate (1987–1991) | 0.16 (0.07) | 0.16 (0.08) | 0.17 (0.07) | 0.15 (0.11) | 0.16 (0.07) |
| Proportion White | 99.5 | 99.5 | 99.4 | 99.3 | 99.6 |
| Proportion female | 55.5 | 55.5 | 55.4 | 58.7 | 54.6 |
Note. BMI = body mass index (defined as weight in kilograms divided by the square of height in meters).
As shown in Table 3, for each additional foreclosed property located within 100 meters of a participant’s home, BMI was an average of 0.20 units (P = .02; 95% confidence interval [CI] = 0.03, 0.36) higher. This is equivalent to a 0.58-kilogram weight gain for an individual whose height is 1.7 meters. Adding proximate foreclosure exposure to an otherwise fully adjusted model improved model fit significantly (P = .02). It did not change the partitioning of variance across different levels of the model. Foreclosure activity beyond the most immediate street-level, 100-meter distance was not associated with BMI (Table B, available as a supplement to this article at http://www.ajph.org). Our results did not meaningfully change when we added fixed effects for study waves or higher-order time terms. Although a test for effect modification by gender via the inclusion of interaction terms was statistically insignificant (P = .06), gender-stratified analyses showed a stronger effect of foreclosure on BMIs for men (bforeclosure = 0.38; P = .001; 95% CI = 0.15, 0.61) than for women (bforeclosure = 0.06; P = .78; 95% CI = −0.17, 0.29; Table C, available as a supplement to this article at http://www.ajph.org). Although previous research shows that BMIs of Framingham Heart Study participants are not independent31 and we did not account for social relationships among participants, results from these gender-stratified analyses indicate that our findings are not simply statistical artifacts driven by dependence in spouses’ BMIs.
TABLE 3—
Associations Between Recent Exposure to Proximate Real Estate–Owned Property and Body Mass Index, Unadjusted and Adjusted Three-Level Cross-Classified Models, and Over 4 Time Frames: Framingham Offspring Cohort, Massachusetts, 1987–2008
| Model and Foreclosure Time From Examination Date | Foreclosures ≤100 Meters, b ±SE (95% CI) |
| Age-adjusted,a 1 y before | 0.17 ±0.08* (0.02, 0.32) |
| Fully adjusted,b 1 y before | 0.22 ±0.10* (0.02, 0.41) |
| Adjusted, excluding income,c 1 y before | 0.20 ±0.08* (0.03, 0.36) |
| Sensitivity analyses | |
| Adjusted, excluding incomec | |
| 3 y before | 0.10 ±0.05* (0.00, 0.20) |
| 5 y before | 0.05 ±0.04 (−0.03, 0.13) |
| 1 y after | −0.03 ±0.11 (−0.24, 0.18) |
Note. CI = confidence interval.
Model included a quadratic time term and was adjusted for age.
Model included a quadratic time term and was adjusted for age, gender, race, education, income, municipal poverty rate, municipal foreclosure rate, housing unit density at the municipal level, foreclosure count within 1 km of participants’ homes, and counts of real estate–owned property > 100 to ≤ 200 m, > 200 to ≤ 300 m, > 300 to ≤ 400 m, and > 400 to ≤ 500 m of participants’ homes.
To conserve sample size and because income was statistically unrelated to body mass index after we controlled for educational attainment and did not meaningfully change effect estimates associated with foreclosure count or any model covariates, we excluded income from our fully adjusted model. Model included a quadratic time term and was adjusted for the same variables as the fully adjusted model (excluding income).
*P < .05.
Our first sensitivity analysis, which modeled individual BMI growth trajectories and reduced the threat of uncontrolled confounding by shared municipal environment, moved municipalities from the random to fixed portion of the model (Table D, available as a supplement to this article at http://www.ajph.org). These simpler models produced results consistent with the findings mentioned previously, showing positive associations between foreclosure exposure and BMI (bforeclosure = 0.12; P = .047; 95% CI = 0.001, 0.23). There were no substantive differences in other fixed effect estimates in these models compared with the cross-classified models. Second, we found that exposure to each additional foreclosure within 100 meters increased the odds of being overweight by 77% (P = .04; 95% CI = 1.02, 3.05; Table E, available as a supplement to this article at http://www.ajph.org). Although the presence of foreclosures more than 100 meters from participants’ homes was not associated with BMI in our main model nor sensitivity analyses, each foreclosure located between 100 and 200 meters of participants was associated with a 48% lower odds of being overweight (P = .004; 95% CI = 0.33, 0.82).
Third, as hypothesized, effects associated with foreclosure exposure were strongest when nearby foreclosures had been created within a year of a participant’s examination date. It is important to note that our fourth sensitivity analysis showed no relationship between future foreclosure activity and BMI, suggesting that general street-level environment does not confound the observed foreclosure–BMI relationship (Table 3).
Fifth, we refit our original cross-classified model with a random slope for each municipality, which was allowed to vary across foreclosure counts. This model assumed that nearby foreclosures may influence BMI estimates differently in different communities. However, the random slope parameter in this model was statistically indistinguishable from zero (P = .32) meaning that we detected no evidence of such variability; associations between exposure to foreclosures and BMI persisted under this model specification (Table F, available as a supplement to this article at http://www.ajph.org). This suggests that a consistent mechanism links BMI and exposure to proximate foreclosures across Massachusetts.
Our sixth and final sensitivity analysis explored the possibility that excluding participants with missing covariate data from main models might bias our results. We found no differences in the risk of ever being exposed to a nearby foreclosure according to whether participants were missing data on race (P = .18), income (P = .71), or education (P = .44), suggesting that excluding participants missing these covariates from main analyses should not bias our results. Also, in line with findings from our main analyses (Table 3, age-adjusted model), proximate foreclosures were associated with higher BMI in an age-only adjusted analysis that drew on the full sample of all geocoded Massachusetts participants (n = 3641; bforeclosure = 0.12; P = .048; 95% CI = 0.001, 0.25).
DISCUSSION
Exposure to proximate foreclosure activity significantly predicted higher subsequently measured BMI in this large cohort. The magnitude of this deleterious effect was similar to the estimated protective effect of 1 year of education. These findings were consistent regardless of whether we addressed potential confounding by shared municipal environment through a fixed or random effects approach, and remained robust when we allowed individual BMI trajectories. Modeling municipalities as fixed effects provides a strict control for area-level factors that could act as previous common causes of both neighbors’ foreclosures and participants’ weight gain, including general economic or employment conditions. These models greatly reduce the threat of confounding by omitted or imprecisely measured municipal factors. Sensitivity analyses suggest that our results were not biased by excluding participants who were missing data on key covariates. Specifically, we found no differences in risk of foreclosure exposure according to missing data patterns, and positive age-only adjusted associations between nearby foreclosures and BMI in the full sample of Massachusetts residents. Although specific drivers of the observed association were not identified in this study, several aspects of these analyses suggest that the relationship between proximity to foreclosures and BMI may be causal.
First, if the relationships we observed in our main models were attributable to unmeasured confounding by highly localized neighborhood conditions, we would expect that foreclosure count taken in the 365 days before and after the examination date would be similarly useful in explaining BMI. The reason is that foreclosures as a marker of street-level conditions would not be expected to vary in relation to an examination date that is essentially random with regard to foreclosure trends. Furthermore, precise foreclosure dates are not only determined by the onset of borrowers’ financial trouble, but also can be affected by lender–homeowner negotiations regarding the mortgage or other homeowner attempts to stave off repossession. These factors create additional temporal variability that is external to both street-level neighborhood decline and even to initial homeowner financial distress. In fact, the average foreclosure timeline in Massachusetts is 463 days.42 However, we observed that previous foreclosure counts strongly predict future BMI whereas future foreclosure counts showed no association with BMI despite the fact that foreclosure dates can easily vary by months because of factors unrelated to either neighborhood conditions or homeowner finances.
Second, effect estimates became smaller and weaker as the timeframe within which foreclosures are counted expanded, which essentially diluted our measure of recent exposure intensity with information that was less relevant to current health status. Third, the effect of foreclosure activity on BMI was consistent across municipalities. Were the observed effects artifacts of confounding by urbanicity or driven by processes occurring only in specific neighborhoods that happen to be dense with foreclosures, the effect would have varied by geography. However, we saw that foreclosure activity was a risk factor for increased BMI that behaved consistently across communities.
Limitations
Because this analysis was limited to Massachusetts residents, the findings may not be generalizable to other settings. This study should be replicated elsewhere to test for that possibility. Although BMI is a good measure of adiposity in the general population and has been associated with a wide range of health outcomes, other measures of body fat, such as waist-to-hip ratio, may be more predictive of some conditions.43 Future studies should examine the relationship between nearby foreclosure and other objective health measures to better understand the health effects of living near foreclosures. Also, although we present evidence that is suggestive of causal processes, these data are observational and uncontrolled confounding is possible. However, it is difficult to identify potential confounders responsible for the observed associations with spatially and temporally referenced foreclosure activity, although there are known causal mechanisms that could be at play. Mechanisms by which neighbors’ foreclosures could affect even securely housed residents include “spillover effects” such as declines in nearby property values, degradation of the neighborhood environment, residential turnover, and other social mechanisms, such as stress.44
Although this study did not identify precise causal pathways, potential mechanisms to explain our results include higher caloric intake as a stress-coping response, decreased neighborhood-based physical activity because of degraded street-level environmental conditions, and reduced spending on salubrious resources in reaction to perceived or real financial losses. A lack of data on these and other behaviors is a limitation of this study that prevented mediation analyses.
Implications and Conclusions
Clinicians working with patients in neighborhoods hard-hit by the recent housing crisis should be aware of the potential stressors associated with localized foreclosure activity, including perceived loss of wealth, friends moving away, visible trash accumulation, overgrown lawns, and perceived danger, among others. Policymakers at the state and federal levels, community development corporations, lenders, housing planners, and municipal officials should likewise take such effects into account when making housing-related decisions. For example, efforts to prevent foreclosure among at-risk homeowners, or to return foreclosed properties back into productive uses quickly, may mitigate potential threats to neighbors’ health. Although further research is needed to understand the association between proximate foreclosures and weight gain, this analysis suggests that the relationship may be causal. With real estate experts estimating that millions of homes are currently heading toward mortgage default45 as part of the nation’s “foreclosure pipeline,” and considering that each new foreclosure may affect multiple nearby neighbors, our findings could have policy relevance.
Backlash against foreclosure mitigation in the United States has largely been rooted in political arguments that individual homeowners, often accused of using home equity unwisely or failing to research their loans, are unworthy of government help.46 This study suggests that debates over neighborhood stabilization should also take public health into account. For example, cost–benefit analyses informing how both policymakers and lenders deal with distressed properties might consider potential spillover effects on neighbors’ health. Future studies to identify which aspects of foreclosure are most harmful to neighbors, for example, differentiating between aesthetic and spillover financial impacts, could also help target mitigation efforts most effectively.
Acknowledgments
M. Arcaya was supported as a predoctoral fellow by the National Cancer Institute’s joint Harvard School of Public Health–Dana Farber Cancer Institute Educational Program in Cancer Prevention Research, supported by the National Institutes of Health (NIH; grant 3R25CA057711-18S1) and the NIH Initiative for Maximizing Student Diversity at the Harvard School of Public Health (grant 5R25GM055353). N. A. Christakis is supported by from the National Institute on Aging (award P01-AG031093). S. V. Subramanian is supported by the Robert Wood Johnson Investigator Award in Health Policy. The Framingham Heart Study is conducted and supported by the National Heart, Lung, and Blood Institute (NHLBI) in collaboration with Boston University (contract N01-HC-25195).
Note. This article was not approved by the Framingham Heart Study or the Federal Reserve Bank of Boston. The opinions and conclusions contained in this publication are solely those of the authors, and are not endorsed by the Framingham Heart Study, the Federal Reserve Bank of Boston, the NIH, or the NHLBI and should not be assumed to reflect the opinions or conclusions of either.
Human Participant Protection
This research received institutional review board exemption from the Office of Human Research Administration at the Harvard School of Public Health.
References
- 1. Joint Center for Housing Studies, Harvard University. The state of the nation’s housing. 2010. Available at: http://www.jchs.harvard.edu/sites/jchs.harvard.edu/files/son2010.pdf. Accessed June 12, 2013.
- 2. RealtyTrac. 2011 year-end foreclosure market report. 2012. Available at: http://www.realtytrac.com/content/foreclosure-market-report/2011-year-end-foreclosure-market-report-6984. Accessed March 18, 2012.
- 3.Bennett GG, Scharoun-Lee M, Tucker-Seeley R. Will the public’s health fall victim to the home foreclosure epidemic? PLoS Med. 2009;6(6) doi: 10.1371/journal.pmed.1000087. e1000087. [DOI] [PMC free article] [PubMed] [Google Scholar]
- 4. Alameda County Public Health Department. Causa justa. Rebuilding neighborhoods, restoring health: a report on the impact of foreclosure on public health. 2010. Available at: http://www.acphd.org/media/53643/foreclose2.pdf. Accessed June 12, 2013.
- 5.Pollard T. Fiscal fiasco: a time of reckoning for the NHS. Br J Nurs. 2008;17(22):1379. doi: 10.12968/bjon.2008.17.22.31860. [DOI] [PubMed] [Google Scholar]
- 6.Searle BA, Smith SJ, Cook N. From housing wealth to well-being? Sociol Health Illn. 2009;31(1):112–127. doi: 10.1111/j.1467-9566.2008.01113.x. [DOI] [PubMed] [Google Scholar]
- 7.Pollack CE, Griffin BA, Lynch J. Housing affordability and health among homeowners and renters. Am J Prev Med. 2010;39(6):515–521. doi: 10.1016/j.amepre.2010.08.002. [DOI] [PubMed] [Google Scholar]
- 8.Shaw M. Housing and public health. Annu Rev Public Health. 2004;25:397–418. doi: 10.1146/annurev.publhealth.25.101802.123036. [DOI] [PubMed] [Google Scholar]
- 9.Ellaway A, Macintyre S. Does housing tenure predict health in the UK because it exposes people to different levels of housing related hazards in the home or its surroundings? Health Place. 1998;4(2):141–150. doi: 10.1016/s1353-8292(98)00006-9. [DOI] [PubMed] [Google Scholar]
- 10.Nelson MC, Lust K, Story M, Ehlinger E. Credit card debt, stress and key health risk behaviors among college students. Am J Health Promot. 2008;22(6):400–407. doi: 10.4278/ajhp.22.6.400. [DOI] [PubMed] [Google Scholar]
- 11.Schootman M, Deshpande AD, Pruitt SL, Jeffe DB. Neighborhood foreclosures and self-rated health among breast cancer survivors. Qual Life Res. 2012;21(1):133–141. doi: 10.1007/s11136-011-9929-0. [DOI] [PMC free article] [PubMed] [Google Scholar]
- 12.Cannuscio CC, Alley DE, Pagán JA et al. Housing strain, mortgage foreclosure, and health. Nurs Outlook. 2011;60(3):134–142. doi: 10.1016/j.outlook.2011.08.004. [DOI] [PMC free article] [PubMed] [Google Scholar]
- 13.Pevalin DJ. Housing repossessions, evictions and common mental illness in the UK: results from a household panel study. J Epidemiol Community Health. 2009;63(11):949–951. doi: 10.1136/jech.2008.083477. [DOI] [PubMed] [Google Scholar]
- 14.McLaughlin KA, Nandi A, Keyes KM et al. Home foreclosure and risk of psychiatric morbidity during the recent financial crisis. Psychol Med. 2012;42(7):1441–1448. doi: 10.1017/S0033291711002613. [DOI] [PMC free article] [PubMed] [Google Scholar]
- 15.Pollack CE, Lynch J. Health status of people undergoing foreclosure in the Philadelphia region. Am J Public Health. 2009;99(10):1833–1839. doi: 10.2105/AJPH.2009.161380. [DOI] [PMC free article] [PubMed] [Google Scholar]
- 16.Reisen WK, Takahashi RM, Carroll BD, Quiring R. Delinquent mortgages, neglected swimming pools, and West Nile virus, California. Emerg Infect Dis. 2008;14(11):1747–1749. doi: 10.3201/eid1411.080719. [DOI] [PMC free article] [PubMed] [Google Scholar]
- 17.Pollack CE, Kurd SK, Livshits A, Weiner M, Lynch J. A case–control study of home foreclosure, health conditions, and health care utilization. J Urban Health. 2011;88(3):469–478. doi: 10.1007/s11524-011-9564-7. [DOI] [PMC free article] [PubMed] [Google Scholar]
- 18.Robertson CT, Egelhof R, Hoke M. Get sick, get out: the medical causes of home mortgage foreclosures. Health Matrix Clevel. 2008;18(1):65–104. [PubMed] [Google Scholar]
- 19.Lin Z, Rosenblatt E, Yao VW. Spillover effects of foreclosures on neighborhood property values. J Real Estate Finance Econ. 2009;38(4):387–407. [Google Scholar]
- 20. Hartley D. The impact of foreclosures on the housing market. 2010. Available at: http://www.clevelandfed.org/research/commentary/2010/2010-15.cfm. Accessed June 12, 2013.
- 21. Hartley DA. The effect of foreclosures on nearby housing prices: supply or disamenity? SSRN eLibrary. 2010. Available at: http://papers.ssrn.com/sol3/papers.cfm?abstract_id=1670820. Accessed April 15, 2012.
- 22.Leonard T, Murdoch J. The neighborhood effects of foreclosure. J Geogr Syst. 2009;11(4):317–332. [Google Scholar]
- 23.Immergluck D, Smith G. The impact of single-family mortgage foreclosures on neighborhood crime. Housing Stud. 2006;21(6):851–866. [Google Scholar]
- 24.Chang VW, Hillier AE, Mehta NK. Neighborhood racial isolation, disorder and obesity. Soc Forces. 2009;87(4):2063–2092. doi: 10.1353/sof.0.0188. [DOI] [PMC free article] [PubMed] [Google Scholar]
- 25.Burdette HL, Wadden TA, Whitaker RC. Neighborhood safety, collective efficacy, and obesity in women with young children. Obesity (Silver Spring) 2006;14(3):518–525. doi: 10.1038/oby.2006.67. [DOI] [PubMed] [Google Scholar]
- 26.Molnar BE, Gortmaker SL, Bull FC, Buka SL. Unsafe to play? Neighborhood disorder and lack of safety predict reduced physical activity among urban children and adolescents. Am J Health Promot. 2004;18(5):378–386. doi: 10.4278/0890-1171-18.5.378. [DOI] [PubMed] [Google Scholar]
- 27.Lovasi GS, Hutson MA, Guerra M, Neckerman KM. Built environments and obesity in disadvantaged populations. Epidemiol Rev. 2009;31:7–20. doi: 10.1093/epirev/mxp005. [DOI] [PubMed] [Google Scholar]
- 28.Hawkley LC, Thisted RA, Cacioppo JT. Loneliness predicts reduced physical activity: cross-sectional and longitudinal analyses. Health Psychol. 2009;28(3):354–363. doi: 10.1037/a0014400. [DOI] [PMC free article] [PubMed] [Google Scholar]
- 29.Jago R, Baranowski T, Zakeri I, Harris M. Observed environmental features and the physical activity of adolescent males. Am J Prev Med. 2005;29(2):98–104. doi: 10.1016/j.amepre.2005.04.002. [DOI] [PubMed] [Google Scholar]
- 30.Feinleib M, Kannel WB, Garrison RJ, McNamara PM, Castelli WP. The Framingham Offspring Study. Design and preliminary data. Prev Med. 1975;4(4):518–525. doi: 10.1016/0091-7435(75)90037-7. [DOI] [PubMed] [Google Scholar]
- 31.Christakis NA, Fowler JH. The spread of obesity in a large social network over 32 years. N Engl J Med. 2007;357(4):370–379. doi: 10.1056/NEJMsa066082. [DOI] [PubMed] [Google Scholar]
- 32.Zhang M, Kukadia N. Metrics of urban form and the modifiable areal unit problem. Transportation Res Rec. 2005;1902:71–79. [Google Scholar]
- 33.American Planning Association. Planning and Urban Design Standards. Hoboken, NJ: John Wiley and Sons; 2006. [Google Scholar]
- 34. Dain A, Schuetz J. Housing regulation database: Massachusetts municipalities. Pioneer Institute for Public Policy Research and Rappaport Institute for Greater Boston. 2005. Available at: http://www.masshousingregulations.com/pdf/frontage.pdf. Accessed April 15, 2012.
- 35. US Census Bureau. Data access tools. Available at: http://www.census.gov/main/www/access.html. Accessed June 12, 2013.
- 36. Massachusetts Department of Revenue. Data bank reports: socioeconomic. 2012. Available at: http://www.mass.gov/dor/local-officials/municipal-data-and-financial-management/data-bank-reports/socioeconomic.html. Accessed June 12, 2013.
- 37. Metropolitan Area Planning Council. About MAPC. 2013. Available at: http://www.mapc.org/about-mapc. Accessed June 12, 2013.
- 38.Block JP, Christakis NA, O’Malley AJ, Subramanian SV. Proximity to food establishments and body mass index in the Framingham Heart Study offspring cohort over 30 years. Am J Epidemiol. 2011;174(10):1108–1114. doi: 10.1093/aje/kwr244. [DOI] [PMC free article] [PubMed] [Google Scholar]
- 39.Goldstein H. Multilevel Statistical Models. Chichester, UK: John Wiley and Sons; 2010. [Google Scholar]
- 40. Johnson M. Individual growth analysis using PROC MIXED. SAS Institute. 2002. Available at: http://www2.sas.com/proceedings/sugi27/p253-27.pdf. Accessed April 17, 2012.
- 41.Freudenberg N, Galea S, Vlahov D. Beyond urban penalty and urban sprawl: back to living conditions as the focus of urban health. J Community Health. 2005;30(1):1–11. doi: 10.1007/s10900-004-6091-4. [DOI] [PubMed] [Google Scholar]
- 42. RealtyTrac. Foreclosure Timeline by state. Mega. 2012. Available at: http://mega.realtytrac.com/about/foreclosure-timeline.html. Accessed August 20, 2012.
- 43.Hu F, editor. Obesity Epidemiology. 1st ed. New York, NY: Oxford University Press; 2008. [Google Scholar]
- 44.Raitt J, Arcaya M. Foreclosure: community impacts, prevention, and stabilization strategies. PAS Memo. 2010;(September/October):1–8. [Google Scholar]
- 45. Whelan R. How many homes are in trouble in today’s housing market? Wall Street Journal. November 11, 2011. Available at: http://blogs.wsj.com/developments/2011/11/11/how-many-homes-are-in-trouble. Accessed August 20, 2012.
- 46. Conner T. The case against the mortgage bailout: “We’re rewarding the losers.” Daily News. February 20, 2009. Available at: http://www.nydailynews.com/money/2009/02/19/2009-02-19_the_case_against_the_mortgage_bailout_we.html. Accessed January 26, 2011.