Abstract
Background and Purpose
Marine sponges have evolved the capacity to produce a series of very efficient chemicals to combat viruses, bacteria, and eukaryotic organisms. It has been demonstrated that several of these compounds have anti-neoplastic activity. The highly toxic sponge Crambe crambe has been the source of several molecules named crambescidins. Of these, crambescidin-816 has been shown to be cytotoxic for colon carcinoma cells. To further investigate the potential anti-carcinogenic effect of crambescidin-816, we analysed its effect on the transcription of HepG2 cells by microarray analysis followed by experiments guided by the results obtained.
Experimental Approach
After cytotoxicity determination, a transcriptomic analysis was performed to test the effect of crambescidin-816 on the liver-derived tumour cell HepG2. Based on the results obtained, we analysed the effect of crambescidin-816 on cell-cell adhesion, cell-matrix adhesion, and cell migration by Western blot, confocal microscopy, flow cytometry and transmission electron microscopy. Cytotoxicity and cell migration were also studied in a variety of other cell lines derived from human tumours.
Key Results
Crambescidin-816 had a cytotoxic effect on all the cell lines studied. It inhibited cell-cell adhesion, interfered with the formation of tight junctions, and cell-matrix adhesion, negatively affecting focal adhesions. It also altered the cytoskeleton dynamics. As a consequence of all these effects on cells crambescidin-816 inhibited cell migration.
Conclusions and Implications
The results indicate that crambescidin-816 is active against tumour cells and implicate a new mechanism for the anti-tumour effect of this compound.
Keywords: crambescidin-816, transcriptomic analysis, tumour cell viability, tumour cell adhesion, tumour cell migration
Introduction
Marine sponges are sessile marine filter feeders that after centuries of evolutionary pressure have developed a very efficient chemical arsenal against viruses, bacteria and eukaryotic organisms. Several reports demonstrate the anti-neoplastic activity of various sponge metabolites (Schwartsmann et al., 2001; Belarbi el et al., 2003; Proksch et al., 2003; Sipkema et al., 2005; Blunt et al., 2009; Molinski et al., 2009; Mayer et al., 2010). Sponge-derived compounds are currently in use or in different phases of clinical trials. Cytarabine (Ara C), an anticancer drug developed from a nucleoside originally isolated from the sponge Tethya cryptam, received Food and Drugs Administration (FDA) approval in 1969 (Mayer et al., 2010). Eribulin, a synthetic analogue of halichondrin B isolated from the sponge Halichondria okadai (Hirata and Uemura, 1986), has been approved by the FDA for the treatment of patients with breast cancer. Hemiasterlin was isolated from the sponge Hemiasterella minor (Talpir et al., 1994) and one of its analogues (HTI-286) reached phase I clinical trials and was halted before phase II due to lack of objective responses and high toxicity (Molinski et al., 2009). The same happened to discodermolide, isolated from Discodermia dissoluta (Molinski et al., 2009). These discoveries indicate that sponges are a source of chemical entities with potential applications against cancer or that can serve as lead compounds in the search for novel anticancer medicines.
The sponge Crambe crambe, commonly found in the rocky costs of the Mediterranean, is capable of inducing necrosis of other sponge tissues when they are kept in contact (Buscema and Van de Vyver, 1985) and was initially reported to produce potent antibacterial and antifungal compounds (Burkholder and Ruetzler, 1969). Additionally, metabolites of this highly toxic sponge have been shown to have antifouling activity against microfoulers and invertebrate larvae (Uriz et al., 1996). Several metabolites have been isolated from Crambe crambe, including crambescidins and crambescines. Some of these have been shown to have mid-nanomolar cytotoxicity against human tumour-derived cell lines (Aron et al., 2004). Crambescidin-800 (C800) also induces differentiation of K562 leukaemia cells leading to cell cycle arrest in the S-phase (Aoki et al., 2004). This compound also has antifungal and antiviral activity (Aron et al., 2004). More recently, methanolic extracts of Crambe crambe have been shown to inhibit proliferation and apoptosis resistance in pancreatic cancer cells with enhanced cancer stem cell line characteristics (Ottinger et al., 2012).
Another crambescidin isolated from Crambe crambe is crambescidin-816 (C816). This compound has been shown to exert a Ca2+ antagonistic activity with higher potency than nifedipine (Berlinck et al., 1993; Martin et al., 2013). This compound is also active against human colon carcinoma cells (Berlinck et al., 1993). Because C816 has been shown to have potential anticancer applications, we decided to determine its effects on tumour cells. We showed that C816 has cytotoxic effects on several human tumour cell lines. After the determination of cytotoxicity, microarrays were used to determine the transcriptomic alterations induced by this compound in the human liver tumour cell line HepG2. Based on the results observed after microarray analysis and after confirmation by migration assays, Western blot, confocal microscopy and qPCR, we concluded that C816 inhibits the cell cycle in the G0/G1 phase, cell migration, cell-cell and cell-matrix adhesion.
Methods
C816 isolation and purification
C816 was purified from the sponge Crambe crambe as described in Bondu et al. (2012). The compound was dissolved in DMSO and was 95% pure (HPLC-MS). The final DMSO concentration for cell treatment was always less than 0.2%. Control cultures were treated with the highest DMSO concentration used in each experiment to rule out any solvent interference in the results observed.
Cell culture
HepG2 and MS-1 cells (ATCC, Manassas, VA, USA) were cultured in E-MEM (Sigma, Madrid, Spain) supplemented with 10% FBS (Cambrex, Wiesbaden, Germany), 100 UI·mL−1 penicillin (Roche, Madrid, Spain) and 1.2 μM streptomycin (Roche) at 37°C in a humidified 5% CO2 atmosphere. SK-MEL-28, UO-31, PC-3, OVCAR, MCF-7, HT-29 and HOP-92 cells (NCI-60 cancer panel) were cultured in RPMI medium supplemented with 10% FBS, 50 U·mL−1 penicillin (Roche) and 0.6 mM streptomycin (Roche) at 37°C in a humidified atmosphere.
Cell viability assays
Viability was determined by the MTT (3-(4,5-dimethylthiazol-2-yl)-2,5-diphenyltetrazolium bromide) (SIGMA) method following the manufacturer's instructions. In brief, cells were seeded in 96-well plates at a density of 8000 cell per well and incubated overnight. Cells were then treated with different concentrations of C816 for 24 and 48 h. Four hours before each incubation ended, MTT was added to each well. Reduced MTT was dissolved in DMSO and absorbance was determined at 570 and 670 nm (reference) with a Bio-Tek Synergy plate reader (Bedfordshire, UK). Three experiments were performed for each cell line with n = 8.
Apoptosis determination
To determine apoptosis by fluorescence microscopy, HepG2 cells were treated with C816 or vehicle for 6, 24 or 48 h. Cells were stained with Annexin V and propidium iodide (PI) using an Apoptosis Detection Kit (immunostep, Salamanca, Spain) and following the manufacturer's instructions. After being stained, the cells were analysed using a NIKON-TE2000-3 confocal microscope (NIKON, Barcelona, Spain).
To determine caspase-3 activity, cells treated in the same way as for the Annexin V and PI assay were harvested and analysed for caspase-3 activity using the EnzChek Caspase-3 Assay Kit (Invitrogen, Madrid, Spain) following the manufacturer's instructions. Results are presented as the fold change of caspase-3 activity in C816-treated cultures with respect to controls. Each treatment was analysed in triplicate, and three experiments were performed.
Microarray assay and analysis
To obtain RNA for microarray assays, HepG2 cells were treated with 150 nM C816 for 6, 24 and 48 h. Then RNA from control and treated cells was purified using the Aurum™ Total RNA Mini Kit (Bio-rad, Madrid, Spain) following the manufacturer's instructions. RNA concentration and integrity were determined with a NanoDrop 2000 (Thermo Scientific, Madrid, Spain) and with a Bioanalyzer 2100 (Agilent, Madrid, Spain) using the RNA 6000 nanoreagents kit (Agilent) respectively.
Double-stranded cDNA was obtained from the purified RNA using the cDNA Synthesis System (Roche). Double-stranded cDNA was cleaned up with a High Pure PCR Purification Kit (Roche) and was used to obtain labelled cDNA using the NimbleGen One-Color DNA Labeling Kit (Roche). The concentration of the labelled cDNA was determined with a NanoDrop 2000 (Fisher Scientific, Madrid, Spain). Five micrograms of labelled cDNA from each sample was hybridized onto NimbleGen microarrays (100718_HG18_opt_expr_HX12; Roche) using the NimbleGen Hybridization Kit (Roche) in a NimbleGen HS4 mixer (Roche). Microarrays were then washed with the NimbleGen Wash Buffer Kit (Roche). After being dried, the microarrays were scanned with a NimbleGen MS200 scanner (Roche).
Scanned images were extracted and bursted using the DEVA 1.2.1 software (Roche). The same software was used for data normalization using robust mass analysis. Normalized data were loaded for the analysis of differential gene expression in the TM4 Microarray Software Suite (Saeed et al., 2003; 2006). Gene lists were analysed for differentially expressed (DE) genes using the statistic tools Rank Products and significance analysis of microarrays set at P < 0.05. Data mining for significantly altered metabolic pathways and ontological categories at the biological process and cell component level 5 in C816-treated cells with respect to control cells was performed with the DAVID Bioinformatics Database (Huang da et al., 2009a,b2009b).
Cell migration assays
Cells were grown to confluence in 6-well plates and each condition was analysed in triplicate. Before treatment, a wound was made with a 10 μL pipette tip and images (20 for each treatment) were acquired with an ORCA camera (Hamamatsu, Barcelona, Spain) coupled to a Nikon microscope (time 0). Cells were then treated with 50, 100 and 150 nM C816 or vehicle for 8 h. After this incubation, images (20 for each treatment) were acquired for the different treatments (time 8). Cell migration was determined using the ImageJ software (Schneider et al., 2012) and the results are presented as the percentage of wound healed at time 8 with respect to time 0.
Real-time PCR
Total RNA was purified and quantified as described in microarray assay and analysis in this section of the manuscript. After DNAse treatment, RNA was reverse transcribed using an oligo-dT (Fisher Scientific) and a RevertAid™ M-MuLV reverse transcriptase (Fisher Scientific) following the manufacturer's instructions. cDNA was amplified in a StepOne real-time PCR (Applied Biosystems, Madrid, Spain) using a FastStart™ Universal SYBR Green Master Kit (Roche), following the manufacturer's instructions. Relative quantification between treatments was performed using the ΔΔCt method. Each treatment was analysed in triplicate.
Flow cytometry
Control and C816-treated cells were detached from the plates with 0.25% trypsin and 0.2% EDTA, and washed twice with PBS. Cells were fixed and analysed by flow cytometry as previously described (Lopez-Alonso et al., 2013).
Western blot
Control and C816-treated cells were resuspended in RIPA buffer (150 mM NaCl, 1% Triton X100, 0.5% sodium deoxycholate, 0.1% SDS and 50 mM Tris, pH = 8) and incubated for 30 min in ice. Lysates were centrifuged for 15 min at 16 000 g at 4°C and supernatants were recovered. Soluble protein concentration in the lysates was determined using a Direct Detect™ spectrometer (Merck Millipore, Darmstadt, Germany). Equal amounts of protein were resolved by SDS-PAGE and transferred to PVDF membranes (Merck Millipore). After transference, membranes were blocked with 3% non-fat milk, 0.1% Tween 20 (Calbiochem®, Darmstadt, Germany) dissolved in PBS overnight. Blocked membranes were incubated with primary antibodies [anti-claudin 2 (CLDN2) 1:750 (Santa Cruz Biotechnology, Santa Cruz, CA, USA), anti-actin (ACTA) 1:3000 (Merck Millipore), anti-occludin (OCLN) 1:3000 (Molecular Probes, Madrid, Spain), anti-β tubulin (TUBB) 1:5000 (Sigma), anti-vinculin (VCL) 1:5000 (Merck Millipore) or anti-histone H1 1:5000 (Sigma)] and dissolved in blocking solution for 3 h at room temperature. After being washed, the membranes were incubated with secondary antibodies 1:5000 dissolved in blocking solution for 1 h. Washed membranes were revealed with Super Signal West Pico (Fisher Scientific), or Super Signal West Femto in the case of CLDN2. Image acquisition was performed with the Dyversity System (Syngene, Cambridge, UK), and differences in protein expression between treatments were determined with the image analysis software GeneTools (Syngene) using histone H1 for normalization.
Confocal microscopy
HepG2 cells were cultured on coverslips that were previously treated with poly-lysine. For OCLN, actin and vinculin detection, after C816 treatment, the cells were fixed with 4% paraformaldehyde dissolved in PBS for 10 min at 4°C. After fixation, the cells were washed three times and incubated with 1:200 FITC-conjugated anti-OCLN, or 1:250 anti-vinculin, dissolved in PBS and 2% BSA for 1 h at room temperature. Anti-vinculin-treated coverslips were then incubated with 1:250 CY3-conjugated secondary antibody and FITC-conjugated phalloidin dissolved in PBS and 2% BSA for 30 min at room temperature. Coverslips were then washed three times, with Hoechst 33258 (Sigma) included in the last wash for nuclei counterstaining, and mounted.
For tubulin detection, after C816 treatment, the cells were fixed with methanol at −20°C for 5 min. After fixation, the cells were washed and incubated with primary antibody dissolved in PBS and 2% BSA for 1 h at room temperature. Coverslips were then washed and incubated with 1:250 CY3-conjugated secondary antibody dissolved in PBS and 2% BSA for 1 h. After washing and nuclei counterstaining, coverslips were then mounted.
Mounted coverslips were analysed with a Nikon TE2000-3 confocal microscope. Representative images obtained for each treatment are presented in the results.
Transmission electron microscopy (TEM)
HepG2 cells cultured on coverslips were treated with 150, 500 and 1000 nM C186 for 24 h. Treated and control cells were fixed with 2.5% glutaraldehyde. Fixed slides were washed with 25 mM cacodylate, pH 7.4, and again fixed with 1% OsO4 in 0.1 M cacodylate, pH 7.4. After fixation, samples were dehydrated with ethanol and incorporated in epoxy resin (Ted Pella, Inc., Bedding, CA, USA). Ultra-thin sections were obtained with an UltraCur R (Leica GMBH, Barcelona, Spain). Sections were analysed by TEM (JEM-1011; Jeol, Madrid, Spain), and micrographs were obtained using a MegaView II camera (Olympus, Münster, Germany).
Statistics
The results were analysed using the Sigmaplot® software (Systat Software Inc., San Jose, CA, USA). One-way anova was used for comparison of differences among groups. The Holm–Sidak multiple-range test was used for comparisons of differences between groups. A P < 0.05 was considered significant.
Results
C816 reduces cell viability of tumour cells
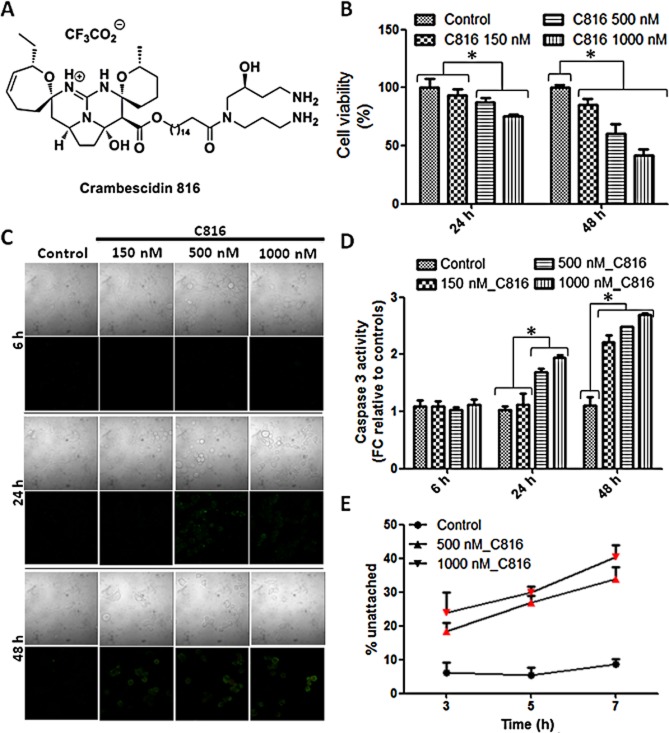
MTT assays showed that C816 (Figure 1A) reduced cell viability of the well-characterized tumour-derived cell line HepG2 at concentrations higher than 150 nM after 24 and 48 h. At the highest concentration tested, C816 was highly cytotoxic for HepG2 cells, reducing cell viability by approximately 60% after 48 h (Figure 1B). To assay if the cytotoxic effect observed for HepG2 cells was cell specific of a more general effect, we determined the effect of C816 on the human tumour-derived cell lines HOP-92 (pulmonary carcinoma), MCF-7 (mammary carcinoma), OVCAR (ovary carcinoma), PC3 (prostatic carcinoma), UO-31 (kidney carcinoma), SK-MEL-28 (melanoma) and HT-29 (colon carcinoma). Results of cytotoxicity assays showed that after 48 h C816 decreased cell viability at the three concentrations tested in all the cell lines but in MCF-7. This cell line did not show a reduced viability after 48 h in the presence of 150 nM C816. After 24 h, the only cell line that was resistant to C816 toxicity at the concentrations tested was UO-31, while the rest presented decreased viabilities in the presence of 500 and 1000 nM C816. At the lowest concentration tested, C816 was slightly cytotoxic for SK-MEL-28, PC-3, OVCAR and HT-29 cells (Table 1).
Figure 1.
(A) Structure of C816. (B) Viability of HepG2 cells after C816 treatment for 24 and 48 h, determined by the MTT method. P < 0.01, n = 8. (C) Annexin V and PI staining of HepG2 cells after C816 treatment for 6, 24 and 48 h. Representative photos of the merged Annexin V and PI fluorescence together with bright field for each treatment are shown. (D) Caspase-3 activity in HepG2 cells treated with C816 for 6, 24 and 48 h. *Significant differences with respect to controls, P < 0.01, n = 3. FC: fold change. (E) Quantification of unattached cells in bright field images of control and C816-treated HepG2 cells. Seven fields from each treatment were analysed. Red symbols: significant differences with respect to controls, P < 0.01, n = 7.
Table 1.
Viability of tumour cells treated with C816
| SK-MEL-28 | UO-31 | PC-3 | OVCAR | MCF-7 | HT-29 | HOP-92 | |
|---|---|---|---|---|---|---|---|
| Treatment | Viability after 24 hΔ | ||||||
| Control | 100 ± 5.66 | 100 ± 9.64 | 100 ± 8.40 | 100 ± 2.43 | 100 ± 7.04 | 100 ± 5.52 | 100 ± 9.60 |
| C816 150 nM | 92.81 ± 3.94+ | 95.03 ± 12.16 | 79.75 ± 2.74+ | 91.91 ± 4.40+ | 99.04 ± 6.450 | 84.99 ± 5.40+ | 81.91 ± 14.07 |
| C816 500 nM | 85.98 ± 7.54+ | 98.73 ± 7.29 | 75.01 ± 3.37+ | 84.07 ± 3.73+ | 86.58 ± 3.11+ | 66.64 ± 4.38+ | 76.38 ± 6.18+ |
| C816 1000 nM | 83.44 ± 6.68+ | 106.45 ± 10.35 | 72.65 ± 3.34+ | 80.02 ± 3.17+ | 82.97 ± 4.71+ | 61.54 ± 5.00+ | 70.85 ± 1.48+ |
| Viability after 48 h‡ | |||||||
| Control | 100 ± 6.35 | 100 ± 8.90 | 100 ± 4.48 | 100 ± 5.54 | 100 ± 7.58 | 100 ± 3.58 | 100 ± 14.23 |
| C816 150 nM | 62.52 ± 4.37+ | 82.62 ± 3.47+ | 77.22 ± 2.97+ | 73.45 ± 1.95+ | 90.04 ± 6.81 | 79.81 ± 7.91+ | 76.56 ± 10.92+ |
| C816 500 nM | 55.86 ± 4.66+ | 70.31 ± 3.17+ | 56.96 ± 1.56+ | 59.60 ± 5.43+ | 65.91 ± 7.78+ | 20.89 ± 11.20+ | 38.28 ± 9.35+ |
| C816 1000 nM | 50.55 ± 3.97+ | 56.74 ± 5.53+ | 53.89 ± 2.00+ | 57.29 ± 2.64+ | 60.50 ± 1.68+ | 9.53 ± 2.76+ | 27.99 ± 9.50+ |
Cells were incubated with the respective molecule for 24 h and viability was determined by the MTT method.
Cells were incubated with the respective molecule for 48 h and viability was determined by the MTT method.
Significant difference with respect to controls. n = 8, P < 0.01.
C816 induced apoptosis in HepG2 cells as determined by Annexin V staining and caspase-3 activity measurements. While no apoptosis was detected after 6 h, after 24 h, 500 and 1000 nM C816 induced phosphatidylserine translocation and an increase in caspase-3 activity. After 48 h, the three concentrations tested induced apoptosis (Figure 1C and D). Bright field micrographs of 500 and 1000 nM C816-treated cells for 6 h showed rounded cells losing attachment between each other and with the substrate in the absence of apoptosis (Figure 1C). After 24 h, the same occurred for the lowest C816 concentration tested. To quantify the unattached cells, HepG2 cultures were treated with 500 and 1000 nM C816 and bright field microscopy images were acquired after 3, 5 and 7 h. Attached and unattached cells were counted using the ImageJ software. The image analysis showed that C816 increased the number of unattached cells (Figure 1E).
Transcriptional alterations induced by C816 in HepG2 cells
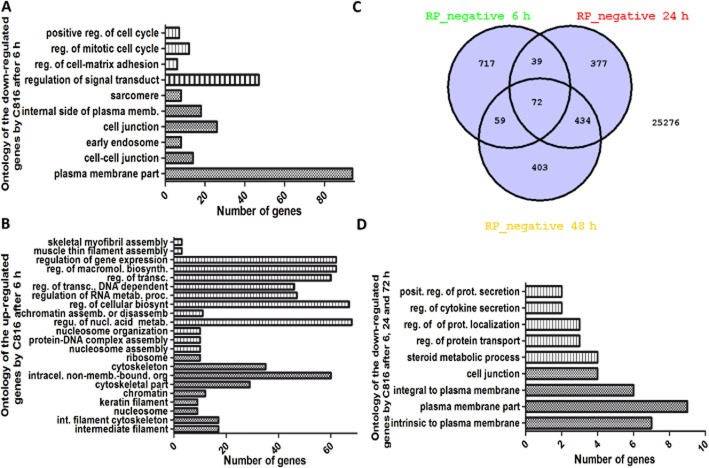
A concentration of 150 nM C816 was selected for microarray experiments, since it was non-cytotoxic after short incubation periods but induced cell death after 48 h. Microarray results showed that the toxin affected the expression of approximately 5% of the genes in HepG2 cells at the three times tested (results not shown). Functional analysis of DE genes showed that short-term exposure to C816 produced a down-regulation of the functions involved in cell migration, cell-cell and cell-matrix adhesion, together with the functions involved in cell cycle regulation (Figure 2A; Supporting Information Table S1). Biological processes and cellular components affected by C816 after 6 h included those involved in cytoskeleton organization and transcription regulation (Figure 2B; Supporting Information Table S1). Venn diagrams showed that 72 down-regulated genes were shared by the three incubation times selected (Figure 2C). These were involved mainly in cell junction, protein transport and secretion (Figure 2D). Longer times of incubation produced a down-regulation in the biological processes and cell components involved in secretion, cholesterol metabolism and carboxylic acid metabolism, while inducing an up-regulation in the biological processes and cell components involved in carbohydrate metabolism, development, differentiation, morphogenesis, negative regulation of cell migration, small GTPases signal transduction, endoplasmic reticulum signalling and regulation of kinase activity (Supporting Information Table S2). Several DE genes, mostly those involved in cell adhesion and migration, were selected for validation of microarray results (Supporting Information Figure S1).
Figure 2.
Gene ontology of the down-regulated (A) and up-regulated (B) biological processes and cell components in HepG2 cells after 6 h of C816 treatment. Hatched bars: biological processes level 5. Stippled bars: cell components level 5. (C) Venn diagram for the down-regulated mRNAs in HepG2 cells after C816 treatment. (D) Gene ontology of the down-regulated genes shared by the three time points analysed. Hatched bars: biological processes level 5. Stippled bars: cell components level 5.
C816 inhibits the HepG2 cell cycle in the G0/G1 phase
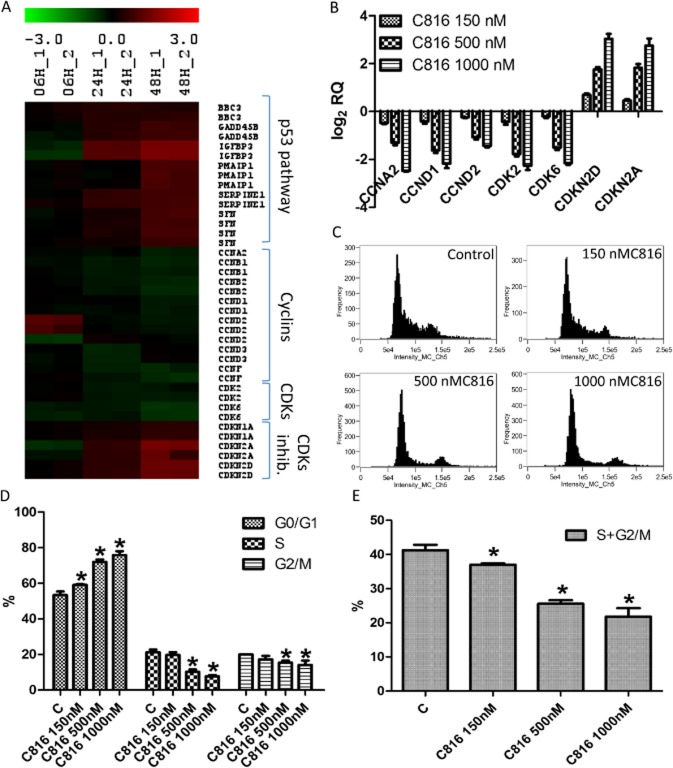
Microarray analysis showed that C816 negatively affected the cell cycle, down-regulating the expression of cyclins A, B, D and F, cyclin-dependent kinases 2 and 6 (CDK2 and 6). It also up-regulated the cyclin-dependent kinase inhibitors 1 and 2 (CDKN1 and 2) and components of the p53 pathway (Figure 3A). Microarray results were validated by qPCR and the effects of higher C816 concentrations were also tested (Figures 3B). These changes in gene expression produced a cell cycle arrest at the G0/G1 phase in HepG2 cells (Figure 3C). The inhibitory effect of C816 on the cell cycle was dose-dependent (Figure 3D) and the toxin decreased the population of cells in the S and G2/M phases at the three concentrations tested (Figure 3E).
Figure 3.
(A) Heat map of the DE expressed mRNAs (in log2) coding for proteins involved in cell cycle regulation in 150 nM C816-treated cells with respect to controls, determined by microarray data analysis. Green: mRNA down-regulation in treated cells with respect to controls. Red: mRNA up-regulation in treated cells with respect to controls. (B) qPCR validation of the microarray (48 h) data for cyclins A and D, CDKs 2 and 6, and CDK inhibitors 2D and 2A, and determination of the effect of higher C816 concentrations. (C) Representative histograms of the cell cycle obtained after flow cytometry analysis of C816-treated HepG2 cells for 24 h. (D) Quantification of the cell populations in each phase of the cell cycle in control and C816-treated (24 h) HepG2 cells (P < 0.01, n = 3). (E) Quantification of the overall effect on S and G2/M phases produced by C816 after 24 h on HepG2 cells (P < 0.01, n = 3).
Effect of C816 on tight junction and focal adhesion proteins in HepG2 cells
To determine whether the down-regulation in the expression of genes involved in cell-cell and cell-matrix adhesion observed after microarray analysis actually affected these interactions, we studied the effect of C816 on tight junctions, focal adhesion plaques, and cell cytoskeleton proteins CLDN2, OCLN, ACTA, TUBB and VCL by Western blot. After 6 h of treatment, C816 decreased CLDN2 at the highest concentration tested. Treatment with 500 and 1000 nM C816 increased in OCLN, and at the highest concentration tested C816 induced a slight increase in TUBB and VCL (Figure 4A and C). After 24 h of treatment, C816 reduced CLDN2 and ACTA at the three concentrations tested, while increasing the concentration of OCLN, TUBB and VCL (Figure 4B and D). TEM analysis of control and C816-treated cells showed an increased cell-cell separation and a decrease in the tight junctions in C816-treated cells (Figure 4E).
Figure 4.
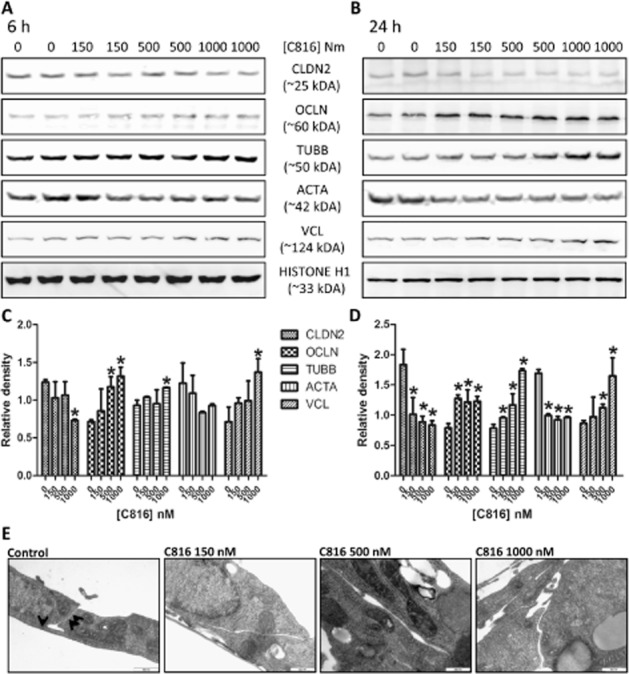
Detection of CLDN2, OCLN, ACTA, TUBB, VNC and histone H1 by Western blot. The experiment was performed using soluble protein obtained from HepG2 cells after treatment with 150, 500 and 1000 nM C816 for 6 h (A) and 24 h (B). Quantification of the variations in the proteins assayed by Western blot between controls and treated cells after 6 h (C) and 24 h (D). (E) TEM of HepG2 cells treated with 150, 500 and 1000 nM C816 for 24 h showing the increased separation between cell membranes in treated cells. Arrows: tight junctions.
C816 negatively affects cell-cell adhesion and the cytoskeleton in HepG2 cells
To determine why the compound decreased cell-cell adhesion while at the same time increased OCLN, confocal microscopy was used to determine the effect of C816 on this protein. C816 induced internalization of OCLN; this started early, after 6 h of treatment, and progressed up to 24 h (Figure 5). We then investigated the effect of C816 on the actin cytoskeleton and on the cell focal adhesion plaque component VCL. We observed actin depolymerisation and a decreased concentration, together with a decrease in vinculin and adhesion plaques after 6 and 24 h (Figure 6). C816 also induced tubulin depolymerisation with vesicles appearing after 24 h (Figure 7).
Figure 5.
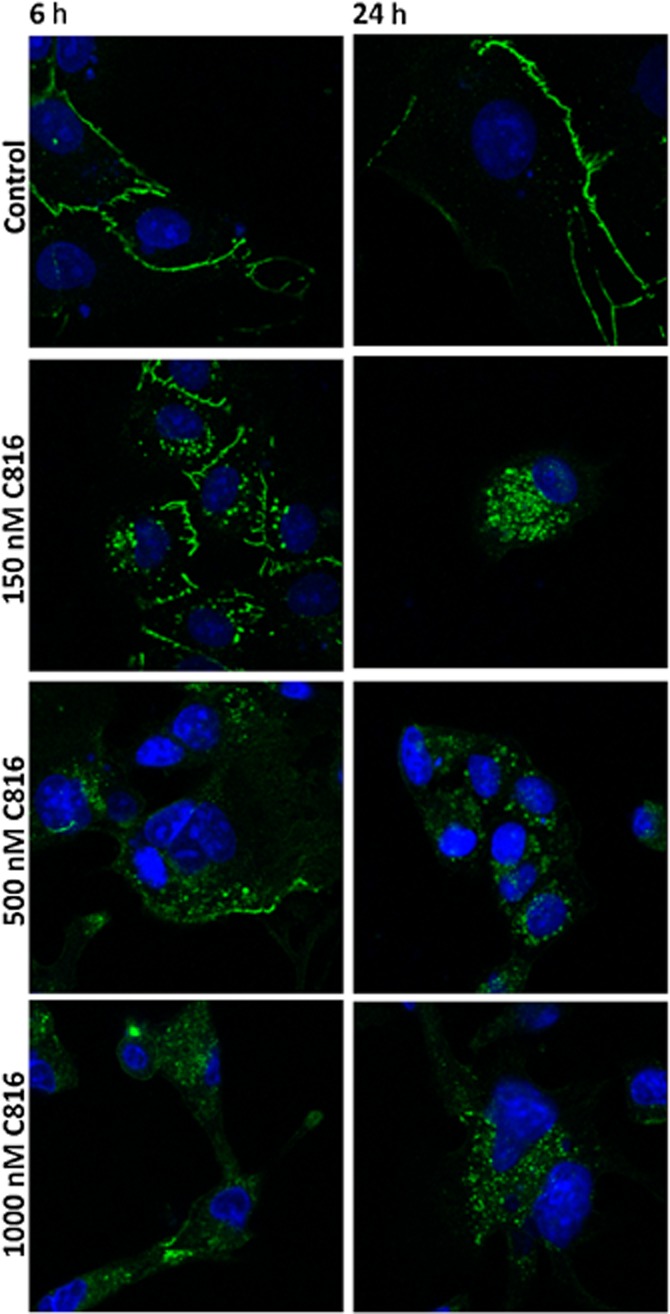
OCLN detection (green) by confocal microscopy in control and C816-treated HepG2 cells. Representative photos of treatments for 6 and 24 h are shown. In both cases, nuclei were counterstained with Hoechst 33258.
Figure 6.
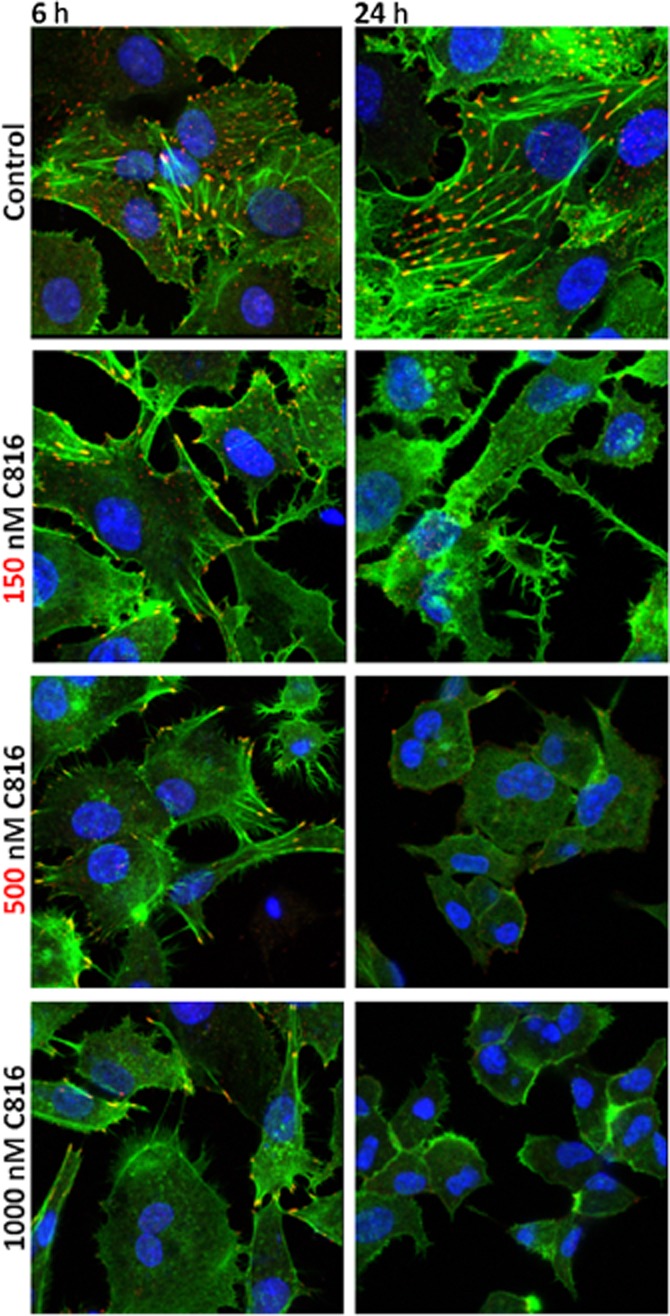
Actin (green) and vinculin (red) detection by confocal microscopy in control and C816-treated HepG2 cells. Representative photos of treatments for 6 and 24 h are shown. Colocalization of actin and vinculin is shown in yellow. In both cases, nuclei were counterstained with Hoechst 33258.
Figure 7.
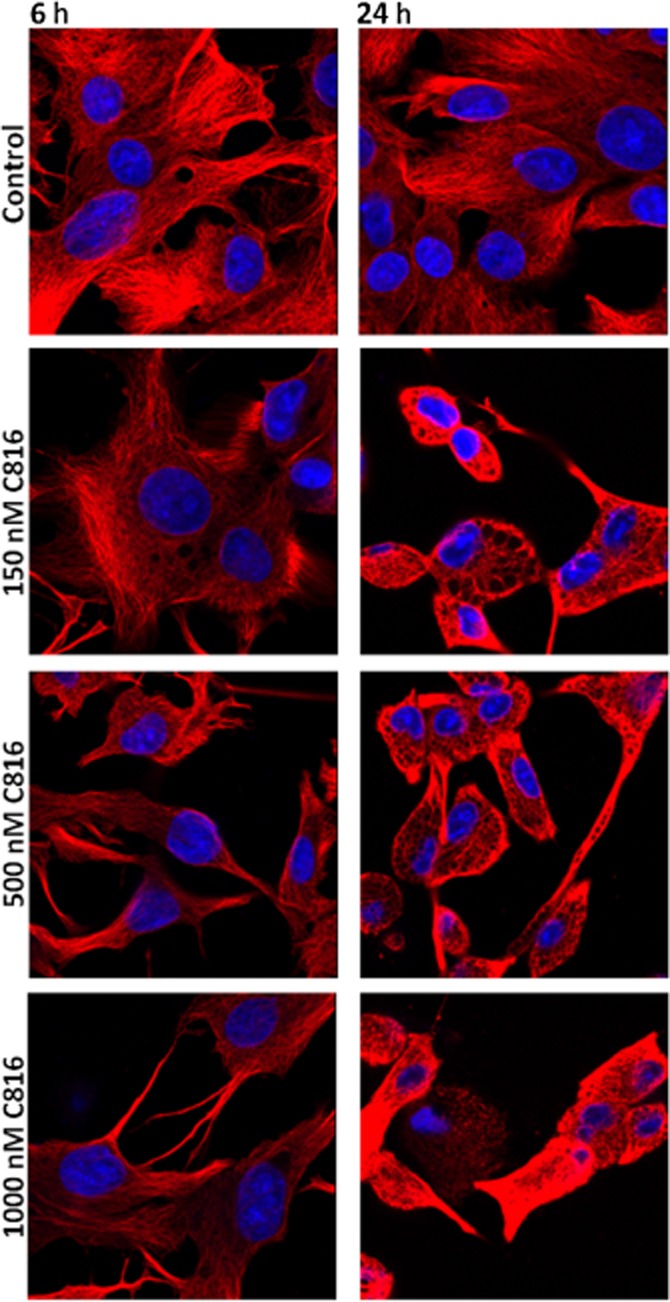
β-Tubulin detection by confocal microscopy in control and C816-treated HepG2 cells. Representative photos of treatments for 6 and 24 h are shown. In both cases, nuclei were counterstained with Hoechst 33258.
C816 inhibits the migration of tumour cells
After the transcriptomic analysis we determined that C816 negatively affected cell migration in HepG2 cells, and follow-up experiments showed that this compound also affected actin and tubulin polymerisation and focal adhesion plaques, which are involved in this process. Hence, we performed cell migration assays using HepG2 cells and sub-toxic concentrations of C816. After 8 h of treatment, a decreased cell migration was observed at the three concentrations tested (Figure 8A). Quantification of the results showed that this effect was dose–dependent (Figure 8B). Migration assays were also performed for the other cells, HOP-92, MCF-7, OVCAR, UO-31 and PC-3, using the same conditions as those used for HepG2 cells (Figure 9A); C816 was found to reduce cell migration in all the cell lines tested (Figure 9B).
Figure 8.
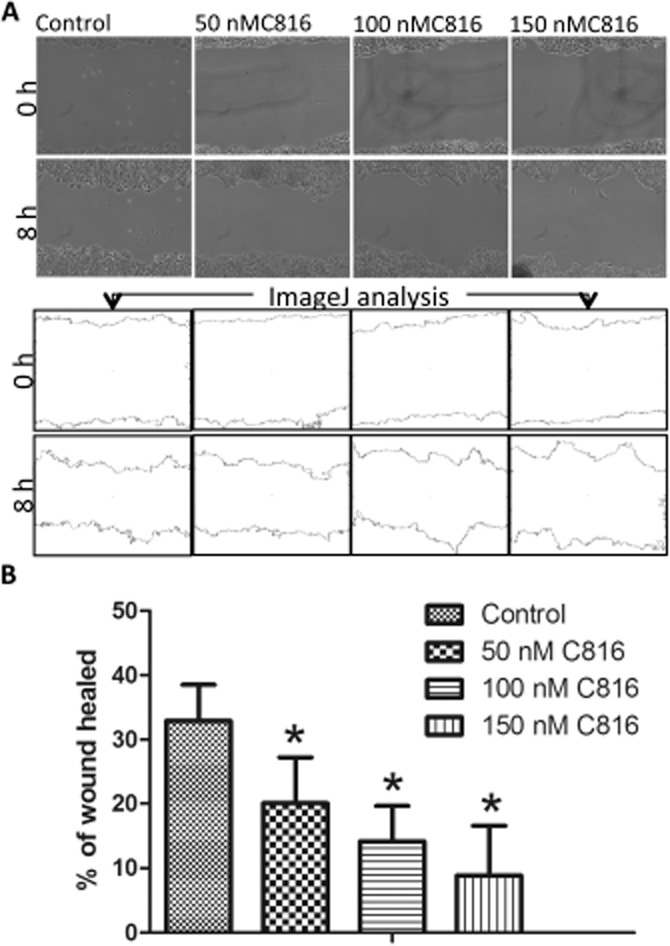
(A) Representative photos and ImageJ analysis to determine the percentage of wound healed in HepG2 cells after treatment with 50, 100 and 150 nM C816 for 8 h. (B) Quantification of wound healing after 8 h in HepG2 cells treated with 50, 100 and 150 nM C816 (P < 0.01, n = 20).
Figure 9.
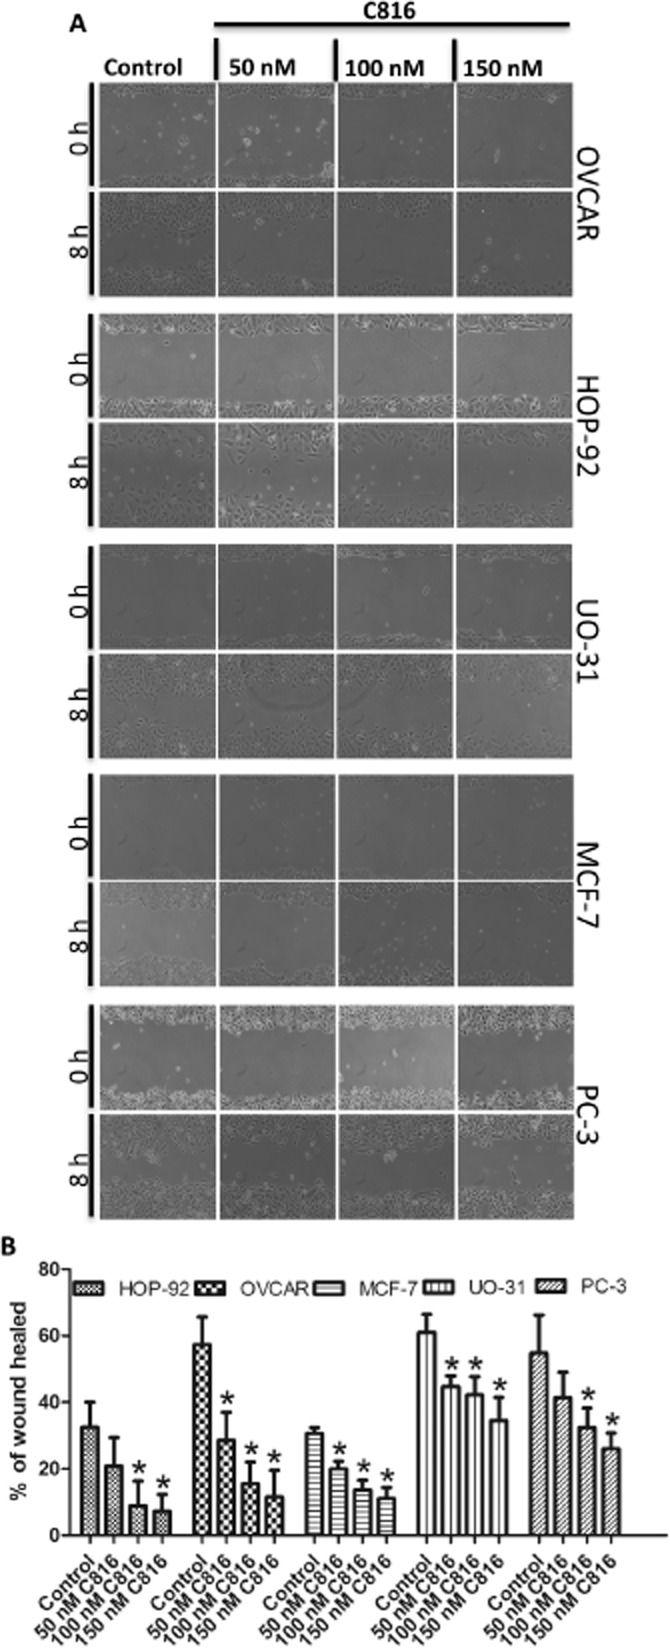
(A) Representative photos obtained in the wound healing assays after treatment of HOP-92, MCF-7, OVCAR, UO-31 and PC-3 cells for 8 h with C816. (B) Quantification of wound healing after 8 h of exposure to 50, 100 and 150 nM C816 (P < 0.01, n = 20).
Discussion and conclusions
In the present study, we showed that C816 reduces cell viability in several human tumour-derived cell lines. Furthermore, the compound reduced cell migration and adhesion. Microarray analysis of HepG2 cells treated with C816 showed that it down-regulated the expression of cyclins A and D and cyclin-dependent kinases 2 and 6, but increased the expression of cyclin-dependent kinase inhibitors A and D and components of the p53 pathway. This resulted in an inhibition of the cell cycle in the G0/G1 phase, as confirmed by the results obtained using flow cytometry. This type of inhibition of the cell cycle is in accordance with the transcriptomic effects produced by C816, as cyclin D in association with CDK4 or CDK6 is responsible for the transition of the G1 to the S-phase (Matsushime et al., 1992; Xiong et al., 1992; Bates et al., 1994; Meyerson and Harlow, 1994), together with cyclin E in association with CDK2 (Dulic et al., 1992; Koff et al., 1992). Furthermore, the reduced expression of cyclin A, which is involved in the initiation of DNA replication and that also associates with CDK2 (Pagano et al., 1992), is in accord with this inhibitory effect on the cell cycle in G0/G1. C800, with a chemical structure similar to C816, has been reported to inhibit the cell cycle of the K562 leukaemia cell line in the S-phase (Aoki et al., 2004). These authors demonstrated the induction of p21 (CDKN1A) after 48 h of treatment with C800. In our study, we observed no increase in the transcription of the mRNA coding for p21, but those coding for p19 and p16 (CDKN2D and A) were increased. An important difference between K562 cells and those used in this work is that the former growth is not attachment-dependent, while HepG2 cells grow attached to the substrate. This could be the reason for the difference observed between the two cell lines, as adherent cells anchoring to the substratum, together with growth factors, jointly regulate the progression through G1 into the S-phase of the cell cycle, inducing the expression of cyclin D and A (Zhu et al., 1996). C816 disrupted the attachment of cells to the substrate, leading to cell cycle arrest in G1. Another possibility is that C800 acts by affecting different pathways from those affected by C816. To determine whether this is true, we are performing a comparative study on the effects of C816, C800 and C830 on tumour cells.
Transcriptomic analysis showed a rapid down-regulation of cell processes involved in cell-cell and cell-matrix adhesion. The cell membrane components involved in cell-cell adhesion affected by C816 were the tight junctions. These join the cytoskeletons of adjacent cells together, anchoring the actin strands and are composed of two major integral membrane proteins: OCLN and CLNDs (Schneeberger and Lynch, 2004). Western blot analysis indicated that the C816 down-regulation of CLDN2 mRNA in HepG2 also occurs at the protein level. It has been demonstrated that down-regulation of CLDN2 expression inhibits cancer cell migration and anchorage-independent growth (Mima et al., 2008; Buchert et al., 2010), supporting the results obtained in this work. In addition to CLDN2, the mRNA of CLDN3, 14, 19 and 20, together with other components of the tight junctions like tight junction protein 3, were also down-regulated. Even though no variation in the OCLN mRNA was observed after C816 treatment, this compound induced the internalization of OCLN, which was detected in the cytoplasm of treated cells. Because only soluble protein was used for Western blot, the OCLN internalization explains the increase of this protein detected by this technique in treated cells. In control cells, most of the protein is membrane bound and is lost after centrifugation and recovery of the soluble protein fraction. It has been previously shown that in staurosporine-treated epithelial cells, the induction of apoptosis prompted by the cleavage of OCLN by caspases induces the appearance of a 32 kDa protein fragment, as determined by Western blot (Bojarski et al., 2004). This was not observed in HepG2 cells after 24 h of C816 treatment, indicating that the effect of C816 on cell adhesion precedes the induction of apoptosis. Vinculin is part of the focal adhesions that are involved in connecting the cytoskeleton to the extracellular matrix, cell morphology and cell migration (Peng et al., 2011). There was reduction or absence of VCL in the focal adhesions of treated cells. As with OCLN, the increase in this protein observed by Western blot could be a consequence of protein internalization or an effect of C816 on protein transport.
C816 inhibited the formation of stress fibres also involved in cell adhesion, motility and morphogenesis (Tojkander et al., 2012). Besides cell-cell adhesion and cell-matrix adhesion, the cell cytoskeleton and focal adhesion dynamics are involved in cell migration. This is a complex and regulated process that involves re-organization of the cytoskeleton and cell-matrix adhesion. When cells migrate, they attach to the matrix through focal adhesions (Jockusch et al., 1995), while stress fibres anchor the focal adhesions at their ends. Stress fibres are composed of actin filaments with alternating polarity that are essential for cell adhesion to the substratum and to induce changes in cell morphology during migration, generating forces to move and reshape the cell (Cramer et al., 1997; Hotulainen and Lappalainen, 2006). As a consequence of its effect on cell cytoskeleton and focal adhesions, C816 had a negative effect on cell migration. Treated cells presented no stress fibres and also reduced VCL in focal adhesions. These changes appeared early after 6 h of treatment and increased up to 24 h when decreased polymerized actin and VCL in focal adhesion were clearly observed at the three C816 concentrations tested. The effect of C816 was not exclusive to HepG2 cells as C816 treatment also reduced the migration of OV-CAR, HOP-92, UO-31, MCF-7 and PC-3 cells.
Taken together, these results demonstrate that C816 reduces cell viability in human tumour cells, also negatively affecting cell-cell adhesion, cell-matrix adhesion and cell migration. Cell-cell adhesion was reduced in the presence of C816 as a result of the down-regulation of CLDN and the internalization of OCLN, which debilitated the tight junctions. Inhibition of cell migration resulted from altered cytoskeletal dynamics, down-regulation of actin expression and inhibition of focal adhesion formation.
Acknowledgments
This work was funded with the following FEDER-cofounded grants:
From Ministerio de Ciencia y Tecnología, Spain: SAF2009-12581 (subprograma NEF), AGL2009-13581-CO2-01, TRA2009-0189, AGL2010-17875. From Xunta de Galicia, Spain: GRC 2010/10, and PGDIT 07MMA006261PR, PGIDIT (INCITE) 09MMA003261PR, PGDIT (INCITE) 09261080PR, 2009/XA044, and 10PXIB261254 PR. From EU VIIth Frame Program: 211326 – CP (CONffIDENCE), 265896 BAMMBO, 265409 μAQUA, and 262649 BEADS, 312184 PharmaSea. From the Atlantic Area Programme (Interreg IVB Trans-national): 2009-1/117 Pharmatlantic.
Glossary
- ACTA
actin alpha
- CDKN2A
cyclin-dependent kinase inhibitor 2A (p16)
- CDKN2D
cyclin-dependent kinase inhibitor 2D (p19)
- CDK2
cyclin-dependent kinase 2
- CLDN
claudin
- C816
crambescidin-816
- DE
differentially expressed
- MTT
(3-(4,5-dimethylthiazol-2-yl)-2,5-diphenyltetrazolium bromide)
- OCLN
occludin
- TUBB
tubulin beta
- VCL
vinculin
Conflict of interest
None.
Supporting Information
Additional Supporting Information may be found in the online version of this article at the publisher's web-site: http://dx.doi.org/10.1111/bph.12552
Validation of selected mRNAs expression by qPCR and comparison with microarray results.
Ontology analysis for the DE genes by C816 in HepG2 cells after 6 h.
Ontology analysis for the DE genes by C816 in HepG2 cells after 24 h.
References
- Aoki S, Kong D, Matsui K, Kobayashi M. Erythroid differentiation in K562 chronic myelogenous cells induced by crambescidin 800, a pentacyclic guanidine alkaloid. Anticancer Res. 2004;24:2325–2330. [PubMed] [Google Scholar]
- Aron ZD, Pietraszkiewicz H, Overman LE, Valeriote F, Cuevas C. Synthesis and anticancer activity of side chain analogs of the crambescidin alkaloids. Bioorg Med Chem Lett. 2004;14:3445–3449. doi: 10.1016/j.bmcl.2004.04.071. [DOI] [PubMed] [Google Scholar]
- Bates S, Bonetta L, MacAllan D, Parry D, Holder A, Dickson C, et al. CDK6 (PLSTIRE) and CDK4 (PSK-J3) are a distinct subset of the cyclin-dependent kinases that associate with cyclin D1. Oncogene. 1994;9:71–79. [PubMed] [Google Scholar]
- Belarbi el H, Contreras Gomez A, Chisti Y, Garcia Camacho F, Molina Grima E. Producing drugs from marine sponges. Biotechnol Adv. 2003;21:585–598. doi: 10.1016/s0734-9750(03)00100-9. [DOI] [PubMed] [Google Scholar]
- Berlinck RG, Braekman JC, Daloze D, Bruno I, Riccio R, Ferri S, et al. Polycyclic guanidine alkaloids from the marine sponge Crambe crambe and Ca++ channel blocker activity of crambescidin 816. J Nat Prod. 1993;56:1007–1015. doi: 10.1021/np50097a004. [DOI] [PubMed] [Google Scholar]
- Blunt JW, Copp BR, Hu WP, Munro MH, Northcote PT, Prinsep MR. Marine natural products. Nat Prod Rep. 2009;26:170–244. doi: 10.1039/b805113p. [DOI] [PubMed] [Google Scholar]
- Bojarski C, Weiske J, Schoneberg T, Schroder W, Mankertz J, Schulzke JD, et al. The specific fates of tight junction proteins in apoptotic epithelial cells. J Cell Sci. 2004;117(Pt 10):2097–2107. doi: 10.1242/jcs.01071. [DOI] [PubMed] [Google Scholar]
- Bondu S, Genta-Jouve G, Leirós M, Vale C, Guigonis J-M, Botana LM, et al. Additional bioactive guanidine alkaloids from the Mediterranean sponge Crambe crambe. RSC Adv. 2012;2:2828–2835. [Google Scholar]
- Buchert M, Papin M, Bonnans C, Darido C, Raye WS, Garambois V, et al. Symplekin promotes tumorigenicity by up-regulating claudin-2 expression. Proc Natl Acad Sci U S A. 2010;107:2628–2633. doi: 10.1073/pnas.0903747107. [DOI] [PMC free article] [PubMed] [Google Scholar]
- Burkholder PR, Ruetzler K. Antimicrobial activity of some marine sponges. Nature. 1969;222:983–984. doi: 10.1038/222983a0. [DOI] [PubMed] [Google Scholar]
- Buscema M, Van de Vyver G. Cytotoxic rejection of xenografts between marine sponges. J Exp Zoolog. 1985;235:297–308. [Google Scholar]
- Cramer LP, Siebert M, Mitchison TJ. Identification of novel graded polarity actin filament bundles in locomoting heart fibroblasts: implications for the generation of motile force. J Cell Biol. 1997;136:1287–1305. doi: 10.1083/jcb.136.6.1287. [DOI] [PMC free article] [PubMed] [Google Scholar]
- Dulic V, Lees E, Reed SI. Association of human cyclin E with a periodic G1-S phase protein kinase. Science. 1992;257:1958–1961. doi: 10.1126/science.1329201. [DOI] [PubMed] [Google Scholar]
- Hirata Y, Uemura D. Halichondrins—antitumor polyether macrolides from a marine sponge. Pure Appl Chem. 1986;58:701–710. [Google Scholar]
- Hotulainen P, Lappalainen P. Stress fibers are generated by two distinct actin assembly mechanisms in motile cells. J Cell Biol. 2006;173:383–394. doi: 10.1083/jcb.200511093. [DOI] [PMC free article] [PubMed] [Google Scholar]
- Huang da W, Sherman BT, Lempicki RA. Bioinformatics enrichment tools: paths toward the comprehensive functional analysis of large gene lists. Nucleic Acids Res. 2009a;37:1–13. doi: 10.1093/nar/gkn923. [DOI] [PMC free article] [PubMed] [Google Scholar]
- Huang da W, Sherman BT, Lempicki RA. Systematic and integrative analysis of large gene lists using DAVID bioinformatics resources. Nat Protoc. 2009b;4:44–57. doi: 10.1038/nprot.2008.211. [DOI] [PubMed] [Google Scholar]
- Jockusch BM, Bubeck P, Giehl K, Kroemker M, Moschner J, Rothkegel M, et al. The molecular architecture of focal adhesions. Annu Rev Cell Dev Biol. 1995;11:379–416. doi: 10.1146/annurev.cb.11.110195.002115. [DOI] [PubMed] [Google Scholar]
- Koff A, Giordano A, Desai D, Yamashita K, Harper JW, Elledge S, et al. Formation and activation of a cyclin E-cdk2 complex during the G1 phase of the human cell cycle. Science. 1992;257:1689–1694. doi: 10.1126/science.1388288. [DOI] [PubMed] [Google Scholar]
- Lopez-Alonso H, Rubiolo JA, Vega F, Vieytes MR, Botana LM. Protein synthesis inhibition and oxidative stress induced by cylindrospermopsin elicit apoptosis in primary rat hepatocytes. Chem Res Toxicol. 2013;26:203–212. doi: 10.1021/tx3003438. [DOI] [PubMed] [Google Scholar]
- Martin V, Vale C, Bondu S, Thomas OP, Vieytes MR, Botana LM. Differential effects of crambescins and crambescidin 816 in voltage-gated sodium, potassium and calcium channels in neurons. Chem Res Toxicol. 2013 doi: 10.1021/tx3004483. [Epub ahead of print] [DOI] [PubMed] [Google Scholar]
- Matsushime H, Ewen ME, Strom DK, Kato JY, Hanks SK, Roussel MF, et al. Identification and properties of an atypical catalytic subunit (p34PSK-J3/cdk4) for mammalian D type G1 cyclins. Cell. 1992;71:323–334. doi: 10.1016/0092-8674(92)90360-o. [DOI] [PubMed] [Google Scholar]
- Mayer AM, Glaser KB, Cuevas C, Jacobs RS, Kem W, Little RD, et al. The odyssey of marine pharmaceuticals: a current pipeline perspective. Trends Pharmacol Sci. 2010;31:255–265. doi: 10.1016/j.tips.2010.02.005. [DOI] [PubMed] [Google Scholar]
- Meyerson M, Harlow E. Identification of G1 kinase activity for cdk6, a novel cyclin D partner. Mol Cell Biol. 1994;14:2077–2086. doi: 10.1128/mcb.14.3.2077. [DOI] [PMC free article] [PubMed] [Google Scholar]
- Mima S, Takehara M, Takada H, Nishimura T, Hoshino T, Mizushima T. NSAIDs suppress the expression of claudin-2 to promote invasion activity of cancer cells. Carcinogenesis. 2008;29:1994–2000. doi: 10.1093/carcin/bgn134. [DOI] [PubMed] [Google Scholar]
- Molinski TF, Dalisay DS, Lievens SL, Saludes JP. Drug development from marine natural products. Nat Rev Drug Discov. 2009;8:69–85. doi: 10.1038/nrd2487. [DOI] [PubMed] [Google Scholar]
- Ottinger S, Kloppel A, Rausch V, Liu L, Kallifatidis G, Gross W, et al. Targeting of pancreatic and prostate cancer stem cell characteristics by Crambe crambe marine sponge extract. Int J Cancer. 2012;130:1671–1681. doi: 10.1002/ijc.26168. [DOI] [PubMed] [Google Scholar]
- Pagano M, Pepperkok R, Verde F, Ansorge W, Draetta G. Cyclin A is required at two points in the human cell cycle. EMBO J. 1992;11:961–971. doi: 10.1002/j.1460-2075.1992.tb05135.x. [DOI] [PMC free article] [PubMed] [Google Scholar]
- Peng X, Nelson ES, Maiers JL, DeMali KA. Chapter five – new insights into vinculin function and regulation. In: Kwang WJ, editor. International Review of Cell and Molecular Biology. Vol. 287. San Diego: Academic Press; 2011. pp. 191–231. [DOI] [PMC free article] [PubMed] [Google Scholar]
- Proksch P, Ebel R, Edrada RA, Wray V, Steube K. Bioactive natural products from marine invertebrates and associated fungi. Prog Mol Subcell Biol. 2003;37:117–142. doi: 10.1007/978-3-642-55519-0_5. [DOI] [PubMed] [Google Scholar]
- Saeed AI, Sharov V, White J, Li J, Liang W, Bhagabati N, et al. TM4: a free, open-source system for microarray data management and analysis. Biotechniques. 2003;34:374–378. doi: 10.2144/03342mt01. [DOI] [PubMed] [Google Scholar]
- Saeed AI, Bhagabati NK, Braisted JC, Liang W, Sharov V, Howe EA, et al. TM4 microarray software suite. Methods Enzymol. 2006;411:134–193. doi: 10.1016/S0076-6879(06)11009-5. [DOI] [PubMed] [Google Scholar]
- Schneeberger EE, Lynch RD. The tight junction: a multifunctional complex. Am J Physiol Cell Physiol. 2004;286:C1213–C1228. doi: 10.1152/ajpcell.00558.2003. [DOI] [PubMed] [Google Scholar]
- Schneider CA, Rasband WS, Eliceiri KW. NIH Image to ImageJ: 25 years of image analysis. Nat Methods. 2012;9:671–675. doi: 10.1038/nmeth.2089. [DOI] [PMC free article] [PubMed] [Google Scholar]
- Schwartsmann G, Brondani da Rocha A, Berlinck RG, Jimeno J. Marine organisms as a source of new anticancer agents. Lancet Oncol. 2001;2:221–225. doi: 10.1016/s1470-2045(00)00292-8. [DOI] [PubMed] [Google Scholar]
- Sipkema D, Franssen MC, Osinga R, Tramper J, Wijffels RH. Marine sponges as pharmacy. Mar Biotechnol (NY) 2005;7:142–162. doi: 10.1007/s10126-004-0405-5. [DOI] [PMC free article] [PubMed] [Google Scholar]
- Talpir R, Benayahu Y, Kashman Y, Pannell L, Schleyer M. Hemiasterlin and geodiamolide TA: two new cytotoxic peptides from the marine sponge Hemiasterella minor (Kirkpatrick) Tetrahedron Lett. 1994;44:53–56. [Google Scholar]
- Tojkander S, Gateva G, Lappalainen P. Actin stress fibers – assembly, dynamics and biological roles. J Cell Sci. 2012;125(Pt 8):1855–1864. doi: 10.1242/jcs.098087. [DOI] [PubMed] [Google Scholar]
- Uriz MJ, Beccero MA, Tur JM, Turon X. Location of toxicity within the Mediterranean sponge Crambe crambe. Mar Biol. 1996;124:583–590. [Google Scholar]
- Xiong Y, Zhang H, Beach D. D type cyclins associate with multiple protein kinases and the DNA replication and repair factor PCNA. Cell. 1992;71:505–514. doi: 10.1016/0092-8674(92)90518-h. [DOI] [PubMed] [Google Scholar]
- Zhu X, Ohtsubo M, Bohmer RM, Roberts JM, Assoian RK. Adhesion-dependent cell cycle progression linked to the expression of cyclin D1, activation of cyclin E-cdk2, and phosphorylation of the retinoblastoma protein. J Cell Biol. 1996;133:391–403. doi: 10.1083/jcb.133.2.391. [DOI] [PMC free article] [PubMed] [Google Scholar]
Associated Data
This section collects any data citations, data availability statements, or supplementary materials included in this article.
Supplementary Materials
Validation of selected mRNAs expression by qPCR and comparison with microarray results.
Ontology analysis for the DE genes by C816 in HepG2 cells after 6 h.
Ontology analysis for the DE genes by C816 in HepG2 cells after 24 h.


