Abstract
Objective:
We investigated the associations of diabetes and hypertension with imaging biomarkers (markers of neuronal injury and ischemic damage) and with cognition in a population-based cohort without dementia.
Methods:
Participants (n = 1,437, median age 80 years) were evaluated by a nurse and physician and underwent neuropsychological testing. A diagnosis of cognitively normal, mild cognitive impairment (MCI), or dementia was made by an expert panel. Participants underwent MRI to determine cortical and subcortical infarctions, white matter hyperintensity (WMH) volume, hippocampal volume (HV), and whole brain volume (WBV). The medical records were reviewed for diabetes and hypertension in midlife or later.
Results:
Midlife diabetes was associated with subcortical infarctions (odds ratio, 1.85 [95% confidence interval, 1.09–3.15]; p = 0.02), reduced HV (−4% [−7 to −1.0]; p = 0.01), reduced WBV (−2.9% [−4.1 to −1.6]), and prevalent MCI (odds ratio, 2.08; p = 0.01). The association between diabetes and MCI persisted with adjustment for infarctions and WMH volume but was attenuated after adjustment for WBV (1.60 [0.87–2.95]; p = 0.13) and HV (1.82 [1.00–3.32]; p = 0.05). Midlife hypertension was associated with infarctions and WMH volume and was marginally associated with reduced performance in executive function. Effects of late-life onset of diabetes and hypertension were few.
Conclusions:
Midlife onset of diabetes may affect late-life cognition through loss of brain volume. Midlife hypertension may affect executive function through ischemic pathology. Late-life onset of these conditions had fewer effects on brain pathology and cognition.
Diabetes and hypertension are common risk factors that have often been associated with late-life cognitive impairment.1,2 Both conditions are unequivocally associated with ischemic lesions in the brain and other organs,3–5 and there is evidence that they are associated with Alzheimer disease pathology5–8 and imaging changes such as brain atrophy.9–12 However, the mechanisms by which they cause brain injury are disputed. They may primarily target blood vessel structure and function to cause vascular damage or may interact at the cellular level with neurons or synapses that affect neurodegenerative processes and promote brain neurodegeneration. Because brain pathology occurs over several decades before cognitive impairment, the effects of diabetes and hypertension on brain pathology may differ with age at onset. We hypothesize that the effects of diabetes and hypertension on brain pathology in the elderly may be stronger with an earlier age at onset than with late-life onset. Despite this, most studies on the subject have focused on the effects of diabetes onset in midlife only or on a history of diabetes regardless of the age at onset. Furthermore, the implications of age at onset on brain pathology, and the impact on cognition, have not been fully examined. The objective of this study, therefore, was to investigate the potential mechanisms by which diabetes and hypertension affect imaging markers of ischemic injury and brain volume loss from neurodegeneration and how these imaging measures in turn alter relationships of diabetes and hypertension with cognition.
METHODS
Study setting and participants.
The Mayo Clinic Study of Aging (MCSA) is a population-based prospective study that was initiated in 2004 to investigate risk factors for mild cognitive impairment (MCI) and dementia among Olmsted County, MN residents. Details about study design and methodology are reported elsewhere.13,14 Briefly, Olmsted County residents aged 70 to 89 years were enumerated using the Rochester Epidemiology Project medical records–linkage system (n = 9,953).15 An age- and sex-stratified sample (n = 5,233) was randomly selected from the census enumeration; we excluded subjects with prevalent diagnosed dementia and persons who were in hospice or were terminally ill. Of 4,398 eligible subjects, 669 agreed to participate by telephone only. The remaining 2,050 who agreed to participate in a face-to-face evaluation were comprehensively evaluated to assess cognitive function, and were invited to undergo MRI. The present study is based on subjects who had their first study MRI performed between August 2005 and September 2011 (70% were within 3 months of the clinical assessment).
Standard protocol approvals, registrations, and patient consents.
All study protocols were approved by the Mayo Clinic and Olmsted Medical Center Institutional Review Boards. All subjects provided signed informed consent to participate in the study and in the imaging protocols.
Assessment of cognitive function.
Each subject was evaluated at enrollment and every 15 months thereafter by a nurse or study coordinator and a physician, and underwent extensive neuropsychological testing.13,14 The nurse interview included questions about memory posed to the study participant, and the Clinical Dementia Rating scale16 and the Functional Activities Questionnaire were administered to an informant.17 The physician evaluation included a full neurologic examination, administration of a modified Hachinski Scale,18 and the Short Test of Mental Status.19 The neuropsychological testing included 9 tests to assess function in memory (Auditory Verbal Learning Test [delayed recall], Logical Memory II [delayed recall], and Visual Reproduction II [delayed recall] from the Wechsler Memory Scale–Revised), executive function (Digit Symbol Substitution, Trail Making Test B from the Wechsler Adult Intelligence Scale–Revised), language (Boston Naming Test, category fluency test), and visuospatial skills (Picture Completion, Block Design) domains. The raw test scores were transformed into age-adjusted scores using normative data from Mayo's Older Americans Normative Studies.20 Domain scores were computed by first scaling the adjusted test scores within a domain, then summing and rescaling to allow comparisons across domains.20 For nonmemory domains, the domain score could not be computed if scores for one test were missing; for the memory domain, the domain score could not be computed if 2 test scores were missing. We also computed a single scaled summary score for each cognitive domain from the raw test scores, and summed and scaled the domain scores to obtain an unadjusted global cognitive z score. A diagnostic panel that included the 3 evaluators who saw the participant reviewed all of the information collected for each participant and assigned a diagnosis of normal cognition, MCI, or dementia by a consensus decision using previously published criteria.13,14,21
Ascertainment of type 2 diabetes, hypertension, and other vascular risk factors.
We assessed onset of vascular risk factors by abstracting the detailed medical records included in the medical records–linkage system.15 We defined type 2 diabetes as (1) treatment for type 2 diabetes, (2) fasting blood glucose >126 mg/dL on 2 separate occasions, or (3) physician diagnosis in the participant medical record. Hypertension was defined as (1) systolic blood pressure ≥140 mm Hg or diastolic ≥90 mm Hg on 2 occasions, or (2) treatment for hypertension. Dyslipidemia was defined as (1) use of lipid-lowering medications, or (2) serum triglycerides ≥150 mg/dL, total cholesterol >200 mg/dL, or high-density lipoprotein <40 mg/dL for men or <50 mg/dL for women. Obesity was defined as a body mass index ≥30 kg/m2 determined from medical record notation of weight and height. We assessed smoking (ever smoking 100 or more cigarettes) onset, intensity, and duration from self-report.
Acquisition of MRI measures.
We performed MRI studies at 3 tesla (Signa; GE Healthcare, Waukesha, WI) with an 8-channel phased-array head coil, acquiring both a 3-dimensional magnetization-prepared rapid-acquisition gradient echo (MPRAGE) sequence and a fluid-attenuated inversion recovery (FLAIR) sequence.22 From each subject's MPRAGE, we measured white matter (WM) volume using SPM5 unified segmentation, hippocampal volume (HV) using the FreeSurfer software (version 4.5), whole brain volume (WBV), and total intracranial volume (TIV).22–24 We adjusted HV to TIV, and WBV to TIV. We computed WM hyperintensity (WMH) volume from FLAIR images using a semiautomated segmentation procedure developed in-house, and computed the ratio of WMH volume to total WM (WMH/WM).25 In this way, WMH volume was scaled to the tissue volume at risk (i.e., WM). Cortical (>10 mm) and subcortical infarctions (WM, central gray, cerebellum, brainstem) were ascertained by experienced image analysts and confirmed by a radiologist (K.K.). Technicians who performed the imaging analysis had no knowledge of the clinical characteristics of participants.
Statistical analyses.
Subjects were characterized as having onset of diabetes or hypertension in midlife (ages 40–64 years), in late life (age 65 years or older), or never. For each condition, subjects without the disease (never) were the reference group; thus, the reference groups differed for diabetes and for hypertension. We used multivariable logistic regression models to assess the associations (odds ratios [ORs], 95% confidence intervals [CIs]) of diabetes in midlife or late life vs no diabetes (reference group) with categorical MRI measures (cortical and subcortical infarctions). We used multivariable linear regression models to examine the associations (regression coefficients, 95% CIs) of diabetes with the outcome measures of loge-transformed continuous MRI measurements scaled by total WM or TIV (WMH/WM, HV/TIV, WBV/TIV). In this way, the response is adjusted by total WM or head size and the regression coefficients can be interpreted as the estimated relative percentage difference between groups. All models were adjusted for age (5-year increase), sex, and education (base models). In the fully adjusted multivariable models, we adjusted for age, sex, education, APOE ε4 allele (carrier vs noncarrier), diabetes, hypertension, dyslipidemia, obesity, and smoking. We examined potential interactions between APOE ε4 allele, sex, and diabetes in regard to imaging measures. We also performed a qualitative test of mediation to examine the effects of imaging measures on the association of diabetes with measures of cognition. A qualitative test for mediation is acceptable if the magnitude or significance of the association between 2 variables is reduced by introduction of a third variable.26 To accomplish this, we examined the associations of diabetes with cognition (MCI, continuous cognitive z scores) in multivariable models where we included or did not include the imaging variables. We performed similar analyses for hypertension. We excluded 15 subjects with dementia because we could not perform subgroup analyses for these subjects.
RESULTS
Table 1 summarizes the characteristics of the 1,437 MCSA participants without dementia at the first MRI acquisition. Mean (SD) age at onset of diabetes was 56.2 (9.7) years for midlife and 71.9 (6.5) years for late life; hypertension onset was 52.7 (8.2) years for midlife and 71.6 (7.3) years for late life. Compared with MCSA participants who underwent imaging, participants who did not undergo imaging (n = 1,037) were older (median age 81 vs 80 years; p < 0.001), more frequently women (53% vs 48%; p = 0.009), obese (31% vs 27%; p = 0.03), less educated (≤12 years of education 49% vs 43%; p = 0.002), and were more likely to be ever smokers (52% vs 47%; p = 0.007), but they had a lower frequency of dyslipidemia (35% vs 39%; p = 0.03; table e-1 on the Neurology® Web site at Neurology.org). There were no differences in the frequency of APOE ε4 allele carriers, history of hypertension, and diabetes between imaging participants and nonparticipants.
Table 1.
Characteristics of study participants by cognitive status
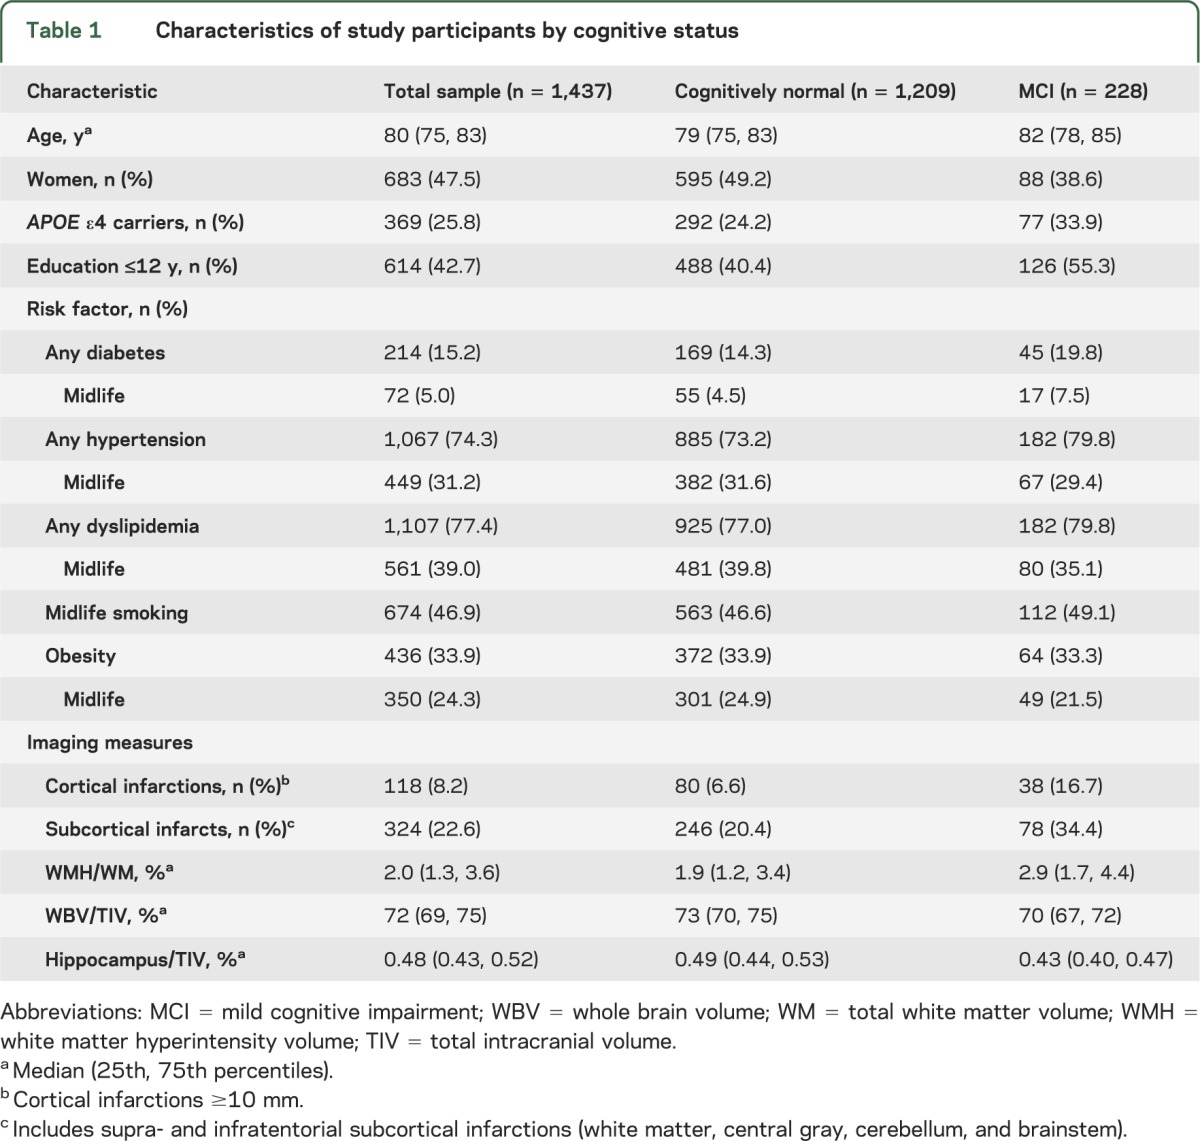
Table 2 shows the associations of diabetes and hypertension with the 5 imaging measures. Onset of diabetes and hypertension in midlife was associated with ischemic and atrophic imaging changes. The magnitude of the associations of diabetes and hypertension with infarctions and volumetric measures were stronger for onset of risk factors in midlife vs onset in late life. For completeness, we also examined associations of smoking and dyslipidemia with imaging features; midlife smoking and dyslipidemia were associated with reduced HV and WBV (table e-2).
Table 2.
Midlife onset of vascular risk factors and late-life infarctions, WMH volume, and markers of neuronal injury
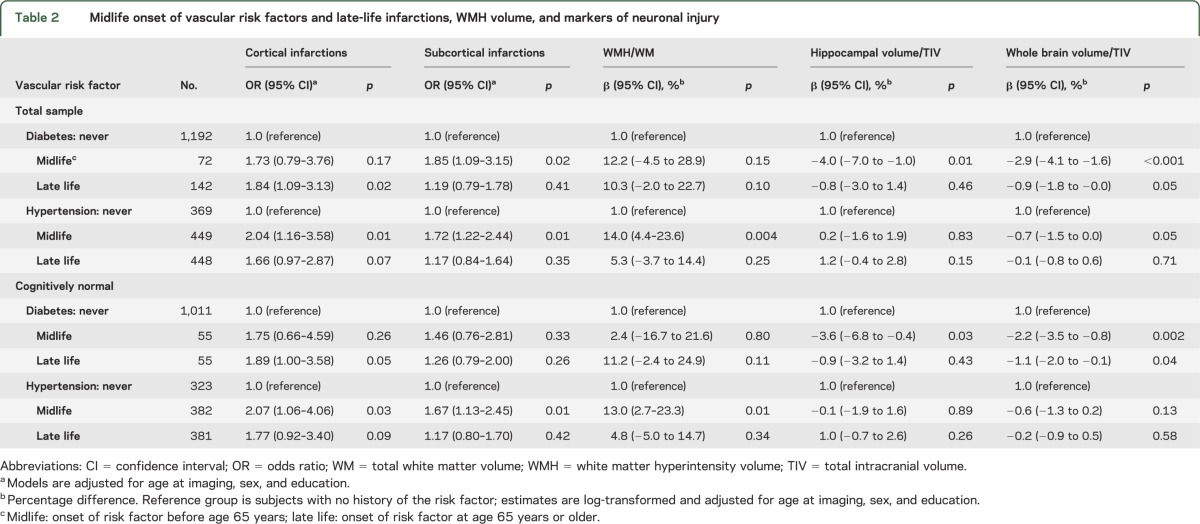
Table 3 shows the associations of diabetes and hypertension with cognitive measures. Midlife diabetes was associated with reduced performance in executive function, a reduced global cognitive score, and with an elevated risk of MCI in models adjusted for age, sex, and education. Late-life onset of diabetes was marginally associated with memory and executive function. The association of midlife diabetes with MCI was independent of other vascular risk factors and APOE ε4 allele status and remained significant in fully adjusted models (table 3, footnote). Midlife hypertension was marginally associated with reduced performance in executive function, and late-life onset was marginally associated with MCI. All imaging variables were associated with cognitive measures.
Table 3.
Associations of midlife and late-life onset of diabetes and hypertension with measures of cognitive function
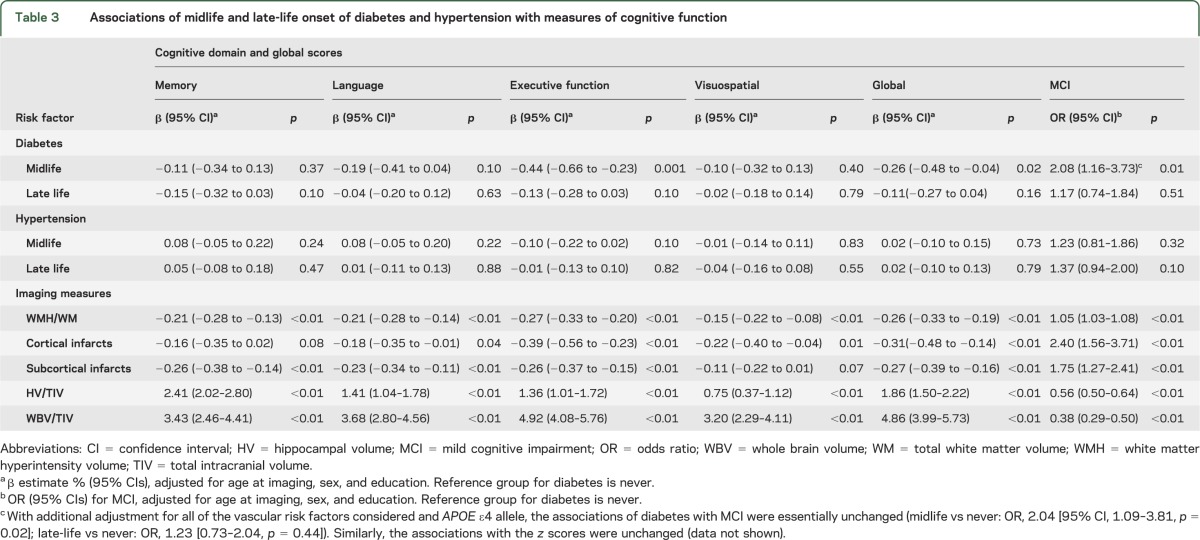
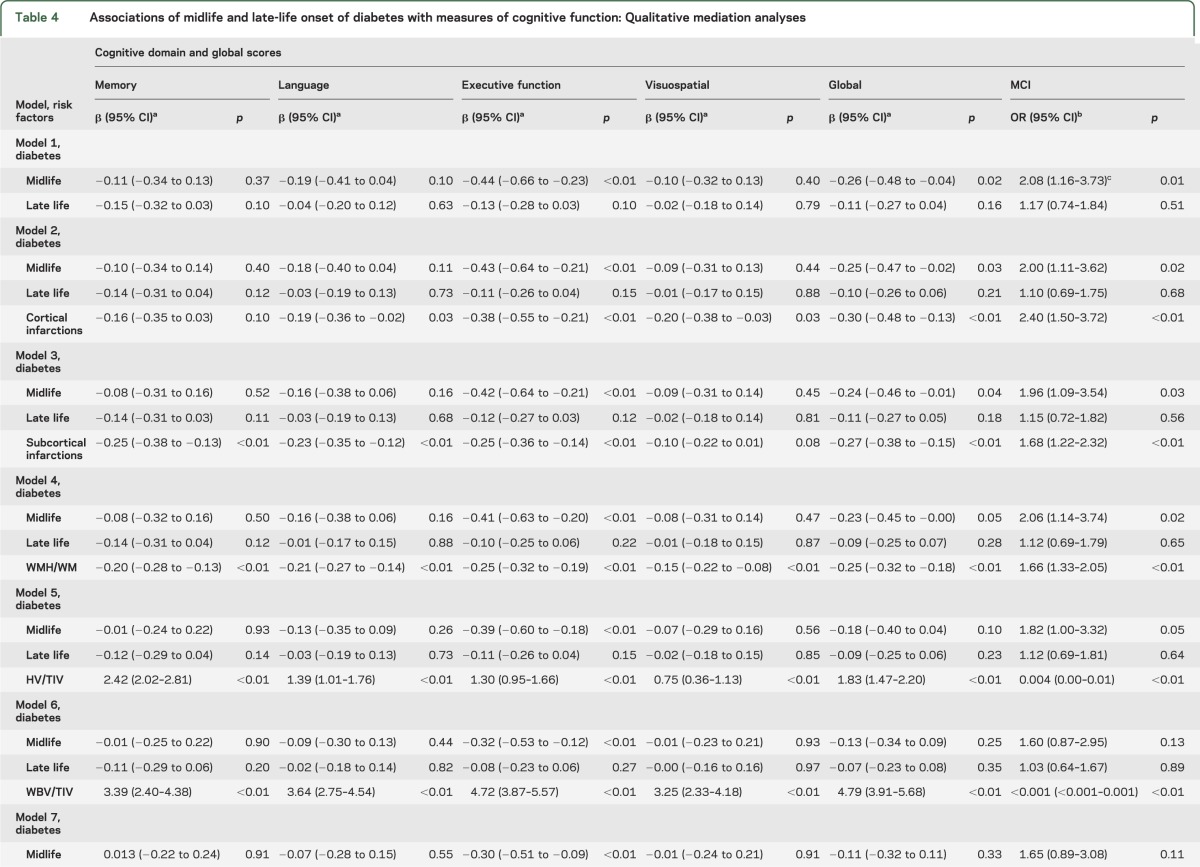
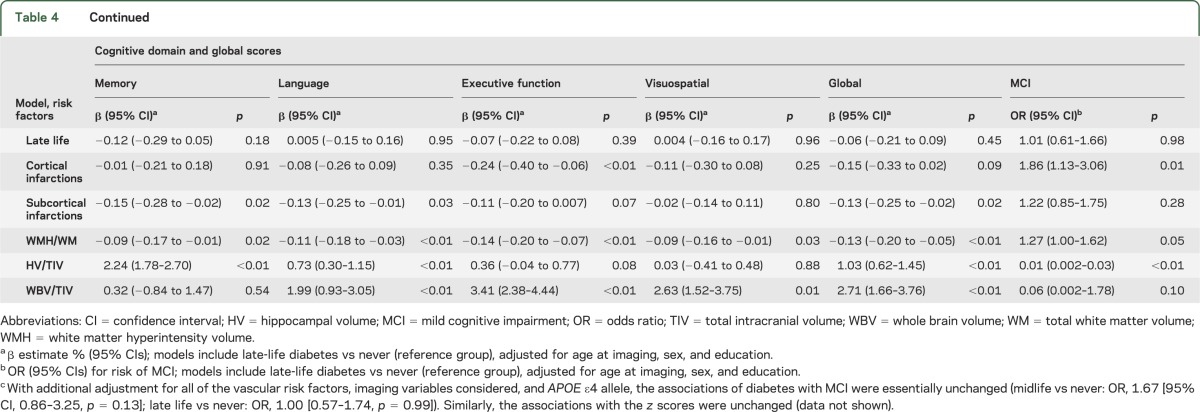
Table 4 describes the results of the qualitative tests for mediation that were performed to investigate potential mechanisms underlying the association of diabetes with cognitive impairment. To this end, we examined the effects of imaging variables on the association of midlife and late-life diabetes with cognitive measures. Model 1 does not include any imaging measure; models 2 to 6 include a single imaging measure at a time, and model 7 simultaneously adjusts for all of the imaging measures. Of note, the association of midlife diabetes was essentially unchanged after adjustment for imaging measures of vascular pathology (cortical infarctions, subcortical infarctions, and WMH/WM volume) but was attenuated after adjustment for HV/TIV (model 5) and became nonsignificant after adjustment for WBV/TIV (model 6) and all imaging measures (model 7). To determine whether potential mediating effects of vascular pathology were mitigated by treatment for diabetes, we repeated the analyses taking treatment into account. There was still no mediating effect of vascular markers (table e-3).
Table 4.
Associations of midlife and late-life onset of diabetes with measures of cognitive function: Qualitative mediation analyses
DISCUSSION
In our population-based sample of older participants without dementia, we studied the associations of midlife diabetes with imaging changes and cognition, and the impact of imaging measures on the association with cognition. Midlife diabetes was associated with both ischemic changes and atrophic changes in our participants without dementia. Our findings demonstrate an association of midlife diabetes with cognition and with cortical infarctions and markers of whole brain and regional hippocampal atrophy. In particular, our multivariable models suggest that markers of brain atrophy are in the causal pathway and may mediate the association of midlife diabetes with cognition. In contrast, the association was independent of infarctions and WMH volume, and of the other vascular risk factors and APOE ε4 status. These findings suggest that in persons with diabetes, brain volume loss may be a mechanism for the association of diabetes with Alzheimer disease or may share a common mechanistic pathway. The lack of an association of late-life diabetes with cognition further suggests that the pathophysiologic process requires decades to manifest pathologically or as symptoms.
In previous studies, midlife diabetes was associated with an annual increase in temporal horn volume10 and hippocampal atrophy in the Framingham Offspring Study,27–30 with reduced brain volume in the Atherosclerosis in Communities cohort,31 and with brain atrophy in the Leukoaraiosis and DISability in the Elderly Study.29 Midlife diabetes was also associated with risk of subcortical infarctions in another study.29 However, the previous studies invariably left doubt as to the mechanism by which diabetes caused the cognitive or imaging changes. Our ability to simultaneously model diabetic status in midlife with cognitive functioning and brain imaging in late life allowed us to establish that global brain volume loss was in the causal pathway for the association of diabetes with cognitive decline.
The associations of midlife hypertension with infarctions, WMH volume, and WBV are consistent with other studies.10,31,32 The stronger effects of midlife onset of hypertension vs late-life onset may be attributable to long-standing small- and large-vessel disease. The marginal association of midlife hypertension with impaired executive function is consistent with the adverse effects of WM disease on frontal lobe function. The lack of significant association between hypertension and cognition precluded our investigation of the mechanism by which hypertension affects cognition. The marginal association of late-life onset with MCI suggests that the nonsignificant association of midlife onset with MCI may be attributable to a survival effect in an elderly cohort.
It is hypothesized that dysfunctional insulin signaling and altered glucose metabolism in the brain might have a role in tau protein degradation, amyloidogenesis, or some other process that is toxic to neurons. Altered insulin signaling may increase tau phosphorylation,33 increase insulin binding to insulin-degrading enzyme, decrease β-amyloid clearance,34 and lead to neurodegeneration. Elevated glucose levels may promote advanced glycation end-products (AGE) and their receptor (RAGE),35 and binding of β-amyloid to RAGE may lead to formation of toxic products, neurodegeneration, and vascular brain damage.36–38 Diabetes may also promote microinfarctions by a mechanism that is independent of macroinfarction and WMH changes, and by subclinical covert mechanisms that lead to brain volume loss.
Our study has several strengths. The population-based design reduced the potential for selection bias. We assessed associations in a large sample of subjects without dementia and in preclinical asymptomatic individuals. Our use of a medical records–linkage system to assess vascular risk factors and patients’ age at onset (midlife and late life) provided comprehensive and more valid and reliable data than self-report.15 The availability of medical record information from all providers of care in the community from earlier life to the present, in the same subjects, is an important and unique strength of our study. We used state-of-the-art imaging techniques to assess markers of brain pathology, and comprehensively assessed cognitive function using published criteria. Finally, our ability to assess risk factors in midlife or earlier, and to evaluate associations with brain pathology in late life, allowed us to examine the effects of midlife exposures occurring many years before the assessment of imaging outcomes.
Potential limitations of our study include a possibility for nonparticipation bias regarding nonparticipation. There were no differences among participants and nonparticipants in the imaging studies regarding the frequency of diabetes, hypertension, and APOE ε4 allele, but there were differences in age, sex, education, and frequency of certain vascular risk factors in midlife. The higher nonparticipation by subjects with diabetes at the time of recruitment in the MCSA suggests that we may have underestimated the magnitude of the effect of diabetes on MRI markers of abnormality. We arbitrarily used age 65 years to designate earlier vs late-life onset of vascular risk factors; some people diagnosed after age 65 may have had undiagnosed or subclinical disease for a number of years. It is possible that vascular mechanisms (WMH/WM, infarctions) may have a stronger role in subjects with diabetes and hypertension who develop cognitive impairment at younger ages and who may be underrepresented in our sample. Finally, Olmsted County residents are primarily of Northern European ancestry, and our findings remain to be confirmed in other ethnic groups.39
Our findings suggest that earlier onset of diabetes and hypertension leads to brain pathology in late-life brain, and that the effects of whole brain and hippocampal atrophy are a mechanism by which diabetes affects cognition in late life. The potential clinical implications of our findings are that prevention and control of diabetes and hypertension may prevent or delay the ischemic injury and brain neurodegeneration and the onset of clinical manifestations of cognitive impairment.
Supplementary Material
GLOSSARY
- CI
confidence interval
- FLAIR
fluid-attenuated inversion recovery
- HV
hippocampal volume
- MCI
mild cognitive impairment
- MCSA
Mayo Clinic Study of Aging
- MPRAGE
magnetization-prepared rapid-acquisition gradient echo
- OR
odds ratio
- RAGE
receptor for advanced glycation end-products
- TIV
total intracranial volume
- WBV
whole brain volume
- WM
white matter
- WMH
white matter hyperintensity
Footnotes
Supplemental data at Neurology.org
AUTHOR CONTRIBUTIONS
Dr. Roberts had full access to all of the data in the study and takes responsibility for the integrity of the data and the accuracy of the data analysis. Study concept and design: Roberts, Knopman, Petersen. Acquisition of data: Roberts, Knopman, Kantarci, Preboske, Senjem, Pankratz, Geda, Boeve, Ivnik, Jack. Analysis and interpretation of data: Roberts, Knopman, Przybelski. Drafting of the manuscript: Roberts. Critical revision of the manuscript for important intellectual content: Knopman, Mielke, Rocca. Statistical analysis: Roberts, Przybelski. Obtained funding: Roberts, Knopman, Pankratz, Rocca, Petersen. Administrative, technical, or material support: Roberts, Petersen, Jack. Study supervision: Roberts, Petersen, Jack.
STUDY FUNDING
The study was supported by the National Institute on Aging grants U01 AG006786, P50 AG016574, K01 AG028573, R01 AG011378, K01 MH68351, and R01 AG040042, and the Robert H. and Clarice Smith and Abigail Van Buren Alzheimer's Disease Research Program, and was made possible by the Rochester Epidemiology Project (R01 AG034676). Additional funding sources include NIH funding: R21 NS066147, RR024150 (Career Transition Award), R01 AG029550, R01 AG032306, U01 HL096917, and U01 96917, R01 AG034676, P50 AG044170, DHHS/OS 90BC0009, U01 AG024904, and the Robert Wood Johnson Foundation and the European Union Regional Development Fund (Project FNUSA-ICRC: CZ.1.05/1.1.00/02.0123).
DISCLOSURE
R. Roberts receives research support from AbbVie Health Economics and Outcome Research and from the Walter S. and Lucienne Driskill Foundation. D. Knopman serves as Deputy Editor for Neurology® and on a data safety monitoring board for Lilly Pharmaceuticals, and is an investigator in clinical trials sponsored by Janssen Pharmaceuticals. S. Przybelski reports no disclosures relevant to the manuscript. M. Mielke receives research support from the Walter S. and Lucienne Driskill Foundation. K. Kantarci serves on the data safety monitoring board for Takeda Global Research & Development Center, Inc. G. Preboske, M. Senjem, V. Pankratz, and Y. Geda report no disclosures relevant to the manuscript. B. Boeve has served as a consultant to GE Healthcare; receives publishing royalties for The Behavioral Neurology of Dementia (Cambridge University Press, 2009); and receives research support from Cephalon, Inc., Allon Therapeutics, Inc., the NIH/National Institute on Aging, the Alzheimer's Association, and the Mangurian Foundation. R. Ivnik and W. Rocca report no disclosures relevant to the manuscript. R. Petersen serves on scientific advisory boards for Pfizer, Inc., Janssen Alzheimer Immunotherapy, Elan Pharmaceuticals, and GE Healthcare, has given a CME lecture for Novartis, Inc., and receives royalties from the publication of Mild Cognitive Impairment (Oxford University Press, 2003). C. Jack serves as a consultant for Janssen, Bristol-Myers Squibb, General Electric, Siemens, and Johnson & Johnson, and is involved in clinical trials sponsored by Allon and Baxter, Inc. He receives research funding from the NIH and the Alexander Family Alzheimer's Disease Research Professorship of the Mayo Foundation. Go to Neurology.org for full disclosures.
REFERENCES
- 1.Kivipelto M, Helkala EL, Laakso MP, et al. Midlife vascular risk factors and Alzheimer's disease in later life: longitudinal, population based study. BMJ 2001;322:1447–1451 [DOI] [PMC free article] [PubMed] [Google Scholar]
- 2.Whitmer RA, Sidney S, Selby J, Johnston SC, Yaffe K. Midlife cardiovascular risk factors and risk of dementia in late life. Neurology 2005;64:277–281 [DOI] [PubMed] [Google Scholar]
- 3.Beeri MS, Silverman JM, Davis KL, et al. Type 2 diabetes is negatively associated with Alzheimer's disease neuropathology. J Gerontol A Biol Sci Med Sci 2005;60:471–475 [DOI] [PMC free article] [PubMed] [Google Scholar]
- 4.Arvanitakis Z, Schneider JA, Wilson RS, et al. Diabetes is related to cerebral infarction but not to AD pathology in older persons. Neurology 2006;67:1960–1965 [DOI] [PubMed] [Google Scholar]
- 5.Sonnen JA, Larson EB, Brickell K, et al. Different patterns of cerebral injury in dementia with or without diabetes. Arch Neurol 2009;66:315–322 [DOI] [PMC free article] [PubMed] [Google Scholar]
- 6.Peila R, Rodriguez BL, Launer LJ. Type 2 diabetes, APOE gene, and the risk for dementia and related pathologies: the Honolulu-Asia Aging Study. Diabetes 2002;51:1256–1262 [DOI] [PubMed] [Google Scholar]
- 7.Petrovitch H, White LR, Izmirilian G, et al. Midlife blood pressure and neuritic plaques, neurofibrillary tangles, and brain weight at death: the HAAS: Honolulu-Asia Aging Study. Neurobiol Aging 2000;21:57–62 [DOI] [PubMed] [Google Scholar]
- 8.Ahtiluoto S, Polvikoski T, Peltonen M, et al. Diabetes, Alzheimer disease, and vascular dementia: a population-based neuropathologic study. Neurology 2010;75:1195–1202 [DOI] [PubMed] [Google Scholar]
- 9.Knopman DS, Penman AD, Catellier DJ, et al. Vascular risk factors and longitudinal changes on brain MRI: the ARIC study. Neurology 2011;76:1879–1885 [DOI] [PMC free article] [PubMed] [Google Scholar]
- 10.Debette S, Seshadri S, Beiser A, et al. Midlife vascular risk factor exposure accelerates structural brain aging and cognitive decline. Neurology 2011;77:461–468 [DOI] [PMC free article] [PubMed] [Google Scholar]
- 11.Enzinger C, Fazekas F, Matthews PM, et al. Risk factors for progression of brain atrophy in aging: six-year follow-up of normal subjects. Neurology 2005;64:1704–1711 [DOI] [PubMed] [Google Scholar]
- 12.Schmidt R, Launer LJ, Nilsson LG, et al. Magnetic resonance imaging of the brain in diabetes: the Cardiovascular Determinants of Dementia (CASCADE) Study. Diabetes 2004;53:687–692 [DOI] [PubMed] [Google Scholar]
- 13.Roberts RO, Geda YE, Knopman DS, et al. The Mayo Clinic Study of Aging: design and sampling, participation, baseline measures and sample characteristics. Neuroepidemiology 2008;30:58–69 [DOI] [PMC free article] [PubMed] [Google Scholar]
- 14.Petersen RC, Roberts RO, Knopman DS, et al. Prevalence of mild cognitive impairment is higher in men: the Mayo Clinic Study of Aging. Neurology 2010;75:889–897 [DOI] [PMC free article] [PubMed] [Google Scholar]
- 15.St Sauver JL, Grossardt BR, Yawn BP, Melton LJ, III, Rocca WA. Use of a medical records linkage system to enumerate a dynamic population over time: the Rochester Epidemiology Project. Am J Epidemiol 2011;173:1059–1068 [DOI] [PMC free article] [PubMed] [Google Scholar]
- 16.Morris JC. The Clinical Dementia Rating (CDR): current version and scoring rules. Neurology 1993;43:2412–2414 [DOI] [PubMed] [Google Scholar]
- 17.Pfeffer RI, Kurosaki TT, Harrah CH, Jr, Chance JM, Filos S. Measurement of functional activities in older adults in the community. J Gerontol 1982;37:323–329 [DOI] [PubMed] [Google Scholar]
- 18.Hachinski VC, Iliff LD, Zilhka E, et al. Cerebral blood flow in dementia. Arch Neurol 1975;32:632–637 [DOI] [PubMed] [Google Scholar]
- 19.Kokmen E, Smith GE, Petersen RC, Tangalos E, Ivnik RC. The Short Test of Mental Status: correlations with standardized psychometric testing. Arch Neurol 1991;48:725–728 [DOI] [PubMed] [Google Scholar]
- 20.Ivnik RJ, Malec JF, Smith GE, et al. Mayo's Older Americans Normative Studies: WAIS-R, WMS-R and AVLT norms for ages 56 through 97. Clin Neuropsychol 1992;6:1–104 [Google Scholar]
- 21.Petersen RC. Mild cognitive impairment as a diagnostic entity. J Intern Med 2004;256:183–194 [DOI] [PubMed] [Google Scholar]
- 22.Jack CR, Jr, Bernstein MA, Fox NC, et al. The Alzheimer's disease neuroimaging initiative (ADNI): MRI methods. J Magn Reson Imaging 2008;27:685–691 [DOI] [PMC free article] [PubMed] [Google Scholar]
- 23.Jack CR, Jr, Bernstein MA, Borowski BJ, et al. Update on the magnetic resonance imaging core of the Alzheimer's disease neuroimaging initiative. Alzheimers Dement 2010;6:212–220 [DOI] [PMC free article] [PubMed] [Google Scholar]
- 24.Gunter JL, Bernstein MA, Borowski BJ, et al. Measurement of MRI scanner performance with the ADNI phantom. Med Phys 2009;36:2193–2205 [DOI] [PMC free article] [PubMed] [Google Scholar]
- 25.Jack CR, Jr, O'Brien PC, Rettman DW, et al. FLAIR histogram segmentation for measurement of leukoaraiosis volume. J Magn Reson Imaging 2001;14:668–676 [DOI] [PMC free article] [PubMed] [Google Scholar]
- 26.MacKinnon DP, Fairchild AJ, Fritz MS. Mediation analysis. Annu Rev Psychol 2007;58:593–614 [DOI] [PMC free article] [PubMed] [Google Scholar]
- 27.Korf ES, van Straaten EC, de Leeuw FE, et al. Diabetes mellitus, hypertension and medial temporal lobe atrophy: the LADIS study. Diabet Med 2007;24:166–171 [DOI] [PubMed] [Google Scholar]
- 28.Gold SM, Dziobek I, Sweat V, et al. Hippocampal damage and memory impairments as possible early brain complications of type 2 diabetes. Diabetologia 2007;50:711–719 [DOI] [PubMed] [Google Scholar]
- 29.Korf ES, White LR, Scheltens P, Launer LJ. Brain aging in very old men with type 2 diabetes: the Honolulu-Asia Aging Study. Diabetes Care 2006;29:2268–2274 [DOI] [PubMed] [Google Scholar]
- 30.den Heijer T, Vermeer SE, van Dijk EJ, et al. Type 2 diabetes and atrophy of medial temporal lobe structures on brain MRI. Diabetologia 2003;46:1604–1610 [DOI] [PubMed] [Google Scholar]
- 31.Knopman DS, Mosley TH, Catellier DJ, Sharrett AR. Cardiovascular risk factors and cerebral atrophy in a middle-aged cohort. Neurology 2005;65:876–881 [DOI] [PubMed] [Google Scholar]
- 32.Gottesman RF, Coresh J, Catellier DJ, et al. Blood pressure and white-matter disease progression in a biethnic cohort: Atherosclerosis Risk in Communities (ARIC) Study. Stroke 2010;41:3–8 [DOI] [PMC free article] [PubMed] [Google Scholar]
- 33.Hong M, Lee VM. Insulin and insulin-like growth factor-1 regulate tau phosphorylation in cultured human neurons. J Biol Chem 1997;272:19547–19553 [DOI] [PubMed] [Google Scholar]
- 34.Edbauer D, Willem M, Lammich S, Steiner H, Haass C. Insulin-degrading enzyme rapidly removes the beta-amyloid precursor protein intracellular domain (AICD). J Biol Chem 2002;277:13389–13393 [DOI] [PubMed] [Google Scholar]
- 35.Singh R, Barden A, Mori T, Beilin L. Advanced glycation end-products: a review. Diabetologia 2001;44:129–146 [DOI] [PubMed] [Google Scholar]
- 36.Yaffe K, Lindquist K, Schwartz AV, et al. Advanced glycation end product level, diabetes, and accelerated cognitive aging. Neurology 2011;77:1351–1356 [DOI] [PMC free article] [PubMed] [Google Scholar]
- 37.Srikanth V, Maczurek A, Phan T, et al. Advanced glycation endproducts and their receptor RAGE in Alzheimer's disease. Neurobiol Aging 2011;32:763–777 [DOI] [PubMed] [Google Scholar]
- 38.Munch G, Schinzel R, Loske C, et al. Alzheimer's disease: synergistic effects of glucose deficit, oxidative stress and advanced glycation endproducts. J Neural Transm 1998;105:439–461 [DOI] [PubMed] [Google Scholar]
- 39.St Sauver JL, Grossardt BR, Leibson CL, Yawn BP, Melton JL, Rocca WA. Generalizability of epidemiological findings and public health decisions: an illustration from the Rochester Epidemiology Project. Mayo Clin Proc 2012;87:151–160 [DOI] [PMC free article] [PubMed] [Google Scholar]
Associated Data
This section collects any data citations, data availability statements, or supplementary materials included in this article.


