Abstract
Rationale:
Although osteopontin (OPN) is induced in alcoholic patients, its role in the pathophysiology of alcoholic liver disease (ALD) remains unclear. Increased translocation of lipopolysaccharide (LPS) from the gut is key for the onset of ALD since it promotes macrophage infiltration and activation, tumor necrosis factor-α (TNFα) production and liver injury. Since OPN is protective for the intestinal mucosa, we postulated that enhancing OPN expression in the liver and consequently in the blood and/or in the gut could protect from early alcohol-induced liver injury.
Results:
Wild-type (WT), OPN knockout (Opn−/−) and transgenic mice overexpressing OPN in hepatocytes (OpnHEP Tg) were chronically fed either the control or the ethanol Lieber-DeCarli diet. Ethanol increased hepatic, plasma, biliary and fecal OPN more in OpnHEP Tg than in WT mice. Steatosis was lesser in ethanol-treated OpnHEP Tg mice as shown by decreased liver-to-body weight ratio, hepatic triglycerides, the steatosis score, oil red-O staining and lipid peroxidation. There was also less inflammation and liver injury as demonstrated by lower ALT activity, hepatocyte ballooning degeneration, LPS levels, the inflammation score and the number of macrophages and TNFα+ cells. To establish if OPN could limit LPS availability and its noxious effects in the liver, binding studies were performed. OPN showed affinity for LPS and the binding prevented macrophage activation, reactive oxygen and nitrogen species generation and TNFα production. Treatment with milk OPN (m-OPN) blocked LPS translocation in vivo and protected from early alcohol-induced liver injury.
Conclusion:
Natural induction plus forced overexpression of OPN in the liver and treatment with m-OPN protect from early alcohol-induced liver injury by blocking the gut-derived LPS and TNFα effects in the liver.
Keywords: Alcoholic liver disease, macrophages, inflammation, steatosis, oxidative stress, bile, gut
ALD is a major cause of morbidity and mortality worldwide. The spectrum of disease ranges from simple fatty liver to steatohepatitis, progressive fibrosis, cirrhosis and hepatocellular carcinoma. In developed countries, ALD is a major cause of end-stage liver disease that requires transplantation. Although some current interventions such as administration of corticosteroids are beneficial for patients with ALD, identifying key mediators that could prevent or promote disease progression is critical for understanding its pathogenesis and to improve the quality of life from these patients.
Macrophages are particularly relevant for the onset of ALD. When enteric Gram-negative bacteria along with bacterial products like LPS translocate into the portal circulation they activate hepatic macrophages. Furthermore, ethanol exposure sensitizes macrophages to activation by LPS via toll-like receptor-4 (TLR4) triggering pro-inflammatory signaling pathways, generating reactive oxygen (ROS) and nitrogen (RNS) species and enhancing the production of TNFα, all of which lead to steatosis and hepatocyte injury (1, 2).
OPN is a soluble cytokine and a matrix-associated protein present in the majority of tissues and body fluids (3). OPN is increased in alcoholic patients (4, 5) and in animal models of alcoholic steatohepatitis (ASH) (4, 6-10); however, its role in the pathogenesis of ALD still remains underdefined. Although OPN has been tagged as a pro-inflammatory cytokine, it also has anti-inflammatory properties in various pathological settings. Opn−/− develop less fibrosis (11) but more steatosis (8, 10, 12) than WT mice and are impaired for clearing intracellular pathogens (13). Indeed, studies using an acute colitis model (14, 15) showed exacerbated tissue destruction and reduced repair in Opn−/− compared to WT mice nevertheless administration of exogenous OPN protected Opn−/− mice from the adverse effects of experimental colitis (16). In addition, macrophages isolated from aging WT mice, with higher OPN expression than those from young mice, are less responsive to LPS stimulation (17). Since the concentration of OPN in human milk, colostrum, umbilical cord, newborns and infants’ plasma is very high compared to that found in tissues or in adults, it is possible that OPN could have beneficial immunomodulatory effects (18). Indeed, previous work from our laboratory demonstrated that oral administration of m-OPN throughout chronic alcohol feeding provides effective nutritional support ameliorating liver injury by preserving tight-junction integrity and by lowering LPS levels (19).
Since natural induction of OPN in the liver does not appear to suffice to protect from ALD, we hypothesized that increasing OPN expression in the liver above the physiological levels could promote OPN secretion into the plasma and/or excretion into the biliary system, target the gut-liver axis and avert early alcohol-induced liver injury. Thus, the aims of this work were first, to compare the hepatoprotective effects of natural induction versus natural induction plus overexpressed OPN in hepatocytes; and second, to analyze if the enhanced secretion of OPN into the plasma and/or excretion into the bile could block the increase in circulating LPS, hepatic macrophage infiltration and activation along with TNFα production hence protecting from early alcohol-induced liver injury.
EXPERIMENTAL PROCEDURES
Mice
C57BL/6J WT and Opn−/− (B6.Cg-Spp1tm1Blh/J) mice were purchased from Jackson Laboratories (Bar Harbor, ME). OpnHEP Tg mice were generated and donated by Dr. Satoshi Mochida (Saitama Medical University, Japan) (20) and were crossbred with the same strain and stock number of C57BL/6J WT listed above.
Human m-OPN binding to LPS
MaxiSorb plates (Nunc, Rochester, NY) were coated with 100 μl of 5 μg/ml LPS (Escherichia coli serotype 055:B5, Sigma, St. Louis, MO), blocked with 2% bovine serum albumin (BSA) followed by incubation with 250 or 500 ng of native biotinylated human m-OPN (m-OPN*) in a total volume of 100 μl of TBS containing 0.05% (v/v) Tween-20 for 2 h at 37°C. Competitive inhibition experiments were performed with 100-fold molar excess of unlabeled m-OPN or BSA. Plates were washed three times, incubated with HRP-conjugated streptavidin and developed with TMB-one substrate (KemEnTec, Windsor, CT).
Kinetic analysis of the binding of recombinant OPN (rOPN) to LPS
Binding experiments were conducted on the IAsys Plus (Affinity Sensors Ltd., Cambridge, UK). Reactions were carried out in an IAsys resonant mirror biosensor at 25°C using planar hydrophobic surfaces. The lipid A moiety of LPS was immobilized onto the hydrophobic cuvette surface dissolved in 10 mM sodium acetate at pH 5.0 and applied onto the cuvette at 1 mg/ml until saturation was achieved (~300 arc s). Interaction analysis was conducted with increasing concentrations of rOPN, lipopolysaccharide binding protein (LBP, Sigma), m-OPN or BSA up to 2.5 μM in phosphate-buffered saline. Regeneration of the cuvette was achieved by repeated washes with 100 mM hydrochloric acid. Results were analyzed with IAsys Fastfit software (Affinity Sensors Ltd.) to calculate the association equilibrium constant for each protein.
Intestinal permeability
An ileal loop model was performed in Opn−/− mice as described (21). A 4-cm long segment of the mouse ileum was created using two vascular hemoclips without disrupting the mesenteric vascular arcades and under anesthesia. The portion of intestine between the two clips was injected with 50 μl FITC-LPS (Sigma) along with m-OPN or BSA (control). Mice were sacrificed 2 h later, tissue was collected and plasma was drawn to measure FITC-LPS by spectrofluorimetry.
RESULTS
Alcohol feeding increases hepatic, plasma, biliary and fecal OPN levels
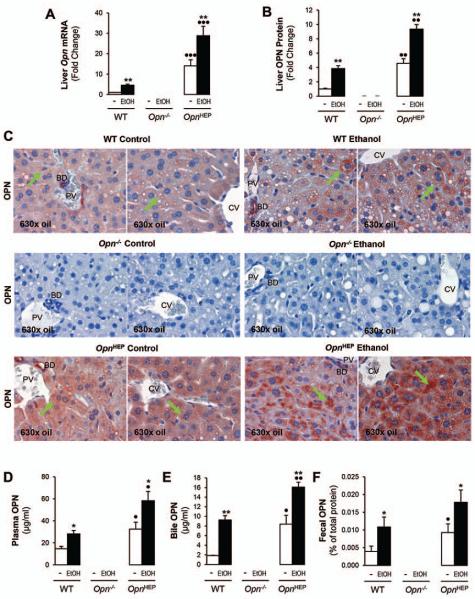
To evaluate whether OPN increases in response to ethanol feeding, hepatic OPN was measured in WT, Opn−/− and OpnHEP Tg mice fed 7 wks either the control or the alcohol Lieber-DeCarli diet. Hepatic Opn mRNA increased by ~15-fold in OpnHEP Tg compared to WT mice and ethanol feeding further enhanced Opn mRNA in both groups of mice (Fig. 1A). Analysis by immunohistochemistry (IHC) showed a 5-fold increase in OPN+ staining in hepatocytes from OpnHEP Tg compared to WT mice and alcohol feeding elevated OPN expression in both groups of mice (Fig. 1B-1C). There was a ~2-fold increase in plasma OPN in OpnHEP Tg compared to WT mice and further enhancement by ethanol feeding in both groups of mice (Fig. 1D). Because there was OPN+ staining in the luminal side of bile ducts (Fig. 1C), we evaluated if OPN could be excreted into the bile. OPN was significantly higher in bile (Fig. 1E) and in feces (Fig. 1F) in OpnHEP Tg compared to WT mice and alcohol feeding further increased OPN levels in both groups of mice. Thus, alcohol intake increases OPN expression, secretion and excretion in mice. Generally, OPN expression and levels were higher in OpnHEP Tg compared to WT mice; yet, whether natural induction and/or natural induction plus forced OPN expression in hepatocytes could be protective or noxious in early alcohol-induced liver injury needed further investigation.
Figure 1. Alcohol feeding increases hepatic, plasma, biliary and fecal OPN levels.
WT, Opn−/− and OpnHEP Tg mice were fed 7 wks either the control or the alcohol Lieber-DeCarli diet. qRT-PCR analysis of liver Opn mRNA (A). Computer-assisted morphometric analysis of the OPN IHC (B). There is increased OPN expression in OpnHEP Tg compared to WT mice with additional enhancement by ethanol feeding (green arrows) as shown on IHC. PV: portal vein. CV: central vein. BD: bile duct (C). Plasma (D), bile (E) and fecal (F) OPN levels. n=10/group; *p<0.05 and **p<0.01 for ethanol vs control; •p<0.05, ••p<0.01 and •••p<0.001 for OpnHEP Tg vs WT mice.
Natural induction plus forced overexpression of OPN in hepatocytes protects from early alcohol-induced liver injury and steatosis whereas natural induction of OPN does not suffice to confer full protection
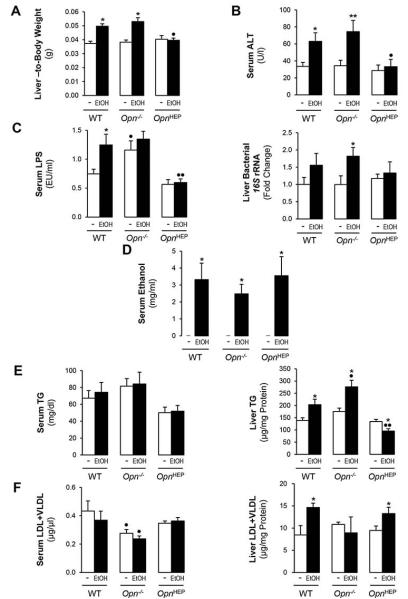
To dissect if natural induction and/or natural induction plus forced expression of OPN in hepatocytes could protect from alcohol hepatotoxicity, several parameters of liver injury where analyzed. OpnHEP Tg mice fed either diet showed similar liver-to-body weight ratio; however, alcohol feeding increased the liver-to-body weight ratio by ~35% in WT and by ~42% in Opn−/− mice compared to their respective controls (Fig. 2A). Serum ALT activity remained normal after ethanol feeding in OpnHEP Tg mice, suggesting limited liver injury; yet, it was elevated by ~2- and ~2.5-fold in ethanol-treated WT and in Opn−/− mice, respectively (Fig. 2B). Serum LPS levels remained low in ethanol-fed OpnHEP Tg mice whereas Opn−/− showed the highest levels under control, ethanol or Chow diet (the latter not shown) followed by WT mice (Fig. 2C, left). Opn−/− mice only showed a modest LPS response to alcohol, likely due to the already existing damage to the epithelial barrier that could have primed these mice for subsequent injury (13, 19) (Fig. 2C, left). Measurement of bacterial 16S rRNA also confirmed fewer bacteria in livers from ethanol-fed OpnHEP Tg mice compared to WT and Opn−/− mice (Fig. 2C, right). All mice fed control diet showed similar increase in enteric Gram-negative bacteria 16S rDNA compared to mice fed Chow diet and ethanol feeding equally enhanced fecal Gram-negative bacteria 16S rDNA in all mice compared to mice fed control diet (not shown). Hence, differences in serum LPS likely result from translocation of LPS and enteric Gram-negative bacteria rather than from differences in bacterial growth. Last, there was similar serum alcohol concentration in all alcohol-fed mice indicating that the genotype did not affect alcohol availability (Fig. 2D). All groups of ethanol-treated mice showed comparable cytochrome P450 2E1 (CYP2E1), alcohol dehydrogenase (ADH) and catalase expression and enzymatic activity suggesting similar ethanol metabolism (Supplementary Fig. 1A-1D).
Figure 2. Natural induction plus overexpression of OPN in hepatocytes protects from early alcohol-induced liver injury whereas natural induction of OPN does not suffice to confer full protection.
WT, Opn−/− and OpnHEP Tg mice were fed 7 wks either the control or the alcohol Lieber-DeCarli diet. Liver-to-body weight ratio (A), serum ALT activity (B), serum LPS levels (C, left) and liver bacterial 16S rRNA (C, right). Serum ethanol concentration (D). Serum and liver TG (E) and LDL plus VLDL (F). n=10/group; *p<0.05 and **p<0.01 for ethanol vs control; •p<0.05 and ••p<0.01 for any genotype vs WT mice.
Next, we evaluated if natural induction and/or natural induction plus forced expression of OPN in hepatocytes could prevent steatosis. Serum triglycerides (TG) remained unchanged in all groups of mice (Fig. 2E, left). There was a decrease in liver TG in ethanol-fed OpnHEP Tg yet TG increased in ethanol-fed WT and more in Opn−/− mice (Fig. 2E, right). Hepatic low-density lipoproteins (LDL) plus very low-density lipoproteins (VLDL) were slightly increased by ethanol in OpnHEP Tg and in WT compared to Opn−/− mice (Fig. 2F).
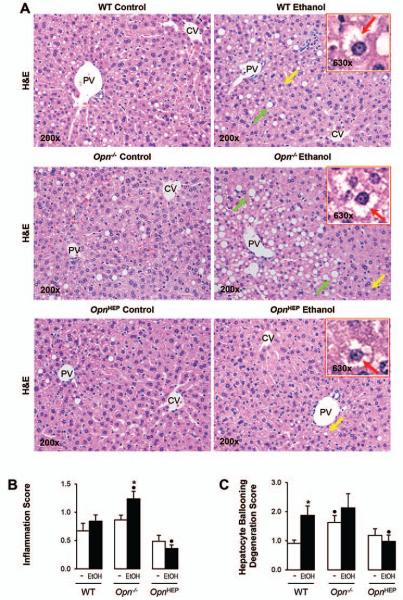
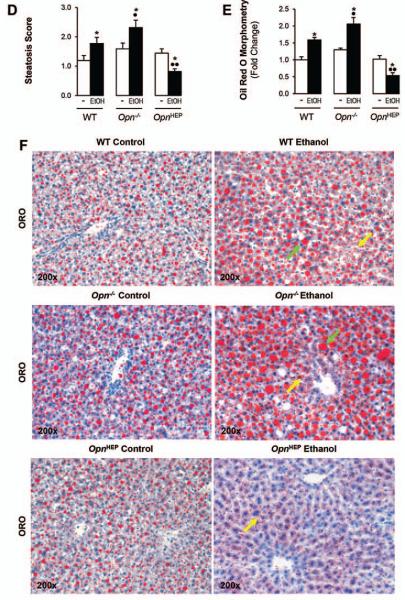
Hematoxylin and eosin (H&E) staining (Fig. 3A) and the activity scores (Fig. 3B-3D) revealed significant protection from alcohol-induced liver injury in OpnHEP Tg compared to WT followed by Opn−/− mice. The scores for inflammation (Fig. 3B), hepatocyte ballooning degeneration (Fig. 3C) and steatosis (Fig. 3D) were lowest in ethanol-treated OpnHEP Tg compared to WT followed by Opn−/− mice. Oil red O staining for neutral fat and morphometric analysis further confirmed that the lowest macro- and microvesicular steatosis by ethanol-treatment occurred in OpnHEP Tg mice (Fig. 3E-3F). Because ethanol causes insulin resistance which could drive hepatic steatosis, we determined whether this could condition steatosis in our model. Since H&E staining of adipose tissue showed similar number of crown-like structures and adipocyte size (Supplementary Fig. 2A-2C), no changes in serum glucose and insulin levels were observed (Supplementary Fig. 2D-2E) and similar changes in hepatic insulin signaling (i.e. phosphorylation of insulin receptor substrate-1 (IRS1) and Akt) (Supplementary Fig. 2F) were observed in all the ethanol-fed mice; thus, the extent of steatosis under alcohol consumption in our model was unlikely due to differences in insulin resistance among the ethanol-fed mice. Last, the expression of α-Smooth muscle actin (αSMA), a marker of hepatic stellate cell activation (Supplementary Fig. 3A-3B), and Sirius red/Fast green staining for collagenous proteins (Supplementary Fig. 3C) remained similar in all ethanol-fed mice. Overall, natural induction plus forced overexpression of OPN in hepatocytes protects from early ethanol-induced liver injury and steatosis whereas natural induction of OPN does not suffice to confer full protection. These findings were also validated using the chronic-plus-single-binge ethanol feeding model where more severe injury occurs (Supplementary Fig. 4).
Figure 3. Natural induction plus overexpression of OPN in hepatocytes protects from alcohol-induced steatosis whereas natural induction of OPN does not suffice to confer full protection.
WT, Opn−/− and OpnHEP Tg mice were fed 7 wks either the control or the alcohol Lieber-DeCarli diet. H&E staining shows less inflammation, hepatocyte ballooning degeneration (red arrows on the insets), micro- (yellow arrows) and macrovesicular (green arrows) steatosis in ethanol-treated OpnHEP Tg followed by WT and by Opn−/− mice. PV: portal vein. CV: central vein (A). The scores for inflammation (B), hepatocyte ballooning degeneration (C) and steatosis (D) are lower in ethanol-treated OpnHEP Tg followed by WT and Opn−/− mice. Morphometric analysis (E) and oil red O staining (F). n=10/group; *p<0.05 for ethanol vs control; •p<0.05 and ••p<0.01 for any genotype vs WT mice.
TNFα expression remains basal in ethanol-fed OpnHEP Tg but increases in ethanol-fed WT and more in Opn−/− mice
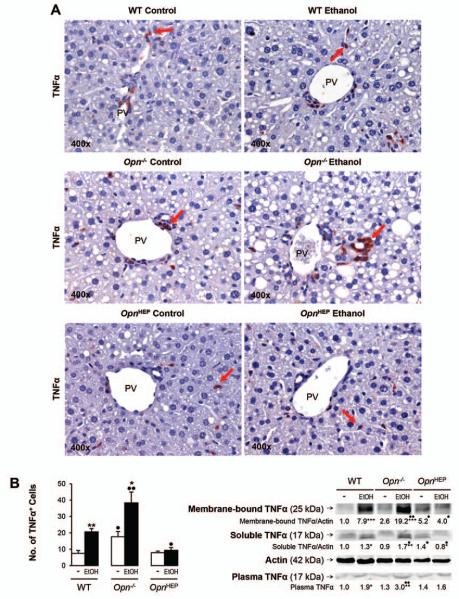
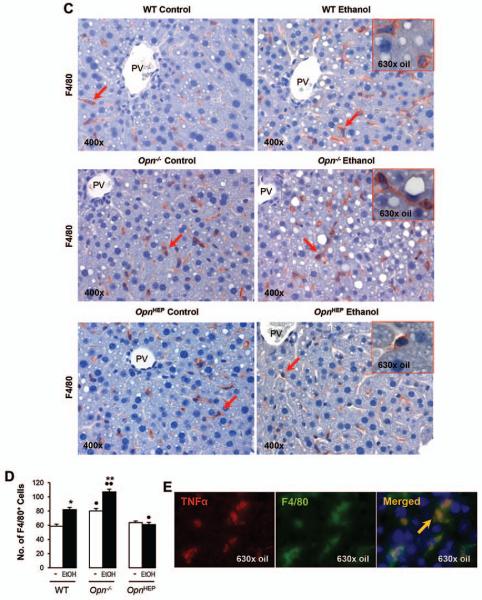
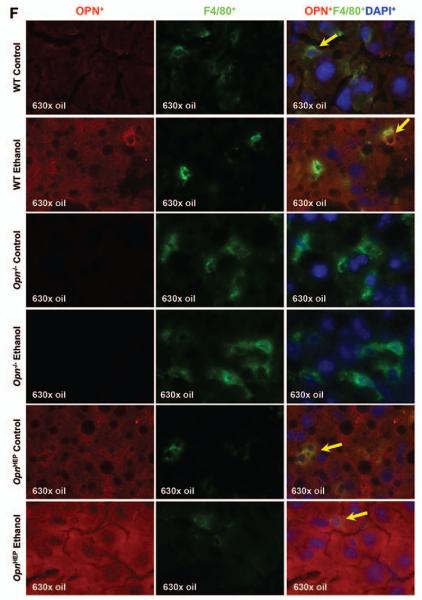
Because TNFα is a key proinflammatory cytokine that causes significant liver injury, particularly in the context of ALD (22, 23); next, we evaluated TNFα expression. IHC and morphometric assessment demonstrated that the number of TNFα+ cells particularly around the portal vein, key location for LPS entry into the liver, was similar in OpnHEP Tg mice fed either diet whereas ethanol treatment increased the number of TNFα+ cells in WT and more in Opn−/− mice (Fig. 4A-4B, left). This was also quantified by Western blot (Fig. 4B, right) and by qRT-PCR analysis (not shown), which proved the lowest liver and plasma TNFα concentration in control and in ethanol-treated OpnHEP Tg mice. Last, to identify whether the small number of TNFα+ cells in ethanol-treated OpnHEP Tg mice resulted from less macrophages present in the liver, IHC for F4/80 and morphometric analysis was performed. Alcohol feeding decreased the number of F4/80+ cells in OpnHEP Tg while it increased in WT and more in Opn−/− mice (Fig. 4C-4D). Macrophages were identified as the main source of TNFα since there was co-localization of F4/80+ and TNFα+ staining (Fig. 4E) and double positive cells (activated macrophages) were lowest in ethanol-fed OpnHEP Tg mice (Supplementary Table 1). OPN expression in macrophages was similar in ethanol-treated WT and OpnHEP Tg mice as shown by co-localization studies (Fig. 4F). Thus, the number of intrahepatic macrophages also conditioned the increase in liver TNFα expression. These results suggest that natural induction plus forced overexpression of OPN in hepatocytes but not natural induction of OPN only limits the number of infiltrating macrophages and TNFα expression contributing to prevent early alcohol-induced liver injury in OpnHEP Tg mice.
Figure 4. TNFα expression remains basal in ethanol-fed OpnHEP Tg but increases in ethanol-fed WT and more in Opn−/− mice.
WT, Opn−/− and OpnHEP Tg mice were fed 7 wks either the control or the alcohol Lieber-DeCarli diet. TNFα IHC depicts a small number of TNFα+ cells (red arrows) in ethanol-treated OpnHEP Tg compared to WT and Opn−/− mice (A). Computer-assisted morphometric analysis of the TNFα IHC calculated as the number of TNFα+ cells in 20 fields at 200x magnification (B, left). Western blot analysis for liver membrane-bound and soluble along with plasma TNFα protein (B, right). IHC for F4/80 (red arrows) (C) and morphometric analysis of the F4/80 IHC calculated as the number of F4/80+ cells in 20 fields at 200× magnification (D). Co-localization of TNFα+ and F4/80+ staining in ethanol-fed WT mice (merged=yellow) (E). Co-localization of OPN+ and F4/80+ staining in ethanol-fed WT, Opn−/− and OpnHEP Tg mice (merged=yellow) (F). n=10/group; *p<0.05, **p<0.01 and ***p<0.001 for ethanol vs control; •p<0.05 and ••p<0.01 for any genotype vs WT mice.
OPN binds LPS
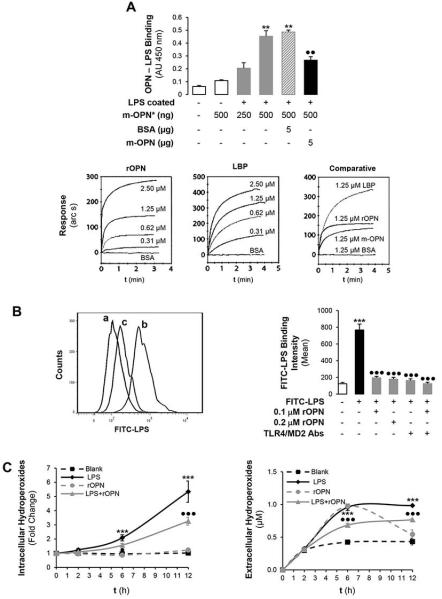
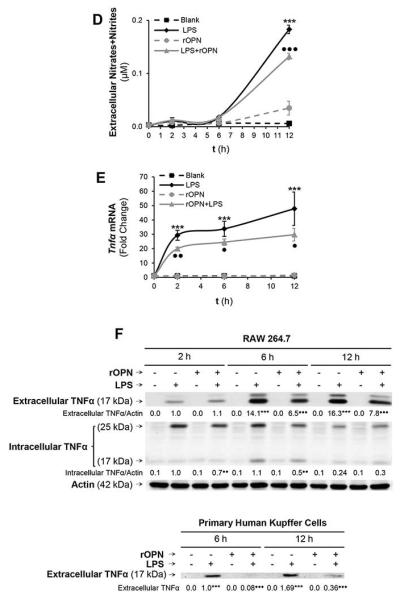
Based on the above-described results and due to the significant role of LPS in the pathogenesis of ALD driving macrophage hepatic infiltration and TNFα increase; next, we evaluated whether OPN could limit LPS availability thus preventing macrophage-related liver damage. To determine if the small number of TNFα+ cells in ethanol-treated OpnHEP Tg mice could be due to inability of LPS to activate macrophages in the presence of OPN, we analyzed if interaction between OPN and LPS could occur. First, using human m-OPN* we observed a dose-dependent binding of m-OPN* to LPS coated on plastic wells. The binding was disrupted when plates were incubated with an excess of non-biotinylated human m-OPN whereas an excess of BSA did not out-compete the binding of m-OPN* (Fig. 5A, top). Second, using surface plasmon resonance, the lipid A moiety of LPS was immobilized onto a hydrophobic surface and the monolayer was incubated with increasing concentrations of rOPN, LBP (positive control), m-OPN or BSA. Binding to lipid A (not out-competed by BSA) occurred dose-dependently in all cases and the association equilibrium constant was 2.34, 6.67, 2.18 x 10⁶ M-1 and 0, respectively (Fig. 5A, bottom); hence, the binding ability of rOPN and of m-OPN to LPS was 35 and 33%, respectively, from that of LBP. Third, to dissect if the protective effects of OPN involved less efficient LPS binding to macrophages, RAW 264.7 cells were incubated with FITC-LPS in the presence or absence of rOPN and the binding was monitored by flow cytometry. The ability of FITC-LPS to bind RAW 264.7 cells was partially blunted by co-treatment with rOPN (Fig. 5B, left, b vs c). Co-incubation with TLR4/MD2 neutralizing Abs, key proteins in the LPS signaling pathway, slightly increased the FITC-LPS binding to RAW 264.7 cells in the presence than in the absence of rOPN (Fig. 5B right), suggesting that both LPS alone or LPS bound to rOPN signal via TLR4. Similar results were obtained with m-OPN (not shown).
Figure 5. OPN binds LPS and prevents macrophage activation, ROS plus RNS generation and lowers TNFα expression.
The ability of human biotinylated m-OPN* to bind LPS is demonstrated on LPS-coated plates. Incubation with an excess of BSA does not out-compete the m-OPN* binding whereas incubation with non-biotinylated human m-OPN outcompetes the m-OPN* binding to LPS (AU: absorbance units). **p<0.01 vs control and ••p<0.01 for competition studies vs biotinylated m-OPN (A, top). Using surface plasmon resonance, the lipid A moiety of LPS was immobilized onto a hydrophobic surface and the monolayer was incubated with increasing concentrations of rOPN, LBP, m-OPN or BSA. Sensograms showing that all molecules bind lipid A but differ in their binding affinity (A, bottom). Flow cytometry analysis of the binding of FITC-LPS to RAW 264.7 macrophages incubated in the presence or absence of rOPN (B, left; a: control, b: FITC-LPS and c: FITC-LPS + rOPN) along with TLR4 and MD2 neutralizing Abs (B, right). The generation of intra- and extracellular hydroperoxides (C) along with extracellular nitrates plus nitrites (D) by stimulation of RAW 264.7 macrophages with LPS is partially blocked by co-treatment with rOPN. Tnfα mRNA (E) along with intra- and extracellular TNFα protein (F, top) increase under LPS treatment but decrease time-dependently by co-incubation of RAW 264.7 macrophages with rOPN. Levels of TNFα in human Kupffer cells (F, bottom). n=10; ***p<0.001 for LPS-treated vs its own control; •p<0.05, ••p<0.01 and •••p<0.001 for rOPN co-treated vs its own control.
OPN binding to LPS prevents macrophage activation, ROS and RNS generation and lowers TNFα levels
Because LPS drives macrophage activation, ROS and RNS generation along with TNFα increase promoting steatosis and liver damage (24); next, we measured macrophage ROS, RNS, Tnfα mRNA and TNFα protein in a time-course experiment. The generation of intra- and extracellular hydroperoxides along with nitrates plus nitrites in RAW 264.7 cells by LPS treatment was partially blocked by co-treatment with rOPN (Fig. 5C-5D) or with m-OPN (not shown). Moreover, both Tnfα mRNA and intra- and extracellular TNFα protein increased under LPS treatment but were blunted time-dependently by co-incubation with rOPN (Fig. 5E-5F, top) or with m-OPN (not shown). A decrease in TNFα protein was also observed in human Kupffer cells (Fig. 5F, bottom). In aggregate, binding of rOPN (or of m-OPN) to LPS could be hepatoprotective by decreasing macrophage activation, ROS plus RNS generation and TNFα production.
m-OPN prevents FITC-LPS translocation in vivo in Opn−/− mice
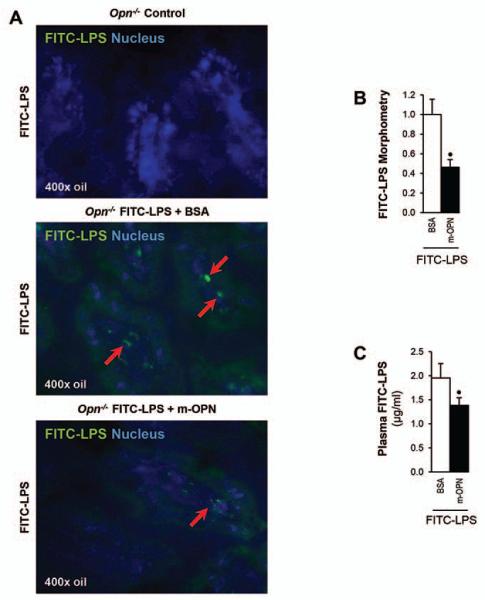
Since OPN was found in bile and feces, it was enhanced by ethanol feeding and in vitro experiments proved binding of rOPN and of m-OPN to LPS; next, we determined whether the binding could prevent LPS translocation in vivo. To this end, a segment of the intestine between two clips from Opn−/− mice was injected with FITC-LPS and with m-OPN or with BSA (control). Mice were sacrificed and ileal and plasma FITC-LPS levels were evaluated. Fig. 6A shows less green fluorescence in the ileal villi from FITC-LPS + m-OPN compared to the FITC-LPS + BSA injected Opn−/− mice, which was quantified by morphometric assessment (Fig. 6B). Fig. 6C demonstrates decreased plasma FITC-LPS levels in the FITC-LPS + m-OPN compared to the FITC-LPS + BSA injected Opn−/− mice. Thus, binding of m-OPN to FITC-LPS occurs in the ileum and may be protective by partially inhibiting LPS translocation from the gut into the circulation to reduce hepatic macrophage infiltration and activation along with the TNFα-driven effects.
Figure 6. m-OPN prevents FITC-LPS translocation in vivo in Opn−/− mice.
To measure intestinal permeability, an ileal loop model using Opn−/− mice was performed. A 4-cm long segment of the mouse ileum was created using two vascular hemoclips without disrupting the mesenteric vascular arcades and under anesthesia. The portion of intestine between the two clips was injected with FITC-LPS in addition to m-OPN or BSA (control) and mice were sacrificed. FITC-LPS+ staining is present in the ileal loop villi from FITC-LPS + BSA injected mice but is almost absent in FITC-LPS + m-OPN injected mice (A). Morphometric analysis of the FITC-LPS positive area (B). Plasma FITC-LPS is shown in (C). n=6; •p<0.05 for FITC-LPS + m-OPN vs FITC-LPS + BSA.
Treatment with m-OPN rescues WT mice from alcohol-induced liver injury
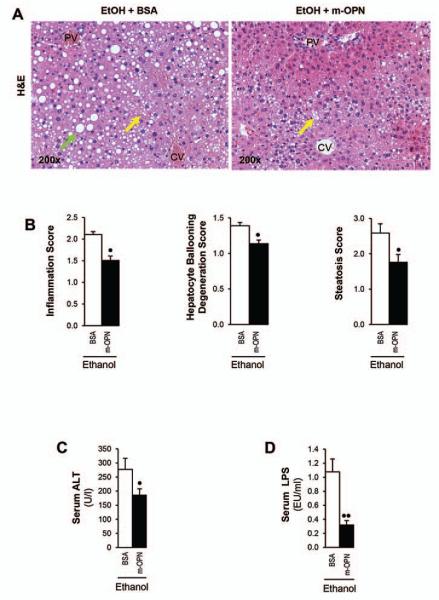
Last, since natural induction plus forced overexpression of OPN in hepatocytes appeared protective from early alcohol-induced liver injury whereas natural induction of OPN did not suffice to confer full protection and we previously showed that co-administration of m-OPN throughout the ethanol feeding period prevented alcohol-induced liver injury (19); next, we questioned whether treatment with m-OPN following the onset of chronic alcohol-induced liver injury in WT mice could have therapeutic potential. H&E staining (Fig. 7A) showed more inflammation, hepatocyte ballooning degeneration and steatosis (Fig. 7B) in ethanol plus BSA-treated than in ethanol plus m-OPN-treated mice. Furthermore, m-OPN lowered the increase in serum ALT activity (Fig. 7C) and in LPS (Fig. 7D) caused by ethanol. Collectively, these findings indicate that oral administration of m-OPN has therapeutic potential by lowering LPS hence preventing early alcohol-induced liver injury and steatosis.
Figure 7. Treatment with m-OPN rescues WT mice from alcohol-induced liver injury.
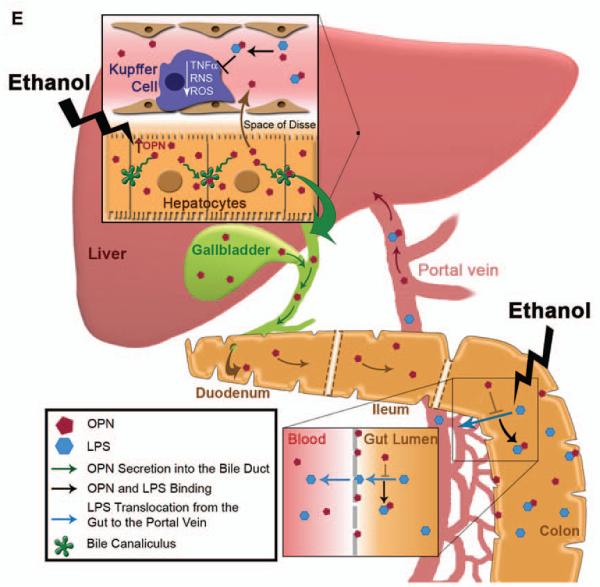
WT mice were fed either the control or the ethanol Lieber-DeCarli diet for 3 wks following which mice were given ethanol in combination with 200 μg/ml BSA or with m-OPN for 10 days. H&E staining shows micro- (yellow arrows) and macrovesicular (green arrows) steatosis by ethanol feeding plus BSA, which is partially prevented by treatment with m-OPN. PV: portal vein. CV: central vein (A). The scores for inflammation, hepatocyte ballooning degeneration and steatosis (B). Serum ALT activity (C) and LPS levels (D). n=6; •p<0.05 and ••p<0.01 for m-OPN vs BSA. Proposed mechanism: overexpression of OPN in hepatocytes under alcohol consumption contributes to enhance its secretion into the plasma and/or its excretion into the bile and feces to reach sufficient levels. The presence of OPN in feces blunts the increase in LPS translocation. This is also validated by oral treatment with m-OPN. Likewise, binding of OPN to LPS prevents macrophage infiltration and activation blocking the increase in TNFα, ROS and RNS; hence, lowering alcohol-induced liver injury and steatosis (E).
DISCUSSION
In this study we used the Lieber-DeCarli model of early alcohol-induced liver injury in WT, Opn−/− and OpnHEP Tg mice and the chronic-plus-single-binge ethanol feeding model for validation purposes. Alcohol consumption induced OPN expression in the liver and stimulated OPN secretion into the plasma more significantly in OpnHEP Tg than in WT mice. Importantly, we demonstrated for the first time that there is active excretion of OPN into the bile and feces, which was greater in ethanol-fed OpnHEP Tg than in WT mice suggesting that perhaps OPN excretion into the biliary system could target the gut (16). Thus, in this model and as expected, alcohol caused natural induction of OPN expression in WT mice and natural along with forced induction of OPN expression in OpnHEP Tg mice.
Next, we assessed if natural induction or natural induction plus OPN overexpression in hepatocytes could protect from early alcohol-induced liver damage. Overt steatosis and inflammation was found in alcohol-fed Opn−/− compared to WT whereas these events were completely blunted in OpnHEP Tg mice suggesting that natural induction plus forced overexpression of OPN in hepatocytes is necessary to protect from alcohol hepatotoxicity perhaps by secreting sufficient concentration of OPN into the plasma and/or by excreting OPN into the bile and feces to positively target the gut and as a result protect the liver.
In ALD, enhanced translocation of Gram-negative bacteria or of LPS itself from the gut into the portal circulation, leads to increased LPS levels and stimulates macrophages to produce ROS, RNS, TNFα and other pro-inflammatory mediators providing pivotal noxious effects on other liver cells and particularly on hepatocytes; hence, it is a central mechanism contributing to alcohol-induced liver injury (25, 26). Our study showed that serum LPS levels remained at baseline in ethanol-fed OpnHEP Tg but were elevated in WT and in Opn−/− mice and that hepatic Gram-negative bacteria 16S rRNA, an indicator of bacterial translocation, was lowest in ethanol-fed OpnHEP Tg mice compared to WT and Opn−/− mice. In addition, measurement of enteric Gram-negative bacteria 16S rDNA in feces demonstrated that the differences in serum LPS levels among mice likely resulted from translocation of LPS and enteric Gram-negative bacteria rather than from differences in bacterial growth. Furthermore, oral administration of m-OPN validated the ability of OPN to blunt serum and liver LPS in vivo.
Ethanol-fed OpnHEP Tg mice showed less F4/80+TNFα+ cells and were thus protected from liver damage. Since TNFα is a pro-inflammatory cytokine driving hepatocyte injury in ALD (27, 28), to determine whether the decrease in TNFα in ethanol-treated OpnHEP Tg mice also resulted from inability of LPS to activate macrophages, we analyzed if interaction between OPN and LPS could occur and as a result prevent downstream events participating in macrophage activation. Using several strategies, we demonstrated that binding of OPN to LPS occurs and proved that the protective effects of OPN were at least in part due to lower LPS binding to macrophages. LPS-induced macrophage activation was also limited by OPN since oxidative and nitrosative stress along with Tnfα mRNA and TNFα protein were lesser in macrophages co-treated with OPN and LPS than in those challenged with LPS alone. In aggregate, binding of OPN to LPS was protective by decreasing macrophage activation, ROS plus RNS generation and TNFα increase. Furthermore, oral administration of m-OPN prevented ethanol-induced liver injury and steatosis by decreasing LPS translocation and reducing its availability for macrophage activation.
The greatest impact of forced hepatocyte overexpression of OPN may be due to sustained lower LPS availability in the portal circulation either due to efficient OPN binding to LPS prior to translocation from the gut into the portal blood or to binding of portal OPN to LPS preventing subsequent macrophage activation in the liver. We believe that part of the mechanism whereby forced overexpression of OPN decreases steatosis is by its gut-liver actions preventing LPS translocation and its increase in portal blood. This, in turn, lowers macrophage infiltration and activation and blocks ROS, RNS and TNFα production, which protects the liver by blocking their pro-inflammatory and pro-steatotic effects (29, 30) (Figure 7E).
It is possible that the beneficial effects of OPN and in particular of secreted and/or excreted OPN may be time-dependent and localization-specific. Hence, the natural increase in intrahepatic OPN could be a compensatory mechanism in the early stages of alcohol-induced liver injury that may be impaired, insufficient to drive enough secretion and/or excretion of the protein into key biological compartments or fluids and/or delayed but that if restored or promoted may be protective over time perhaps by facilitating secretion into the plasma and/or excretion into the biliary system to target the gut-liver axis; however, this had never been proven before.
Although the conclusion from this study using a model of early alcohol-induced liver injury parallels findings from Lee et al (10), it may differ from those performed by others using a model of ASH (5, 7, 9), it is possible that zonation in the expression of OPN, gender differences, the existence of intrahepatic, secreted and/or excreted OPN fragments due to proteolysis, or the presence of OPN isoforms resulting from polymerization or post-translational modifications (i.e. phosphorylation and glycosylation) may account for the possible discrepancy. The use of Abs to target specific OPN cleavage products, to regulate OPN polymerization or to bind the modified OPN residues in vivo may provide useful information. This approach may be helpful to compare early versus late events during alcohol-mediated liver injury. Unfortunately, it is still unknown which specific OPN isoforms or post-translational modifications are present in the alcohol-injured liver and how they change or are physically distributed as disease progresses since careful protein residue enrichment and mass spectrometry analysis has not been carried out so far and simple IHC approaches do not suffice to address this enigma.
In summary, natural induction of OPN by ethanol in WT mice was inefficient to fully protect from alcohol-induced liver injury; however, natural induction along with forced overexpression of OPN in hepatocytes was visibly protective over time. Likewise, oral administration of m-OPN has therapeutic potential by lowering LPS. Due to limitations from the duration and the extent of liver injury from the Lieber-DeCarli and the chronic-plus-single-binge ethanol feeding models, the observations from this study can be associated largely with the early stages of ALD. It is possible that the beneficial effects may be dependent from the OPN levels in key biological compartments or fluids but they could be boosted as proposed here perhaps by using nutritional support. Indeed, OPN has been recently incorporated into infant formulas and a clinical trial to treat alcoholic hepatitis using bovine colostrum is under way. We suggest that the protective action of OPN could be due to its secretion into the plasma and/or its excretion into the bile and feces. Dynamic excretion to reach a sustained, sufficiently high and protective concentration of biliary and fecal OPN, while active in the early stages of alcohol-induced liver injury as shown here, could be impaired as disease progresses, and therefore re-establishment of optimal plasma, biliary and fecal OPN levels may be necessary to promote its immunomodulatory effects in the gut-liver axis.
Supplementary Material
Acknowledgment
The authors are very grateful to Drs. David T. Denhardt (Rutgers University, NJ) for his generous gift of the 2A1 Ab, Kang Chen (Mount Sinai School of Medicine, NY) for his assistance with the flow cytometry assays and Ning Wang (Department of Central Laboratory, Southwest Hospital, China) for her assistance in the binding experiments using the IAsys Plus System. We are also very thankful to all past and current members from the Nieto Laboratory for their helpful comments and suggestions throughout the course of this project.
Financial support
Short-term Bancaja Fellowship and Postdoctoral Fellowship from the Asociación Española para el Estudio del Hígado, Spain (E. A.). Postdoctoral Fellowship from the Government of Navarre, Spain (R. U.). US Public Health Service Grants 5 R01 DK069286, 2 R56 DK069286 and 3 R56 DK069286-06S1 from the National Institute of Diabetes and Digestive and Kidney Diseases (N. N). US Public Health Service Grants 5 P20 AA017067, 5 P20 AA017067-01S1, 5 P20 AA017067-03S1 and 1 U01 AA021887-01 from the National Institute on Alcohol Abuse and Alcoholism (N. N. and M. I. F.). The Danish Council for Independent Research (E. S. S.).
List of abbreviations
- ADH
alcohol dehydrogenase
- ALD
alcoholic liver disease
- ASH
alcoholic steatohepatitis
- BSA
bovine serum albumin
- CYP2E1
cytochrome P450 2E1
- H&E
hematoxylin and eosin
- IHC
immunohistochemistry
- IOD
integrated optical density
- IRS1
insulin receptor substrate-1
- LBP
lipopolysaccharide binding protein
- LDL
low-density lipoproteins
- LPS
lipopolysaccharide
- m-OPN*
biotinylated human milk osteopontin
- m-OPN
milk osteopontin
- OPN
osteopontin
- Opn−/−
osteopontin knockout mice
- OpnHEP Tg
transgenic mice overexpressing osteopontin in hepatocytes
- RNS
reactive nitrogen species
- rOPN
recombinant OPN
- ROS
reactive oxygen species
- TG
triglycerides
- TLR4
toll-like receptor-4
- TNFα
tumor necrosis factor-α
- VLDL
very low-density lipoproteins
- WT
wild-type
- αSMA
α-Smooth muscle actin
REFERENCES
- 1.Enomoto N, Takei Y, Hirose M, Ikejima K, Miwa H, Kitamura T, Sato N. Thalidomide prevents alcoholic liver injury in rats through suppression of Kupffer cell sensitization and TNF-alpha production. Gastroenterology. 2002;123:291–300. doi: 10.1053/gast.2002.34161. [DOI] [PubMed] [Google Scholar]
- 2.Enomoto N, Ikejima K, Yamashina S, Hirose M, Shimizu H, Kitamura T, Takei Y, et al. Kupffer cell sensitization by alcohol involves increased permeability to gut-derived endotoxin. Alcohol Clin Exp Res. 2001;25:51S–54S. doi: 10.1097/00000374-200106001-00012. [DOI] [PubMed] [Google Scholar]
- 3.Wang KX, Denhardt DT. Osteopontin: role in immune regulation and stress responses. Cytokine Growth Factor Rev. 2008;19:333–345. doi: 10.1016/j.cytogfr.2008.08.001. [DOI] [PubMed] [Google Scholar]
- 4.Patouraux S, Bonnafous S, Voican CS, Anty R, Saint-Paul MC, Rosenthal-Allieri MA, Agostini H, et al. The osteopontin level in liver, adipose tissue and serum is correlated with fibrosis in patients with alcoholic liver disease. PLoS One. 2012;7:e35612. doi: 10.1371/journal.pone.0035612. [DOI] [PMC free article] [PubMed] [Google Scholar]
- 5.Morales-Ibanez O, Dominguez M, Ki SH, Marcos M, Chaves JF, Nguyen-Khac E, Houchi H, et al. Human and experimental evidence supporting a role for osteopontin in alcoholic hepatitis. Hepatology. 2013 doi: 10.1002/hep.26521. [DOI] [PMC free article] [PubMed] [Google Scholar]
- 6.Banerjee A, Rose R, Johnson GA, Burghardt RC, Ramaiah SK. The influence of estrogen on hepatobiliary osteopontin (SPP1) expression in a female rodent model of alcoholic steatohepatitis. Toxicol Pathol. 2009;37:492–501. doi: 10.1177/0192623309335633. [DOI] [PubMed] [Google Scholar]
- 7.Banerjee A, Apte UM, Smith R, Ramaiah SK. Higher neutrophil infiltration mediated by osteopontin is a likely contributing factor to the increased susceptibility of females to alcoholic liver disease. J Pathol. 2006;208:473–485. doi: 10.1002/path.1917. [DOI] [PubMed] [Google Scholar]
- 8.Banerjee A, Lee JH, Ramaiah SK. Interaction of osteopontin with neutrophil alpha(4)beta(1) and alpha(9)beta(1) integrins in a rodent model of alcoholic liver disease. Toxicol Appl Pharmacol. 2008;233:238–246. doi: 10.1016/j.taap.2008.08.008. [DOI] [PubMed] [Google Scholar]
- 9.Apte UM, Banerjee A, McRee R, Wellberg E, Ramaiah SK. Role of osteopontin in hepatic neutrophil infiltration during alcoholic steatohepatitis. Toxicol Appl Pharmacol. 2005;207:25–38. doi: 10.1016/j.taap.2004.12.018. [DOI] [PubMed] [Google Scholar]
- 10.Lee JH, Banerjee A, Ueno Y, Ramaiah SK. Potential relationship between hepatobiliary osteopontin and peroxisome proliferator-activated receptor alpha expression following ethanol-associated hepatic injury in vivo and in vitro. Toxicol Sci. 2008;106:290–299. doi: 10.1093/toxsci/kfn165. [DOI] [PMC free article] [PubMed] [Google Scholar]
- 11.Urtasun R, Lopategi A, George J, Leung TM, Lu Y, Wang X, Ge X, et al. Osteopontin, an oxidant stress sensitive cytokine, up-regulates collagen-I via integrin alpha(V)beta(3) engagement and PI3K/pAkt/NFkappaB signaling. Hepatology. 2012;55:594–608. doi: 10.1002/hep.24701. [DOI] [PMC free article] [PubMed] [Google Scholar]
- 12.Sahai A, Malladi P, Melin-Aldana H, Green RM, Whitington PF. Upregulation of osteopontin expression is involved in the development of nonalcoholic steatohepatitis in a dietary murine model. Am J Physiol Gastrointest Liver Physiol. 2004;287:G264–273. doi: 10.1152/ajpgi.00002.2004. [DOI] [PubMed] [Google Scholar]
- 13.Ashkar S, Weber GF, Panoutsakopoulou V, Sanchirico ME, Jansson M, Zawaideh S, Rittling SR, et al. Eta-1 (osteopontin): an early component of type-1 (cell-mediated) immunity. Science. 2000;287:860–864. doi: 10.1126/science.287.5454.860. [DOI] [PubMed] [Google Scholar]
- 14.Heilmann K, Hoffmann U, Witte E, Loddenkemper C, Sina C, Schreiber S, Hayford C, et al. Osteopontin as two-sided mediator of intestinal inflammation. J Cell Mol Med. 2009;13:1162–1174. doi: 10.1111/j.1582-4934.2008.00428.x. [DOI] [PMC free article] [PubMed] [Google Scholar]
- 15.da Silva AP, Ellen RP, Sorensen ES, Goldberg HA, Zohar R, Sodek J. Osteopontin attenuation of dextran sulfate sodium-induced colitis in mice. Lab Invest. 2009;89:1169–1181. doi: 10.1038/labinvest.2009.80. [DOI] [PubMed] [Google Scholar]
- 16.Da Silva AP, Pollett A, Rittling SR, Denhardt DT, Sodek J, Zohar R. Exacerbated tissue destruction in DSS-induced acute colitis of OPN-null mice is associated with downregulation of TNF-alpha expression and non-programmed cell death. J Cell Physiol. 2006;208:629–639. doi: 10.1002/jcp.20701. [DOI] [PubMed] [Google Scholar]
- 17.Rollo EE, Denhardt DT. Differential effects of osteopontin on the cytotoxic activity of macrophages from young and old mice. Immunology. 1996;88:642–647. doi: 10.1046/j.1365-2567.1996.d01-691.x. [DOI] [PMC free article] [PubMed] [Google Scholar]
- 18.Schack L, Lange A, Kelsen J, Agnholt J, Christensen B, Petersen TE, Sorensen ES. Considerable variation in the concentration of osteopontin in human milk, bovine milk, and infant formulas. J Dairy Sci. 2009;92:5378–5385. doi: 10.3168/jds.2009-2360. [DOI] [PubMed] [Google Scholar]
- 19.Ge X, Lu Y, Leung TM, Sorensen ES, Nieto N. Milk osteopontin, a nutritional approach to prevent alcohol-induced liver injury. Am J Physiol Gastrointest Liver Physiol. 2013;304:G929–939. doi: 10.1152/ajpgi.00014.2013. [DOI] [PMC free article] [PubMed] [Google Scholar]
- 20.Mochida S, Yoshimoto T, Mimura S, Inao M, Matsui A, Ohno A, Koh H, et al. Transgenic mice expressing osteopontin in hepatocytes as a model of autoimmune hepatitis. Biochem Biophys Res Commun. 2004;317:114–120. doi: 10.1016/j.bbrc.2004.02.180. [DOI] [PubMed] [Google Scholar]
- 21.Fouts DE, Torralba M, Nelson KE, Brenner DA, Schnabl B. Bacterial translocation and changes in the intestinal microbiome in mouse models of liver disease. J Hepatol. 2012;56:1283–1292. doi: 10.1016/j.jhep.2012.01.019. [DOI] [PMC free article] [PubMed] [Google Scholar]
- 22.Bala S, Marcos M, Kodys K, Csak T, Catalano D, Mandrekar P, Szabo G. Up-regulation of microRNA-155 in macrophages contributes to increased tumor necrosis factor {alpha} (TNF{alpha}) production via increased mRNA half-life in alcoholic liver disease. J Biol Chem. 2011;286:1436–1444. doi: 10.1074/jbc.M110.145870. [DOI] [PMC free article] [PubMed] [Google Scholar]
- 23.Gobejishvili L, Barve S, Joshi-Barve S, Uriarte S, Song Z, McClain C. Chronic ethanol-mediated decrease in cAMP primes macrophages to enhanced LPS-inducible NF-kappaB activity and TNF expression: relevance to alcoholic liver disease. Am J Physiol Gastrointest Liver Physiol. 2006;291:G681–688. doi: 10.1152/ajpgi.00098.2006. [DOI] [PubMed] [Google Scholar]
- 24.Yu H, Ha T, Liu L, Wang X, Gao M, Kelley J, Kao R, et al. Scavenger receptor A (SR-A) is required for LPS-induced TLR4 mediated NF-kappaB activation in macrophages. Biochim Biophys Acta. 2012;1823:1192–1198. doi: 10.1016/j.bbamcr.2012.05.004. [DOI] [PMC free article] [PubMed] [Google Scholar]
- 25.Nieto N. Oxidative-stress and IL-6 mediate the fibrogenic effects of [corrected] Kupffer cells on stellate cells. Hepatology. 2006;44:1487–1501. doi: 10.1002/hep.21427. [DOI] [PubMed] [Google Scholar]
- 26.Bode C, Bode JC. Activation of the innate immune system and alcoholic liver disease: effects of ethanol per se or enhanced intestinal translocation of bacterial toxins induced by ethanol? Alcohol Clin Exp Res. 2005;29:166S–171S. doi: 10.1097/01.alc.0000189280.19073.28. [DOI] [PubMed] [Google Scholar]
- 27.Tsukamoto H. Redox regulation of cytokine expression in Kupffer cells. Antioxid Redox Signal. 2002;4:741–748. doi: 10.1089/152308602760598882. [DOI] [PubMed] [Google Scholar]
- 28.Brock RW, Lawlor DK, Harris KA, Potter RF. Initiation of remote hepatic injury in the rat: interactions between Kupffer cells, tumor necrosis factor-alpha, and microvascular perfusion. Hepatology. 1999;30:137–142. doi: 10.1002/hep.510300132. [DOI] [PubMed] [Google Scholar]
- 29.Gao B. Hepatoprotective and anti-inflammatory cytokines in alcoholic liver disease. J Gastroenterol Hepatol. 2012;27(Suppl 2):89–93. doi: 10.1111/j.1440-1746.2011.07003.x. [DOI] [PMC free article] [PubMed] [Google Scholar]
- 30.Zhao XJ, Dong Q, Bindas J, Piganelli JD, Magill A, Reiser J, Kolls JK. TRIF and IRF-3 binding to the TNF promoter results in macrophage TNF dysregulation and steatosis induced by chronic ethanol. J Immunol. 2008;181:3049–3056. doi: 10.4049/jimmunol.181.5.3049. [DOI] [PMC free article] [PubMed] [Google Scholar]
Associated Data
This section collects any data citations, data availability statements, or supplementary materials included in this article.


