

Abstract
Advances in nanotechnology and microfluidics are enabling the analysis of small amounts of human cells. We tested whether recently developed micro-nuclear magnetic resonance (μNMR) technology could be leveraged for diagnosing pulmonary malignancy using fine needle aspirate (FNA) of primary lesions and/or peripheral blood samples. We enrolled a cohort of 35 patients referred for CT biopsy of primary pulmonary nodules, liver or adrenal masses and concurrently obtained FNA and peripheral blood samples. FNA sampling yielded sufficient material for μNMR analysis in 91% of cases and had a sensitivity and specificity of 91.6 and 100% respectively. Interestingly, among blood samples with positive circulating tumor cells (CTC), μNMR analysis of each patient's peripheral blood led to similar diagnosis (malignant vs benign) and differential diagnosis (lung malignancy subtype) in 100% and 90% (18/20) of samples, respectively. μNMR appears to be valuable, non-invasive adjunct in the diagnosis of lung cancer.
Keywords: Bioorthogonal click chemistry, Circulating Tumor Cell, μNMR, Iron-oxide nanoparticles, Point of care diagnosis
Introduction
Lung cancer is among the most common and fatal cancers worldwide. In 2013, over 225,000 new cases and159,000 deaths are estimated to occur in the US alone1. While most patients are currently treated with a combination of surgery, radiation and chemotherapy, novel therapies are emerging for specific lung cancer subtypes2-4. Both treatment initiation and confirmation of recurrence commonly rely on primary tissue sampling occurring through bronchoscopy or CT guided lung biopsy. Either approach yields small cores of tissue which are embedded, sectioned and then stained for immunohistochemistry. Percutaneous core biopsies with 17-19G coaxial needles, however, confer morbidity and throughput is generally low 5,6.
Alternative sources of malignant cells for diagnostic and molecular testing include peripheral blood (circulating tumor cells or CTC) 7-9, pleural fluid (thoracentesis) and fine needle aspirates (FNA). While these cells are attainable through less invasive measures, their challenges include their scant nature10-12, limited viability, epithelial-to-mesenchymal transition (EMT) 13 and heterogeneous protein expression levels. CTC are rare (∼1-100 cells/mL of blood)11,14, while a single FNA pass often yields < 200 cells depending on technique 12. Irrespective of the source and method, malignant cells are outnumbered by co-existing host cells from blood and tissue samples (immune cells, mesothelial cells, fibroblast).
Advances in nanotechnology and microfluidics have expanded the feasibility of molecular analyses using limited clinical specimens. A spectrum of new methods have appeared 15,16 varying in throughput, accuracy and ease of use. We have recently developed a μNMR approach that allows profiling of fine needle aspirates 12,17, exosomes 18, and potentially individual cells 19 across the spectrum of solid tumors. The method is fast, accurate and applicable in a point of care setting. To inaugurate testing of our technology for pulmonary malignancies, we enrolled 35 patients referred for biopsies of primary lung lesions or their potential liver or adrenal metastases. We then compared our FNA and CTC analyses to conventional pathology interpretation of each patient's core biopsy (Figure. 1). We show that our method is accurate and when combined with CTC analysis, could potentially avoid the need for core biopsies.
Figure 1. Study outline.
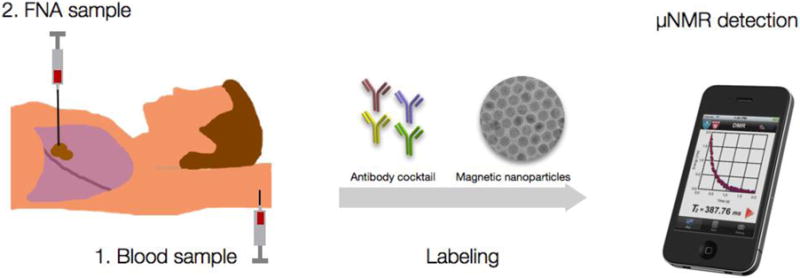
Patients were consented for a peripheral blood sample prior to the procedure as well as an FNA sample during a routine CT guided lung biopsy. Aliquots of samples were incubated with either TCO-modified antibody cocktails (quad, cocktail) or single, specific antibodies. After washing, antibodies were revealed with magnetic nanoparticles detected by μNMR.
Methods
Patient population and analysis
The study was approved by the Institutional Review Board, and the procedures followed were in accordance with institutional guidelines. Informed consent was obtained from all subjects. Thirty-five subjects requiring biopsy were enrolled in this study. Thirty-two of them had pulmonary nodules that required tissue diagnosis, while 3 had known primary lung cancer with suspected adrenal (2) or liver (1) metastases. On the day of enrollment, both peripheral blood (7 mL) and fine needle aspirates from intraparenchymal masses were collected from each subject. Five clinicians (M.P., A.S., C.M.C, J.A.S. and R.W.), reviewed the documented clinical, imaging, and pathology data for each subject with cancer. Tables 1 and 2 summarize the different cohorts used for analyses.
Table 1. Overview of patient population.
| Characteristic | Number | Percentage |
|---|---|---|
| Number of patients | 35 | |
| Age | ||
| Median | 70.5 | |
| Range | 21-87 | |
| Gender | ||
| Male | 21 | 60 |
| Female | 14 | 40 |
| Primary Lung Cancer | 24 | 68.6 |
| Tumor Subtypes | ||
| Adenocarcinoma | 17 | 48.6 |
| Squamous Cell Carcinoma | 4 | 11.4 |
| Large Cell Carcinoma | 1 | 2.9 |
| Small Cell Carcinoma (SCLC) | 2 | 5.7 |
| Stage | ||
| IA | 4 | 11.4 |
| IB | 3 | 8.6 |
| IIA | 1 | 2.9 |
| IIB | 4 | 11.4 |
| IIIA | 2 | 5.7 |
| IIIB | 0 | 0 |
| IV | 8 | 22.9 |
| Limited Stage SCLC | 2 | 5.7 |
| Advanced Stage SCLC | 0 | 0 |
| Lung Metastases | 7 | 20 |
| Melanoma | 4 | 11.4 |
| Renal Cell Carcinoma | 1 | 2.9 |
| Ewing's Sarcoma | 1 | 2.9 |
| Unknown Primary | 1 | 2.9 |
| Benign Lesions | 4 | 11.4 |
Table 2. Detailed patient information.
The table shows patients' clinical information and whether FNA and blood were obtained from each patient (last 2 columns). FNA samples from three patients (pts 4, 6 and 12) were acellular; with not enough material to proceed with DMR. All patient had pulmonary nodules or masses ranging from 0.7 -9.0 cm in diameter. There were 17 adenocarcinomas, 4 squamous cell carcinoma, 2 small cell carcinomas, 1 large cell carcinoma, 7 metastases and 4 benign nodules.
| # | Pathology | Sex | Age | Diameter | Stage | FNA | Blood |
|---|---|---|---|---|---|---|---|
| 1 | Adeno | Female | 69 | 2.6 cm | IIB | yes | yes |
| 2 | Adeno | Female | 71 | 3.0 cm | IIB | yes | yes |
| 3 | Adeno | Female | 71 | 1.2 cm | IA | yes | yes |
| 4 | Adeno | Female | 75 | 0.7 cm | IV | acellular | yes |
| 5 | Adeno | Female | 70 | 4.7 cm | IV | yes | yes |
| 6 | Adeno | Female | 67 | 2.8 cm | IV | acellular | yes |
| 7 | Adeno | Male | 56 | 2.3 cm | IA | yes | yes |
| 8 | Adeno | Male | 71 | 8.2 cm | IIIA | yes | yes |
| 9 | Adeno | Male | 74 | 1.9 cm | IV | yes | yes |
| 10 | Adeno | Male | 73 | 6.4 cm | IV | yes | yes |
| 11 | Adeno | Female | 77 | 1.0 cm | IA | yes | yes |
| 12 | Adeno | Male | 78 | 3.7 cm | IIB | acellular | yes |
| 13 | Adeno | Male | 87 | 2.4 cm | IIIA | yes | yes |
| 14 | Adeno | Male | 58 | 2.4 cm | IA | yes | yes |
| 15 | Adeno | Female | 47 | 4.2 cm | IIA | yes | yes |
| 16 | Adeno | Male | 57 | 3.5 cm | IB | yes | yes |
| 17 | Adeno | Male | 65 | 2.0 cm | IV | yes | yes |
| 18 | Squamous | Male | 75 | 5.0 cm | IV | yes | yes |
| 19 | Squamous | Male | 64 | 2.2 cm | IB | yes | yes |
| 20 | Squamous | Male | 75 | 3.2 cm | IB | yes | yes |
| 21 | Squamous | Female | 81 | 2.0 cm | IV | yes | yes |
| 22 | Small | Female | 81 | 3.2 cm | Limited Stage | yes | yes |
| 23 | Small | Female | 73 | 2.0 cm | Limited Stage | yes | yes |
| 24 | Large | Male | 54 | 6.5 cm | IIB | yes | yes |
| 25 | Met | Male | 73 | 1.7 cm | IV | yes | yes |
| 26 | Met | Male | 78 | 3.1 cm | IV | yes | yes |
| 27 | Met | Female | 43 | 2.0 cm | IV | yes | yes |
| 28 | Met | Male | 65 | 1.9 cm | IV | no | yes |
| 29 | Met | Male | 70 | 4.3 cm | IV | yes | yes |
| 30 | Met | Male | 21 | 1.2 cm | Metastatic | yes | yes |
| 31 | Met | Female | 78 | 2.3 cm | IV | yes | yes |
| 32 | Benign | Male | 68 | 4.9 cm | yes | yes | |
| 33 | Benign | Male | 78 | 2.3 cm | no | yes | |
| 34 | Benign | Female | 59 | 1.4 cm | yes | yes | |
| 35 | Benign | Male | 66 | 2.2 cm | yes | yes |
Selection of biomarkers
Detection of malignancy
We used a previously identified cocktail of four (quad) markers (EGFR, EpCAM, HER-2, MUC-1) for CTC detection, as the combined application of these markers allows more accurate CTC counting than a single marker (EpCAM) based detection 20. Subclassification of lung cancer: we selected clinically relevant markers used in differentiating subytpes of lung cancer: adenocarcinoma (TTF1, Napsin A), squamous cell carcinoma (p40), small cell carcinoma (a cocktail of Synaptophysin + Chromogranin). Table 3, Figure S1 and Figure S2 show the markers, antibodies, and diagnostic algorithm used for the detection of cancer and differentiation of lung cancer subtypes.21-24.
Table 3. Molecular markers used for diagnosis and sub-typing.
The quad marker test was used to determine if a malignancy was present. The quad marker contains four antibodies against common tumor markers (EGFR, EpCAM, MUC-1 and Her2). Adenocarcinoma was identified by positivity for TTF-1 and/or Napsin A. Squamous cell carcinoma was identified by positivity of p40. Small cell lung cancer was diagnosed by a positive signature for synaptophysin and/or chromogranin. Large cell carcinoma and metastasis were negative for all lung cancer specific panel of markers (TTF-1, Napsin A, p40, synaptophysin, chromogranin).
| Category | Question | Quad EGFR + EpCAM + Muc + Her2 |
TTF1 | Napsin A | p40 | Cocktail Synaptophysin + Chromogranin |
|---|---|---|---|---|---|---|
| Malignancy | Malignant | + | ||||
| Benign | - | |||||
| Primary | Lung | + | + | |||
| Met | + | - | ||||
| Type | Adenocarcinoma | + | + | + | +/- | - |
| Squamous cell | + | - | - | + | - | |
| Small cell carcinoma | + | +/- | - | - | + | |
| Large cell carcinoma or metastasis | + | - | - | - | - |
Sample processing and labeling
Each peripheral blood sample (7 ml) was lysed and the cell pellet resuspended in buffer (100 μl of 1X PBS/1% FBS). FNA samples were fixed as described previously 12. For molecular profiling experiments of both blood and FNA specimens, primary antibodies were separately added to aliquots of parent samples. Cell pellets were incubated for 20 minutes. TCO-modified secondary IgG antibodies (10 μg/ml) were then added to the pellet and incubated for 20 minutes. Cell pellets were then washed twice with 1 × phosphate buffered saline (PBS) and incubated with magnetic nanoparticles (100 nM Tz-CLIO) for 10 minutes. Excess Tz-CLIO was removed by washing the pellet twice with 1XPB, before being resuspended in 20 μl of 1XPBS for μNMR measurements. Fluorescent images were taken for visualization of CTCs using EasySep™ enrichment method. CTCs were isolated using the FITC Positive Selection kit (STEMCELL Technologies Inc). Cells were labeled with antibodies against EPCAM, EFGR, Her-2 and Muc and targeted with FITC-conjugated antibodies and dextran-coated magnetic nanoparticles. Labeled CTCs are separated using an EasySep™ magnet. All labeling experiments were performed at room temperature.
Preparation of transcyclooctene (TCO)-modified antibodies
Monoclonal antibodies against targets were used for the primary labeling of antigens (Table S1). To enhance the labeling efficiency, TCO modification of antibodies were performed on secondary IgG antibodies instead of primary antibodies, (i.e. primary antibodies were incubated with cells per manufacturer's protocol). Secondary IgG antibodies were conjugated with (E)-cyclooct-4-enyl 2,5-dioxopyrrolidin-1-yl carbonate (TCO-NHS), as previously reported20,25,26,26,27. TCO-conjugation was performed with 0.5 mg of mouse or rabbit IgG antibody in the presence of 1000 equivalents of TCO-NHS in phosphate-buffered saline (PBS) and 10% dimethylformamide at room temperature for 3 hours. Unreacted TCO-NHS was subsequently washed using 2 ml of Zeba desalting columns (Thermo Fisher, Rockford, IL), and antibody concentrations were determined by absorbance measurement.
Preparation of tetrazine (Tz)-modified nanoparticles
Cross-linked iron oxide (CLIO) nanoparticles were prepared as previously discussed 26. Briefly, Tz-modified nanoparticles were synthesized by reacting NH2-MNPs with 500 equivalents of 2,5-dioxopyrrolidin-1-yl 5-(4-(1,2,4,5-tetrazin-3-yl)benzylamino)-5-oxopentanoate (Tz-NHS). The reaction was carried out in PBS/5% dimethylformamide at room temperature for 3 hours, as previously described 20,26,27. Excess Tz-NHS was removed by gel filtration using Sephadex G-50 (GE Healthcare, Pittsburgh, PA).
μNMR measurements
The μNMR technology and magnetic nanoparticle labeling have been extensively tested in cell lines 17,20,26, mouse models of cancer 17 and in clinical samples 12,20,28,29. Moreover, the performance μNMR for cancer detection was compared to gold standard method (CellSearch) 20. In the present study, sample labeling and μNMR measurements (Figure 1) were performed as previously optimized 20,26. The transverse relaxation rates (R2) were determined in an effective sample volume of 1μL. μNMR measurements and analysis of cellular expression were performed as previously descried 20. Briefly, the following Carr-Purcell-Meiboom-Gill pulse sequences were used: echo time, 4 ms; repetition time, 6 s; number of 180° pulses per scan, 500; number of scans, 8. R2 values from samples were subtracted from those of PBS buffer to calculate ΔR2. The ΔR2 of samples were normalized to ΔR2 obtained from negative control to account for background signal. Negative controls for each sample were prepared similarly to the test samples without inclusion of the antibody incubation step. For each sample, measurement was done three times and the average value was obtained for analysis.
Results
FNA yield sufficient numbers of cells for analysis
Table 1 summarizes the enrolled patient cohort consisting of consecutive patients referred for CT guided biopsy of lung lesions or suspected lung cancer metastases in the adrenal glands or liver, and who consented to participate in the study. Table 2 summarizes the different cohorts and final pathologic diagnosis. Just before each procedure and on the same day peripheral blood was drawn for CTC analysis.
Following placement of the co-axial needle by CT guidance, 3-5 FNA passes were placed in saline from each lesion (Figure 1). Samples were incubated with TCO-modified antibodies for key marker proteins (Table 3) revealed by bioorthogonal reactions using magnetic nanoparticles and μNMR analysis. Figure 2 summarizes the yields of total and malignant cell number for each specimen. In two of the 35 patients, the biopsy procedure was aborted due to medical reasons, leaving 33 patients for analysis. Overall, the attained specimens were sufficient for μNMR analysis in 30 of the 33 patients (91 %) yielding an average of 1900 cancer cells per patient. In 3 patients, insufficient numbers of FNA cells were noted after the procedure.
Figure 2. Obtaining cells from fine needle aspirates (FNA).
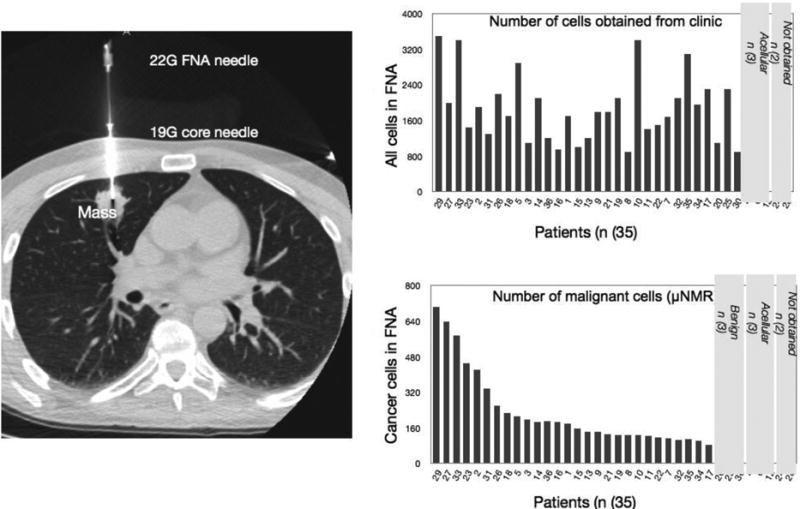
Left: Representative example showing CT guided placement of a 20G coaxial needle within a nodule in the middle lobe of the right lung. Right, top: Total number of cells harvested via FNA. Right bottom: Number of cancer cells (quad positive) harvested by FNA sampling.
DMR analyses are accurate in establishing subtypes
To establish the diagnosis of malignancy, we used a cocktail of 4 antibodies (EGFR, MUC, Her2, EpCAM, collectively known as the “Quad marker”). Indeed, this signature is more sensitive than EpCAM alone for diagnosing epithelial malignancies 20,25,12. Differentiating between different subtypes of primary lung cancer and lung metastases was based on the expression levels of key and validated proteins (TTF-1, napsin A, synaptophysin, chromogranin, p40; Table 3) 21-24.
Figure 3 summarizes the FNA profiles across the 30 patients with sufficient FNA material available for analyses. The quad marker was positive (i.e. μNMR+ diagnosis = malignant) in all 27 cancer patients, including in lung cancer patients with stage 1 disease with a primary tumor as small as 0.7 cm. μNMR finding was negative in 3 patients with benign nodules and in 12 peripheral blood samples obtained from healthy individuals. TTF-1 and/or napsin A were positive in all adenocarcinomas, while p40 was positive in the four squamous call cancers. Altogether, FNA analysis by μNMR showed excellent concordance with conventional histopathology, both for establishing overall diagnoses and differential diagnoses (Figure 3). Table 4 summarizes the sensitivity, specificity and predictive values of μ-NMR analyses.
Figure 3. μNMR analysis of FNA samples.
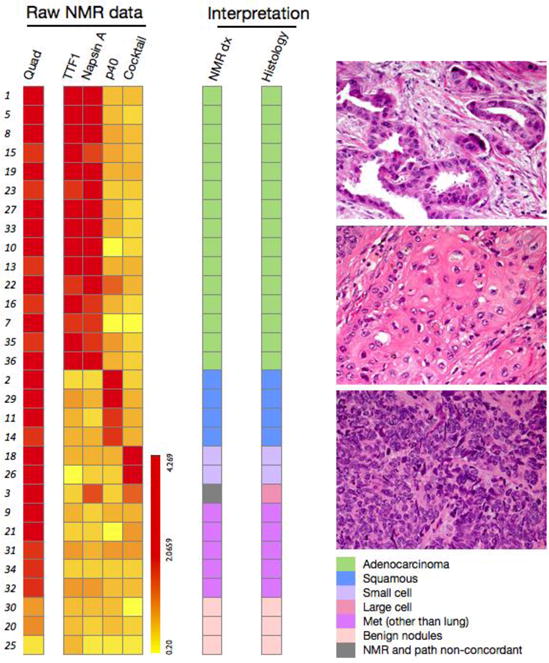
Left: Raw μNMR data for the different biomarkers tested. Analysis of the different biomarkers into histologic types shows good agreement between μNMR and conventional histology (from surgical samples or core biopsies). All malignant and benign masses were correctly classified. Right: Histology images of lung cancer subtypes. Top: Lung adenocarcinoma exhibiting gland-forming malignant cells. Middle: Moderately differentiated squamous cell carcinoma demonstrating a nest of polygonal cells with eosinophilic cytoplasm and intercellular bridges. Bottom: Small cell carcinoma characterized by nests of malignant cells with a high nuclear cytoplasmic ratio, prominent apoptosis and mitotic activity. All images were obtained at 400X magnification.
Table 4. Diagnostic accuracy of μNMR.
Data are shown separately for FNA analysis of primary lung lesions and for CTC analysis. Note that calculations are based on all samples, including those with insufficient material for DMR processing (thus the overall reported sensitivity is reduced).
| FNA (n = 33) | CTC (n = 35) | |
|---|---|---|
| Sensitivity | 22/24 (91.6%) | 20/24 (83.3%) |
| Specificity | 8/8 (100%) | 11/11 (100%) |
| PPV | 22/22 (100% | 20/20 (100%) |
| NPV | 8/10 (80%) | 11/15 (73.3%) |
| Total samples for analysis | 33 | 35 |
| Not enough cells | 3 | |
| True neg | 8 | 11 |
| False neg | 2 | 4 |
| True pos (“lung” cancer cases) | 22 | 20 |
| False pos | 0 | 0 |
CTC and FNA analyses are concordant
We next explored whether CTC analyses could be performed in the same patient cohort described above. Peripheral blood analyses from 35 patients demonstrated, on average, 38 CTC per patient (7ml blood) with proven malignancy (Figure 4). There were 11 true negative (i.e. diagnosis of negative for lung malignancy based on gold standard and μNMR- finding for CTC), four false negative (i.e. diagnosis of positive for lung malignancy based on gold standard but μNMR- finding for CTC) and zero false positive samples (Table 4). The overall sensitivity for detecting lung cancer in blood was 83.3% with the specificity of 100% (Table 4). We noted good correlation between lung cancer biomarkers across CTC and FNA (r2=0.83). Using patient by patient analyses, we then asked whether peripheral blood analysis could have obviated a lung biopsy. In 70% of the patient population, CTC were positive while 20% displayed FNA positive / CTC negative profiles, and 10% were negative for both CTC and FNA (Figure 4).
Figure 4. Analysis of circulating cancer cells.
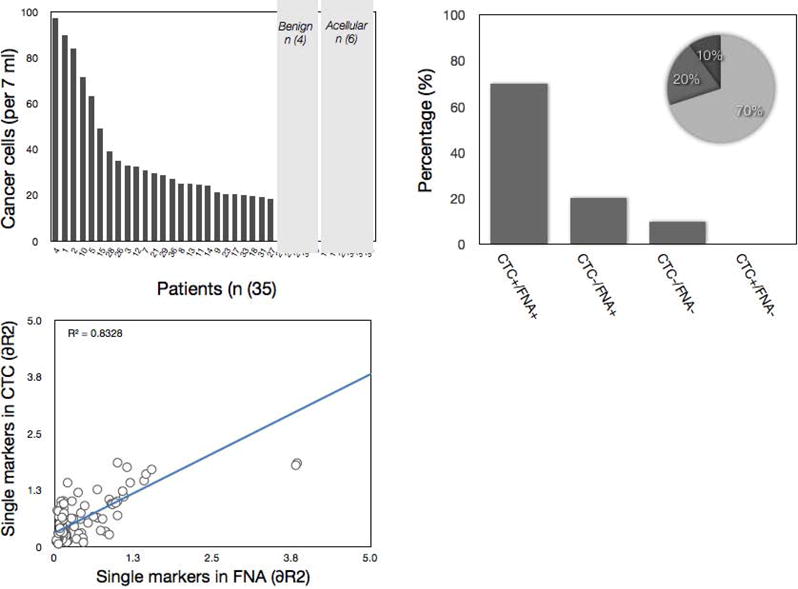
Quad-NMR analysis of peripheral blood samples showed variable numbers of CTC. In 71% of all cases with positive FNA, there were also CTC present. CTC were negative in 19% of positive FNA samples. There was a correlation between circulating cancer cells and number of cancer cells harvested by FNA analysis (r2 = 0.83).
Differential diagnosis of CTC samples
Since the same differential diagnostic markers can be applied to CTC, we next determined whether such analyses could establish the primary tumor type based on blood sample alone (Figure 5). Our data indicate that CTC analyses correctly identified histologic subtypes in 18 of 20 patients (90%) with available matched samples.
Figure 5. Differential diagnosis of CTC.
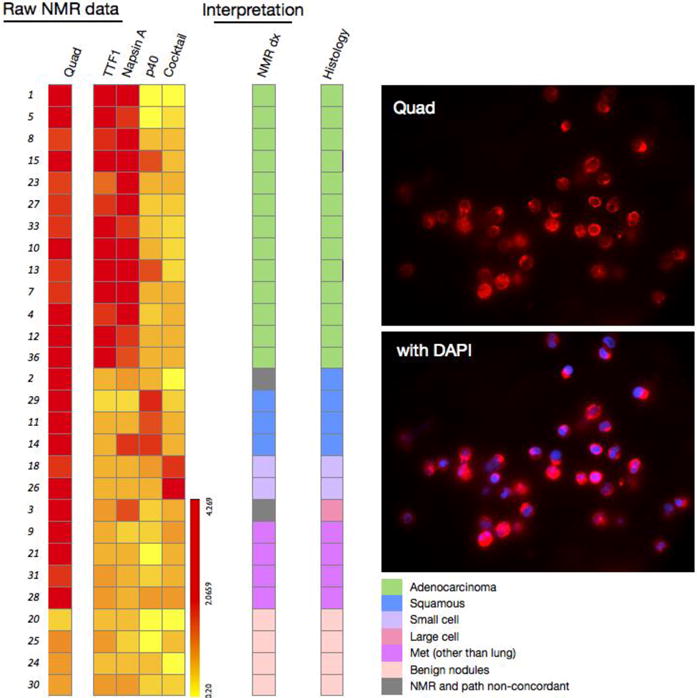
Left: raw μNMR data for the different biomarkers tested in CTC. Analysis of the different biomarkers into histologic types shows reasonable agreement in over 85% of cases. Right: fluorescent images of quad marker labeling of CTC (top) and CTC and DAPI staining (bottom). Fluorescent images were obtained at 40X magnification.
Discussion
Advances in nanotechnology, microfabrication and chemistries have catalyzed miniaturized diagnostic platforms to potentially analyze scant clinical specimens. Success here would potentially reduce the morbidity associated with more invasive procedures, improve cost effectiveness through efficient use of reagents and time, allow for serial testing to tailor treatments, and promote point of care testing. There are two generic approaches: I) methods to isolate and purify malignant cells for subsequent analysis 7,30 and II) methods that allow direct measurements without the need for purification12,19. Each analytical approach has its unique advantages and applications in the clinical workflow. For any method to succeed it must be accurate, reproducible, fast and cost-effective. In particular, methods that allow real-time feedback would be highly advantageous to guide decisions during interventional procedures.
Here we leveraged the benefits of μNMR to analyze clinically accessible samples. The approach has a number of advantages including fast turn around, high sensitivity and readouts without need for lengthy purification. The technology has previously been optimized for FNA analyses of abdominal malignancies12, CTC20 and exosome analyses18. The current study capitalized on some of the previously established malignancy markers (notably the quad signature of EpCAM, EGFR, Muc1 and Her2)12 but also added clinically relevant differential diagnostic markers of lung cancers (napsin A, p40, TTF-1, synaptophysin and chromgranin; Table 3) 21-24.
Our results show that point-of-care, operator-independent μNMR protein analysis of patient-derived FNA and peripheral blood samples is highly accurate in identifying the presence and establishing the type of lung malignancy. Achieving this in peripheral blood and/or limited biopsies can lead to a shift in the current standard of practice, with peripheral blood analysis preceding any invasive procedure, and FNA acquisition replacing the need of a more invasive core biopsy.
While the current results are very encouraging, we did not explore all potential aspects in this feasibility study. For example did not test for specific mutations to inform eligibility for molecular drug treatments (e.g. EGFR or Alk translocations) but such assays could be easily established through use of TCO labeled antibodies 27 (or other affinity ligands) with sufficient specificity. Second, the μNMR method used here is based on read-outs of bulk samples (requiring ∼ 50 cells depending on target and antibodies) and is not a single cell profiling technology. For the latter, alternative approaches such as μHall sensors 19 or others could be used31. While not tested here, the μNMR method is capable of broader genetic analyses as recently demonstrated for bacterial profiling32,33. It is conceivable to integrate such testing with antibody approaches on the same chip platform. Finally, we did not test the method with bronchoscopy specimens although we would expect similar results given the typical cell numbers that are harvested 34. Similarly, we expect that the method could be used for analyses of other clinically relevant samples such as pleural fluid 35.
The current data justifies future lung cancer focused studies to further develop the technology and inform preclinical and early phase drug testing. We anticipate the use of additional markers to accompany diagnostic panels by leveraging the advanced multiplexing capabilities of digital NMR technology. Attaining lung cancer subtype information along with any actionable molecular alterations rapidly (∼1 hour) and at the point-of-care can help streamline the clinical research process. Same visit readouts can help initiate treatment strategies (e.g. selecting targeted therapies if adenocarcinoma versus chemotherapy if squamous cell) and promptly identify resistance markers to alter treatment course. Coupled with CTC as surrogates to invasive core biopsies, as demonstrated here, there is also strong potential for cost effective and safety advantages. Point-of-care μNMR lung cancer cell analyses could thus function as a peripheral window into each individual's underlying biology and help meet the goals of precision medicine in this prevalent and often lethal disease.
Supplementary Material
Figure S1: Algorithm used in identification and sub classification of lung cancer samples using μNMR technology.
Figure S2: ROC analysis on Quad marker. Quad marker levels on CTC in the peripheral blood of cancer patients were compared with those of 15 healthy individuals, as assessed by quad-μNMR (A). Receiver operating characteristic (ROC) analysis was performed for quad μNMR. An Az (area under the ROC curve) of 0.5 was used to indicate no differences between two groups, whereas an Az of 0.84 was used to indicate a perfect separation between the groups. The optimal cut-off value for identifying malignant status was then defined as 1.66, the point on the ROC curve with the minimum distance between the 0% false-negative and the 100% true-positive.
Figure S3: ROC analysis on TTF1 marker. TTF1 levels in the peripheral blood of lung cancer patients were compared with a control group that includes benign nodules and non-lung cancer cases (i.e. expected to be negative for TTF1) (A). Receiver operating characteristic (ROC) analysis was performed for TTF1. An Az (area under the ROC curve) of 0.5 was used to indicate no differences between two groups, whereas an Az of 0.79 was used to indicate a perfect separation between the groups. The optimal cut-off value for identifying malignant status was then defined as 1.62, the point on the ROC curve with the minimum distance between the 0% false-negative and the 100% true-positive.
Table S1: A list of antibodies and relevant details utilized in the study.
We tested our recently developed point-of-care, operator-independent μNMR device to perform protein analysis of tumor cells for diagnosing pulmonary malignancy. In this clinical study, analysis of both fine needle aspirate (FNA) of primary tumors and blood circulating tumor cells (CTC) was shown to be highly accurate in identifying the presence and establishing the type of lung malignancy.
Acknowledgments
The authors thank N. Sergeyev for synthesizing cross-linked dextran iron oxide nanoparticles, J. Klubnick for preparing TCO, S. Hilderbrand for synthesizing the tetrazine precursor, D. Issadore for μNMR developments, M. Sebas, and B. Tricot for reading NMR samples.
This work was funded in part by K12CA087723 and DOD W81XWH-11-1-0706
Footnotes
Publisher's Disclaimer: This is a PDF file of an unedited manuscript that has been accepted for publication. As a service to our customers we are providing this early version of the manuscript. The manuscript will undergo copyediting, typesetting, and review of the resulting proof before it is published in its final citable form. Please note that during the production process errors may be discovered which could affect the content, and all legal disclaimers that apply to the journal pertain.
References
- 1.Siegel R, Naishadham D, Jemal A. Cancer statistics, 2013. CA Cancer J Clin. 2013;63(1):11–30. doi: 10.3322/caac.21166. [DOI] [PubMed] [Google Scholar]
- 2.Alamgeer M, Ganju V, Neil Watkins D. Novel therapeutic targets in non-small cell lung cancer. Curr Opin Pharmacol. 2013 doi: 10.1016/j.coph.2013.03.010. [DOI] [PubMed] [Google Scholar]
- 3.Kwak EL, Bang YJ, Camidge DR, Shaw AT, Solomon B, Maki RG, et al. Anaplastic lymphoma kinase inhibition in non-small-cell lung cancer. N Engl J Med. 2010;363(18):1693–1703. doi: 10.1056/NEJMoa1006448. [DOI] [PMC free article] [PubMed] [Google Scholar]
- 4.Lynch TJ, Bell DW, Sordella R, Gurubhagavatula S, Okimoto RA, Brannigan BW, et al. Activating mutations in the epidermal growth factor receptor underlying responsiveness of non-small-cell lung cancer to gefitinib. N Engl J Med. 2004;350(21):2129–2139. doi: 10.1056/NEJMoa040938. [DOI] [PubMed] [Google Scholar]
- 5.Tam AL, Kim ES, Lee JJ, Ensor JE, Hicks ME, Tang X, et al. Feasibility of Image-Guided Transthoracic Core-Needle Biopsy in the BATTLE Lung Trial. J Thorac Oncol. 2013;8(4):436–442. doi: 10.1097/JTO.0b013e318287c91e. [DOI] [PMC free article] [PubMed] [Google Scholar]
- 6.Wu CC, Maher MM, Shepard JA. Complications of CT-guided percutaneous needle biopsy of the chest: prevention and management. AJR Am J Roentgenol. 2011;196(6):W678–82. doi: 10.2214/AJR.10.4659. [DOI] [PubMed] [Google Scholar]
- 7.Nagrath S, Sequist LV, Maheswaran S, Bell DW, Irimia D, Ulkus L, et al. Isolation of rare circulating tumour cells in cancer patients by microchip technology. Nature. 2007;450(7173):1235–1239. doi: 10.1038/nature06385. [DOI] [PMC free article] [PubMed] [Google Scholar]
- 8.Sequist LV, Nagrath S, Toner M, Haber DA, Lynch TJ. The CTC-chip: an exciting new tool to detect circulating tumor cells in lung cancer patients. J Thorac Oncol. 2009;4(3):281–283. doi: 10.1097/JTO.0b013e3181989565. [DOI] [PMC free article] [PubMed] [Google Scholar]
- 9.Yu M, Stott S, Toner M, Maheswaran S, Haber DA. Circulating tumor cells: approaches to isolation and characterization. J Cell Biol. 2011;192(3):373–382. doi: 10.1083/jcb.201010021. [DOI] [PMC free article] [PubMed] [Google Scholar]
- 10.Abouzgheib W, Bartter T, Dagher H, Pratter M, Klump W. A prospective study of the volume of pleural fluid required for accurate diagnosis of malignant pleural effusion. Chest. 2009;135(4):999–1001. doi: 10.1378/chest.08-2002. [DOI] [PubMed] [Google Scholar]
- 11.Alix-Panabieres C, Pantel K. Circulating tumor cells: liquid biopsy of cancer. Clin Chem. 2013;59(1):110–118. doi: 10.1373/clinchem.2012.194258. [DOI] [PubMed] [Google Scholar]
- 12.Haun JB, Castro CM, Wang R, Peterson VM, Marinelli BS, Lee H, et al. Micro-NMR for rapid molecular analysis of human tumor samples. Sci Transl Med. 2011;3(71):71ra16. doi: 10.1126/scitranslmed.3002048. [DOI] [PMC free article] [PubMed] [Google Scholar]
- 13.Nurwidya F, Takahashi F, Murakami A, Takahashi K. Epithelial mesenchymal transition in drug resistance and metastasis of lung cancer. Cancer Res Treat. 2012;44(3):151–156. doi: 10.4143/crt.2012.44.3.151. [DOI] [PMC free article] [PubMed] [Google Scholar]
- 14.Maheswaran S, Haber DA. Circulating tumor cells: a window into cancer biology and metastasis. Curr Opin Genet Dev. 2010;20(1):96–99. doi: 10.1016/j.gde.2009.12.002. [DOI] [PMC free article] [PubMed] [Google Scholar]
- 15.Ozkumur E, Shah AM, Ciciliano JC, Emmink BL, Miyamoto DT, Brachtel E, et al. Inertial focusing for tumor antigen-dependent and -independent sorting of rare circulating tumor cells. Sci Transl Med. 2013;5(179):179ra47. doi: 10.1126/scitranslmed.3005616. [DOI] [PMC free article] [PubMed] [Google Scholar]
- 16.Shah AM, Yu M, Nakamura Z, Ciciliano J, Ulman M, Kotz K, et al. Biopolymer system for cell recovery from microfluidic cell capture devices. Anal Chem. 2012;84(8):3682–3688. doi: 10.1021/ac300190j. [DOI] [PMC free article] [PubMed] [Google Scholar]
- 17.Lee H, Sun E, Ham D, Weissleder R. Chip-NMR biosensor for detection and molecular analysis of cells. Nat Med. 2008;14(8):869–874. doi: 10.1038/nm.1711. [DOI] [PMC free article] [PubMed] [Google Scholar]
- 18.Shao H, Chung J, Balaj L, Charest A, Bigner DD, Carter BS, et al. Protein typing of circulating microvesicles allows real-time monitoring of glioblastoma therapy. Nat Med. 2012;18(12):1835–1840. doi: 10.1038/nm.2994. [DOI] [PMC free article] [PubMed] [Google Scholar]
- 19.Issadore D, Chung J, Shao H, Liong M, Ghazani AA, Castro CM, et al. Ultrasensitive clinical enumeration of rare cells ex vivo using a micro-hall detector. Sci Transl Med. 2012;4(141):141ra92. doi: 10.1126/scitranslmed.3003747. [DOI] [PMC free article] [PubMed] [Google Scholar]
- 20.Ghazani AA, Castro CM, Gorbatov R, Lee H, Weissleder R. Sensitive and direct detection of circulating tumor cells by multimarker micro-nuclear magnetic resonance. Neoplasia. 2012;14(5):388–395. doi: 10.1596/neo.12696. [DOI] [PMC free article] [PubMed] [Google Scholar]
- 21.Bishop JA, Teruya-Feldstein J, Westra WH, Pelosi G, Travis WD, Rekhtman N. p40 (DeltaNp63) is superior to p63 for the diagnosis of pulmonary squamous cell carcinoma. Mod Pathol. 2012;25(3):405–415. doi: 10.1038/modpathol.2011.173. [DOI] [PubMed] [Google Scholar]
- 22.Mukhopadhyay S, Katzenstein AL. Subclassification of non-small cell lung carcinomas lacking morphologic differentiation on biopsy specimens: Utility of an immunohistochemical panel containing TTF-1, napsin A, p63, and CK5/6. Am J Surg Pathol. 2011;35(1):15–25. doi: 10.1097/PAS.0b013e3182036d05. [DOI] [PubMed] [Google Scholar]
- 23.Tan D, Zander DS. Immunohistochemistry for assessment of pulmonary and pleural neoplasms: a review and update. Int J Clin Exp Pathol. 2008;1(1):19–31. [PMC free article] [PubMed] [Google Scholar]
- 24.Turner BM, Cagle PT, Sainz IM, Fukuoka J, Shen SS, Jagirdar J. Napsin A, a new marker for lung adenocarcinoma, is complementary and more sensitive and specific than thyroid transcription factor 1 in the differential diagnosis of primary pulmonary carcinoma: evaluation of 1674 cases by tissue microarray. Arch Pathol Lab Med. 2012;136(2):163–171. doi: 10.5858/arpa.2011-0320-OA. [DOI] [PubMed] [Google Scholar]
- 25.Ghazani AA, McDermott S, Pectasides M, Sebas M, Mino-Kenudson M, Lee H, et al. Comparison of select cancer biomarkers in human circulating and bulk tumor cells using magnetic nanoparticles and miniaturized micro-NMR system. Nanomedicine. 2013 doi: 10.1016/j.nano.2013.03.011. [DOI] [PMC free article] [PubMed] [Google Scholar]
- 26.Haun JB, Yoon TJ, Lee H, Weissleder R. Molecular detection of biomarkers and cells using magnetic nanoparticles and diagnostic magnetic resonance. Methods Mol Biol. 2011:72633–49. doi: 10.1007/978-1-61779-052-2_3. [DOI] [PubMed] [Google Scholar]
- 27.Haun JB, Devaraj NK, Hilderbrand SA, Lee H, Weissleder R. Bioorthogonal chemistry amplifies nanoparticle binding and enhances the sensitivity of cell detection. Nat Nanotechnol. 2010;5(9):660–665. doi: 10.1038/nnano.2010.148. [DOI] [PMC free article] [PubMed] [Google Scholar]
- 28.Lee H, Yoon TJ, Figueiredo JL, Swirski FK, Weissleder R. Rapid detection and profiling of cancer cells in fine-needle aspirates. Proc Natl Acad Sci U S A. 2009;106(30):12459–12464. doi: 10.1073/pnas.0902365106. [DOI] [PMC free article] [PubMed] [Google Scholar]
- 29.Shao H, Min C, Issadore D, Liong M, Yoon TJ, Weissleder R, et al. Magnetic Nanoparticles and microNMR for Diagnostic Applications. Theranostics. 2012;2(1):55–65. doi: 10.7150/thno.3465. [DOI] [PMC free article] [PubMed] [Google Scholar]
- 30.Talasaz AH, Powell AA, Huber DE, Berbee JG, Roh KH, Yu W, et al. Isolating highly enriched populations of circulating epithelial cells and other rare cells from blood using a magnetic sweeper device. Proc Natl Acad Sci U S A. 2009;106(10):3970–3975. doi: 10.1073/pnas.0813188106. [DOI] [PMC free article] [PubMed] [Google Scholar]
- 31.Zong C, Lu S, Chapman AR, Xie XS. Genome-wide detection of single-nucleotide and copy-number variations of a single human cell. Science. 2012;338(6114):1622–1626. doi: 10.1126/science.1229164. [DOI] [PMC free article] [PubMed] [Google Scholar]
- 32.Chung HJ, Castro CM, Im H, Lee H, Weissleder R. A magneto-DNA nanoparticle system for rapid detection and phenotyping of bacteria. Nat Nanotechnol. 2013;8(5):369–375. doi: 10.1038/nnano.2013.70. [DOI] [PMC free article] [PubMed] [Google Scholar]
- 33.Liong M, Hoang AN, Chung J, Gural N, Ford CB, Min C, et al. Magnetic barcode assay for genetic detection of pathogens. Nat Commun. 2013;4:1752. doi: 10.1038/ncomms2745. [DOI] [PMC free article] [PubMed] [Google Scholar]
- 34.Iyoda A, Baba M, Shibuya K, Moriya Y, Yasufuku K, Sekine Y, et al. Transbronchial fine needle aspiration cytological examination: a useful tool for diagnosing primary lung cancer. Thorac Cardiovasc Surg. 2006;54(2):117–119. doi: 10.1055/s-2005-865924. [DOI] [PubMed] [Google Scholar]
- 35.Light RW. Clinical practice. Pleural effusion. N Engl J Med. 2002;346(25):1971–1977. doi: 10.1056/NEJMcp010731. [DOI] [PubMed] [Google Scholar]
Associated Data
This section collects any data citations, data availability statements, or supplementary materials included in this article.
Supplementary Materials
Figure S1: Algorithm used in identification and sub classification of lung cancer samples using μNMR technology.
Figure S2: ROC analysis on Quad marker. Quad marker levels on CTC in the peripheral blood of cancer patients were compared with those of 15 healthy individuals, as assessed by quad-μNMR (A). Receiver operating characteristic (ROC) analysis was performed for quad μNMR. An Az (area under the ROC curve) of 0.5 was used to indicate no differences between two groups, whereas an Az of 0.84 was used to indicate a perfect separation between the groups. The optimal cut-off value for identifying malignant status was then defined as 1.66, the point on the ROC curve with the minimum distance between the 0% false-negative and the 100% true-positive.
Figure S3: ROC analysis on TTF1 marker. TTF1 levels in the peripheral blood of lung cancer patients were compared with a control group that includes benign nodules and non-lung cancer cases (i.e. expected to be negative for TTF1) (A). Receiver operating characteristic (ROC) analysis was performed for TTF1. An Az (area under the ROC curve) of 0.5 was used to indicate no differences between two groups, whereas an Az of 0.79 was used to indicate a perfect separation between the groups. The optimal cut-off value for identifying malignant status was then defined as 1.62, the point on the ROC curve with the minimum distance between the 0% false-negative and the 100% true-positive.
Table S1: A list of antibodies and relevant details utilized in the study.