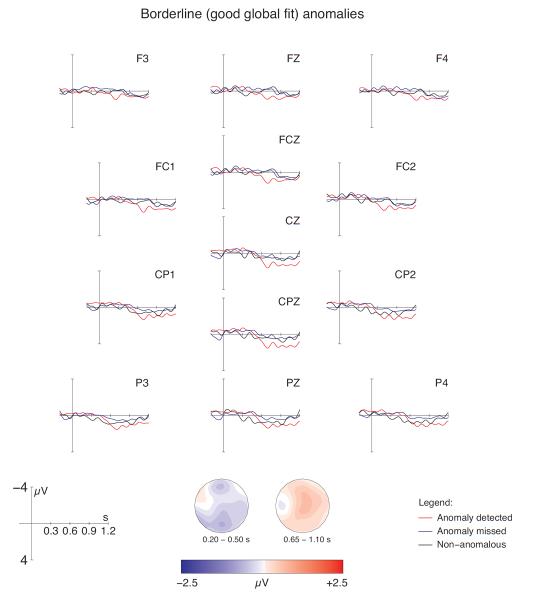
Figure 5.
Grand average ERPs at the position of the critical word (onset at the vertical bar) in the borderline (good global fit) anomaly conditions at 13 selected electrodes in Experiment 2b. The figure contrasts ERP responses to detected anomalies (red traces), missed anomalies (blue traces) and plausible controls (black traces). Negativity is plotted upwards. The topographical maps show the scalp distribution for the voltage difference between detected anomalies and plausible sentences in the N400 and late positivity time windows, respectively.

