

Abstract
Photodissociation mass spectrometry combines the ability to activate and fragment ions using photons with the sensitive detection of the resulting product ions by mass spectrometry. The resulting combination affords a versatile tool for characterization of biological molecules. The scope and breadth of photodissociation mass spectrometry have increased substantially over the past decade as new research groups have entered the field and developed a number of innovative applications that illustrate the ability of photodissociation to produce rich fragmentation patterns, to cleave bonds selectively, and to target specific molecules based on incorporation of chromophores. This review focuses on many of the key developments in photodissociation mass spectrometry over the past decade with a particular emphasis on its applications to biological molecules.
1. Introduction
The technical development and fundamental exploration of ion activation methods remains at the forefront of the field of mass spectrometry owing to the need to generate informative molecular fingerprints of a diverse array of molecules. The goal of all activation methods is essentially the same: to deposit energy into an ion to cause reproducible bond cleavages that yield diagnostic and interpretable fragment ions that reveal structural or sequence information about the molecule of interest. A significant expansion in the application of mass spectrometry to biological and biotechnology problems (proteomics, metabolomics, drug discovery, etc.) has fueled the interest in more versatile methods for characterization of molecules in complex mixtures.1–6 Information about structures and binding energies as well as conformations and isomerization can be obtained based on how ions dissociate in the gas phase. The classic collisional based methods are the most robust and easily implemented among all activation methods, and collision induced dissociation (CID, also known as collisionally activated dissociation (CAD)) is an integral part of virtually every commercial tandem mass spectrometer.7 In the CID process, gas-phase collisions between an ion that has been accelerated to a higher velocity (and thus higher kinetic energy) and an inert gas result in conversion of kinetic energy of the ion into internal energy, ultimately resulting in energy accumulation that can lead to fragmentation of the ion. Despite its enormous popularity and exceptional performance for many applications, collisional activation affords insufficient energy deposition for certain types of ions or applications. The quest for alternatives to CID has spurred the development of electron-based methods (electron capture dissociation (ECD)8–9 and electron transfer dissociation (ETD)10–11), surface induced dissociation (SID),12–13 ion-ion reactions,14–15 and photodissociation (PD).16–20 The electron-based methods, which use either a low energy electron or a negatively charged electron-donating reagent to energize ions via an exothermic electron attachment process, are most notable for preserving post-translational modifications during the dissociation of peptides which is a particularly beneficial outcome in large scale bottom-up proteomics applications.8–11 ECD and ETD have also proven successful for analysis of intact proteins, another challenge being addressed by advanced mass spectrometric methods.21–24 SID is a higher energy alternative to gas-phase collision methods in which ions are activated and fragmented upon collision with a surface (which serves as a massive target).12–13 In addition to its ability to generate rich fragmentation patterns for many classes of ions due to its higher energy deposition, SID has also been used more recently for the characterization of large non-covalent protein complexes which is one of the newer frontiers of applications of mass spectrometry in structural biology.25–26 In photodissociation ions accumulate energy via absorption of one or more photons, thus leading to fragmentation. This article will focus on the technical details and applications of photodissociation, including both infrared multiphoton dissociation (IRMPD) and ultraviolet photodissociation (UVPD). Ion spectroscopy (typically undertaken as a type of photodissociation action spectroscopy) has been covered in a number of excellent reviews and will not be included in depth here.27–32
A laser was first coupled to a mass spectrometer for photodissociation over three decades ago,33 and the number and scope of applications has increased significantly in recent years, in part due to the greater availability of lasers and in part due to a larger array of mass spectrometers suitable for adaptation for photodissociation. Both pulsed and continuous wave (cw) lasers have been used for photodissociation, with wavelengths ranging from the infrared (e.g.,10.6 um) to vacuum ultraviolet (e.g., 157 nm). The irradiation period may extend from a few nanoseconds to hundreds of milliseconds depending on the photon flux of the laser and the energy deposition per photon. Energy may be accumulated via the absorption of dozens or hundreds of very low energy photons or just a single high energy photon. For example, the wavelength of photons from a CO2 laser is 10.6 um which corresponds to around 0.1 eV of energy per photon. Many of these photons must be absorbed and the energy accumulated prior to ion dissociation. In contrast, absorption of a single photon from an ArF excimer laser (193 nm, 6.4 eV) is sufficient to cause dissociation of a protein in the gas phase. Even aside from the energy deposition considerations, photoactivation contrasts with collisional activation in several ways. One notable difference is that photoactivation does not depend on the translational excitation of ions as required for CID, nor is it a collision-based process. The net energy deposition from photoactivation is arguably more easily modulated based on variation of laser parameters (wavelength, photon flux, exposure time) compared to collision activation, the latter which is varied primarily based on collision energy. A simple energy diagram, as shown in Figure 1, is instructive for conveying the differences in the energization process afforded by collisional activation and photoactivation by IR or UV photons. As illustrated, activation by absorption of IR photons is a stepwise process with very little internal energy accumulation per step. In many tandem mass spectrometers, collisional activation is a stepwise process too, although each increment of internal energy per collision might be significantly greater than the 0.1 eV deposited by a single IR photon. Because of the step-wise nature of energy deposition, both IR photoactivation and collisional activation tend to promote access to lower energy fragmentation pathways depending on the rate of ion activation (e.g. collision rate or photon flux). In short, the fragmentation pathways with the highest activation energies are not accessible if the precursor ions dissociate via other lower energy channels during the energization process. UV photons, on the other hand, have much greater energies, and thus absorption of even a single UV photon (such as a 193 nm photon = 6.4 eV) can populate excited electronic states that afford access to fragmentation pathways with significantly higher activation energies.
Figure 1.
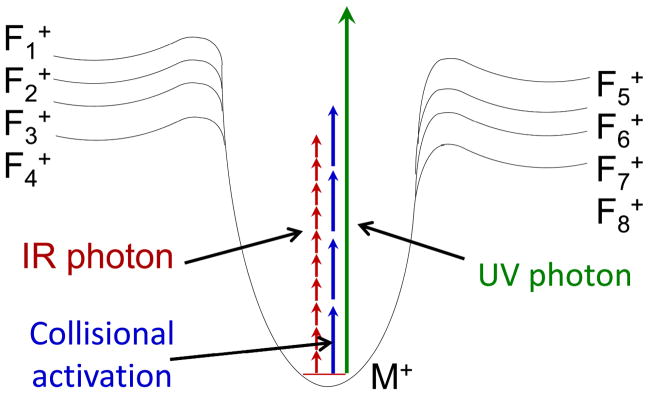
Energy diagram illustrating energy deposition by collisional activation or absorption of IR or UV photons where M+ represents a selected precursor ion and Fn+ represent various fragment ions with different activation energies.
One of the hallmarks of tandem mass spectrometry (MS/MS) has been its impressive utility for determination of structures of molecules and sequences of biopolymers. In essence, a fragmentation pattern provides a fingerprint of a molecule, allowing differentiation of isobaric and even isomeric structures in some cases, more so than a single highly accurate mass measurement (which may uniquely define a molecular composition but not the arrangement of atoms). The ability to attain fingerprints is why MS/MS has been widely applied for so many different classes of molecules, ranging from drugs to metabolites to biopolymers such as peptides, proteins, nucleic acids, carbohydrates, and lipids. To demonstrate the diverse applications of photodissociation mass spectrometry for structural characterization, examples are selected from many of these classes of biomolecules in this article.
2. Implementation of Photodissociation
The implementation of photodissociation requires a means of intersecting a photon beam or bundles of photons from a laser beam or high intensity light source with the selected ions, meaning a degree of optical access is needed. A method of triggering or gating the photon beam to coincide with the desired ion activation period or temporal trajectory of ions is needed, and this is typically accomplished by a pulse generator. Photodissociation has been implemented on a number of types of mass spectrometers, including ion trapping instruments (Fourier transform ion cyclotron resonance (FTICR), three dimensional quadrupole ion traps, two dimensional linear ion traps, and hybrids) and time-of-flight instruments.16–20 The accumulation of internal energy via absorption of one or multiple photons couples particularly well with ion trap mass spectrometers that allow ions to be confined in a particular region of space that can be intersected by a source of photons (typically a laser). Time-of-flight (TOF) instruments offer high resolution, high accuracy, a broad m/z range, and fast scan times, although the technical difficulty of overlapping the ions with the photon source is more challenging. Photodissociation efficiencies in TOF mass spectrometers have historically been low because of the very narrow time window for photodissociation prior to mass analysis.34–38 This need for fast energy deposition has restricted photodissociation on TOF instruments to the use of pulsed UV or IR lasers. FTICR mass spectrometers are also well-matched for photodissociation due to their ultra-low pressure environment which diminishes the opportunity for collisional deactivation (which may occur in quadupole ion traps that typically operate with 1 mtorr of Helium) and their outstanding mass accuracy and resolution which facilitate assignment of fragment ions. Many commercial FTICR instruments are equipped with IR lasers for IRMPD, but UV lasers have not been commonly interfaced to these mass spectrometers.39–42
Three dimensional quadrupole ion traps and the analogous two dimensional linear ion traps are also well-suited for photodissociation because of their efficient trapping capabilities as well as the ease of optical access.43–44 When first implemented in the 3D and 2D ion traps, photodissociation afforded one notable advantage relative to collisional activation: alleviation of the low mass cutoff.45–47 Conventional CID typically required the use of higher radiofrequency (trapping) voltages to increase the kinetic energies of precursor ions during collisional activation, and the higher trapping voltages meant sacrificing the storage of low m/z fragment ions (the so-called “low mass cutoff” problem). Photodissociation was first implemented in commercial 3D ion traps in the 1990’s via introduction of light through a hole in the ring electrode45–46 and in 2D ion traps by axial admission of the laser.47 Interestingly, the addition of a hole or two in the ring electrode did not seriously impede the analytical metrics of the 3D ion traps, thus underscoring their robust performance. Photodissociation has been implemented on a high performance Orbitrap mass spectrometer too, in which the photoactivation occurred in an HCD multiple collision cell which resided at the back end of the instrument (located after a dual cell linear ion trap which was used for mass selection and prior to the Orbitrap analyzer used for high accuracy/high resolution mass analysis).48 The HCD (higher energy collisional dissociation)49 cell is typically used for beam-type CID in ion trap and hybrid ion trap instruments, but also proved suitable as a region in which a laser beam could be overlapped with the ion population. A laser beam was passed through the HCD cell to cause photodissociation, and the resulting fragment ions were sent to the Orbitrap analyzer for high mass accuracy/high resolution analysis.48 Schematic diagrams of two set-ups are shown in Figure 2. In each case the photons are directed from the light source (e.g., laser) via a suitable set of mirrors and/or lenses and admitted through an optical window which has been integrated with the vacuum system of the mass spectrometer.
Figure 2.

Examples of lasers interfaced to mass spectrometer. (A) Dual cell linear ion trap. (B) Orbitrap mass spectrometer with photodissociation implemented in the HCD cell. Adapted with permission from Ref. 48. Copyright Springer 2011.
At this point, there have been more studies utilizing IR lasers for photodissociation than UV or visible lasers, but this trend is changing due to the decreasing cost of UV lasers coupled with the substantially greater energy deposition per UV photon which provides access to higher energy fragmentation pathways.16–17 To date, economical continuous wave CO2 lasers are the most popular option for IRMPD, and the photons are readily admitted via a ZnSe window. The 10.6 μm wavelength is widely absorbed by most organic molecules, although absorption of a single 0.12 eV photon is insufficient to cause dissociation which accounts for its description as a multiphoton process.18–20 Photodissociation has also been demonstrated using a femtosecond titanium sapphire laser which produces near IR photons at 800 nm (1.5 eV per photon).50–52 In the UV/Vis range, Nd:YAG, excimer, and optical parametric oscillator (OPO):YAG lasers have been utilized for photodissociation.17 Owing to the fact that the energies of UV photons are 20 – 100X greater than IR photons, photodissociation can occur upon absorption of a single photon. UV wavelengths that have been used include 266 nm (the fourth harmonic of a Nd:YAG laser, 4.7 eV per photon),53–56 355 nm (the third harmonic of a Nd:YAG laser, 3.5 eV),57–60 351 nm (XeF excimer, 3.5 eV per photon),61–62 157 nm (F2 excimer, 7.9 eV per photon),63–66 and 193 nm (ArF excimer, 6.4 eV).67–70 OPO-Nd:YAG lasers provide a tunable range from 205 nm – 2550 nm (6.0 – 0.49 eV).71–74 Recently a vacuum UV beamline (6.4 eV, 7.8 eV, 13.2 eV, and 16 eV).75–76 from a synchrotron radiation source has also been used. In this case, ions stored in a linear ion trap were irradiated for 500 ms from the continuous radiation provided by the synchrotron source, and a diverse array of fragment ions were produced for a small protein.75 Any light source that provides sufficient power and offers a wavelength that is absorbed by the analyte ions of interest can be used for photodissociation. Pulsed lasers with low repetition rates (such as 10 Hz or 20 Hz) have more limited utility for high throughput chromatographic applications that demand spectral acquisition rates higher than the pulse repetition rate of the laser or those requiring multiple pulses that will restrict spectral acquisition rates.
3. Applications of Infrared Multiphoton Photodissociation (IRMPD) for Biological Molecules
Photodissociation using an IR laser has been one of the most popular applications because most organic molecules have satisfactory absorption cross sections at 10.6 um, the fundamental wavelength produced by a CO2 laser. Since multiple photons must be absorbed to cause ion dissociation, this is a step-wise activation process which typically leads to preferential cleavage of the most labile bonds. In many ways, the outcome of IRMPD is similar to that achieved by low energy collisional activation (such as in ion trap instruments) via heating of vibrational modes and internal vibrational redistribution of energy. The internal energy accumulated during IR photoactivation is influenced by the power of the laser (total photon flux), the length of the photoirradiation period or number of laser pulses, the absorption cross section which affects the probability that a photon will be absorbed, and competitive collisional deactivation which is more notable in ion trapping instruments that might operate with 1 mtorr buffer gas. These parameters can be controlled to some extent to modulate energy deposition and ion dissociation, but ultimately the fragmentation patterns are similar to those obtained upon CID. IRMPD has been used for characterization of numerous types of molecules, including drugs,77–82 nucleic acids83–92 and nucleic acid/ligand complexes,87–92 peptides,93–102 proteins,103–104 oligosaccharides,105 among others.106–107 The following section summarizes some the IRMPD-MS applications that have been reported as well as examples of the IRMPD mass spectra obtained.
Many of the original applications of IRMPD in quadrupole ion traps focused on the analysis of drugs, including β-lactams (such as cephalosporin and penicillin analogs), tetracyclines, polyether ionophore antibiotics, aminoglycosides, and erythromycin analogs.77–82 Some of these early studies reported variations of experimental strategies to explore the versatility of the photodissociation method, such as time-resolved IRMPD as an analogy to energy-resolved CID, and combinations of CID and IRMPD to obtain fragment ion genealogical information.81 Two of the key benefits of photodissociation were firmly established in these original studies, including the alleviation of the low mass cutoff in ion trap MS/MS experiments and the production of greater arrays of fragment ions due to secondary (i.e. consecutive) activation and dissociation of fragment ions formed directly from the selected precursor. The alleviation of the low mass cutoff was realized because the photoactivation process is largely independent of the rf trapping voltage, meaning that a much lower rf trapping voltage could be applied during the IRMPD period. This extended the trapping range to lower m/z values which allowed the storage and detection of diagnostic low m/z fragment ions in IRMPD experiments. Second, due to the non-discriminate manner of photoactivation, fragment ions arising from a selected precursor ion had the opportunity to absorb photons and dissociate into secondary fragment ions.80–82 This phenomenon resulted in production of a greater array of fragment ions than CID mass spectra and frequently conversion of “dead-end” fragment ions (e.g., the commonly observed but rarely informative product ions arising from water loss) into diagnostic ions upon photodissociation. Both of these benefits were similarly recognized for applications of photodissociation on other quadrupole ion trap systems for many other classes of molecules, irrespective of the type of laser or wavelength used.
Oligonucleotides and nucleic acids have large absorption cross-sections at 10.6 um due to their phosphate backbone, resulting in very high photodissociation efficiencies upon exposure to as little as 1–2 msec of continuous wave IR radiation.83–86 The high IRMPD efficiency of oligodeoxynucleotides was recognized 20 years ago in a study comparing dissociation of oligodeoxynucleotides and proteins in an FTICR instrument.40 IRMPD mass spectra of deprotonated oligodeoxynucleotides exhibit a great array of sequence ions, such as (a – B) and w ions for oligodeoxyribonucleotides which arise from cleavage of the 3′-C-O bond after initial base loss (Figure 3) and internal fragment ions (denoted by Bx:By in which the Bx and By indicate the positions of the nucleobases that are incorporated in the internal products), and c- and y-type ions for oligoribonucleotides. The product ions are similar to the same types of ions observed upon CID with the notable exception that base loss ions (M – B) which are prominent dead-end species upon CID are instead converted into more meaningful sequence ions upon activation during IRMPD.83–85
Figure 3.
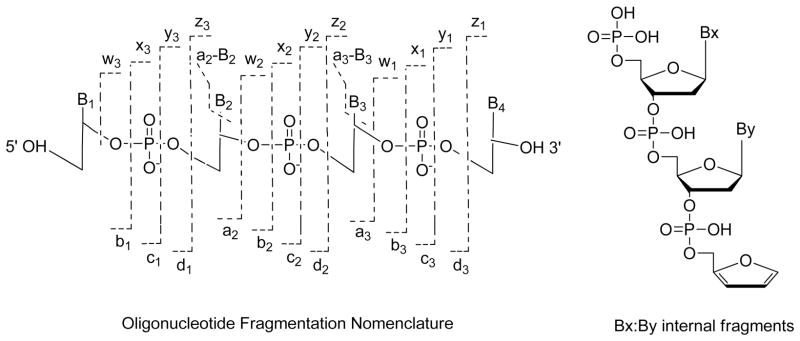
Oligonucleotide fragmentation nomenclature. Internal fragments result from a double backbone cleavage. The internal ions have a phosphate at their 5′ end and a furan at the 3′ terminal. B represents a nucleobase. Reprinted with permission from Reference 91. Copyright Springer 2013.
IRMPD has also proven effective for the characterization of DNA adducts, such as those formed upon covalent binding of drugs to DNA, and non-covalent DNA-ligand complexes.87–92 A classic example is the type of covalent adduct that originates upon the reaction of cisplatin with DNA.108 Cisplatin is the most commonly administered anticancer drug, and upon hydrolysis in the cellular environment it preferentially forms 1,2-intrastrand cross-links involving adjacent guanine bases (via the electron rich N7 site).108 Formation of the 1,2-intrastrand GpG cross-links bends the DNA and partially unwinds the helix, ultimately triggering apoptosis.108 Cross-linked DNA adducts were readily transferred to the gas phase as deprotonated species upon electrospray ionization, followed by IRMPD.91–92 Examples of the IRMPD mass spectra are shown in Figure 4 for cisplatin cross-linked single strand oligodeoxynucleotide, G3-D (d(ATG GGT ACC CAT).92 This oligodeoxynucleotide has a stretch of three guanines, thus allowing crosslinking at position G3 and G4 or G4 and G5 and posing a problem for differentiation. Although many of the fragment ions produced by the G3G4 and G4G5 isomers upon IRMPD have the same m/z values and are indicative of conventional nucleic acid-type fragment ions, there are a few fragment ions that allow them to be distinguished. In Figure 4, the fragments marked in green (bearing the Pt modification) and in blue (without the platinum modification) are key for confirming the Pt modification and site of crosslink.92 In Figures 4A and 4B (for oligodeoxynucleotide G3-D), the G3G4 crosslink yields several Pt-containing ions, including T2:G4 (m/z 684.4), G4:C9 (m/z 1204.7), G4:C10 (m/z 1349.1) and d4 (m/z 1522.1), whereas the G4G5 crosslink generates G5:G6 (m/z 1189.3), G5:G11 (m/z 1341.7), and x8 (m/z 1403.3) as diagnostic Pt-containing ions.92 These fragment ions are specific to each of the two isomers. Among the platinum-containing fragment ions, ones originating from cleavage of bonds next to the adduction sites are most critical. There are several of these fragments, such as [G5:T6+Pt(NH3)2+G]− (m/z 1189.3) for the G4G5 crosslink and [G4:C10+Pt(NH3)2+G]− (m/z 1349.1) for the G3G4 crosslink of G3-D, indicating that the adjacent guanine nucleobase remains bound to the released internal fragments via the Pt moiety.92
Figure 4.

IRMPD spectra for (A) the G4G5 cisplatin cross-link (3-, m/z 1286.7) and (B) the G3G4 cisplatin cross-link (3-, m/z 1286.7) of d(ATG GGT ACC CAT) (Mr of the cross-link product is 3863.2 Da). Fragment ions in red and in green contain the Pt modification. Fragment ions in black and in blue are the Pt-free fragments. Unique fragments for each adducts that allowed them to be identified are labeled in green and blue. Precursor ions are noted with an asterisk. Reprinted with permission from Reference 92. Copyright Springer 2014.
There are also many drugs that bind to DNA in a non-covalent manner, often causing conformational changes to the DNA that consequently interfere with DNA transcription and suppress cell growth.109 IRMPD has proven to be a useful method for characterization of non-covalent DNA/drug complexes. One previous study examined the complexes formed between three 14-base pair duplexes and eight DNA-interactive drugs, either intercalating agents or minor groove binding agents.87 For the most part, IRMPD caused strand separation and disassembly of the complexes for complexes containing the more AT-rich sequences and/or minor groove binding drugs. In contrast, ejection of the drug as well as base loss were prominent processes for complexes containing intercalating drugs and/or duplexes with higher GC base content.87 Upon comparing the outcomes of CID and IRMPD for the same non-covalent complexes, it was found that base loss ions comprised over 70% of the product ions upon CID but less than 10% for IRMPD. This outcome was attributed to the non-resonant nature of IRMPD which allowed activation and dissociation of the primary product ions, converting them to more informative sequence ions.87
IRMPD has also been utilized successfully for the characterization of peptides93–102 and small proteins.103–104 IRMPD has been used a number of times to sequence peptides in ion trap instruments, primarily resulting in the production of the same types of b and y ions commonly observed upon CID as well as several additional fragment ions in the lower m/z region (see Figure 5 for a description of the nomenclature of fragment ions for peptides).
Figure 5.

Backbone cleavages of peptides that produce complementary a/x, b/y and c/z ions.
Detection of the smallest b and y ions (i.e. b1, b2, y1, y2) and immonium ions (i.e. ions representative of individual amino acids) is advantageous for mapping the N- and C-terminal residues of peptides and identification of modified amino acid residues. Moreover, it has been demonstrated that constraining database searches via MS/MS identification of immonium ions restricts the total search space, resulting in higher confidence identification of peptides and reduces the rate of false negatives.110 Although this database search space method did not utilize IRMPD, it showcased the merits of developing ion activation methods that can provide new perspectives for matching fragmentation patterns to database information. The non-resonant nature of IRMPD was also found to alleviate a common dead-end pathway observed upon CID of protonated peptides—dehydration.97 Many protonated peptides dissociate by the loss of water, and this can be a prominent uninformative pathway for peptides containing dehydration-prone amino acids. During IRMPD, the dehydration product ion can undergo photoabsorption and be readily converted to other sequence ions. An example of an IRMPD mass spectrum obtained for bradykinin (RPPGFSPFR, 3+) is shown in Figure 6A.102 The conversion of the selected precursor ion (in this case the triply protonated peptide) to fragment ions was very high, and complementary sequence ions were generated across the peptide sequence. IRMPD is far more effective at lower pressures which cause less extensive collisional cooling, a factor that counteracts the energization of ions through IR photoabsorption. Experiments undertaken in a dual cell linear ion trap mass spectrometer have confirmed that IRMPD dissociation efficiencies are much greater (by a factor of 100X or more) when IRMPD is undertaken in the lower pressure cell operated at 3 × 10⁻⁴ Torr compared to the higher pressure cell operated at 5 × 10⁻³ Torr.102 In the low pressure cell, complete dissociation of precursor ions occurs in less than 25 ms of irradiation using a cw IR laser.102 The neutral loss of water is the predominant fragmentation pathway upon CID (Figure 6B), and this is an uninformative, dead-end type process. The corresponding IRMPD mass spectrum displays a far greater array of diagnostic sequence ions and lower mass immonium ions. Supplemental experiments confirmed that this peptide primarily underwent dehydration, and then the dehydration product subsequently dissociated upon exposure to additional IR photons to yield informative sequence ions.102 The ability of IRMPD to activate both the selected precursor and the resulting product ions affords an advantage for generating more sequence information from peptides that are prone to dead-end fragmentation pathways.
Figure 6.

(A) IRMPD (7.5 ms irradiation, q = 0.1, 50 W) and (B) CID (30 ms, q = 0.25, 8% normalized collision energy) mass spectra of [bradykinin + 3H]3+ of m/z 354.3. The precursor ion is indicated with a star (✰) and internal ions are labeled with #. The q value reflects the amplitude of the radiofrequency voltage applied to the linear ion trap, a parameter that influences the kinetic energies of the collisions during CID and at the same time defines the lower m/z range. A lower q value, which extends the lower mass range, can be used with IRMPD because it is not a collision-based activation process. Internal fragment ions are those arising from two backbone cleavages and thus contain neither the N- nor C-terminus. Reprinted with permission from reference 102. Copyright American Chemical Society 2009.
The P-O stretch of the phosphate functionality affords an exceptional chromophore around 10.6 um, endowing phosphorylated molecules such as phosphopeptides with extremely high cross-sections upon irradiation by a CO2 laser.93 This enhanced photoabsorptivity has been exploited for several IRMPD applications.97–98,100 Due to the enhanced cross-sections at 10.6 um related to the phosphate P-O stretching and POH bending, phosphopeptides exhibit higher probabilities of photon absorption, meaning that phosphorylated peptides on average will undergo activation/dissociation more rapidly than non-phosphopeptides during identical photoirradiation conditions.93 This feature allows selective differentiation of phosphopeptides and peptides by monitoring their IRMPD behavior based on conversion of precursor ions to fragment ions (or simply the disappearance of precursor ions and appearance of fragment ions). This outcome has been demonstrated for mixtures of phosphopeptides and non-phosphorylated peptides, as reported for a tryptic digest of alpha-casein.97,98 In this case, the abundances of peptides in an LC-MS run were followed in alternating laser off/laser on scans for which a low laser power was applied during the laser on scans. Solely the phosphopeptides dissociated during the laser “on” scans because the low applied laser power was insufficient to activate and dissociate the non-phosphorylated peptides.
In a more recent report, phosphorylated peptides were differentiated from non-phosphorylated peptides containing Ser, Tyr or Thr from those containing neither phospho groups nor alcohol side-chains.73 This approach entailed exposure of peptide/18-crown-6 ether complexes to irradiation at 3668 cm−1 (phosphate OH stretch) or 3657 cm−1 (alcohol OH stretch) or 3578 cm−1 (carboxylic acid group). Detachment of the 18-crown-6 moiety upon exposure to each of the three wavelengths signified absorption by the peptide and thus correlated with the presence of phosphate (via phosphorylated Ser, Tyr or Thr) or alcohol (via non-phosphorylated Ser, Tyr, or Thr) or carboxylic acid (generic peptide C-terminus) functionalities.73
Alternatives to the use of a conventional CO2 laser for IRMPD have also generated interest. For example, recently a near-IR Ti-sapphire femtosecond laser (800 nm wavelength, 1.55 eV per photon) was used for multiphoton photodissociation.50–52 The method was termed femtosecond laser-induced ionization/dissociation (fs-LID) because the process entailed escape of an electron from a protonated peptide prior to dissociation of the incipient oxidized radical intermediate. The resulting spectra for peptides contained a rich array of sequence ions, including a, b, c, x, y, and z ions.50–51 This method also allowed the unambiguous assignment of phosphorylation sites of phosphopeptides via the identification of specific phosphorylated fragment ions, as illustrated in Figure 7 for the bis-phosphorylated peptide, HEVSASpTQpSTPASSR.51
Figure 7.
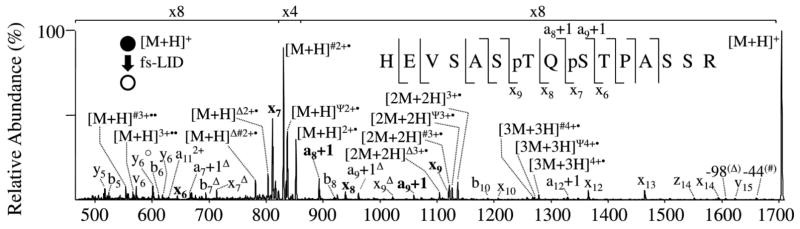
fs-LID mass spectrum of the singly protonated, doubly-phosphorylated peptide HEVSASpTQpSTPASSR. Sequence ions which are most informative for localization of the phosphorylation sites are labeled on the sequence insets. * = loss of 17 Da; ○ = loss of 18 Da; Ψ = loss of 30 Da; # = loss of 44 Da; Δ = loss of 98 Da. Reprinted with permission from reference 51. Copyright Elsevier 2010.
4. Applications of Ultraviolet Photodissociation for Biological Molecules
Although IRMPD can be nearly universally applied to most classes of organic molecules, its shortcomings as an activation method arise from the need for absorption of dozens or even hundreds of photons to cause dissociation. This requirement can be difficult to achieve in a short time period using a cw laser, and the problem can be exacerbated in quadrupole ion trap instruments that operate most effectively in the presence of mtorr levels of He (causing collisional deactivation). Using a higher power pulsed or focused IR laser can alleviate the problem,96 but even then the resulting fragmentation patterns may be analogous to those obtained by CID methods which are dominated by lower energy dissociation pathways. For example, for peptides both CID and IRMPD produce predominantly a, b, and y ions, perhaps with some additional immonium ions upon IRMPD. In order to achieve higher internal energy deposition and in many cases richer fragmentation patterns, pulsed UV lasers offer a compelling alternative. As noted earlier each UV photon deposits far more internal energy than a typical IR photon (3.5 eV to 7.9 eV for common UV wavelengths (i.e. 351 nm and 157 nm) compared to 0.12 eV for a 10.6 um IR photon). Absorption of even a single UV photon can energize ions to higher electronic states, and subsequent dissociation may occur directly from the excited electronic states or after internal conversion and intramolecular vibrational redistribution. This opens up new dissociation mechanisms and fragmentation pathways for ions, ultimately leading to richer MS/MS spectra than typically obtained by CID or IRMPD. For example, the UVPD (193 nm) mass spectrum of the doubly protonated peptide DLYANTVLSGGTTMYPGIADR (Figure 8a), which is one of the tryptic peptides produced upon proteolysis of beta actin from HT-1018 cytosolic fibrosarcoma cells, exhibits many a, b, c, x, y, z product ions and yields complete sequence coverage from both series of N-terminal and C-terminal ions.67 Some b/y ions arising from cleavage of the amide backbone bond are seen, along with a/x and c/z ions that evolve from cleavages at the other backbone positions (see fragment ion nomenclature in Figure 5). CID of the same peptide, however, yielded somewhat less spectral information and incomplete peptide sequence coverage (Figure 8b). A SEQUEST scoring assessment of the two peptides yielded Xcorr scores of 6.78 and 4.44 for UVPD and CID, respectively (with a higher score indicating greater confidence).67
Figure 8.

MS/MS spectra of DLYANTVLSGGTTMYPGIADR (2+), a tryptic peptide from b-actin found in a human HT-1080 lysate obtained by (a) UVPD using one 5 ns pulse at 193 nm, giving an Xcorr score of 6.78, and (b) CID, giving a Sequest Xcorr score of 4.44. Reprinted with permission from Reference 67. Copyright American Chemical Society 2010.
Photodissociation efficiencies have been estimated to range from 20–98% using a single 5 ns laser pulse (calculated based on conversion of precursor ions to meaningful fragment ions),67 making the method well-suited to high-throughput proteomic strategies. Peptides with amino acids containing aromatic side-chains (tryptophan, tyrosine, phenylalanine) yield higher dissociation efficiencies than peptides without aromatic groups, thus showing the impact of the presence and type of UV chromophore on photoabsorption cross-section.17,67 Consider as an example three doubly protonated peptides with nearly identical sequences (e.g., KRPPGFSPFR, RPPGFSPFR, and YRPPGFSPFR) that differ by one aromatic group (an extra Y for the third peptide).67 KRPPGFSPFR and RPPGFSPFR each contained two aromatic groups and yielded photodissociation efficiencies of 80 ± 2% and 78 ± 3%, respectively, whereas YRPPGFSPFR with an additional tyrosine resulted in a dissociation efficiency of 92 ± 2%. A strategy to enhance UVPD efficiency at 193 nm was thus based on the N-terminal derivatization of peptides using a phenyl isothiocyanate tag (i.e. 4-sulfophenyl isothiocyanate SPITC).68 Whereas the UVPD efficiencies of a set of non-derivatized model peptides ranged from 28% to 66% (with an average of 50%), the efficiencies increased to 50% to 95% for the corresponding SPITC-derivatized peptides, resulting in an increase in UVPD efficiency by up to a factor of two.68
Much of the mechanistic framework for UVPD at 157 nm was established by Reilly and co-workers in an extensive series of studies of peptides over the past 10 years.38,63–65,111–125 UVPD of peptides using 157 nm photons produces mass spectra containing many diagnostic N-terminal and C-terminal ions in addition to side-chain loss ions (d and w) that allow differentiation of leucine and isoleucine. Absorption of 157 nm is associated with the peptide backbone amides leading to Rydberg excitation and/or electron detachment.122 Numerous systematic studies of the UVPD process led to Reilly’s proposal that UVPD at 157 nm occurred by photolytic radical cleavage (Norrish Type I) of the peptide backbone at the Cα and carbonyl carbon bonds (producing the a and x ions shown in Figure 5). After the initial homolytic C-C bond cleavage, subsequent radical migration and other secondary processes, such as hydrogen atom migration), produce the diverse array of observed fragment ions.114 The higher energy d, v and w-type ions arise from other secondary pathways. Fragmentation may occur from excited electronic states as well as after internal conversion and intramolecular vibration redistribution. Moreover, Reilly et al. noted that UVPD allowed the differentiation of isoleucine and leucine residues in peptides based on the production of different side-chain fragments, primarily via v and w ions which are both C-terminal ions (as illustrated in Figure 9).120,121
Figure 9.

Formation of v and w ions upon UVPD. Reprinted with permission from reference 121. Copyright American Chemical Society 2010.
For peptides containing leucine (L), w-type ions that were 85.05 Da lower in mass than the corresponding x-type ions were formed, whereas v-type ions that were 84.06 Da lower in mass and w-type ions that were 71.04 Da lower in mass than the corresponding x-type ions were produced for peptides containing isoleucine (I).120,121 The rich and predictable fragmentation patterns of peptide upon 157 nm UVPD and the absence of significant “preferential” cleavages that often dominated CID spectra (such as cleavage of amide bonds N-terminal to Pro or C-terminal to Asp and Glu) motivated Reilly and co-workers to apply this methodology for de novo sequencing of peptides.120,121 This de novo/UVPD method was demonstrated for sequencing tryptic peptides from ribosomal proteins, culminating in the identification of 49 ribosomal proteins (out of 52 expected) as well as 52 modifications (from post-translational modification or sample processing).121 An example of a UVPD mass spectrum obtained for a tryptic peptide from ribosomal protein L24 is shown in Figure 10.121 C-terminus ions, especially x-type ions, dominated the spectrum due to proton localization at the guanidinated C-terminus lysine (K*).121 De novo sequencing was facilitated by the production of a complete series of x ions, as well as the v3 and w3 side-chain less ions that allowed confident assignment of the ninth residue as isoleucine, not leucine.121 The Kim group has undertaken many of the most fundamental and kinetic studies of UVPD at 193 nm for peptides.36,37,126–128 It has been proposed that the mechanism for UVPD at 193 nm is similar to the one postulated for 157 nm with the peptide amide group serving as a particularly good chromophore (π to π*) around 190 nm.
Figure 10.
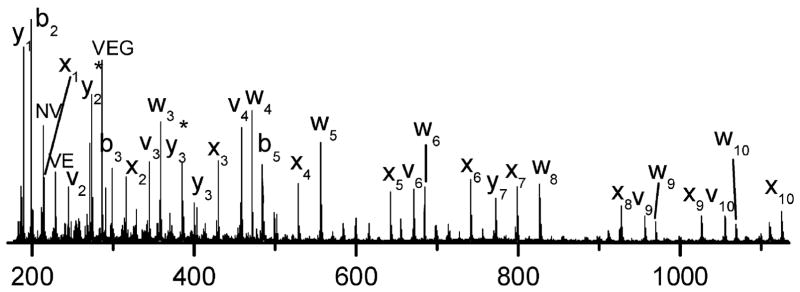
Photodissociation mass spectrum of protonated peptide VVVEGVNVITK* (ionized by MALDI) from a tryptic digest of ribosomal protein L24 after guanidination of the digest (where K* represents guanidinated lysine). The observation of the v3 and w3 side-chain loss ions confirm that the third residue from the C-terminus of the peptide is isoleucine, not leucine. Adapted from reference 121. Copyright American Chemical Society 2010.
Since many organic molecules exhibit some degree of photoabsorptivity at 157 nm or 193 nm, there have been many applications of UVPD at these two wavelengths with recent studies showcasing the analysis of nucleic acids, peptides, glycopeptides, glycans, lipids, gangliosides, and oligosaccharides in both the positive and negative modes.111–148 In essence, the UVPD process is independent of the charge polarity of the ion, making it particularly versatile for analysis of both cations and anions. Reilly was the first to report the rich fragmentation patterns obtained upon UVPD at 157 nm of sodium-cationized oligosaccharides.112,113 The UVPD mass spectra displayed B, Y, and Z ions due to glycosidic cleavages as well as X-type cross-ring cleavage ions. Thus, the ability to generate meaningful cross-ring cleavages is an advantage of UVPD methods for characterization of oligosaccharides and glycans (in which glycans are oligosaccharides released from glycoproteins).112 A follow-up UVPD study of sodium-cationized permethylated sialylated and non-acidic N-glycans exhibited numerous A- and X-type cross-ring cleavage product ions.113 As shown in Figure 11, A-type cross-ring cleavages originate from the non-reducing end of the glycan, whereas the X-type ions arise from the reducing end. Although the B/Y and C/Z ions are most diagnostic for the sugars contained in the oligosaccharides, it is the A/X cross-ring cleavage products that are particularly useful for characterization of the branching patterns of oligosaccharides and glycans.
Figure 11.
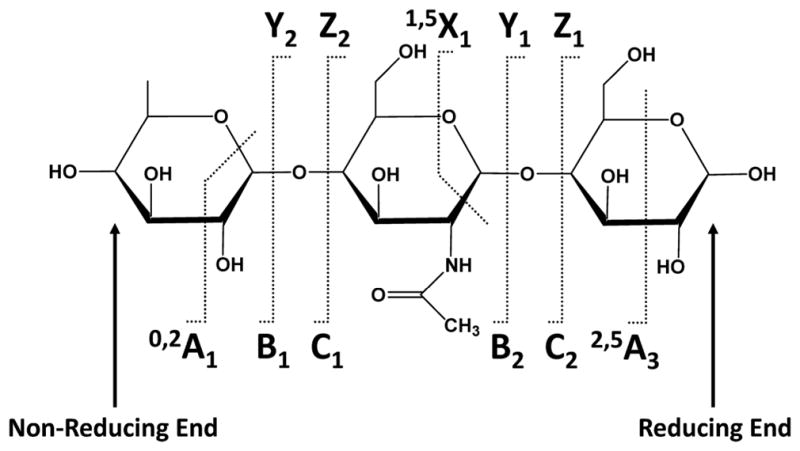
Nomenclature for fragmentation of oligosaccharides.
Despite the fact that sialic acid is one of the most important monosaccharides due to its role in cell-cell communication and as a binding site for pathogens, sialylation is in fact one of the more challenging modifications to monitor by mass spectrometry because of its lability and its production of few fragment ions that reveal its linkage information.149 MS/MS studies of sialylated glycans have generally been undertaken in the positive mode after stabilization of the sialic acid groups via esterification or permethylation followed by CID.150 Glycans with underivatized sialic acid groups typically undergo neutral losses of the sialic acid groups. Brodbelt et al. employed 193 nm UVPD to interrogate sialylated oligosaccharides and glycans as deprotonated species (rather than as permethylated sodium-cationized species).133 In comparison to CID which predominantly generated B/Y- and C/Z-type ions, UVPD led to numerous A and X cross-ring cleavages which facilitated the determination of the branching patterns, as well as the unique loss of 62 Da specific to the sialic acid group.133 In general, the UVPD fragmentation patterns are far richer than those obtained by CID, as exemplified by the cleavage map shown in Figure 12 for a two antenna glycan from fetuin containing one sialic acid.133 The ability to characterize the glycans in the negative mode by UVPD alleviated the need for permethylation.
Figure 12.

MS/MS fragmentation maps of deprotonated [2Ant1SiA - H]− (a two antenna glycan from feturin, m/z 1930) by CID and 193 nm UVPD with 20 pulses. Reprinted with permission from reference 133. Copyright American Chemical Society 2011.
Lipopolysaccharides (LPS) are complex glycolipids found on the surfaces of Gram-negative bacteria which activate the immune system during infections.151 LPS are comprised of polysaccharide chains and a lipid core (lipid A) which anchors the LPS to the cell membrane.151 The lipid A constituent consists of a hydrophilic diglucosamine backbone with various hydrophobic fatty acid appendages. This dual nature makes lipid A and lipopolysaccharides difficult to ionize and separate and challenging to characterize by MS/MS methods, especially since even minor structural variations in the phosphorylation and acylation patterns may result in a substantial change in the endotoxic response upon exposure to LPS of bacteria. CID has been the most popular tandem MS method for the structural characterization of lipid A, albeit with limited production of diagnostic fragment ions primarily from C-O cleavages that result in neutral losses of phosphate groups and fatty acid chains.152 UVPD at 193 nm results in a much greater array of product ions arising from amide and C-C cleavages along fatty acid chains as well as cross-ring and inter-ring glucosamine cleavages due to high energy, single photon absorption.130 UVPD also promotes preferential cleavages at phosphorylethanolamine and hydroxyl modifications that allow unusual modifications to be mapped.132,139 An example of the contrasting fragmentation maps obtained by CID and UVPD of deprotonated lipid A from Helicobacter pylori is shown in Figure 13.130 Each cleavage site that led to diagnostic product ions is numbered in Figure 13, and simple visual inspection shows the much larger array of cleavage sites upon UVPD compared to CID. The richness of the UVPD method proved crucial for elucidating the position of key hydroxyl, glycine and diglycine groups in lipid A from Vibrio cholera. These modifications of lipid A confer resistance to polymyxin B, a cationic antimicrobial peptide whose innate bioactivity arises from disruption of the Gram-negative bacterial membrane.139
Figure 13.

Fragmentation maps of H. pylori lipid A (MW 1548.2) by (a) CID, 1-, and (b) 193 nm UVPD, 1-. Dashed lines represent cleavage sites and are matched with the m/z values to the right of each structure. Key cleavages seen for UVPD that were not observed for CID are marked with red lines. Reprinted with permission from Reference 130. Copyright American Chemical Society 2011.
Gangliosides are another class of complex glycolipids that have proven challenging for structural elucidation by conventional CID methods. Gangliosides are considered glycosphingolipids that contain hydrophobic chains (ceramide) and an oligosaccharide head group.153 Determination of the structures is exacerbated by the number of structural features that are variable, including the number and type of saccharides in the glycan moiety, and the lengths, positions, and configurations of the carbon chains of both the sphingoid base and fatty acid tail. UVPD using 193 nm photons promotes glycosidic cross-ring cleavages, and C-C and C-N bond cleavages at the sphingosine and fatty acid groups that facilitate characterization of the lipid chains and structures of the glycans.147 A comparison of CID, HCD, and UVPD spectra for a bovine milk ganglioside GM3 is shown in Figure 14. The CID and HCD spectra are dominated by a few glycosidic cleavages leading to Y and Z ions (and the prominent B1 ion in the HCD spectrum).147 There is a much more diverse array of fragment ions produced by UVPD, including complementary B/Y and C/Z ions from glycosidic cleavages in addition to A/X cross-ring cleavages that reveal branching patterns of the oligosaccharide chains. In addition, there are a number of characteristic C-C and C-N cleavages that result in the G, O, and E fragment ions which are useful for mapping the ceramide.
Figure 14.

(A) CID, (B) HCD and (C) UVPD mass spectra of the singly deprotonated bovine milk ganglioside GM3(18:1/23:0). The precursor ion is labelled with an asterisk. Fragmentation maps are shown below the series of spectra. For G, O, and T ions, the subscript X designates the total number of carbons in the hydrophobic chain and Y designates the number of unsaturated carbon–carbon bonds in the fragment ion. Reprinted with permission from Reference 147. Copyright American Chemical Society 2013.
An alternative method for the characterization and differentiation of isomeric lipids integrated photodissociation at 266 nm with collisional activation to promote diagnostic fragmentation of the acyl chains, an outcome that allowed elucidation of the position of double bonds and chain branching.154,155 The process entailed complexation of the lipids with a photocaged radical initiator such as 4-iodobenzoic or 4-iodoaniline acid or derivatization to create 4-iodobenzyl esters as the first step.154,155 The derivatization or complexation process was designed to install a UV-labile carbon-iodine bond which initiated radical-directed dissociation156 in the gas phase. After introduction of the modified lipids or lipid complexes into the mass spectrometer by electrospray ionization, absorption of a 266 nm photon led to the selective cleavage of the carbon-iodine bond and thus released a reactive phenyl radical species.154,155 The resulting radical products generated an extensive array of fragment ions upon CID, including those arising from cleavages of key carbon-carbon bonds in the acyl chains that revealed the positions of the double bonds and chain branching points of glycerophospholipids, triacylglycerols and sphingomyelins.
In general, the ability to generate meaningful MS/MS spectra of negatively charged (typically deprotonated) ions has been one of the hallmarks of UVPD in comparison to CID and electron-based activation methods. In the case of deprotonated peptides, CID is dominated by neutral losses of water, CO2 and PTMs with sparse formation of sequence ions.157 The electron-based dissociation methods have been less widely adapted for the analysis of negatively charged ions.158 Electron detachment dissociation and negative electron transfer dissociation (the negative polarity counterparts to ECD and ETD) have produced predictable a/x-type ions for deprotonated peptides, albeit at the expense of low dissociation efficiency. Electron detachment dissociation (EDD), introduced by Zubarev et al., entails irradiation of poly-anions with fast (>10 eV) electrons which induce electron detachment.158 For analytes like multi-deprotonated peptides, EDD results in preferential cleavage of Cα – C bonds, generating radical a• and even electron x ions in addition to c- and z- type ions.158 Negative ETD typically uses rare gas for fluoranthene cations to react with multiply deprotonated ions, producing a- and x-type sequence ions for peptides.159 Considering that half of all proteins and their proteolytic peptides are acidic, the need for MS/MS methods that can characterize molecules that ionize readily in the negative mode is apparent. UVPD of anions has the same requirements of UVPD of cations—a suitable chromophore for photon absorption, then direct dissociation from excited electronic states or fragmentation after internal conversion and intramolecular vibrational redistribution. UVPD of deprotonated peptides using 193 nm photons results in formation of a-/x-type, as well as some d and w side-chain loss ions.69 In some cases, 100% sequence coverage (meaning cleavages at every backbone position to give an entire series of sequence ions) was obtained. Another prominent process upon UVPD of anions is photo-induced electron detachment, a pathway that leads to intact charge-reduced, radical ions, as demonstrated for peptides, proteins, and nucleic acids.160–164
This UVPD strategy using 193 nm photons was exploited to expand the characterization of acidic peptides that would preferentially ionize in the negative mode even if not well-ionized in the positive mode (which is the standard polarity used for most bottom-up proteomics applications, thus favoring ionization of basic peptides that protonate readily).69 UVPD at 193 nm of peptide anions was demonstrated for a mixture of mitogen-activated protein kinases (MAPKs), proteins that modulate proliferation, gene expression, and apoptosis and thus play a critical role in the progression of cancer.69 MAPKs are naturally acidic proteins that generate numerous acidic peptides upon tryptic digestion, making them well suited for analysis in the negative mode. Figure 15 shows the LC trace and representative UV photodissociation mass spectra obtained for two peptides, TLFPGTDHIDQLK from p38MAPKα and LEKLIFEETAR from ERK2, using a single 5 ns UV pulse at 193 nm.69 The two UVPD spectra have ample sequence ions and exhibit good sequence coverage. A more extensive study using whole cell lysates showed that UVPD of negatively charged peptides resulted in identification of peptides (and consequently proteins) not found by conventional CID and ETD in the positive mode.143 The proteomes from Halobacterium sp NRC-1, an archaea that thrives in a high salt environment, and the cytosolic fraction of HeLa cervical cancer cells were explored in this latter study which utilized a high performance Orbitrap mass spectrometer, thus allowing high mass accuracy detection of ions.143 For this set-up, UVPD was implemented in the HCD cell at the back end of the mass spectrometer for easier optical access. UVPD resulted in the identification of 3,663 and 2,350 peptides for the Halo and HeLa tryptic digests, respectively, corresponding to 655 or 645 peptides which were not identified by ETD, HCD, and CID in the positive mode.143 Among the 805 or 619 proteins identified by UVPD for the Halobacterium and HeLa samples, 49 out of 805 were uniquely found for Halobacterium and 50 out of 619 proteins were unique for the HeLa proteome compared to those found by the more conventional MS/MS methods.143 For Halobacterium, which is known to have an acidic proteome (mean isoelectric point of 4.9), 45% of the predicted proteins were identified by combining the negative mode UVPD method with conventional positive mode MS/MS techniques, and in fact UVPD by itself identified 68% of the 1181 proteins found for Halobacterium.143
Figure 15.

LC-MS/UVPD analysis of a mitogen-activated protein kinase (MAPK) mixture; (a) base peak ion chromatogram from a separation using 10 mM piperidine spiked into LC eluents, (b) UVPD (193 nm) spectra of the p38MAPKα peptide TLFPGTDHIDQLK, 2-, and (c) UVPD (193 nm) spectra of the ERK2 peptide LKELIFEETAR, 3-. A q-value of 0.1 and an activation of one 5 ns (8 mJ) pulse were used for each 193 nm photodissociation spectrum. Neutral losses of H2O, NH3, and CO2 are denoted by °, *, and “, respectively. Reprinted with permission from Reference 69. Copyright Wiley 2011.
UVPD has also proven amenable for identification of sites of post-translational modification (PTM) of proteins based on analysis of proteolytic peptides (or direct analysis of intact proteins, as described later). UVPD is a sufficiently fast and high energy excitation process that peptides undergo backbone cleavages to produce sequence ions on the same time-scale as loss of PTMs. This means that some portion of the sequence ions retain the PTMs, so the attachment sites of the modifications can be readily determined. This contrasts with conventional collisional activation methods, many which are slower, step-wise activation processes that lead to preferential cleavage of the most labile bonds which are often the bonds linking the peptide and PTMs. Loss of the PTMs during peptide activation deters the determination of their locations. Glycosylation is a prevalent type of protein post-translational modification that is known to modulate numerous functional processes in cellular systems.165 Glycosylation occurs via N-linked modification of asparagine or O-linked modification of serine or threonine.165 Characterization of glycosylation of proteins has commonly been accomplished via MS/MS methods via analysis of glycopeptides generated upon enzymatic digestion of glycoproteins or by analysis of glycans released from the glycoproteins (such as PNGaseF which releases N- but not O-glycans).166 CID has been particularly useful for characterization of the free glycan moieties of glycoproteins after the cleavage of the glycans from the proteins, but this method does directly reveal the site of glycosylation. Analysis of glycopeptides (rather than released glycans) has the potential to provide structural information about the peptide and glycan sequences as well as attachment site, but CID preferentially promotes cleavages of the glycan portion, not the peptide sequence. Interestingly, electron-activation methods like ECD and ETD favor peptide backbone cleavages and retention of the intact glycan, thus providing information about peptide sequence and site of modification but not glycan information.166 Although the analysis of glycosylation has proven to be challenging using CID or ETD methods, UVPD has been a promising alternative. Zhang and Reilly reported the use of 157 nm UVPD to generate both glycan and peptide sequence information for protonated N-glycopeptides.118 An example of a UVPD mass spectra obtained after MALDI ionization of one of the N-glycopeptides produced in a tryptic digest of horseradish peroxidase is shown in Figure 16.118 Although the spectra were complicated (as is typically the case for high energy UVPD which opens many fragmentation pathways), the spectra were predictable with both peptide fragment ions (x, v, w, and y ions) and fragment ions arising from cross-ring glycan cleavages (X) and glycosidic products (Y, Z).118 The glycan fragmentation map for this N-glycopeptide is shown in the lower section of Figure 16.
Figure 16.

A) UVPD mass spectrum of protonated N-glycopeptide GLIQSDQELFSSPNATDTIPLVR from horseradish peroxidase in which the glycan is located at residue 14, asparagine. B) Structure of glycan and its fragmentation map. Reprinted with permission from Ref 118. Copyright American Chemical Society 2010.
Brodbelt et al. demonstrated 193 nm UVPD for deprotonated O-glycopeptides in which a/x-type ions were the most commonly observed sequence ions from the peptide portion along with retention of the labile glycan modification.142 Other glycan-specific ions were indicative of glycosidic bond cleavages (B, Y, C, and Z ions) in addition to less frequent cross-ring cleavages. UVPD was incorporated into a complete analytical strategy for glycoproteins entailing digestion of the glycoproteins using a GluC/trypsin cocktail, ZIC-HILIC enrichment of the resulting glycopeptides, then reversed phase nanoLC-UVPD-MS for characterization of the O-glycopeptides.142 Data interpretation was automated using a modified database search algorithm to facilitate assignment of the O-glycopeptides. This approach was used to characterize O-linked acidic glycopeptides from the membrane protein Ompa/MotB from pathogenic bacteria Acinetobacter baumannii, and an example of the UVPD spectrum of one of the pentasaccharide glycopeptides is shown in Figure 17.142 The spectrum displays numerous a/x sequence ions that retain the glycan in addition to glycoside cleavages of the pentasaccharide. The peptide sequence was identified as AASGVE, with pentasaccharide β-GlcNAc3NAcA4OAc-4-(β-GlcNAc-6-)-α-Gal-6-β-Glc-3-β-GalNAc attached to the serine.142
Figure 17.

UVPD of the doubly deprotonated glycopeptide AAS(glycan)GVE from Acinetobacter baumannii Ompa/MotB. Reprinted with permission from reference 142. Copyright American Chemical Society 2013.
Tyrosine sulfation is another labile PTM167 that proves difficult to track by most conventional MS/MS methods. The lability results in the facile loss of sulfate during ionization or upon activation, thus making it challenging to identify the presence or location of the sulfation modification. In one recent study, UVPD was used to identify the sulfation of a tyrosine residue in the Xoo Ax21 (activator of XA21-mediated immunity) protein in the Gram-negative bacterium, Xanthomonoas oryzae pv. oryzae.138 In this case the Ax21 protein was incubated with sulfotransferase RaxST prior to proteolysis by GluC, then subsequent LC-UVPD-MS analysis. The UVPD fragmentation pattern (Figure 18) of the key deprotonated peptide displayed informative a5, a6, a7, x7, and x8 ions with retention of the modification on all of the critical sequence ions, thus confirming the sequence of the peptide (NSLYNFVE) and the sulfation site (the tyrosine which is Y22 in the protein).138 This represented the first confirmation of tyrosine sulfation in a prokaryote.
Figure 18.
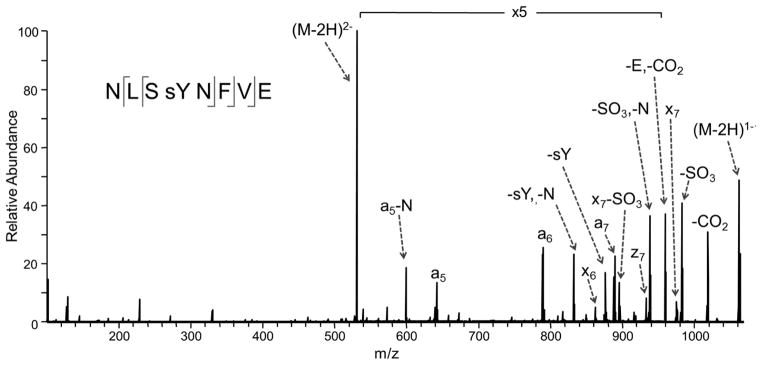
UV photodissociation mass spectrum of Tyr-sulfated peptide NLSYNFVE. The Tyr-sulfated peptide was identified in the GluC digest of Ax21 after incubation with the sulfotransferase RaxST. The spectrum of the doubly deprotonated (2-) peptide was acquired on an Orbitrap Elite mass spectrometer equipped with an excimer laser (193 nm, 500 Hz, 5 ns pulse, 2 mJ per pulse, two pulses per spectrum). UVPD occurred in the higher-energy collisional dissociation (HCD) cell of the Orbitrap Elite mass spectrometer. Reprinted with permission from Reference 138. Copyright Nature Publishing Group 2012.
As described above, the framework for conventional bottom-up proteome analysis is based on the ability to sequence the constituent peptides of an enzymatically digested protein mixture by using MS/MS methods to dissociate the peptides and yield diagnostic fragmentation patterns.2 This general methodology has proven successful for identification of many proteins; however, the ability to completely characterize proteins with respect to post-translational modification and sequence truncations is limited by the shot-gun nature of the bottom-up strategy. In fact, many proteins are identified based on just one or two peptide matches, which means that potential variations in other regions of the protein are not mapped.168 In contrast, the top-down approach is an alternative that involves the MS/MS analysis of intact proteins.21–24 The slower heating methods like CID and IRMPD promote selective cleavage of the most labile bonds in proteins, just as observed for peptides, which can limit the net sequence coverage. Electron-based methods for intact proteins typically provide more extensive fragmentation as well as retention of post-translational modifications, but charge reduction is a prominent competing process. Brodbelt et al. recently reported the implementation of UVPD at 193 nm the HCD cell of an Orbitrap mass spectrometer for characterization of intact proteins using a single 5 ns laser pulse.140 The resulting UVPD mass spectra displayed an array of diagnostic a, b, c, x, y, and z-type fragment ions that provided very high sequence coverage and exhibited little dependence on the size or charge state of the protein.140 UVPD mass spectra of proteins usually are denser than those obtained by collision- or electron-based activation methods (see Figure 19) as exemplified by the UVPD mass spectrum of myoglobin (22+ charge state) with the expansions of two fragment-rich regions shown in the insets of Figure 19.140 The backbone amide groups exhibit high absorption cross-sections at 193 nm, assuring that all proteins are amenable to 193 nm UVPD irrespective of length or sequence. The high mass accuracy of the Orbitrap analyzer was crucial for providing isotopic resolution of the numerous multi-charged ions.
Figure 19.

UVPD mass spectrum of myoglobin (22+) obtained in the HCD cell of an Orbitrap Elite mass spectrometer.140
Shown in Figure 19 is the UVPD fragmentation pattern obtained for myoglobin (17.1 kDa, 154 amino acids) acquired using a single UV pulse. Inspection of the fragment ions reveals that the spectra are dominated by a and z ions with lesser amounts of b, c, x, and y ions.140 Sequence coverage ranges from 88% to 95% for the 15+ to 24+ charge states of myoglobin (Figure 20), values which are comparable for other larger proteins like carbonic anhydrase (29 kDa) and typically greater than the sequence coverages obtained by collision- or electron-based activation methods.
Figure 20.
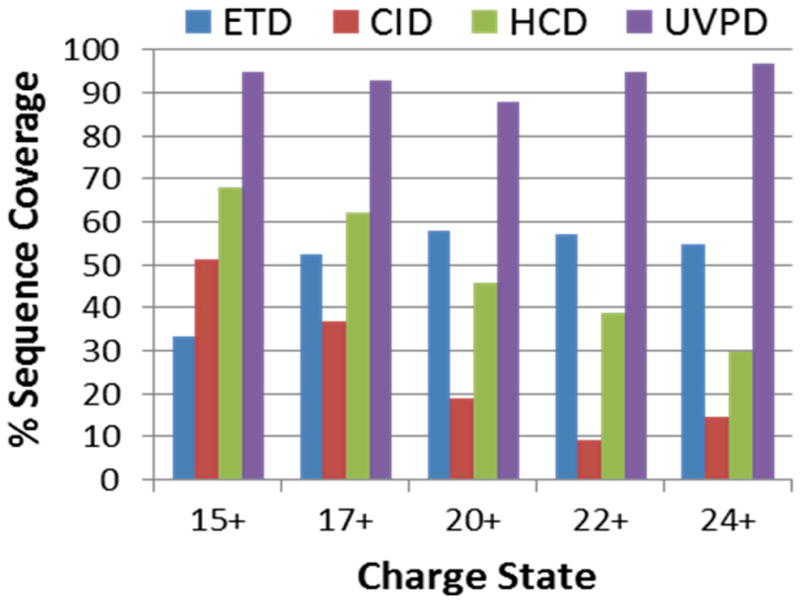
Comparison of sequence coverage obtained for five charge states of myoglobin upon ETD, CID, HCD, and UVPD in an Orbitrap Elite mass spectrometer.140
Collision-based activation methods generally afford better sequence coverage at the termini of intact proteins rather than at their mid-sections. In contrast, UVPD produces fragments throughout the sequence and well into the interior from either direction. For example, the 238 residue sequences of five green fluorescent proteins (GFP) variants were divided into thirds (~80 residues each).145 Figure 21 shows the trends in the depth of coverage, as defined by the total amount of N-terminally derived fragment ions that represent the first third (shorter a, b, c fragment ions), middle third (mid-sized a,b,c ions), and last third (longer a,b,c fragment ions) of the protein sequence.145 In this way, Figure 21 compares the number of N-terminal fragment ions obtained for the first third, middle and final third of the protein sequence for CID, HCD, ETD, and UVPD. All of the ion activation methods favored production of the shorter N-terminal fragment ions, and the drop-off in larger N-terminal fragment ions was particularly dramatic for the CID and HCD methods. UVPD gave a greater number of longer N-terminal ions, thus reflecting the deeper sequence coverage throughout the protein upon UVPD.145 The same trend repeats itself when the C-terminal fragment ions are tabulated. The top down UVPD-MS strategy has been implemented in a higher throughput manner for characterization of intact proteins on a nano liquid chromatographic timescale, as reported for ribosomal proteins from E. coli.169
Figure 21.

Histograms illustrating the proportion of N terminal ions (a, b, and c) terminating at the first eighty (1–80) (left), middle eighty (81–160) (middle), and last 78 (161–238) (right) residues of the 25+ charge state of each GFP variant using CID, HCD, UVPD, and ETD (note that ETD was only performed on the 33+ charge state). All histograms are normalized to the same y-axis. Reprinted with permission from reference 145. Copyright Wiley 2014
The studies described above have mainly focused on UVPD applications undertaken using 157 nm or 193 nm photons, but there have also been a number of studies using 266 nm photons afforded by a frequency-quadrupled Nd:YAG laser. Each 266 nm photon deposits 4.7 eV of energy which is sufficient to cause bond cleavages in biological molecules. For 266 nm UVPD of peptides, it was found that the presence of an amino acid with an aromatic side chain (tryptophan, tyrosine, phenylalanine) was required to ensure efficient photoabsorption and dissociation.53–57
4.1 Bond-selective cleavages
One of the features of UVPD that has spurred additional interest is the observation of unusual or unique fragmentation pathways not observed upon conventional CID. Thus, in addition to the diversity of dissociation routes that contribute to the richness of the resulting MS/MS spectra upon UVPD, in some cases there are highly specific pathways that can be useful for pinpointing structural features of ions. For example, as mentioned above, UVPD at 157 nm and 193 nm can lead to formation of characteristic d and w side-chain loss ions that are useful for differentiation of isoleucine and leucine residues in peptides.120,122 As another example, the formation of an – 97 product ions was observed at each phosphorylated residue of protonated phosphopeptides upon UVPD at 193 nm.128 This selective bond cleavage phenomenon has been noted for UVPD at other wavelengths too, such as a highly specific Cα–Cβ bond cleavage reported for protonated tyrosine-containing peptides upon UVPD at 262 nm (fourth harmonic of a Nd:YLF laser).170 This process resulted in formation of a radical product ion observed 107 Da lower in mass than the precursor upon elimination of the phenolic portion of the tyrosyl residue.170
The observation of such specific bond cleavages upon UVPD has motivated one group to install specific UV-cleavable bonds into target molecules.156,171–177 Julian et al. have reported site-specific UVPD cleavage of iodo-derivatized tyrosines and histidines. In this strategy (illustrated in Figure 22A), peptides or proteins were iodinated at their tyrosine or histidine side-chains, then the fourth harmonic of a Nd:YAG laser (266 nm) was used to cause highly selective photoactivated C-I homolytic bond cleavage with loss of the iodine atom, resulting in product ions containing a localized radical site on the aromatic ring.156,171–173 An example of the selectivity of the C-I bond cleavage induced by 266 nm photoirradiation is shown in Figure 22B for protonated ubiquitin (10+ charge state). In a second step, the radical product ions were subjected to collisional activation to cause cleavage proximate to the original iodo-labeled residues and producing characteristic a-type fragment ions. The histogram in Figure 22C conveys the proximity of a-type fragmentation to the iodinated tyrosine based on the location of the subsequent fragmentation site relative to the original iodinated tyrosin. This strategy allowed the sites of iodination to be localized in proteins and showed that the radical sites arising from C-I bond cleavage typically promoted fragmentation within ten amino acids of the tyrosine site.171 In a related strategy, cysteine residues modified by quinones in peptides and proteins were found to undergo homolytic C-S bond cleavage upon 266 nm photoexcitation, resulting in a radical site at the β-position of cysteine and subsequent backbone cleavage.177 The specificity of this cysteine-selective bond cleavage process allowed the number of cysteine residues to be counted in proteins as well as provided feedback about the solvent accessibility of each cysteine residue.
Figure 22.

(A) Radical-directed dissociation entails iodination of tyrosine residues in a protein which undergoes facile homolytic C-I bond cleavage upon exposure to 266 nm UV photons. CID of the resulting radical species results in dissociation at residues in close sequence proximity to the tyrosine site. (B) UVPD mass spectrum of the +10 charge state of monoiodo-ubiquitin. (C) Histogram showing the proximity of fragmentation relative to the iodinated tyrosine site averaged for several proteins. Adapted from references 171 and 172. Copyright American Chemical Society 2010.
Two other radical directed dissociation strategies were founded on very specific bond cleavages promoted by photon absorption at 266 nm.174–176 Julian and co-workers were also the first to exploit the notable preferential cleavage of S-S bonds upon 266 nm photoexcitation for characterization of tryptic digests or proteins.174 In most proteomic applications of mass spectrometry, disulfide bonds are reduced and alkylated prior to proteolytic digestion of proteins to ensure more efficient enzymatic degradation. The presence of intact disulfide bonds not only deters proteolysis but also impedes the ability to sequence the disulfide-linked peptides. On the other hand, the reduction and alkylation of disulfide bonds, although beneficial for protein digestion, prevents the identification of cysteine linkages in proteins that are critical for elucidating protein structures. Interestingly, peptides that contain disulfide linkages undergo facile homolytic cleavage of the disulfide bond upon exposure to 266 nm photons, thus releasing each of the two constituent peptides, each as radical ions. An example of this clean and prominent cleavage pattern is shown in Figure 23 for disulfide-bonded peptides CGYGPKKKRKVGG and VCYDKSFPISHVR.174 The selectivity for the disulfide bond cleavage is remarkable. In a related application, Julian et al. reported the selective homolytic cleavage of C-S bonds installed in phosphopeptides upon replacement of the phospho modification by a naphthyl-thiol group.175–176 The derivatization of the phosphopeptides was performed in solution via a well-known Michael addition-type reaction. The resulting naphthyl-thiol modified peptides underwent facile C-S bond cleavage upon 266 nm photoexcitation, and the most prominent sequence-specific product ion was a d-type ion arising from loss of the napththylsulfide radical and cleavage C-terminal to the original site of phosphorylation (in which d-type ions correspond to a-type ions after partial loss of the side-chain). This method allowed the sites of phosphorylation of peptides to be pinpointed.
Figure 23.

Absorption of a 266 nm photon results in selective homolytic cleavage of a disulfide-containing peptide, resulting in formation of two peptide products. Reprinted with permission from reference 174. Copyright American Chemical Society 2011.
4.2 Chromophore-selective UVPD
The requirement for a suitable chromophore can be exploited strategically in wavelength-selective, chromophore-specific applications, as reported in several recent applications.178–185 In contrast to the bond-specific cleavages promoted by UVPD described above, in this case a chromophore is attached to the molecule of interest via a covalent tagging reaction for a different purpose. The tagging reaction appends a chromophore that endows the molecules with high photoabsorption cross-sections not exhibited by the non-tagged molecules. This absorption selectivity affords a clever way to target specific molecules—e.g. those modified with chromophores, or to readily differentiate tagged and untagged molecules. For instance, few biomolecules have large absorption cross-sections in the range of 350 nm. However, tagging these molecules with a chromophore at 350 nm converts them into molecules that will absorb photons from the third harmonic of a Nd:YAG laser (355 nm) or an XeF excimer laser (351 nm).58,178–183 This chromophore tagging concept has also been demonstrated using visible photons, specifically 473 nm or 532 nm.184–185 One of the first studies illustrating the strategy of attaching chromophores to molecules to give them unique UV photodissociation behavior was reported in 2007.58 Peptides were derivatized at the N-terminus by coupling 7-amino-4-methyl coumarin-3-acetic acid succinimidyl ester (AMCA, see Figure 24) which contains a strong UV chromophore at 350 nm.58 Only those peptides containing the AMCA chromophore absorbed the 355 nm photons from a frequency tripled Nd:YAG laser, thus providing a high degree of selectivity. Moreover the resulting peptide fragmentation pattern was simplified significantly, exhibiting only y ions.58 The apparent absence of b ions in the UVPD spectra stemmed from their high photoabsorption cross-sections due to the chromophore at the N-terminus. Thus, the b ions were annihilated due to their absorption and subsequent photodissociation (i.e. secondary photodissociation). The complementary chromophore-free y ions did not absorb photons and therefore survived as stable product ions observed in the mass spectra. The peptides could alternatively be tagged at their C-termini which in turn led to production of non-chromophore-containing b ions and chromophore-containing y ions upon UVPD, the latter which were susceptible to secondary UVPD and were thus rapidly eliminated. A comparison of the CID and UVPD spectra of the peptide TGPNLHGLFGR acquired during the LC-MS/MS analysis of a tryptic digest is shown in Figure 24.181
Figure 24.

A) Coupling of 7-amino-4-methyl coumarin-3-acetic acid (AMCA) succinimidyl ester to the N-terminus of a peptide. B) Comparison of sequence ions seen for the AMCA-tagged peptide TGPNLHGLFGR (2+) from a cytochrome C digest by CID and UVPD (15 pulses, 3 mJ). Note the disappearance of b ions going from the CID spectrum to the UVPD spectrum. The precursor ion is labeled with an asterisk. Reprinted with permission from reference 181. Copyright American Chemical Society 2013.
An array of both b and y ions (with retention of the AMCA tag on all the b ions) is observed upon CID, whereas the y ion series is dominant in the UVPD spectrum. The preferential detection of y ions for the AMCA-tagged peptides upon UVPD made this approach a natural fit for adaptation to de novo sequencing.181 De novo sequencing methods offer greater flexibility for mapping unexpected post-translational modifications and sequence mutations than database search methods which rely on matching the MS/MS spectra of peptides to in silico-generated spectra from known proteins. The AMCA/UVPD methodology was demonstrated for characterization of mutant green fluorescent proteins which were combinatorially modified to vary their isoelectric points via substitution of acidic or basic residues for other amino acids. In addition to having unnatural sequences, the engineered GFPs had a high degree of sequence homology that prevented their identification conventional bottom-up MS/MS strategies dependent on database searches (using known proteomes).181 A sequence alignment which shows the similarity in the sequences (and thus the challenge of differentiating them) for the set of GFPs is displayed in Figure 25. The two threonines at positions 38 and 43 of the wild type GFP are the only two amino acids that consistently distinguish this from the variants. GFP 6 was different from the other variants by two residues, including aspartic acid (D) at position 101 and the glutamic acid (E) at position 107. The GFPs were digested and modified with AMCA prior to analysis by LC-UVPD-MS. Analysis of the UVPD spectra using a de novo sequencing algorithm resulted in identification of seven peptides for the wild type protein and ten peptides for one of the variants, GFP6, thus allowing confident identification of each GFP (Figure 25).181 The GEGEGDAT38NGKLT43LK and IELKGID129FK peptides proved to be crucial for differentiation and characterization of the GFPs.
Figure 25.

Results for AMCA-modified green fluorescent protein digests. For each protein, the percent sequence coverage, number of peptides identified, as well as a list of peptides which were identified by de novo sequencing for A) wild type GFP and B) GFP 6 (one of the GFP 14 variants). C) Sequence alignment for all 14 GFP variants: changes to the amino acid sequence are shown in red font and underlined. Reprinted with permission from reference 181. Copyright American Chemical Society 2013.
The concept of chromophore-tagging was extended to oligosaccharides and glycans via reductive amination with chromophores or by hydrazide conjugation.59,179 After reductive amination using a reagent like 6-aminoquinoline or 7-amino-methylcoumarin and UVPD at 355 nm, the chromophore-modified oligosaccharides produced fragment ions from the non-reducing end (A- and C-type ions) in contrast to the Y-type ions commonly observed upon CID.59 In addition to the attachment of chromophores to oligosaccharides or glycans by reductive amination, the chromophores were attached to the reducing ends via hydrazide-conjugation, as demonstrated for fucopentaoses (LNFPs) and lacto-N-difucohexaoses (LNDFHs).179 The two methods of attaching chromophores to oligosaccharides generated different series of cross-ring cleavages upon UVPD and CID. UVPD of hydrazide-conjugated oligosaccharide resulted in 2,4A-type cross-ring cleavage ions, whereas the aminated oligosaccharides predominantly produced 0,1A-type ions.179
More recently the chromophore/selective UVPD approach has been implemented for several other high throughput LC-MS applications. The advantages afforded by highly selective measurement strategies are especially compelling when analyzing complex mixtures that might contain hundreds or thousands of constituents. Indiscriminate MS or MS/MS methods provide broad spectrum analysis of mixtures offset by high false discovery rates and unmatched spectra due to simultaneous analysis of multiple species for which the resulting spectra are composites that confound interpretation. In one recent study, the identification of cysteine-containing peptides was targeted based on modification of single-chain antibody fragments (scAbs) with AlexaFluor 350 maleimide, a thiol-reactive reagent which exhibits strong absorptivity at 351 nm.62 This method was demonstrated for the selective analysis of the diagnostic third heavy chain complementarity determining region (HCDR3) of immunoglobulin G scAbs which possess a highly conserved cysteine residue located N-terminal to the HCDR3 region.62 Many immunoglobulins share high sequence homology in which the complementarity determining regions of the heavy and light chain variable domains provide the key molecular signatures that allow differentiation of IgGs. This tagging method led to the facile identification of cysteine-containing peptides by effectively eliminating convoluting MS/MS data for all unmodified peptides, thereby streamlining the data analysis. The cysteine modification was accomplished using a standard reduction-alkylation process in which Alexa Fluor 350 maleimide was used to selectively modify reduced cysteine residues of the intact proteins via nucleophilic addition, followed by chymotrypsin proteolysis, then nanoLC-UVPD-MS analysis (Figure 26).62 Only peptides containing the AF350 chromophore responded to photoexcitation and dissociated into extensive arrays of b- and y-type fragment ions.
Figure 26.
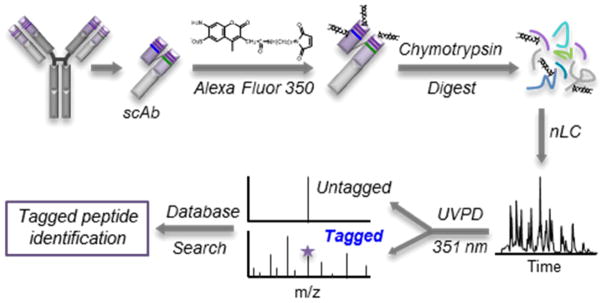
LC–MS/MS workflow based on 351 nm UVPD for the selective analysis of cysteine-containing peptides in complex mixtures. Proteins are subjected to site-specific conjugation at cysteine residues with a chromogenic Alexa Fluor 350 maleimide tag. Modified protein digests are separated by nanoLC and activated by 351 nm UVPD, which promotes selective photodissociation of Alexa Fluor 350 modified peptides. Reprinted with permission from reference 62. Copyright American Chemical Society 2013.
An example of the striking selectivity of 351 nm UVPD is in Figure 27 of a tryptic peptide from bovine serum albumin containing no cysteines (and thus no AF350 tag), HPYFYAPELLYYANK, in comparison to an AF350-modified peptide DDPHACYSTVFDK.62 The non-cysteine peptide showed no fragmentation upon activation by 351 nm UVPD (Figure 27a), whereas significant sequence information was obtained for the AF350-modified peptide (Figure 27b). The extracted ion chromatogram (XIC) of the reporter ion (m/z 296) produced by UVPD (the same type labelled as AF350 for the bovine serum albumin peptide in Figure 27b) allowed the elution of all of the cysteine-peptides to be highlighted within the complex chromatographic profile obtained upon analysis of a chymotryptic digest of a scAb,62 thus facilitating the selective identification of key cysteine-containing peptides of interest.
Figure 27.

351 nm UVPD mass spectra of tryptic BSA peptides (a) HPYFYAPELLYYANK 2+ and (b) Alexa Fluor 350 conjugated DDPHACYSTVFDK 2+ following 351 nm photoirradiation with 10 pulses at 3 mJ. Reprinted with permission from reference 62. Copyright American Chemical Society 2013.
Dugourd, Lemoine et al. implemented a strategy they termed “photo-selected reaction monitoring” in a triple quadrupole mass spectrometer in which molecules were derivatized using a thiol-reactive dye (QSY7 C5-maleimide or dabcyl C2 maleimide) to provide a chromophore in the visible range.184–185 They demonstrated this method for oxytocin, a cysteine-containing peptide, using a continuous wave laser at 532 nm for selective photodissociation of peptides in a human serum digest.184 The use of the laser provided a high degree of detection specificity for the QSY7-labelled cysteine-containing peptides owing to the fact that underivatized peptides did not absorb in the visible range. The photo-selected reaction monitoring resulted in improved sensitivity (a 50-fold improvement in limit of quantification) and a greater linear range of quantitation as demonstrated for detection of QSY-7-labelled-oxytocin in human plasma. An analogous concept was implemented on a linear ion trap mass spectrometer using a 473 nm cw laser and derivatization of cysteine-containing proteolytic peptides with dabcyl C2 maleimide.185 In this case, the analytical goal was quantitation of plasma proteins, and the selective photodissociation method resulted in improved detection limits by up to a factor of ten.
The chromophore-tagging for selective UVPD was also developed into a chemical probe strategy for determining solvent accessibilities of proteins.61,180 Measurement of solvent accessibility based on the reactions of a chemical probe with specific sites of a protein (typically certain reactive side-chains, such as the primary amines of lysines) provides information about protein topology.186 The chemical probe methods rely on monitoring the differential reactivity of targeted residues that reflect specific regions or surfaces of proteins, largely based on tracking modified residues in peptides after proteolytic digestion of the proteins of interest in a bottom-up LC-MS/MS workflow.186 The reactivities of the targeted side-chains of the protein are estimated by quantifying the resulting probe-modified peptides relative to unmodified ones and making the assumption that the more accessible sites will be more reactive with the chemical probe. In this context, the probe-modified peptides are typically found in low abundance and low frequency relative to unmodified peptides because the probe reactions are undertaken at a low stoichiometric ratio to minimize the potential denaturation of the proteins by the chemical probe itself and its perturbation of protein structure. The low abundance and frequency of modified peptides makes the chemical probe strategy more challenging. Brodbelt et al. reported an amine-reactive reagent (Figure 28) that incorporated a UV chromophore at 351 nm, thus allowing the ability to pinpoint and dissociate the diagnostic probe-modified peptides among complex mixtures of unmodified peptides.61,180
Figure 28.
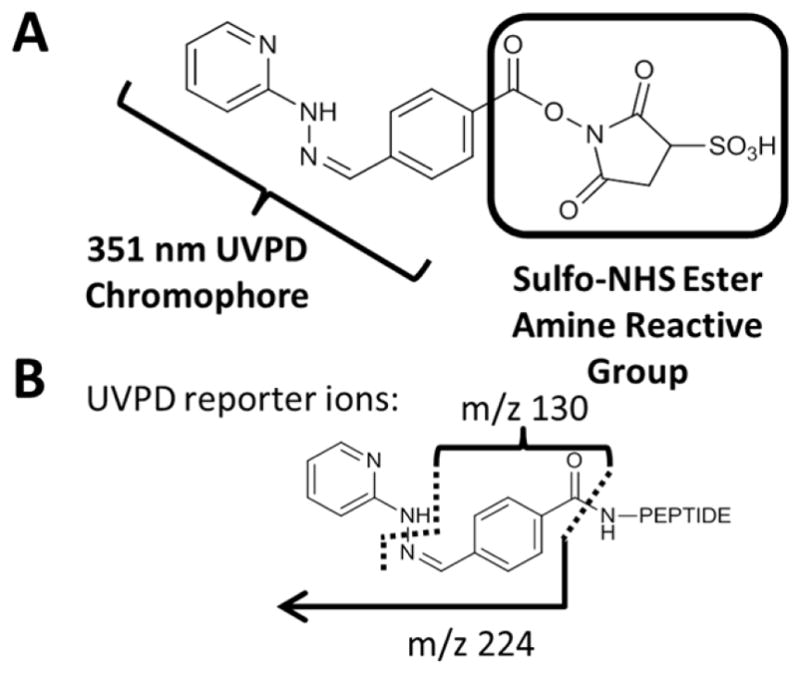
Structure of amine-reactive chemical probe containing a 351 nm UV chromophore. Reprinted with permission from reference 61. Copyright American Chemical Society 2013.
A bottom-up MS/MS approach was used to characterize the NN-modified proteins and identify the specific sites of NN modification (Figure 29). Results were presented for lysozyme and beta-lactoglobulin with and without bound ligands, and for the eukaryotic translation initiation factor 4E, eIF4E, a protein important in protein synthesis, and its complex eIF4F (containing eIF4E and a second protein eIF4G).61,180 As an example lysozyme was reacted with the NN chemical probe at a 7:1 probe:protein ratio, and the most abundant product was the intact protein with an average of one NN modification.61 After enzymatic digestion using one of three proteases, the resulting peptide mixtures were subjected to LC-UVPD-MS and LC-CID-MS analysis, with the former used to pinpoint the elution points of the few NN-modified peptides based on their response to UVPD and the latter used to sequence all of the peptides. Lys96, was the least reactive among the six lysine residues, an outcome which reflects the low solvent accessibility of the residue. The reactivities of Lys1, Lys33, Lys97 and Lys116 were the greatest, an outcome consistent with their greater accessibilities. After complexation of lysozyme with its cognate ligand, N-acetylglucosamine (NAG), some changes were observed in the reactivity of the NN chemical probe with lysozme, including the decrease in reactivity of Lys1, Lys97, and Lys 1116 and the notable increase in reactivity of Lys33.61 The decrease in the reactivities of Lys1, Lys 97 and Lys 116 upon NAG complexes was attributed to the proximity of those residues to the NAG binding site. As showcased in two papers, the chromophore-selective UVPD-MS method permitted the low abundance probe-modified peptides to be pinpointed in complex proteolytic mixtures and to be readily differentiated from unmodified peptides.61,180 The selective UVPD concept was also implemented to differentiate cross-linked peptides from unmodified peptides based on utilizing a bis-aryl hydrazone conjugation agent that exhibited a maximum photoabsorption cross-section around 350 nm, allowing efficient UVPD for the conjugated peptides.60
Figure 29.

Overview of the NN chemical probe/351-nm UVPD strategy. (1) A protein is incubated with NN. NN is denoted by a purple diamond. (2) The protein is enzymatically digested. (3) The mixture of modified and unmodified peptides is analyzed by LC-MS/MS. (4a) NN-modified peptides absorb 351 nm photons, undergo selective fragmentation and are easily pinpointed by the EIC of the reporter ions. (4b) NN peptides are sequenced using their UVPD diagnostic fragmentation patterns. (5) Unmodified peptides do not absorb 351 nm photons and are sequenced by CID. Reprinted with permission from reference 61. Copyright American Chemical Society 2013.
5. Conclusions and Outlook
Photodissociation offers a number of attributes for ion activation/dissociation, including access to high energy, tunable, and well-defined energy deposition. The fact that both precursor ions and product ions may undergo photoactivation and dissociation is a compelling advantage because it may lead to richer spectra by conversion of dead-end fragment ions into informative products. The energy deposition, and consequently the resulting ion fragmentation patterns, depends on the wavelength used for photoactivation and photoabsorption cross-sections of ions, which explains the significant differences in the appearances of IRMPD and UVPD mass spectra. Because the cross-sections arise from the properties of chromophores, it has led to the development of chromophore-specific tagging strategies that have led to a number of highly selective analytical applications of photodissociation as well as affording a means to cause bond-selective cleavages. These features have opened a number of new frontiers for photodissociation mass spectrometry and allowed exploration of its dual roles for ion activation and ion reactions. There is also interest in exploring the merits of other wavelength ranges and light sources for photodissociation. Preliminary results demonstrating the use of UV lamps for photodissociation have also stirred interest in the feasibility of implementing photodissociation without the need for a laser.
The photodissociation applications described in this review all involve excitation and fragmentation of analyte ions at a single wavelength with the primary emphasis on structural characterization, in some cases with some chromophore-selectivity. A related field that has grown rapidly involves the acquisition of photodissociation spectra as a function of the photon wavelength.28–32,187–189 In this type of experimental strategy, often termed photodissociation action spectroscopy, the photodissociation yield (based on the abundances of the precursor and collective fragment ions) is monitored across a range of wavelengths in order to create a “spectrum”. This methodology requires the use of a tunable light source, such as a free electron laser or an optical parametric oscillator (OPO) laser. Most spectroscopic applications to date have focused on the IR region to generate molecular fingerprints of gas-phase ions, although some studies in the UV range have started to emerge. This type of ion spectroscopy affords tremendous structural detail that has been used to differentiate isomers and provide conclusive feedback about the structures adopted by ions in the gas phase. The increasing prevalence of affordable tunable lasers is likely to accelerate the field of ion spectroscopy, although applications of photodissociation for characterization of constituents of complex mixtures are likely to remain restricted to single wavelengths due to the throughput limitations of multi-wavelength data collection.
Acknowledgments
Funding from the National Science Foundation (CHE1012622), National Institutes of Health (RO1GM103655 and GM099028), and the Welch Foundation (F1155) is gratefully acknowledged.
References
- 1.Griffiths WJ, Wang Y. Chem Soc Rev. 2009;38:1882–1896. doi: 10.1039/b618553n. [DOI] [PubMed] [Google Scholar]
- 2.Yates JR, Ruse CI, Nakorchevsky A. Annu Rev Biomed Eng. 2009;11:49–79. doi: 10.1146/annurev-bioeng-061008-124934. [DOI] [PubMed] [Google Scholar]
- 3.Benesch JL, Ruotolo BT. Curr Opin Structural Biol. 2011;21:641–649. doi: 10.1016/j.sbi.2011.08.002. [DOI] [PMC free article] [PubMed] [Google Scholar]
- 4.Robinson CV. Cold Spring Harbor Protocols. 2009 doi: 10.1101/pdb.prot5180. pdb prot5180. [DOI] [PubMed] [Google Scholar]
- 5.Beglarek U, Leichtle A, Brugel M, Kortz L, Brauer R, Bresler K, Thiery J, Fiedler GM. Mol Cellularl Endocrinology. 2009;301:266–271. doi: 10.1016/j.mce.2008.10.013. [DOI] [PubMed] [Google Scholar]
- 6.Mishur RJ, Rea SL. Mass Spectrom Rev. 2012;31:70–95. doi: 10.1002/mas.20338. [DOI] [PubMed] [Google Scholar]
- 7.Sleno L, Volmer DA. J Mass Spectrom. 2004;39:1091–1112. doi: 10.1002/jms.703. [DOI] [PubMed] [Google Scholar]
- 8.Zubarev RA. Curr Opin Biotech. 2004;15:12–16. doi: 10.1016/j.copbio.2003.12.002. [DOI] [PubMed] [Google Scholar]
- 9.Zubarev RA, Zubarev ZR, Savitski MM. J Am Soc Mass Spectrom. 2008;19:753–761. doi: 10.1016/j.jasms.2008.03.007. [DOI] [PubMed] [Google Scholar]
- 10.Syka JEP, Coon JJ, Schroeder MJ, Shabanowitz J, Hunt DF. Proc Natl Acad Sci. 2004;101:9528–9533. doi: 10.1073/pnas.0402700101. [DOI] [PMC free article] [PubMed] [Google Scholar]
- 11.Coon JJ. Anal Chem. 2009;81:3208–3215. doi: 10.1021/ac802330b. [DOI] [PMC free article] [PubMed] [Google Scholar]
- 12.Grill V, Shen J, Evans C, Cooks RG. Rev Sci Instrum. 2001;72:3149–3179. [Google Scholar]
- 13.Dongre AR, Somogyi A, Wysocki VH. J Mass Spectrom. 1996;31:339. doi: 10.1002/(SICI)1096-9888(199604)31:4<339::AID-JMS322>3.0.CO;2-L. [DOI] [PubMed] [Google Scholar]
- 14.McLuckey SA, Huang TY. Anal Chem. 2009;81:8669–8676. doi: 10.1021/ac9014935. [DOI] [PMC free article] [PubMed] [Google Scholar]
- 15.McLuckey SA, Mentinova M. J Am Soc Mass Spectrom. 2011;22:3–12. doi: 10.1007/s13361-010-0004-9. [DOI] [PMC free article] [PubMed] [Google Scholar]
- 16.Ly T, Julian RR. Angew Chem Int Ed. 2009;48:7130–7137. doi: 10.1002/anie.200900613. [DOI] [PubMed] [Google Scholar]
- 17.Reilly JP. Mass Spectrom Rev. 2009;28:425–447. doi: 10.1002/mas.20214. [DOI] [PMC free article] [PubMed] [Google Scholar]
- 18.Brodbelt JS, Wilson JJ. Mass Spectrom Rev. 2009;28:390–424. doi: 10.1002/mas.20216. [DOI] [PubMed] [Google Scholar]
- 19.Brodbelt JS. J Am Soc Mass Spectrom. 2011;22:197–206. doi: 10.1007/s13361-010-0023-6. [DOI] [PubMed] [Google Scholar]
- 20.Dunbar RC. Principles of Mass Spectrometry Applied to Biomolecules. 2006:337–377. [Google Scholar]
- 21.Zhou H, Ning Z, Starr AE, Abu-Farha M, Figeys D. Anal Chem. 2012;84:720–734. doi: 10.1021/ac202882y. [DOI] [PubMed] [Google Scholar]
- 22.Kellie JF, Tran JC, Lee JE, Ahlf DR, Thomas HM, Ntai I, Catherman AD, Durbin KR, Zamdborg L, Vellaichamy A, Thomas PM, Kelleher NL. Molecular BioSystems. 2010;6:1532–1539. doi: 10.1039/c000896f. [DOI] [PMC free article] [PubMed] [Google Scholar]
- 23.Armirotti A, Damonte G. Proteomics. 2010;10:3566–3576. doi: 10.1002/pmic.201000245. [DOI] [PubMed] [Google Scholar]
- 24.Cui W, Rohrs HW, Gross ML. Analyst. 2011;136:3854–3864. doi: 10.1039/c1an15286f. [DOI] [PMC free article] [PubMed] [Google Scholar]
- 25.Blackwell AE, Dodds ED, Bandarian V, Wysocki VH. Anal Chem. 2011;83:2862–2865. doi: 10.1021/ac200452b. [DOI] [PMC free article] [PubMed] [Google Scholar]
- 26.Zhou M, Jones CM, Wysocki VH. Anal Chem. 2013;85:8262–8267. doi: 10.1021/ac401497c. [DOI] [PubMed] [Google Scholar]
- 27.Baer T, Dunbar RC. J Am Soc Mass Spectrom. 2010;21:681–693. doi: 10.1016/j.jasms.2010.01.028. [DOI] [PubMed] [Google Scholar]
- 28.Polfer NC, Oomens J. Mass Spectrom Rev. 2009;28:468–494. doi: 10.1002/mas.20215. [DOI] [PubMed] [Google Scholar]
- 29.Eyler JR. Mass Spectrom Rev. 2009;28:448–467. doi: 10.1002/mas.20217. [DOI] [PubMed] [Google Scholar]
- 30.Antoine R, Dugourd P. Phys Chem Chem Phys. 2011;12:16494–16509. doi: 10.1039/c1cp21531k. [DOI] [PubMed] [Google Scholar]
- 31.Polfer NC. Chem Soc Rev. 2011;40:2211–2221. doi: 10.1039/c0cs00171f. [DOI] [PubMed] [Google Scholar]
- 32.Brunet C, Antoine R, Dugourd P, Canon F, Giuliani A, Nahon L. J Am Soc Mass Spectrom. 2012;23:274–281. doi: 10.1007/s13361-011-0285-7. [DOI] [PubMed] [Google Scholar]
- 33.Woodin RR, Bomse DS, Beauchamp JL. In: Chemical and Biochemical Applications of Lasers. Moore CB, editor. IV. Academic Press; New York: 1979. pp. 355–388. [Google Scholar]
- 34.Morgan JW, Hettick JM, Russell DH. Methods Enzym. 2005;402:186–209. doi: 10.1016/S0076-6879(05)02006-9. [DOI] [PubMed] [Google Scholar]
- 35.Morgan JW, Russell DH. J Am Soc Mass Spectrom. 2006;17:721–729. doi: 10.1016/j.jasms.2006.02.004. [DOI] [PubMed] [Google Scholar]
- 36.Moon JH, Yoo SH, Kim MS. Rapid Commun Mass Spectro. 2005;19:3248–3252. doi: 10.1002/rcm.2184. [DOI] [PubMed] [Google Scholar]
- 37.Moon JH, Shin YS, Cha HJ, Kim MS. Rapid Commun Mass Spectrom. 2007;21:359–368. doi: 10.1002/rcm.2855. [DOI] [PubMed] [Google Scholar]
- 38.Zhang L, Reilly JP. Anal Chem. 2009;81:7829–7838. doi: 10.1021/ac9012557. [DOI] [PMC free article] [PubMed] [Google Scholar]
- 39.Guan ZQ, Kelleher NL, O’Connor PB, Aaserud DJ, Little DP, McLafferty FW. International Journal of Mass Spectrometry and Ion Processes. 1996;157:1996. [Google Scholar]
- 40.Little DP, Speir JP, Senko MW, O’Connor PB, McLafferty FW. Anal Chem. 1994;66:2809–2815. doi: 10.1021/ac00090a004. [DOI] [PubMed] [Google Scholar]
- 41.Lancaster KS, An HJ, Li B, Lebrilla CB. Anal Chem. 2006;78:4990–4997. doi: 10.1021/ac0600656. [DOI] [PubMed] [Google Scholar]
- 42.Cooper HJ, Tatham MH, Heath JK, Lam TT, Marshall AG, Hay RT. Anal Chem. 2005;77:6310–6310. doi: 10.1021/ac058019d. [DOI] [PubMed] [Google Scholar]
- 43.March RE. Mass Spectrom Rev. 2009;28:961–989. doi: 10.1002/mas.20250. [DOI] [PubMed] [Google Scholar]
- 44.Douglas DJ, Frank AJ, Mao D. Mass Spectrom Rev. 2005;24:1–29. doi: 10.1002/mas.20004. [DOI] [PubMed] [Google Scholar]
- 45.Stephenson JL, Booth MM, Shalosky JA, Eyler JR, Yost RA. J Am Soc Mass Spectrom. 1994;5:886–893. doi: 10.1016/1044-0305(94)87013-6. [DOI] [PubMed] [Google Scholar]
- 46.Colorado A, Shen JX, Vartanian VH, Brodbelt J. Anal Chem. 1996;68:4033–4043. doi: 10.1021/ac9600565. [DOI] [PubMed] [Google Scholar]
- 47.Gardner MA, Ledvina AR, Smith S, Madsen J, Schwartz GC, Stafford GC, Coon JJ, Brodbelt JS. Anal Chem. 2009;81:8109–8118. doi: 10.1021/ac901313m. [DOI] [PMC free article] [PubMed] [Google Scholar]
- 48.Vasicek LA, Ledvina AR, Shaw J, Griep-Raming J, Westphall MS, Coon JJ, Brodbelt JS. J Am Soc Mass Spectrom. 2011;22:1105–1108. doi: 10.1007/s13361-011-0119-7. [DOI] [PMC free article] [PubMed] [Google Scholar]
- 49.Olsen JV, Macek B, Lange O, Makarov A, Horning S, Mann M. Nat Methods. 2007;4:709–12. doi: 10.1038/nmeth1060. [DOI] [PubMed] [Google Scholar]
- 50.Kalcic CL, Gunaratne TC, Jones AD, Dantus M, Reid GE. J Am Chem Soc. 2009;131:940–942. doi: 10.1021/ja8089119. [DOI] [PubMed] [Google Scholar]
- 51.Smith SA, Kalcic CL, Safran KA, Stemmer PM, Dantus M, Reid GE. J Am Soc Mass Spectrom. 2010;21:2031–2040. doi: 10.1016/j.jasms.2010.08.016. [DOI] [PubMed] [Google Scholar]
- 52.Smith SA, Kalcic CL, Cui L, Reid GE. Rapid Commun Mass Spectrom. 2013;27:2807–2817. doi: 10.1002/rcm.6750. [DOI] [PubMed] [Google Scholar]
- 53.Oh JW, Moon JH, Kim MS. Rapid Comm Mass Spectrom. 2004;18:2706–2712. doi: 10.1002/rcm.1679. [DOI] [PubMed] [Google Scholar]
- 54.Oh JW, Moon JH, Kim MS. J Mass Spectrom. 2005;40:899–907. doi: 10.1002/jms.866. [DOI] [PubMed] [Google Scholar]
- 55.Tao Y, Quebbemann NR, Julian RR. Anal Chem. 2012;84:6814–6820. doi: 10.1021/ac3013434. [DOI] [PubMed] [Google Scholar]
- 56.Lai CK, Ng DC, Pang HF, Le Blanc JC, Hager JW, D-CF, Cheung AS-C, Chu IK. Rapid Commun Mass Spectrom. 2013;27:1119–1127. doi: 10.1002/rcm.6545. [DOI] [PubMed] [Google Scholar]
- 57.Shin YS, Moon JH, Kim MS. Anal Chem. 2011;83:1704–1708. doi: 10.1021/ac1028352. [DOI] [PubMed] [Google Scholar]
- 58.Wilson J, Brodbelt JS. Anal Chem. 2007;79:7883–7892. doi: 10.1021/ac071241t. [DOI] [PubMed] [Google Scholar]
- 59.Wilson J, Brodbelt JS. Anal Chem. 2008;80:5186–5196. doi: 10.1021/ac800315k. [DOI] [PubMed] [Google Scholar]
- 60.Gardner MW, Brodbelt JS. Anal Chem. 2009;81:4864–4872. doi: 10.1021/ac9005233. [DOI] [PubMed] [Google Scholar]
- 61.O’Brien JO, Pruet J, Brodbelt JS. Anal Chem. 2013;85:7391–7397. doi: 10.1021/ac401305f. [DOI] [PubMed] [Google Scholar]
- 62.Cotham VC, Wine Y, Brodbelt JS. Anal Chem. 2013;85:5577–5585. doi: 10.1021/ac400851x. [DOI] [PubMed] [Google Scholar]
- 63.Kim TY, Reilly JP. J Am Soc Mass Spectrom. 2009;20:2334–2341. doi: 10.1016/j.jasms.2009.08.021. [DOI] [PubMed] [Google Scholar]
- 64.Kim TY, Thompson MS, Reilly JP. Rapid Commun Mass Spectrom. 2005;19:1657–1665. doi: 10.1002/rcm.1969. [DOI] [PubMed] [Google Scholar]
- 65.Devakumar A, Thompson MS, Reilly JP. Rapid Comm Mass Spectrom. 2005;192:2313–2320. doi: 10.1002/rcm.2058. [DOI] [PubMed] [Google Scholar]
- 66.Fung YM, Kjeldsen F, Silivra OA, Chan TWD, Zubarev RA. Angew Chemie Int Ed. 2005;44:6399–6403. doi: 10.1002/anie.200501533. [DOI] [PubMed] [Google Scholar]
- 67.Madsen J, Boutz D, Brodbelt JS. J Proteome Research. 2010;9:4205–4214. doi: 10.1021/pr100515x. [DOI] [PMC free article] [PubMed] [Google Scholar]
- 68.Vasicek L, Brodbelt JS. Anal Chem. 2010;82:9441–9446. doi: 10.1021/ac102126s. [DOI] [PubMed] [Google Scholar]
- 69.Madsen J, Kaoud T, Dalby K, Brodbelt JS. Proteomics. 2011;11:1329–1334. doi: 10.1002/pmic.201000565. [DOI] [PMC free article] [PubMed] [Google Scholar]
- 70.Lai CK, Ng DC, Pang HF, Le Blanc JC, Hager JW, D-CF, Cheung AS-C, Chu IK. Rapid Commun Mass Spectrom. 2013;27:1119–1127. doi: 10.1002/rcm.6545. [DOI] [PubMed] [Google Scholar]
- 71.Racaud A, Antoine R, Joly L, Mesplet N, Dugourd P, Lemoine J. J Am Soc Mass Spectrom. 2009;20:1645–1651. doi: 10.1016/j.jasms.2009.04.022. [DOI] [PubMed] [Google Scholar]
- 72.Gabelica V, Rosu F, De Pauw E, Lamaire J, Gillet JC, Poully JC, Lecomte F, Gregoire G, Scherman JP, Desfrancois C. J Am Chem Soc. 2008;130:1810–1811. doi: 10.1021/ja077321w. [DOI] [PubMed] [Google Scholar]
- 73.Stedwell CN, Patrick AL, Gulyuz K, Polfer NC. Anal Chem. 2012;84:9907–9912. doi: 10.1021/ac3023058. [DOI] [PubMed] [Google Scholar]
- 74.Tabarin T, Antoine R, Broyer M, Dugourd P. Rapid Commun Mass Spectrom. 2005;19:2883–2892. doi: 10.1002/rcm.2124. [DOI] [PubMed] [Google Scholar]
- 75.Canon F, Milosavljevic AR, van der Rest G, Refregiers M, Nahon L, Sarni-Manchado P, Cheynier V, Giuliani A. Angew Chem. 2013;125:8535–8539. doi: 10.1002/anie.201304046. [DOI] [PubMed] [Google Scholar]
- 76.Brunet C, Antoine R, Dugourd P, Canon F, Giuliani A, Nahon L. J Chem Phys. 2013;138:064301. doi: 10.1063/1.4790165. [DOI] [PubMed] [Google Scholar]
- 77.Goolsby BJ, Brodbelt JS. J Mass Spectrom. 1998;33:705–712. doi: 10.1002/1096-9888(200008)35:8<1011::AID-JMS29>3.0.CO;2-R. [DOI] [PubMed] [Google Scholar]
- 78.Vartanian V, Goolsby B, Brodbelt JS. J Am Soc Mass Spectrom. 1998;9:1089–1098. [Google Scholar]
- 79.Shen J, Brodbelt JS. The Analyst. 2000;125:641–650. [Google Scholar]
- 80.Goolsby B, Brodbelt JS. J Mass Spectrom. 2000;35:1011–1024. doi: 10.1002/1096-9888(200008)35:8<1011::AID-JMS29>3.0.CO;2-R. [DOI] [PubMed] [Google Scholar]
- 81.Goolsby BJ, Brodbelt JS. Anal Chem. 2001;73:1270–1276. doi: 10.1021/ac001161o. [DOI] [PubMed] [Google Scholar]
- 82.Crowe MC, Goolsby BJ, Hergenrother P, Brodbelt JS. J Am Soc Mass Spectrom. 2002;13:630–649. doi: 10.1016/S1044-0305(02)00366-5. [DOI] [PubMed] [Google Scholar]
- 83.Keller KM, Brodbelt JS. Anal Biochem. 2004;326:200–210. doi: 10.1016/j.ab.2003.12.010. [DOI] [PubMed] [Google Scholar]
- 84.Gardner MW, Li N, Ellington AD, Brodbelt JS. J Am Soc Mass Spectrom. 2010;21:580–91. doi: 10.1016/j.jasms.2009.12.011. [DOI] [PMC free article] [PubMed] [Google Scholar]
- 85.Parr C, Brodbelt JS. J Mass Spectrom. 2010;45:1098–1103. doi: 10.1002/jms.1780. [DOI] [PMC free article] [PubMed] [Google Scholar]
- 86.Doussineau T, Antoine R, Santacreu M, Dugourd P. J Phys Chem Letters. 2012;3:2141–2145. doi: 10.1021/jz300844e. [DOI] [PubMed] [Google Scholar]
- 87.Wilson J, Brodbelt JS. Anal Chem. 2007;79:2067–2077. doi: 10.1021/ac061946f. [DOI] [PMC free article] [PubMed] [Google Scholar]
- 88.Mazzitelli CL, Brodbelt JS. Anal Chem. 2007;79:4636–4647. doi: 10.1021/ac070145p. [DOI] [PMC free article] [PubMed] [Google Scholar]
- 89.Smith SI, Brodbelt JS. Analyst. 2010;135:943–952. doi: 10.1039/b924023c. [DOI] [PMC free article] [PubMed] [Google Scholar]
- 90.Pierce S, Guziec L, Guziec F, Brodbelt JS. Chem Res Tox. 2010;23:1097–1104. doi: 10.1021/tx1000738. [DOI] [PMC free article] [PubMed] [Google Scholar]
- 91.Xu Z, Shaw JB, Brodbelt JS. J Am Soc Mass Spectrom. 2013;24:265–273. doi: 10.1007/s13361-012-0532-6. [DOI] [PMC free article] [PubMed] [Google Scholar]
- 92.Xu Z, Brodbelt JS. J Am Soc Mass Spectrom. 2014;25:71–79. doi: 10.1007/s13361-013-0755-1. [DOI] [PMC free article] [PubMed] [Google Scholar]
- 93.Flora JW, Muddiman DC. J Am Soc Mass Spectrom. 2004;15:121–127. doi: 10.1016/j.jasms.2003.10.004. [DOI] [PubMed] [Google Scholar]
- 94.Hashimoto Y, Hasegawa H, Waki I. Rapid Commun Mass Spectrom. 2004;18:2255–2259. doi: 10.1002/rcm.1619. [DOI] [PubMed] [Google Scholar]
- 95.Payne AH, Glish GL. Anal Chem. 2001;73:3542–3548. doi: 10.1021/ac010245+. [DOI] [PubMed] [Google Scholar]
- 96.Newsome GA, Glish GL. J Am Soc Mass Spectrom. 2009;20:1127–1131. doi: 10.1016/j.jasms.2009.02.003. [DOI] [PubMed] [Google Scholar]
- 97.Crowe M, Brodbelt JS. J Am Soc Mass Spectrom. 2004;15:1581–1592. doi: 10.1016/j.jasms.2004.07.016. [DOI] [PubMed] [Google Scholar]
- 98.Crowe MC, Brodbelt JS. Anal Chem. 2005;77:5726–5734. doi: 10.1021/ac0509410. [DOI] [PubMed] [Google Scholar]
- 99.Wilson JJ, Brodbelt JS. Anal Chem. 2006;78:6855–6862. doi: 10.1021/ac060760d. [DOI] [PubMed] [Google Scholar]
- 100.Vasicek LA, Wilson JJ, Brodbelt JS. J Am Soc Mass Spectrom. 2009;20:377–384. doi: 10.1016/j.jasms.2008.10.016. [DOI] [PubMed] [Google Scholar]
- 101.Madsen JA, Brodbelt JS. J Am Soc Mass Spectrom. 2009;20:349–358. doi: 10.1016/j.jasms.2008.10.018. [DOI] [PubMed] [Google Scholar]
- 102.Gardner MA, Ledvina AR, Smith S, Madsen J, Schwartz GC, Stafford GC, Coon JJ, Brodbelt JS. Anal Chem. 2009;81:8109–8118. doi: 10.1021/ac901313m. [DOI] [PMC free article] [PubMed] [Google Scholar]
- 103.Raspopov SA, El-Faramawy A, Thomson BA, Siu KWM. Anal Chem. 2006;78:4572–4577. doi: 10.1021/ac052248i. [DOI] [PubMed] [Google Scholar]
- 104.Madsen JA, Gardner MW, Smith SI, Ledvina AR, Coon JJ, Schwartz JC, Stafford GC, Brodbelt JS. Anal Chem. 2009;81:8677–8686. doi: 10.1021/ac901554z. [DOI] [PubMed] [Google Scholar]
- 105.Pikulski M, Hargrove A, Shabbir S, Anslyn E, Brodbelt JS. J Am Soc Mass Spectrom. 2007;18:2094–2106. doi: 10.1016/j.jasms.2007.09.005. [DOI] [PubMed] [Google Scholar]
- 106.Pikulski M, Wilson J, Aguilar A, Brodbelt JS. Anal Chem. 2006;78:8512–8517. doi: 10.1021/ac061472k. [DOI] [PubMed] [Google Scholar]
- 107.Gardner M, Vasicek L, Shabbir S, Anslyn E, Brodbelt JS. Anal Chem. 2008;80:4807–4819. doi: 10.1021/ac800625x. [DOI] [PubMed] [Google Scholar]
- 108.Cohen SM, Lippard SJ. Prog Nucleic Acid Res Mol Bio. 2001;67:93–130. doi: 10.1016/s0079-6603(01)67026-0. [DOI] [PubMed] [Google Scholar]
- 109.Bischoff G, Hoffmann S. Curr Med Chem. 2002;9:321–348. [Google Scholar]
- 110.Hansen TA, Kryuchkov F, Kjeldsen F. Anal Chem. 2012;84:6638–6645. doi: 10.1021/ac3010007. [DOI] [PubMed] [Google Scholar]
- 111.Thompson MS, Cui W, Reilly JP. J Am Soc Mass Spectrom. 2007;18:1439–1452. doi: 10.1016/j.jasms.2007.04.015. [DOI] [PubMed] [Google Scholar]
- 112.Devakumar A, Mechref Y, Kang P, Novotny MV, Reilly JP. Rapid Commun Mass Spectrom. 2007;21:1452–1460. doi: 10.1002/rcm.2981. [DOI] [PubMed] [Google Scholar]
- 113.Devakumar A, Mechref Y, Kang P, Novotny MV, Reilly JP. J Am Soc Mass Spectrom. 2008;19:1027–1040. doi: 10.1016/j.jasms.2008.03.005. [DOI] [PMC free article] [PubMed] [Google Scholar]
- 114.Thompson MS, Cui W, Reilly JP. Angew Chem Int Ed. 2004;43:4791–4794. doi: 10.1002/anie.200460788. [DOI] [PubMed] [Google Scholar]
- 115.Zhang L, Cui W, Thompson MS, Reilly JP. J Am Soc Mass Spectrom. 2006;17:1315–1321. doi: 10.1016/j.jasms.2006.06.007. [DOI] [PubMed] [Google Scholar]
- 116.Zhang L, Reilly JP. J Am Soc Mass Spectrom. 2008;19:695–702. doi: 10.1016/j.jasms.2008.01.011. [DOI] [PubMed] [Google Scholar]
- 117.Cui W, Thompson MS, Reilly JP. J Am Soc Mass Spectrom. 2005;16:1384–1398. doi: 10.1016/j.jasms.2005.03.050. [DOI] [PubMed] [Google Scholar]
- 118.Zhang L, Reilly JP. J Proteome Res. 2009;8:734–742. doi: 10.1021/pr800766f. [DOI] [PMC free article] [PubMed] [Google Scholar]
- 119.Kim TY, Reilly JP. J Am Soc Mass Spectrom. 2009;20:2334–2341. doi: 10.1016/j.jasms.2009.08.021. [DOI] [PubMed] [Google Scholar]
- 120.Zhang L, Reilly JP. Anal Chem. 2010;82:898–908. doi: 10.1021/ac902050y. [DOI] [PubMed] [Google Scholar]
- 121.Zhang L, Reilly JP. J Proteome Research. 2010;9:3025–3034. doi: 10.1021/pr901206j. [DOI] [PubMed] [Google Scholar]
- 122.Parthasarathi R, He Y, Reilly JP. J Am Chem Soc. 2010;132:1606–1610. doi: 10.1021/ja907975v. [DOI] [PubMed] [Google Scholar]
- 123.Liu X, Li YF, Bohrer BC, Arnold RJ, Radivojac P, Tang H, Reilly JP. Int J Mass Spectrom. 2011;308:142–154. doi: 10.1016/j.ijms.2011.04.008. [DOI] [PMC free article] [PubMed] [Google Scholar]
- 124.He Y, Parthasarathi R, Raghaachari K, Reilly JP. J Am Soc Mass Spectrom. 2012;23:1182–1190. doi: 10.1007/s13361-012-0379-x. [DOI] [PubMed] [Google Scholar]
- 125.He Y, Webber N, Reilly JP. J Am Soc Mass Spectrom. 2011;24:675–683. doi: 10.1007/s13361-012-0514-8. [DOI] [PubMed] [Google Scholar]
- 126.Choi KM, Yoon SH, Sun M, Oh JY, Moon JH, Kim MS. J Am Soc Mass Spectrom. 2006;17:1643–1653. doi: 10.1016/j.jasms.2006.07.021. [DOI] [PubMed] [Google Scholar]
- 127.Moon JH, Yoon SH, Bae YJ, Kim MS. J Am Soc Mass Spectrom. 2010;21:1151–1158. doi: 10.1016/j.jasms.2010.03.025. [DOI] [PubMed] [Google Scholar]
- 128.Shin YS, Moon JH, Kim MS. J Am Soc Mass Spectrom. 2010;21:53–59. doi: 10.1016/j.jasms.2009.09.003. [DOI] [PubMed] [Google Scholar]
- 129.Smith SI, Brodbelt JS. Anal Chem. 2011;83:303–310. doi: 10.1021/ac102411a. [DOI] [PMC free article] [PubMed] [Google Scholar]
- 130.Madsen JA, Cullen TW, Trent MS, Brodbelt JS. Anal Chem. 2011;83:5107–5113. doi: 10.1021/ac103271w. [DOI] [PMC free article] [PubMed] [Google Scholar]
- 131.Shaw JB, Brodbelt JS. Int J Mass Spectrom. 2011;308:203–208. [Google Scholar]
- 132.Hankins JV, Madsen JA, Giles DK, Childers BM, Klose KE, Brodbelt JS, Trent MS. Mol Micro. 2011;81:1313–1329. doi: 10.1111/j.1365-2958.2011.07765.x. [DOI] [PMC free article] [PubMed] [Google Scholar]
- 133.Ko BJ, Brodbelt JS. Anal Chem. 2011;83:8192–8200. doi: 10.1021/ac201751u. [DOI] [PubMed] [Google Scholar]
- 134.Madsen JA, Cheng RR, Kaoud TS, Dalby KN, Makarov DE, Brodbelt JS. Chemistry: Eur J. 2012;18:5374–5383. doi: 10.1002/chem.201103534. [DOI] [PMC free article] [PubMed] [Google Scholar]
- 135.Robinson MR, Madsen JA, Brodbelt JS. Anal Chem. 2012;84:2433–2439. doi: 10.1021/ac203227y. [DOI] [PubMed] [Google Scholar]
- 136.Shaw J, Ledvina A, Zhang X, Julian RR, Brodbelt JS. J Am Chem Soc. 2012;134:15624–15627. doi: 10.1021/ja3032086. [DOI] [PMC free article] [PubMed] [Google Scholar]
- 137.Shaw J, Madsen J, Brodbelt JS. J Am Soc Mass Spectrom. 2012;23:1707–1715. doi: 10.1007/s13361-012-0424-9. [DOI] [PMC free article] [PubMed] [Google Scholar]
- 138.Han SW, Lee SW, Bahar O, Schwessinger B, Robinson MR, Shaw JB, Madsen JA, Brodbelt JS, Ronald PA. Nature Commun. 2012;3:1153. doi: 10.1038/ncomms2157. [DOI] [PMC free article] [PubMed] [Google Scholar]
- 139.Hankins JV, Madsen JA, Giles DK, Brodbelt JS, Trent MS. Proc Nat Acad Sciences. 2012;109:8722–8727. doi: 10.1073/pnas.1201313109. [DOI] [PMC free article] [PubMed] [Google Scholar]
- 140.Shaw JB, Li W, Holden DD, Zhang Y, Griep-Raming J, Fellers RT, Early BP, Thomas PM, Kelleher NL, Brodbelt JS. J Am Chem Soc. 2013;135:12646–12651. doi: 10.1021/ja4029654. [DOI] [PMC free article] [PubMed] [Google Scholar]
- 141.Luo Y, Yogesha SD, Cannon JR, Yan W, Brodbelt JS, Zhang Y. ACS Chemical Biology. 2013;8:2042–2052. doi: 10.1021/cb400229c. [DOI] [PMC free article] [PubMed] [Google Scholar]
- 142.Madsen JA, Ko BY, Robotham SS, Xu H, Horton AP, Iwashkiw JA, Shaw JB, Feldman MF, Brodbelt JS. Anal Chem. 2013 doi: 10.1021/ac4021177. [DOI] [PMC free article] [PubMed] [Google Scholar]
- 143.Madsen JA, Xu H, Robinson MR, Horton AP, Shaw JB, Giles DK, Kaoud TSD, Dalby KN, Trent MS, Brodbelt JS. Molecular and Cellular Proteomics. 2013;12:2604–2614. doi: 10.1074/mcp.O113.028258. [DOI] [PMC free article] [PubMed] [Google Scholar]
- 144.Ellefson JW, Meyer AJ, Hughes RA, Cannon J, Brodbelt JS, Ellington AD. Nature Biotechnology. 2014;32:97–101. doi: 10.1038/nbt.2714. [DOI] [PubMed] [Google Scholar]
- 145.Cannon J, Kluwe C, Ellington A, Brodbelt JS. Proteomics. 2014 doi: 10.1002/pmic.201300364. accepted, in press. [DOI] [PMC free article] [PubMed] [Google Scholar]
- 146.Cammarata M, Lin K-Y, Pruet J, Liu H-W, Brodbelt JS. Anal Chem. 2013 Nov 3; doi: 10.1021/ac4036235. submitted. [DOI] [PubMed] [Google Scholar]
- 147.O’Brien JP, Brodbelt JS. Anal Chem. 2013;85:10399–10407. doi: 10.1021/ac402379y. [DOI] [PMC free article] [PubMed] [Google Scholar]
- 148.O’Brien JP, Needham BD, Henderson JC, Nowicki EM, Trent MS, Brodbelt JS. Anal Chem. 2013 Nov; doi: 10.1021/ac403796n. [DOI] [PMC free article] [PubMed] [Google Scholar]
- 149.An HJ, Kronewitter SR, de Leoz MLA, Lebrilla CB. Curr Opin Chem Biol. 2009;13:601–607. doi: 10.1016/j.cbpa.2009.08.015. [DOI] [PMC free article] [PubMed] [Google Scholar]
- 150.Deguchi K, Takegawa Y, Ito H, Miura N, Yoshioka S, Nagai S, Nakagawa H, Nishimura SI. Rapid Commun Mass Spectrom. 2006;20:412–418. doi: 10.1002/rcm.2320. [DOI] [PubMed] [Google Scholar]
- 151.Needham BD, Trent MS. Nature Reviews:Microbiology. 2013;11:467–481. doi: 10.1038/nrmicro3047. [DOI] [PMC free article] [PubMed] [Google Scholar]
- 152.Kilar A, Dornyei A, Kocsis B. Mass Spectrom Rev. 2013;32:90–117. doi: 10.1002/mas.21352. [DOI] [PubMed] [Google Scholar]
- 153.Merrill, Wang AH, Park MD, Sullards MMC. Trends Biochem Sci. 2007;32:457–468. doi: 10.1016/j.tibs.2007.09.004. [DOI] [PubMed] [Google Scholar]
- 154.Pham HT, Ly T, Trevitt AJ, Mitchell TW, Blanksby SJ. Anal Chem. 2012;84:7525–7532. doi: 10.1021/ac301652a. [DOI] [PubMed] [Google Scholar]
- 155.Pham HT, Trevitt AJ, Mitchell TW, Blanksby SJ. Rapid Commun Mass Spectrom. 2013;27:805–815. doi: 10.1002/rcm.6503. [DOI] [PubMed] [Google Scholar]
- 156.Ly T, Julian RR. J Am Chem Soc. 2010;132:8602–8609. doi: 10.1021/ja910665d. [DOI] [PMC free article] [PubMed] [Google Scholar]
- 157.Bowie JH, Brinkworth CS, Dua S. Mass Spectrom Rev. 2002;21:87–107. doi: 10.1002/mas.10022. [DOI] [PubMed] [Google Scholar]
- 158.Kjeldsen F, Silivra OA, Ivonin IA, Haselmann KF, Gorshkov M, Zubarev RA. Chem Eur J. 2005;11:1803–1812. doi: 10.1002/chem.200400806. [DOI] [PubMed] [Google Scholar]
- 159.Coon JJ, Shabanowitz J, Hunt DF, Syka JEPJ. Am Soc Mass Spectrom. 2005;16:880–882. doi: 10.1016/j.jasms.2005.01.015. [DOI] [PubMed] [Google Scholar]
- 160.Brunet C, Antoine R, Dugourd P, Canon F, Giuliani A, Nahon L. J Chem Phys. 2013;138:064301. doi: 10.1063/1.4790165. [DOI] [PubMed] [Google Scholar]
- 161.Larraillet V, Vorobyev A, Brunet C, Lemoine J, Tsybin YO, Antoine R, Dugourd P. J Am Soc Mass Spectrom. 2010;21:670–680. doi: 10.1016/j.jasms.2010.01.015. [DOI] [PubMed] [Google Scholar]
- 162.Gabelica V, Tabarin T, Antoine R, Rosu F, Compagnon I, Broyer M, De Pauw E, Dugourd PP. Anal Chem. 2006;78:6564–6572. doi: 10.1021/ac060753p. [DOI] [PubMed] [Google Scholar]
- 163.Gabelica V, Rosu F, Tabarin T, Kinet C, Antoine R, Broyer M, De Pauw E, Dugourd P. J Am Chem Soc. 2007;129:4706–4713. doi: 10.1021/ja068440z. [DOI] [PubMed] [Google Scholar]
- 164.Larraillet V, Antoine R, Dugourd P, Lemoine J. Anal Chem. 2009;81:8410–8416. doi: 10.1021/ac901304d. [DOI] [PubMed] [Google Scholar]
- 165.Ohtsubo K, Marth JD. Cell. 2006;126:855–867. doi: 10.1016/j.cell.2006.08.019. [DOI] [PubMed] [Google Scholar]
- 166.Pan S, Chen R, Aebersold R, Brentnall TA. Molecular Cellular Proteomics. 2011;10:1–14. doi: 10.1074/mcp.R110.003251. [DOI] [PMC free article] [PubMed] [Google Scholar]
- 167.Moore KL. J Biol Chem. 2003;278:24243–24246. doi: 10.1074/jbc.R300008200. [DOI] [PubMed] [Google Scholar]
- 168.Duncan MW, Aebersold R, Caprioli RM. Nature Biotechnol. 2010;28:659–664. doi: 10.1038/nbt0710-659. [DOI] [PubMed] [Google Scholar]
- 169.Cannon JR, Cammarata MB, Robotham SA, Cotham VC, Shaw JB, Fellers RT, Early BP, Thomas PM, Kelleher NL, Brodbelt JS. Anal Chem. 2014 doi: 10.1021/ac403859a. submitted. [DOI] [PMC free article] [PubMed] [Google Scholar]
- 170.Joly L, Antoine R, Broyer M, Dugourd P, Lemoine J. J Mass Spectrom. 2007;42:818–824. doi: 10.1002/jms.1222. [DOI] [PubMed] [Google Scholar]
- 171.Ly T, Julian RR. J Am Chem Soc. 2010;132:8602–8609. doi: 10.1021/ja910665d. [DOI] [PMC free article] [PubMed] [Google Scholar]
- 172.Sun Q, Yin S, Loo JA, Julian RR. Anal Chem. 2010;82:3826–3833. doi: 10.1021/ac100256v. [DOI] [PMC free article] [PubMed] [Google Scholar]
- 173.Liu Z, Julian RR. J Am Soc Mass Spectrom. 2009;20:965–971. doi: 10.1016/j.jasms.2008.12.014. [DOI] [PubMed] [Google Scholar]
- 174.Agarwal A, Diedrich JK, Julian RR. Anal Chem. 2011;83:6455–6458. doi: 10.1021/ac201650v. [DOI] [PubMed] [Google Scholar]
- 175.Diedrich JK, Julian RR. Anal Chem. 2011;83:6818–6826. doi: 10.1021/ac201647w. [DOI] [PubMed] [Google Scholar]
- 176.Diedrich JK, Julian RR. J Am Chem Soc. 2008;130:12212–12213. doi: 10.1021/ja8023719. [DOI] [PubMed] [Google Scholar]
- 177.Diedrich JK, Julian RR. Anal Chem. 2010;82:4006–4014. doi: 10.1021/ac902786q. [DOI] [PMC free article] [PubMed] [Google Scholar]
- 178.Ko BJ, Brodbelt JS. J Am Soc Mass Spectrom. 2011;22:49–56. doi: 10.1007/s13361-010-0016-5. [DOI] [PubMed] [Google Scholar]
- 179.Ko BJ, Brodbelt JS. J Mass Spectrom. 2011;46:359–366. doi: 10.1002/jms.1901. [DOI] [PubMed] [Google Scholar]
- 180.O’Brien JP, Mayberry LK, Murphy PA, Browning KS, Brodbelt JS. J Proteome Research. 2013;12:5867–5877. doi: 10.1021/pr400869u. [DOI] [PubMed] [Google Scholar]
- 181.Robotham SA, Kluwe C, Ellington A, Brodbelt JS. Anal Chem. 2013;85:9832–9838. doi: 10.1021/ac402309h. [DOI] [PubMed] [Google Scholar]
- 182.Aponte J, Vasicek L, Swaminathan J, Xu H, Koag MC, Lee S, Brodbelt JS. Anal Chem. 2013 Nov 8; doi: 10.1021/ac403654m. [DOI] [PubMed] [Google Scholar]
- 183.Sik Shin Y, Hee Moon J, Soo Kim M. Anal Chem. 2011;83:1704–1708. doi: 10.1021/ac1028352. [DOI] [PubMed] [Google Scholar]
- 184.Enjalbert Q, Simon R, Salvador A, Antoine R, Redon S, Ayhan M, Dabour F, Chambert S, Bretonniere Y, Dugourd P. Rapid Commun Mass Spectrom. 2011;25:3375–3381. doi: 10.1002/rcm.5232. [DOI] [PubMed] [Google Scholar]
- 185.Enjalbert Q, Girod M, Simon R, Jeudy J, Chrot F, Salvador A, Antoine R, Dugourd P, Lemoine K. J Analyt Bioanalyt Chem. 2013;405:2321–2331. doi: 10.1007/s00216-012-6603-5. [DOI] [PubMed] [Google Scholar]
- 186.Mendoza VL, Vachet RW. Mass Spectrom Rev. 2009;28:785–815. doi: 10.1002/mas.20203. [DOI] [PMC free article] [PubMed] [Google Scholar]
- 187.Klaerke B, Holm AIS, Andersen LH. Astronomy and Astrophysics. 2011;532:A132–137. [Google Scholar]
- 188.Wyer JA, Jorgensen AV, Pedersen BM, Brondsted Nielsen S. ChemPhysChem. 2013;14:4109–4113. doi: 10.1002/cphc.201300843. [DOI] [PubMed] [Google Scholar]
- 189.Gregoire G, Lucas B, Barat M, Fayeton JA, Dedonder-Lardeux C, Jouvet C. Eur Phys J D. 2009;51:109–116. [Google Scholar]