Abstract
Epigenetic mechanisms underlying nutrition (nutrition epigenetics) are important in understanding human health. Nutritional supplements, for example folic acid, a cofactor in one-carbon metabolism, regulate epigenetic alterations and may play an important role in the maintenance of neuronal integrity. Folic acid also ameliorates hyperhomocysteinemia, which is a consequence of elevated levels of homocysteine. Hyperhomocysteinemia induces oxidative stress that may epigenetically mediate cerebrovascular remodeling and leads to neurodegeneration; however, the mechanisms behind such alterations remain unclear. Therefore, the present study was designed to observe the protective effects of folic acid against hyperhomocysteinemia-induced epigenetic and molecular alterations leading to neurotoxic cascades. To test this hypothesis, we employed 8-weeks-old male wild-type (WT) cystathionine-beta-synthase heterozygote knockout methionine-fed (CBS+/−+Met), WT, and CBS+/−+Met mice supplemented with folic acid (FA) [WT+FA and CBS+/−+ Met+FA, respectively, 0.0057-μg g−1 day−1 dose in drinking water/4 weeks]. Hyperhomocysteinemia in CBS+/−+Met mouse brain was accompanied by a decrease in methylenetet-rahydrofolate reductase and an increase in S-adenosylho-mocysteine hydrolase expression, symptoms of oxidative stress, upregulation of DNA methyltransferases, rise in matrix metalloproteinases, a drop in the tissue inhibitors of metallo-proteinases, decreased expression of tight junction proteins, increased permeability of the blood–brain barrier, neuro-degeneration, and synaptotoxicity. Supplementation of folic acid to CBS+/−+Met mouse brain led to a decrease in the homocysteine level and rescued pathogenic and epigenetic alterations, showing its protective efficacy against homocysteine-induced neurotoxicity.
Keywords: CBS, DNMT, Folic acid, Homocysteine, MMPs
Introduction
Homocysteine (Hcy) is an intermediate sulfhydryl-containing amino acid derived from methionine. Hcy has two fates: remethylation to methionine (with the ease of methionine synthase enzyme) or transsulfuration to cysteine (with cystathionine-β-synthase, enzyme CBS; Huang et al. 2007). The elevated levels of Hcy, termed as hyperhomocysteinemia (HHcy), is associated with a higher risk of neurovascular diseases (Beard and Bearden 2011; Selhub 1999; Dayal and Lentz 2008). The causes of HHcy are mainly genetic deficiencies in the enzymes (CBS and MTHFR, methylenetetrahydrofolate reductase) responsible for the remethylation or transsulfuration of Hcy and nutritional (B6, B12, choline, and folate) deficiencies of vitamins serving as cofactors for the enzymes. The dietary nutrients (B6, B12, choline, and folate) are the best sources to influence the supply of methyl groups and regulate the biochemical pathways for methylation processes.
Folic acid, or folate, is the strongest nutritional and pharmacological determinant of plasma Hcy levels. Folate is critical in generating S-adenosylmethionine (SAM) for DNA methylation. DNA methylation is contributing to the control of gene and, ultimately, protein expression (McNeil et al. 2011). Therefore, alteration in DNA methylation by folate deficiency or HHcy may disrupt this function. However, precise mechanisms remain unclear. Increased oxidation mediated through the sulfhydryl group of Hcy could also affect DNA methylation by altering the DNA methyltransferase (DNMT) activity that might further affect the methionine–Hcy metabolism pathway. DNMTs are known as genomic methylation agents and classified into DNA methyltransferases 3a (DNMT-3a) and DNA methyltransferases 3b (DNMT-3b; regulate de novo methylation), and DNA methyl transferases 1 (DNMT-1; maintain methylation; Kalani et al. 2013). These epigenetic changes may affect the physiologic and pathologic processes of Hcy-mediated vasculopathies that include endothelial dysfunction, loss of extracellular matrix collagen, and disruption of the blood–brain barrier (BBB; Beard et al. 2011). A growing body of evidences suggests that an increase in BBB permeability is an important factor in initiating cerebral diseases such as stroke (Wardlaw et al. 2009; Topakian et al. 2010). Hence, identifying the mechanisms by which HHcy opens the BBB is of great clinical interest. The loss of BBB integrity is also related to matrix metalloproteinase (MMP) activation that plays an important role in decreasing the brain vascular endothelial layer integrity (Rosell et al. 2006). MMPs are the family of zinc-containing endopeptidases that degrade components of the extracellular matrix (ECM) and tight junction protein (TJP) in the brain (Cui et al. 2012). MMPs are inhibited by tissue inhibitors of metalloproteinases (TIMPs). TIMP expression is regulated during development and remodeling (Brew and Nagase 2010). Changes in TIMP levels are considered to be important since they directly affect the level of MMP activity (Visse and Nagase 2003; Alvarez-Sabin et al. 2004). Previous studies have shown that MMP-2/MMP-9 genes can be regulated epigenetically in cardiovascular diseases (Chen et al. 2011). However, whether MMP-2/MMP-9 gene expression can be controlled by epigenetic mechanisms in the context of brain damage or neurodegeneration is still unclear.
Up to this date, only a few reports are available that point to the use of low folate and HHcy-induced diet and its effect on cognitive impairments and neurodegeneration (Tucker et al. 2005; Mattson et al. 2002). Thus, the literature also provides the importance and use of diet-induced HHcy in genetic deficient HHcy models, such as CBS+/−, in order to validate their outcomes for dementia and neurodegeneration pathologies. This model could also be useful to study high HHcy risk for Alzheimer’s and dementia-like neurodegenerative pathologies. The mechanisms between dietary epigenetic regulation and cerebrovascular pathologies remain poorly understood. Taking all the above objectives into consideration, we conducted a study to test the hypothesis that high HHcy induces oxidative stress accompanied by epigenetic changes and MMP-2/MMP-9 gene/protein alterations affecting blood–brain barrier integrity that lead to neuronal toxicity. We accomplished our study in a well-characterized genetic CBS+/−-deficient mouse model supplemented with a methionine-rich diet in order to study high HHcy risk to neurovascular pathologies and studied the potential protective role of folic acid against Hcy-mediated neurotoxicity. We established that elevated levels of Hcy leads to an increase in cerebrovascular permeability and neurodegeneration. Furthermore, dietary folate supplementation was proven a potential preventive approach in order to revert back the molecular, biochemical, epigenetic, and physiological alterations in HHcy mouse brain.
Materials and Methods
Animals and Experimental Design
The animals were fed standard chow and water ad libitum. CBS+/−heterozygous animals were fed a methionine-rich diet. The animal procedures were carefully reviewed and approved by the Institutional Animal Care and Use Committee, University of Louisville, in accordance with the animal care and proper guidelines of the National Institutes of Health. The male wild-type (WT, C57BJ/L6) and CBS+/−mice (8–12 weeks) were recruited and kept in four different groups (n =4). The mouse groups were:
Wild type C57BJ/L6 mice (WT)
Folate-supplemented wild-type mice (WT+FA)
CBS+/−heterozygous mice fed with methionine (CBS+/−+ Met)
Folate-supplemented CBS+/−+Met (CBS+/−+Met+FA)M
Folic acid was given in drinking water at a 0.0057-μg g−1 day−1 dose for 4 weeks).
Genotyping Analysis of the Heterozygous CBS+/−Mouse
Mice were obtained from Jackson Laboratories (Bar Harbor, ME, USA) and CBS+/−mice were cross-bred, yielding around 10 % CBS−/−, 60 % CBS+/−, and 25 % CBS+/+. After 4 weeks, mice were weaned and genotyped. For genotyping, tail samples were collected and genotypic analysis was performed with PCR using specific CBS primers supplied by the supplier. The PCR products were run on 1.2 % agarose gel (prepared in TAE buffer, pH 8.4) in the presence of ethidium bromide and the images recorded in a gel documentation system (Bio-Rad, Hercules, CA, USA; Kumar et al. 2008).
Mouse Brain Tissue Collection
The brain tissue samples were harvested from experimental mice groups, washed with 50 mM phosphate-buffered saline (PBS, pH 7.4), and stored at −80 °C until use.
Estimation of Biochemical Parameters
Brain tissues from different mouse groups were collected; homogenized in 0.1 M phosphate buffer (pH 7.4); and the biochemical levels for malondialdehyde, glutathione, nitrite, and thiosulfate quantitated as described earlier, with certain modifications (Kamat et al. 2010; Colado et al. 1997). Brief descriptions of the different tests are illustrated below.
Measurement of Lipid Peroxidation
Lipid peroxidation was assessed with the malondialdehyde (MDA) method using 1,1,3,3-tetraethoxypropane as the standard. The homogenized brain tissue samples were treated with 0.3 ml trichloroacetic acid (TCA, 30 %), 0.3 ml thiobarbituric acid (2 %), and 0.15 ml 5 N HCl and then heated at 90 °C for 15 min. The sample was centrifuged at 13,000 rpm for 10 min. The pink-colored supernatant was collected and quantified at 532 nm using a Spectra Max M2 plate reader (Molecular Device, Sunnyvale, CA, USA). The levels of MDA were determined and expressed for each group in nanomoles per milligram protein (ELLMAN 1959).
Measurement of Glutathione
Glutathione (GSH) level was ascertained by its reaction with 5,5'-dithiobis 2-nitrobenzoic acid (DTNB) using reduced glutathione as the standard. The tissue sample was first treated with an equal volume of 5 % TCA, centrifuged at 3,000 rpm for 10 min, and the supernatant collected. The supernatant (0.05 ml) was transferred to another tube and 0.1 ml phosphate buffer (pH 8.4), DTNB, and 0.05 ml double distilled water were added. The absorbance of the mixture was recorded at 412 nm within 15 min in a Spectra Max M2 plate reader (Molecular Device). The level of GSH for each group was expressed in micrograms per milligram protein.
Measurement of Nitrite Level
Nitrite levels in the brain tissues were estimated with a Griess reagent [0.1 % N-(1-naphthyl) ethylenediamine dihydrochloride, 1 % sulfanilamide, and 2.5 % phosphoric acid] using sodium nitrite as the standard. The mouse brain tissue (suspended in phosphate buffer) was centrifuged at 3, 000 rpm for 10 min and 0.05 ml supernatant was transferred to the tube containing an equal amount of Griess reagent. The tube was incubated at 37 °C for 30 min and absorbance was recorded at 542 nm in a Spectra Max M2 plate reader (Molecular Device). The level of nitrite was expressed in micrograms per milligram protein.
Measurement of Thiosulfate Level
To quantify the thiosulfate levels in the different brain samples, we used Ellman’s reagent (DTNB; Ellman 1959). Briefly, homogenized brain was centrifuged at 3,000 rpm for 10 min and to 0.05 ml supernatant 0.1 ml phosphate buffer (pH 8.4), DTNB, and 0.05 ml double distilled water were added. The absorbance was recorded at 412 nm within 15 min in a Spectra Max M2 plate reader (Molecular Device). The level of thiosulfur for each group was expressed in micrograms per milligram protein.
Preparation of Brain Tissue Extract and Protein Estimation
The brain tissue was homogenized in ice-cold RIPA buffer containing PMSF (1 mM) and protease inhibitor cocktails (1 μl/ml of lysis buffer; Sigma Aldrich, St. Louis, MO, USA) and protein was extracted. The extract was centrifuged at 12,000×g for 15 min at 4 °C. The supernatant was collected, aliquoted, and stored at −80 °C until further use. Protein content in the different samples was measured with a Bradford dye (Bio-Rad) in a 96-well microtiter plate against a bovine serum albumin (BSA) standard. The plate was read at 594 nm in a Spectra Max M2 plate reader (Molecular Device).
SDS-PAGE and Western Blotting
Brain extracts (40 μg) were loaded on a polyacrylamide gel and run at constant current until the dye reached the bottom. Separated proteins in the gels were transferred to polyvinylidene difluoride membranes using an electrotransfer apparatus (Bio-Rad). After blocking with 5 % non-fat dry milk (1 h), the membranes were probed overnight with a primary antibody [anti-, ZO-1, ZO-2, occludin, MMP-9, MMP-2, MTHFR, S-adenosylhomocysteine hydrolase (SAHH), DNMT-3a, DNMT-1, PSD-95, SAP-97] at 4 °C. After washing, the membranes were further incubated with a secondary antibody [horse radish peroxidase-conjugated goat anti-mouse, goat anti-rabbit, or rabbit anti-goat IgG (1:10,000, Santa Cruz, CA, USA)] for 60 min at room temperature. The membranes were washed and developed with ECL Western blotting detection system (GE Healthcare, Piscataway, NJ, USA). The image was recorded in the chemi-program of a gel documentation system (Bio-Rad). After that, the membranes were stripped and probed for GAPDH with an anti-GAPDH antibody (Millipore, Billerica, MA, USA) as a loading control. Each band density was normalized with a respective GAPDH density using Image Lab densitometry software (Bio-Rad).
Real-Time PCR
RT-PCR was performed to check the mRNA transcript levels of the different genes. Total RNA from brain tissue was isolated with TRIzol® reagent (Invitrogen, Grand Island, NY, USA) according to the manufacturer’s instructions. Quantification and purity of the RNA was assessed using nanodrop-1000 (Thermo Scientific, Waltham, MA, USA). RNA (2 μg) was reverse-transcribed to cDNA for 5 min at 70 °C using 1 μl oligodT 15 primers (Invitrogen, Carlsbad, CA, USA) in a final reaction volume of 5 μl. To this reaction mixture, 4 μl 5× PCR reaction buffer, 4 μl 5 mM MgCl2, 1 μl 10 mM dNTP, 1 μl reaction Im-Prom-II™ RT, and 20 U (0.5 μl) rRNasin were added and the total volume was made 20 μl with RNase-free water. The cDNA was prepared in a thermocycler (Bio-Rad) with the following cycle: 42 °C for 60 min, 70 °C for 15 min, and 4 °C at end. Sequence-specific oligonucleotide primers were prepared commercially (Invitrogen, Carlsbad, CA, USA). The PCR was performed for different genes (ZO-1, ZO-2, occludin, TIMP-1, TIMP-2, MMP-9, MMP-2, MTHFR, SAHH, GAPDH) in a final reaction volume of 20 μl containing 2 μl of the cDNA, 10 μl master mix (Promega, Madison, WI, USA), 20 pmol forward primer, 20 pmol reverse primer, and 5 μl water. PCR amplification reactions were performed with the following program: 95 °C–7.00 min [95 °C–50 s, 55 °C–1.00 min, 72 °C–1.00 min]×34 cycle, 72 °C–5.00 min, 4 °C–−. The amplified products were resolved on an agarose gel (prepared in 1× TAE) in the presence of ethidium bromide and the images recorded with a gel documentation system (Bio-Rad). The band intensities of the PCR product were normalized to GAPDH band intensity. The list of primers along with their sequences is shown in Table 1.
Table 1.
List of the different primers used in the study
| Genes | Forward primers | Reverse primers |
|---|---|---|
| MMP-9 | 5'-TACAGGGCCCCTTCCTTACT-3' | 5'-CCACATTTGACGTCCAGAGA-3' |
| β-actin | 5-ATCAAGATCATTGCTCCTCCTG-3 | 5-GCAACTAAGTCATAGTCCGCC-3 |
| MMP-2 | 5'-ACACTGGGACCTGTCACTCC-3' | 5'-CCCAGCCAGTCTGATTTGAT-3' |
| TIMP-1 | 5' CCAGAAATCAACGAGACCAC-3' | 5' TTTCCATGACTGGGGTGTAG-3' |
| TIMP-2 | 5' AAGAATCACCCTCCAACCAG-3' | 5' CTTGGTTGAAGCCAGAAACA-3' |
| Rn18s | 5'-AAATCAGTTATGGTTCCTTTGGTC-3' | 5'-GCTCTAGAATTACCACAGTTATCCAA-3' |
| DNMT-1 | 5'-AGGGAAAAGGGAAGGGCAAG-3' | 5'-CCAGAAAACACATCCAGGGTCC-3' |
| DNMT-3a | 5'-CCATAAAGCAGGGCAAAGACC-3' | 5'-AGTGGACTGGGAAACCAAATACC-3' |
| MTHFR | 5'-ACCTGAAGCATTTGAAGGAG-3' | 5'-GATAGGGCAAGAGATGCCTA-3' |
| SAHH | 5'-CATGGGGTAGGAAAAGATTG-3' | 5'-ACCTCCTCACCAATGTCCTA-3' |
| ZO-1 | 5'-AAGGCAATTCCGTATCGTTG-3' | 5'-CCACAGCTGAAGGACTCACA-3' |
| Occludin | 5'-GAGGGTACACAGACCCCAGA-3' | 5'-CAGGATTGCGCTGACTATGA-3' |
Quantification of the 5-Methylcytosine Level in DNA
Genomic DNA was isolated (Sigma) form the brain sample and total 5-methylcytosine (5-mC) was determined using the 5-mC DNA ELISA kit (Zymo Research Corp., Irvine, CA, USA) as per the manufacturer’s instruction. The kit utilized an anti-5-methylcytosine monoclonal antibody that is both sensitive and specific for 5-mC. The result was expressed in percent 5-mC in a DNA sample calculated through a standard curve generated with specially designed controls included in the kit.
DNMT Activity Assay
DNMT activity was ascertained in nuclear protein fractions isolated from mouse brain using EpiQuikTM nuclear extraction kit (Epigentek, Farmingdale, NY, USA). DNMT activity was assessed through an EPiQuikTM DNMT activity/inhibitor assay ultra kit (Epigentek) according to the manufacturer’s instruction. The results were calculated using the formula given below and expressed in OD per hour per milligram.
Measurement of Permeability in Brain Microcirculation
Blood flow in brain microvasculature was measured in anesthetized mice as described earlier (Muradashvili et al. 2012; Tyagi et al. 2010). A 14-mm hole was made in the skull using a high-speed micro drill (Fine Scientific, Foster City, CA, USA). Fluorescein isothiocyanate (FITC)-conjugated BSA (BSA-FITC-albumin, 70 kDa) was infused through the carotid artery cannulation in mice. In vivo imaging fluorescent microscope (Olympus BX61WI, Tokyo, Japan) was used for examining the exposed area of the skull. The data were interpreted with the software provided with the instrument and Image-Pro Plus 6.3 (Media Cybernetics, Bethesda, MD, USA).
Immunohistochemistry Analysis
The mice were euthanized and perfused with 50 mM PBS (pH 7.4). The brains were carefully isolated and washed with 50 mM PBS (pH 7.4). The OCT media (Triangle Biomedical Sciences, Durham, NC, USA) was used to prepare frozen brain blocks that are used to cut 20-μm brain sections in cryostat (Leica CM, USA). The tissue sections were blocked with 5 % BSA for 40 min at RT and incubated with a primary antibody (DNMT-3a, Santa Cruz, CA, USA) at 1:100 dilution overnight at 4 °C. The unbound antibody was washed with PBS and the sections then incubated with goat anti-rabbit alexa flour 488 for 90 min at RT. The slides were further stained with DAPI for 10 min and mounted with anti-fade mounting media. The images were acquired using a laser scanning confocal microscope (×60 objective, FluoView 1000, Olympus, PA, USA). Total fluorescence intensity in five random fields (for each experiment) was measured with image analysis software (Image-Pro Plus, Media Cybernetics, Rockville, MD, USA).
Analysis of Different DNMT Transcripts by qRT-PCR
The transcript level of DNMTs (DNMT-1, DNMT-3a) was determined in the cDNA sample of four mouse brains using quantitative real-time PCR. The PCR mixture (25 μl) contained 12.5 μl SYBR GREEN PCR master mix, 1 μl cDNA, and 40 pmol forward and reverse primers and amplified through Stratagene Mx3000p (Agilent Technologies, Santa Clara, CA, USA). The DNMT gene expression was normalized with Rn18s as the normalizing control along with RT and non-template controls. All the experiments were repeated three times and the data were analyzed statistically.
Fluoro-Jade C Staining
Fluoro-Jade C (FJC) labeling in the brain section was performed using a standard protocol (Schmued et al. 2005), with slight modification. Briefly, 25 μM paraffin-embedded brain sections were cut. The sections were deparaffinized by two 5-min washes in xylene, rehydrated through a graduated alcohol series (100, 90, 70, 50, 30 %) each for 5 min, and finally washed for 2 min in distilled water. The sections were then transferred to 0.06 % potassium permanganate solution for 10 min and rinsed in distilled water for 2 min. After that, the sections were incubated for 20 min in a 0.0001 % solution of FJC (Sigma Aldrich). FJC was made immediately before use by diluting a stock solution of 0.01 % FJC by 100-fold in 0.1 % acetic acid. The sections were further stained with DAPI followed by three washings with distilled water, each for 1 min. The sections were eventually dried at 37 °C and mounted with DPX. The fluorescent signal was visualized using a confocal laser scanning microscope with an excitation wavelength of 488 nm.
Cresyl Violet Staining
Cresyl violet staining was done as per standard protocol (Swarnkar et al. 2011). The microtome section (15 μm) was washed under running tap water to remove its matrix then given two to three dips in distilled water. Sections were stained with cresyl violet stain dye for 5 min and air-dried for 1 h at room temperature. The dried sections were dipped in n-butanol for 2 min, acetone and xylene for 10 min each, and mounted in DPX. The images were acquired using a confocal microscope (FluoView 1000, Olympus, PA, USA) and the pictures taken at ×20 magnification. The cellular morphology was checked in the brain section along with the cell count. The scoring of healthy cells containing healthy nuclei was carried out in a blinded fashion to avoid investigator bias. A minimum of 20 pictures per slide were captured and analyzed using Image-Pro Plus 7.0 software (Media Cybernetics, Rockville, MD, USA). The data were expressed in cell size/area and number, represented by the ratio of total area of cells (in square micrometers) to the total number of cells.
Statistical Analysis
The results are expressed as the mean±SEM. Statistical analysis of the biochemical and molecular data was analyzed using Student’s t test. A p value <0.05 was considered to be significant.
Results
Genotype and Phenotype of CBS+/−-Deficient Mouse Model
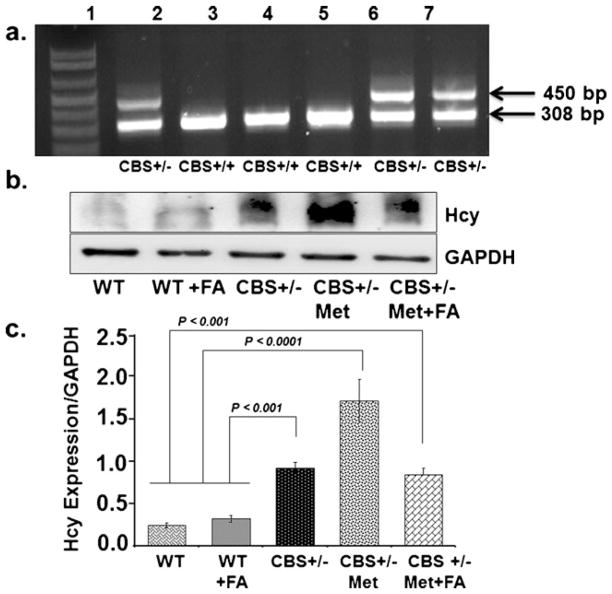
CBS+/−mice were cross-bred and the progeny was checked for targeted disruption of the CBS+/−gene, as shown in Fig. 1a. CBS+/−heterozygote gene-positive mice produced two bands of 450 and 308 bp, while CBS+/+ mice represented only one band of 308 bp. CBS+/−heterozygote mice were fed with a methionine-rich diet and compared for tissue Hcy expression against WT, WT+FA, CBS+/−, and CBS+/−+ Met+FA. Mice positive for high homocysteine were recruited and grouped as CBS+/−+Met. A significant increase in Hcy level was found in Met-fed CBS+/−brain tissue as compared to CBS+/−and CBS+/−+Met+FA brains (Fig. 1b, c). These results suggest that the Hcy level was low in CBS+/−brain as compared to CBS+/−+Met+FA brains. The Hcy levels reduced significantly with FA supplementation in Met-fed CBS+/−brain as compared to unsupplemented Met-fed CBS+/−brain.
Fig 1.
Genotype and phenotypic analysis of CBS+/−-deficient mice model. a Representative genotype image of CBS mice done with specific sets of primers. Heterozygote CBS+/−mice produced two bands of 450 and 308 bp; CBS+/+ mice produced a single band of 308 bp. Lane 1, molecular weight markers; lane 2, CBS+/−heterozygote control; lane 3, CBS homozygote control; lanes 6 and 7, CBS heterozygote (CBS+/−) test sample; lanes 4 and 5, CBS homozygote (CBS+/+) test sample. b Phenotype of the CBS+/−mouse model was confirmed by measuring tissue homocysteine expression with Western blot analysis. c Bar graphs representing data from densitometry of the homocysteine expression, normalized with GAPDH assessed by Bio-Rad software; values are expressed in arbitrary units. Data represented mean±SE from n =5 per group
Effect of Folic Acid on Homocysteine Metabolism
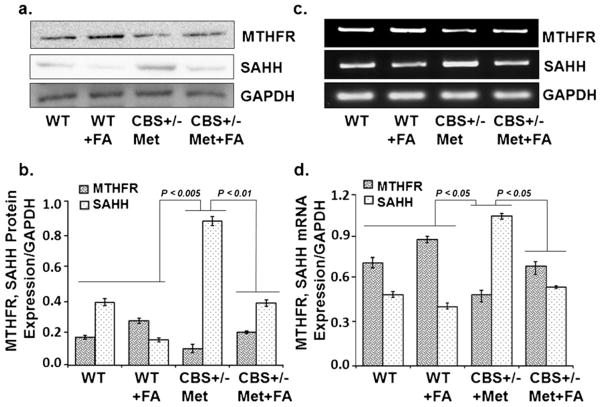
In order to know the effect of folic acid on the metabolic regulation of the Hcy pathway, two crucial enzymes, MTHFR and SAHH, were analyzed. MTHFR protein/mRNA levels were significantly reduced in the CBS+/−+Met group as compared to the control groups. Since MTHFR activity is folate-dependent, therefore, folate supplementation increased MTHFR expression in the WT+FA groups and CBS+/−+ Met+FA group as compared to WT and CBS+/−+Met, respectively [Fig. 2a, b (Western blot) and Fig. 2c, d (RT-PCR)]. In addition, SAHH protein/mRNA expression levels were significantly higher in the CBS+/−+Met group as compared to the WT and WT+FA supplementation groups, and supplementation with FA restored the expression of SAHH in CBS+/−+ Met+FA brains. These results suggest that FA supplementation restored the expression of MTHFR and SAHH [Fig. 2a, b (Western blot) and Fig. 2c, d (RT-PCR)].
Fig 2.
Effect of folic acid on methylenetetrahydrofolate reductase and S-adenosylhomocysteine hydrolase protein and mRNA levels. a Representative Western blot images of MTHFR and SAHH protein expressions in WT, WT+FA, CBS+/−+Met, and CBS+/−+Met+FA mouse brains. GAPDH was used as a loading control. b Bar graphs representing densitometry analysis of MTHFR and SAHH protein expressions normalized with GAPDH and assessed by Bio-Rad software; values are expressed in arbitrary units. Data represented mean±SE from n =4 per group. c Representative RT-PCR image of MTHFR and SAHH mRNA expression. GAPDH was used as a loading control. d Bar graph showing RT-PCR analysis of MTHFR and SAHH mRNA expressions as determined by densitometry analysis using Image-Pro software. MTHFR/ SAHH values were normalized with the GAPDH values. Data represented mean±SE from n =4 per group. Bar graph values were expressed in arbitrary units
Folic Acid Ameliorated Hcy-Induced Oxidative Stress
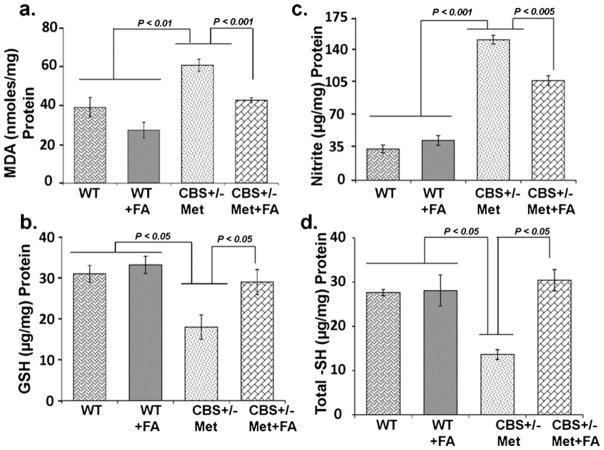
To evaluate the neuroprotective effects of FA on Hcy-induced oxidative stress, several important indices related to brain oxidative stress were determined. As an index of oxidative stress, the level of lipid peroxidation product MDA was significantly increased in CBS+/−+Met brain as compared to control brains. This increase in MDA was attenuated by FA supplementation (Fig. 3a). On the contrary, the concentration of GSH was markedly decreased in CBS+/−+Met brains as compared to the control brains. However, supplementation with FA normalized the decreased levels of GSH in CBS+/−+Met+FA brains (Fig. 3b). In addition, the level of nitrite was also increased in the CBS+/−+ Met group as compared to the control groups, and supplementation with FA restored the nitrite level in the CBS+/−+Met+FA group (Fig. 3c). Since thiol depletion also induces oxidative stress and may lead to disease progression, we therefore sought to determine total thiol content in brain tissue by biochemical analysis. The CBS+/−+Met mouse brains were low in total thiol content as compared to WT and WT+FA. Interestingly, a significant increase (−2.5 times) in total thiol contents was determined in the CBS+/−+Met+FA group (Fig. 3d) as compared to the CBS+/−+Met group. These findings suggest that FA supplementation could improve redox homeostasis of the brain.
Fig 3.
Effect of folic acid on malondialdehyde (MDH), intracellular reduced glutathione (GSH), nitrite levels, and total thiol contents: MDA (a), GSH (b), nitrite levels (c), and total thiol contents (d) in WT, WT+ FA, CBS+/−+Met, and CBS+/−+Met+FA mouse brains. Data represented mean±SE from n =4 per group
Effect of Folic Acid Improved Altered Epigenetic Changes
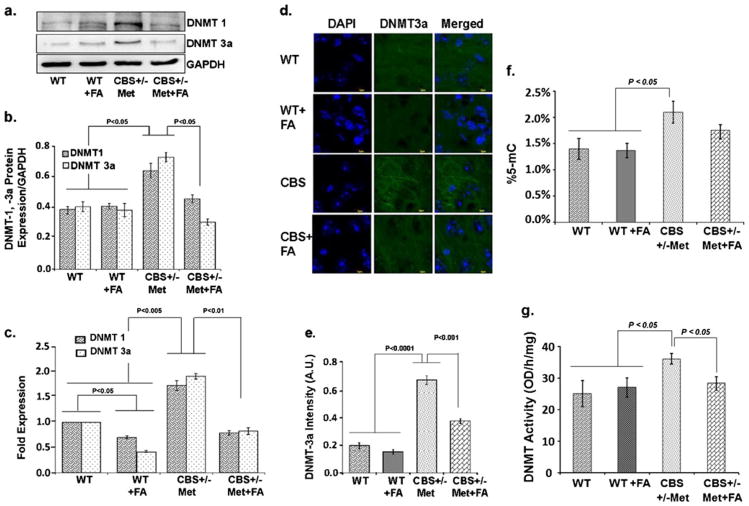
To understand the role of dietary folic acid influence on de novo and maintenance methylation, we measured the expression of DNMT-1 and DNMT-3a by Western blotting, quantitative real-time PCR (qRT-PCR), and immunohistochemistry. Both DNMT-1 and DNMT-3a protein and the mRNA levels were upregulated in the CBS+/−+Met group when compared to the CBS+/−+Met+FA groups, as determined by Western blot and qRT-PCR. Furthermore, no significant change in DNMT-1 and DNMT-3a mRNA levels was observed in the WT+FA group as compared to WT (Fig. 4a–c).
Fig 4.
Effect of folic acid on DNA methyltransferase activity. a Representative Western blot images of DNMT-1 and DNMT-3a protein expressions in WT, WT+FA, CBS+/−+Met, and CBS+/−+Met+FA mouse brains. GAPDH was used as a loading control. b Bar graphs representing densitometry analysis of DNMT-1/DNMT-3a protein expressions normalized with GAPDH. The analysis was done through Bio-Rad software and the values expressed in arbitrary units. Data represented the mean± SE from n =4 per group. c qRT-PCR analysis of DNMT-1 and DNMT-3a transcript levels as represented in a bar graph. Rn18s was used as a normalization control gene and the data expressed in fold expression. d Immunostaining of brain sections with DNMT-3a antibody (green fluorescence). Nuclei were stained with DAPI (blue). e Bar diagram representing the intensities of DNMT-3a in different mouse brains. Data represent the mean±SE from n =4 per group. f Bar graph representing percent 5-mC detected in different mouse brain genomic DNA samples. g DNMT activity in different mouse brain samples expressed in OD per hour per milligram. Data represented mean±SE from n =3 per group
These results were confirmed with immunohistochemistry of mouse brain tissues with DNMT-3a. The intensity of DNMT-3a was found to be more in CBS+/−+Met brain, as shown in Fig. 4d, e. Thus, the increased levels of DNMT-1 and DNMT-3a suggest that both de novo and maintenance methylation are induced during high HHcy. DNA methylation was determined by estimating percent 5-mC levels in genomic DNA isolated from mouse brain tissues. Percent 5-mC was high in CBS+/−+Met DNA and showed trends of decrease in our folate-supplemented CBS+/−+Met+FA DNA (Fig. 4f). In addition, we also found increased DNMT activity in CBS+/−+Met mice as compared to control brains, and which is decreased in CBS+/−+Met+FA brains (Fig. 4g).
Folic Acid Decreased Matrix Metalloproteinase and Improved Tissue Inhibitors of Matrix Metalloproteinase Levels
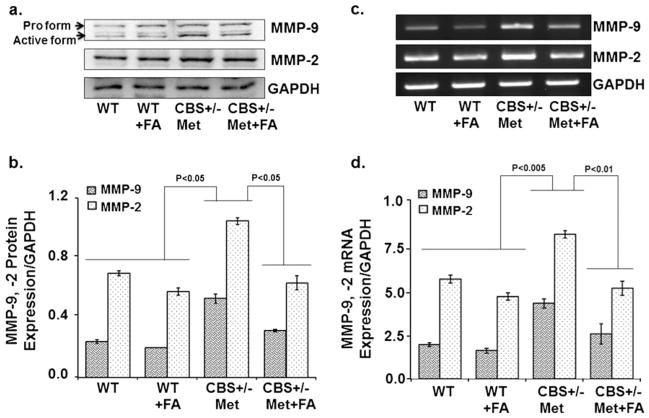
The balance between MMPs and TIMPs plays a major role in cerebrovascular remodeling, which is a physiological and pathological process in the clinical manifestations of brain-associated disorders. To assess cerebrovascular remodeling, MMP-2, MMP-9, TIMP-1 and TIMP-2 expressions were determined. There was an increase in the protein/mRNA expression of MMP-9 and MMP-2 in CBS+/−+Met brain as compared to control brains. This increase was attenuated and normalized with FA treatment, as determined by Western blot (Fig. 5a, b) and RT-PCR (Fig. 5c, d) analysis. In contrast, TIMP-1 and TIMP-2 mRNA expression was increased in the FA-supplemented CBS+/−+Met+FA group as compared to the CBS+/−+Met group (Fig. 6a, b). These findings are quite suggestive of folic acid’s role in improving unbalanced MMPs/TIMPs which induce cerebrovascular remodeling and neurodegeneration.
Fig 5.
Effect of folic acid on the protein and transcript levels of matrix metalloproteinase levels. a Representative Western blot images of MMP-9 and MMP-2 protein expressions in all groups. GAPDH was used as a loading control. b Bar graphs representing densitometry analysis of MMP-9 and MMP-2 expressions normalized with GAPDH. The values are expressed in arbitrary units. Band densities were determined through Bio-Rad software. Data represented mean±SE from n =4 per group. c Representative images of RT-PCR amplification of MMP-9 and MMP-2 genes in different brain tissues. GAPDH was used as a loading control to normalize MMP-9 and MMP-2 mRNA levels. d Bar diagram representing MMP-9 and MMP-2 mRNA expressions normalized with GAPDH. Data represented mean±SE from n =4 per group
Fig 6.
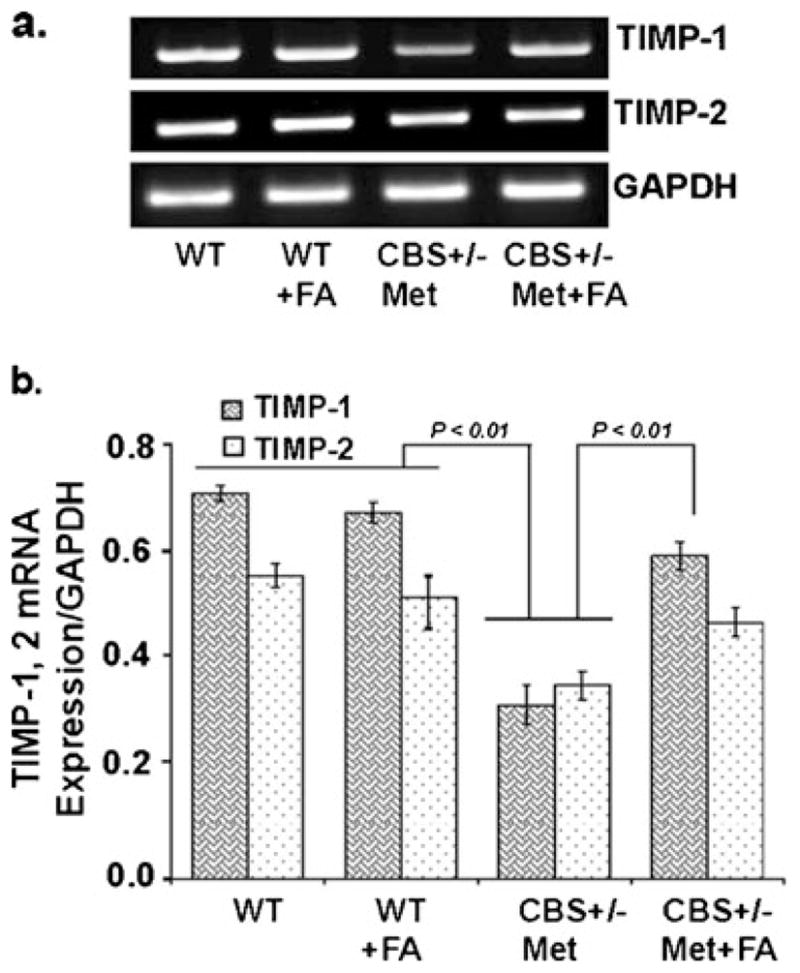
Effect of folic acid on tissue inhibitors of matrix metalloproteinase levels. a Representative RT-PCR images of TIMP-1 and TIMP-2 expressions in WT, WT+FA, CBS+/−+Met, and CBS+/−+Met+FA mouse brains. GAPDH was used as a loading control. b Densitometry analysis of TIMP-1 and TIMP-2 mRNA expressions normalized with GAPDH and represented as a bar diagram. Data represented mean±SE from n =4 per group
Effect of Folic Acid on Tight Junction Proteins
To determine whether tight junction proteins are involved in cerebrovascular remodeling, we performed immunoblotting and RT-PCR assays for ZO-1, ZO-2, and occludin. The results indicated that the protein (Fig. 7a, b) and mRNA (Fig. 7c, d) levels of ZO-1, ZO-2, and occludin were significantly lower in the CBS+/−+Met brain as compared to control brains. However, FA supplementation restored the protein and mRNA levels of ZO-1, ZO-2, and occludin. These results suggest that FA may also protect the blood–brain barrier.
Fig 7.
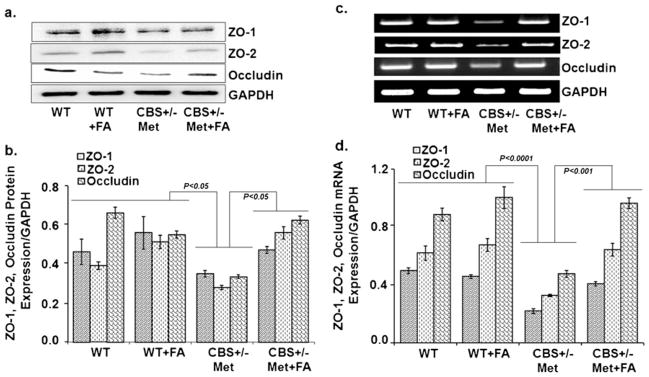
Effect of folic acid on the protein levels of tight junction proteins. a Representative Western blot images of ZO-1, ZO-2, and occludin protein expressions in WT, WT+FA, CBS+/−+Met, and CBS+/−+Met+ FA mouse brains. GAPDH was used as a loading control. b Bar graphs representing data from densitometry of ZO-1, ZO-2, and occludin expressions normalized with GAPDH. Values are expressed in arbitrary units and the data were calculated through Bio-Rad software. Data represented the mean±SE from n =4 per group. c Representative images of ZO-1, ZO-2, and occludin gene transcript expressions in different mouse brains through RT-PCR. d Densitometry analysis representing in bar graph for ZO-1, ZO-2, and occludin mRNA expressions normalized by GAPDH. Data represented mean±SE from n =4 per group
Folic Acid Supplementation Improved Cerebrovascular Permeability
To determine whether FA alleviated the BBB permeability in CBS+/−+Met mouse brain, we measured the interstitial diffusion of BSA (FITC-labeled) in experimental brains by intra-vital microscopy. We detected that BBB permeability was significantly higher in CBS+/−+Met as compared to the control brain. FA supplementation reduced BBB permeability in the CBS+/−+Met+FA brain (Fig. 8a, b) as reduced BSA leakage was observed in these brains. These results suggested that HHcy was associated with increased permeability in the brain interstitial parenchyma and that this damage was partially prevented by FA.
Fig 8.
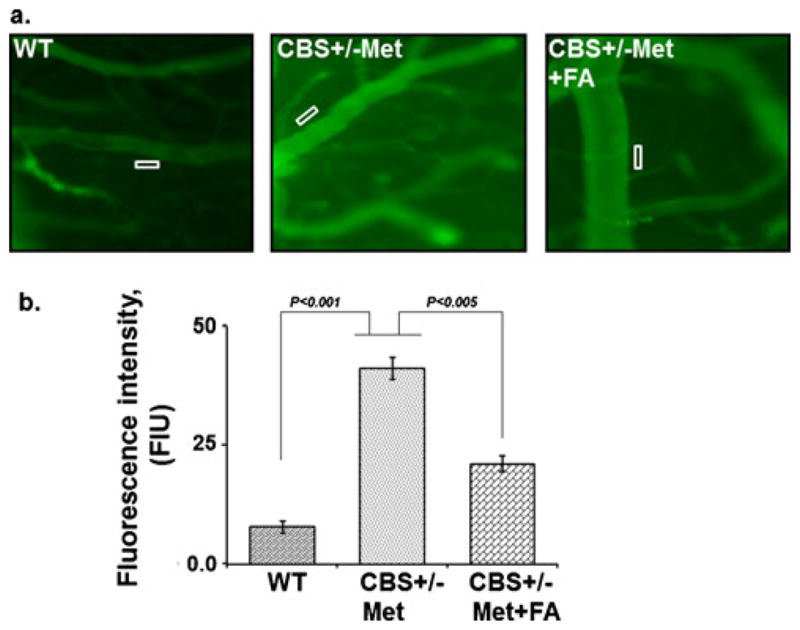
Effect of folic acid on macromolecular leakage of pial venules. a Fluorescence images recorded after infusion of BSA-FITC in WT, CBS+/−+ Met, and CBS+/−+Met+FA mice. b Representative bar graph for BSA leakage assessed by the fluorescence intensity of fluorescein isothiocya-nate–bovine serum albumin in the rectangular area of interest shown on images
Folic Acid Ablated Neurodegeneration During HHcy
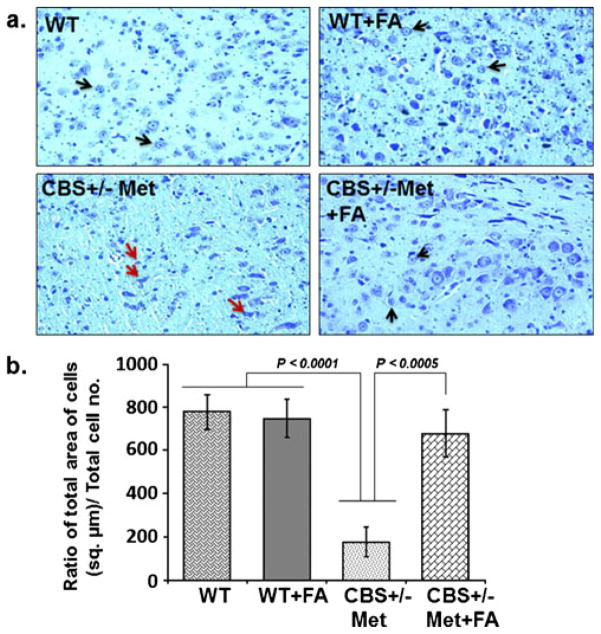
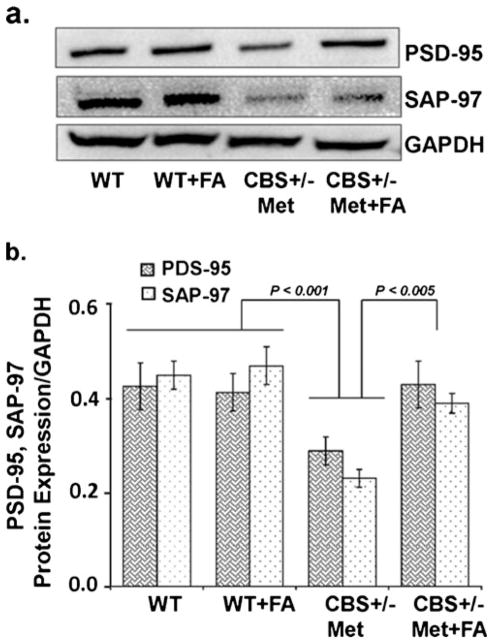
Neuronal cells respond against any change either adaptively or succumb to neurodegenerative cascades that result in brain disorders. In order to further address the protective role of FA against neurodegeneration, cresyl violet staining, Fluoro-Jade C staining, and expression of synaptic proteins were determined. Cresyl violet staining was used to assess cellular morphological alterations. The CBS+/−+Met group showed significant degradation of the cellular constituents indicated by decreased cell size (shrinkage) and cell number as compared to WT and WT+FA brains that exhibited healthy and numerous cells. However, FA supplementation to CBS+/−+ Met mouse brain remarkably vanish cellular alterations with an increase in cell number (Fig. 9a). Hence, significant degeneration of neuronal cells was observed as determined in terms of the ratio of the total area of cells (in square micrometers) to the total number of cells in CBS+/−+Met mouse brain (Fig. 9b). To further examine the neuroprotective effect of FA during HHcy, we stained mouse brain sections with FJC, which is a polyanionic fluorescein derivative and binds to degenerating neurons. A large number of FJC-positive cells were observed in CBS+/−+Met brains as compared to control brains. There was a significant decrease in degenerating neurons found in CBS+/−+Met mouse brains supplemented with FA (Fig. 10a, b). The loss of neuronal proteins associated with receptors and cytoskeletal elements at synapses is associated with neurodegeneration. We further determined the protein expression levels of synaptic markers by Western blot analysis. A significant decrease in synaptosome-associated protein-97 (SAP-97) and postsynaptic density-95 (PSD-95) protein expressions was observed in CBS+/−+Met brains as compared to control brains (Fig. 11a). However, folate supplementation remarkably improved the expressions of synapse proteins in CBS+/−+Met mouse brains (Fig. 11b).
Fig 9.
Cresyl violet staining. a Images of cresyl violet-stained cells. WT and WT+FA mouse brains show healthy and abundant cells (black arrow), while CBS+/−+Met brains show several cellular alterations: shrunken cells, collapsed nuclei, and reduced number of cells (red arrows). However, less shrunken and more number of cells were seen in CBS+/−+Met+FA brains, indicated by black arrows (×20 magnification). b Representative bar diagram scoring neurodegeneration and determined with the ratio of cell total area (in square micrometers) divided by the total number of cells
Fig 10.
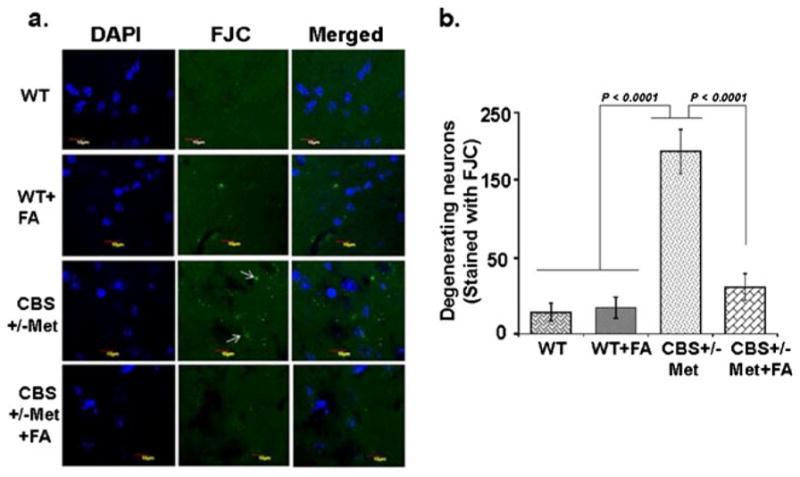
Fluoro-Jade C (FJC) staining of mouse brains. a Less number of FJC-stained degenerating neurons were seen in WT and WT+FA brain sections, indicating less number of neuronal cell death. CBS+/−+Met brain sections showed more number of FJC-positive neurons, reflecting more neuronal cell death (white arrows). Considerably less numbers of FJC-positive cells are observed in CBS+/−+Met+FA brain sections. b Bar diagram expressing FJC-positive cells (expressed in arbitrary unit). The quantitation was done through Image-Pro Plus 7.0 software
Fig 11.
Effect of folic acid on synaptic protein damage. a Representative Western blot images of PSD95 and SAP97 protein expressions in WT, WT+FA, CBS+/−+Met, and CBS+/−+Met+FA mouse brains. GAPDH was used as a loading control. b Bar diagram of PSD95 and SAP97 protein expressions normalized with GAPDH. Data represented mean± SE from n =4 per group
Discussion
HHcy is a risk factor for neurotoxicity and leads to brain damage (Obeid and Herrmann 2006). Studies have found the effect of concurrent administration of FA on memory deficits in rats that were subjected to chronic hyperhomocysteinemia (Matte et al. 2007). Few reports indicated the use of FA in epigenomic alterations in the brain, but the exact mechanism remains unclear (Pogribny et al. 2008). Furthermore, recent studies have described the potential use of a methionine-rich diet to induce HHcy in mouse models and its role in neuropathologies such as neurodegeneration and vascular dementia (Sudduth et al. 2013). However, these studies had limitations and indicated the use of genetic models in order to validate their outcomes (Dayal and Lentz 2008). Therefore, the aims of this study were to determine the effect of Hcy on neuropathologies associated with epigenetic modifications and whether nutrition supplementation for example folic acid can ameliorate these changes. We fed a methionine-rich diet to CBS+/−-deficient mice in order to accomplish a high HHcy model that mimics Alzheimer’s and stroke-like pathologies and studied the effect and mechanism of HHcy-induced cerebrovascular dysfunction and neurodegeneration along with epigenetic alterations in HHcy condition.
A previous study from our lab showed that the Hcy levels are not significantly reduced upon FA supplementation to CBS+/−mice (Tyagi et al. 2011). We fed methionine to CBS+/−mice, which raised the homocysteine levels; hence, the effect of folic acid could be significantly seen. In order to understand the role of FA treatment in the expression of Hcy metabolic pathway genes/proteins in brain tissue, we measured the expression of MTHFR and SAHH. Our results showed downregulation of MTHFR and upregulation of SAHH protein/gene expressions in the CBS+/−+Met brain, and this was mitigated with FA supplementation. In agreement, previous findings have reported that mutation in the MTHFR gene is implicated with multiple nervous system disorders (Chan et al. 2011).
Oxidative stress is considered as one of the earliest events associated as a pathological mechanism in HHcy in contributing to neurodegenerative diseases (Tyagi et al. 2005; Ho et al. 2003). Oxidative damage to the cells has been associated with the auto-oxidation of Hcy and triggers the production of reactive oxygen species (Tyagi et al. 2009). In the present study, we demonstrated that Met-fed HHcy brain exhibited high oxidative stress, which was determined by the high MDA (an end product of lipid peroxidation and a measurement of free radical generation), high nitrite levels (known to cause neuronal damage with ROS), and low GSH (antioxidants) levels. High MDA and nitrite and low GSH levels contribute to oxidative stress and quite suggestive of neurodegeneration (Kamat et al. 2010). Hence, oxidative stress was mitigated with FA supplementations, which reflects the antioxidative property of folate (Joshi et al. 2001). These results showed that FA ameliorated Hcy-induced oxidative stress that can lead to neurodegeneration and brain damage.
HHcy, along with oxidative stress, may alter the methylation status (Narayanan et al. 2013; Fleming et al. 2012). DNA methylation is one of the important epigenetic events, and impaired methylation has been linked to heart disease, stroke, neural tube defects, Alzheimer’s disease, colon cancer, reproductive cancers, kidney infarct, and impaired DNA repair. Methylation occurs when S-adenosine methionine (SAMe) donates a methyl group, which is then attached to the molecule that is being detoxified. SAMe then becomes S-adenosine homocysteine and, eventually, homocysteine. Nutritional supplementations, for example vitamin B6, B12, and folic acid, are necessary to reduce homocysteine and maintain normal methylation levels. DNA methyl transferases (DNMTs) are the enzymes that catalyze the transfer of a methyl group, and their high activity causes hypermethylation of the genes. This makes chromatin less accessible to transcript important genes to regulate smooth cell functioning. We found a significant increase in DNMT (DNMT-1, DNMT-3a) gene expression in the CBS+/−+Met model, which suggested increased DNA methylation levels. A high-methionine diet increases the levels of SAM, thereby providing methyl donors and increasing DNMT activity and the levels of Hcy. Folic acid supplementation facilitates the conversion of Hcy to methionine, thereby decreasing Hcy and increasing MTHFR activity. Eventually, this leads to the normalization of DNMT levels and methylation. In agreement with our study, previous studies have also found increased DNA methylation in hyperhomocysteinemia condition (Narayanan et al. 2013; Thaler et al. 2011).
Matrix metalloproteinases or “matrixins” degrade matrix and non-matrix proteins and deregulation of their controlled activity can lead to pathological stage. In addition, it has been shown that MMP-9 inhibitor protects neurovasculature (Cui et al. 2012). The controlled activity of matrixins remains under the influence of endogenous inhibitors such as tissue inhibitors of metalloproteinases (TIMPs); hence, the dis-balance between MMPs and TIMPs directs ECM remodeling, resulting in BBB permeability (Wald et al. 2002; Tyagi et al. 2010). Our previous reports have shown that HHcy mice displayed an increase in the mRNA expression of MMP-2, MMP-9, and TIMP-3 in brain tissue (Tyagi et al. 2010). Our current study demonstrated that HHcy increased the expression of MMP-2 and MMP-9 and decreased TIMP-1 and TIMP-2, and which returned to their normal levels in CBS+/−+Met mice with FA supplementation. The increased MMPs causes the degradation of TJP and BBB permeability (Feng et al. 2011). TJPs are known to maintain the blood–brain barrier (BBB) and solute transport. To investigate BBB permeability, we studied the TJ markers: ZO-1, ZO-2, and occludin. The levels of ZO-1, ZO-2, and occludins were remarkably decreased in CBS+/−+Met brain as compared to WT brains. However, folic acid supplementation significantly recovered tight junction proteins in CBS+/−+ Met+FA brains. Likewise, pre- and postsynaptic protein losses were also recovered by folic acid supplementation in CBS+/−+ Met mouse brains.
We further confirmed increased permeability using in vivo imaging fluorescent microscope with the BSA-FITC method. BSA leakage was more in CBS+/−+Met brains as compared to WT. CBS+/−+Met+FA brains convalesced profoundly and were shown to be less permeable as compared to CBS+/−+ Met brains. However, no permeability was seen in WT brains. Apart from this, neuronal degeneration was also significantly improved with folic acid supplementation in CBS+/−+Met+ FA mice, indicating the potential protective effect of FA.
Thus, in the present study, we determined that methionine feeding to CBS+/−mice caused high Hcy levels that increased oxidative stress in the brain along with increased DNMT activity and dis-balanced MMPs/TIMPs, which further altered brain tight junction proteins. HHcy also affected Hcy metabolism pathway regulatory genes and proteins along with brain structural integrity. The altered expressions of regulatory genes/ proteins increased the permeability of CBS+/−+Met brains, causing vasogenic edema and neurotoxicity. Interestingly, nutritional supplementation in the form of folic acid remarkably rescued the altered physiological, molecular, epigenetic, and functional parameters in Met-fed CBS+/−mouse brains, which shows its protective role in cerebrovascular and neurovascular pathologies. The mechanism is postulated in Fig. 12.
Fig 12.
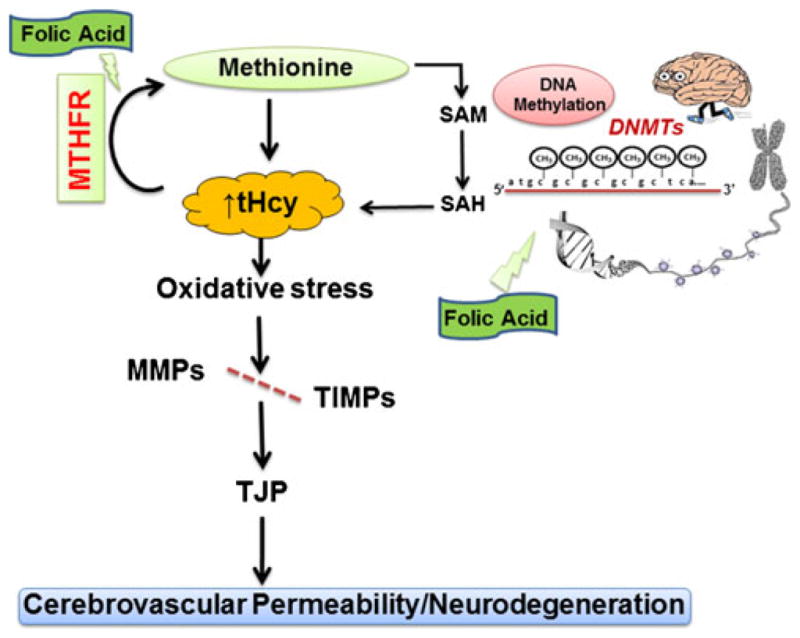
Scheme of overall hypothesis. In HHcy, oxidative stress increased DNMTactivity, induced MMP-2/MMP-9, and decreased TIMPs, degrading the tight junction protein, leading to an increase in cerebrovas-cular permeability and neurodegeneration. However, FA decreases the Hcy levels and ameliorates cerebrovascular remodeling along with neurodegeneration
Conclusions
Overall, these findings suggest a promising protective role of nutritional supplementation (FA) in ameliorating brain damage and epigenetic alterations associated with HHcy. From the present study, we were able to delineate the nutri-epigenetic mechanisms associated to improve Hcy-induced blood–brain barrier damage and neurodegeneration.
Acknowledgments
This work was supported by National Institutes of Health grants HL107640-NT.
Footnotes
Conflict of Interest The authors declared no conflict of interest.
Contributor Information
Anuradha Kalani, Department of Physiology and Biophysics, School of Medicine, University of Louisville, 500 South Preston Street, Louisville, KY 40202, USA.
Pradip K. Kamat, Department of Physiology and Biophysics, School of Medicine, University of Louisville, 500 South Preston Street, Louisville, KY 40202, USA
Srikanth Givvimani, Department of Physiology and Biophysics, School of Medicine, University of Louisville, 500 South Preston Street, Louisville, KY 40202, USA.
Kasey Brown, Department of Physiology and Biophysics, School of Medicine, University of Louisville, 500 South Preston Street, Louisville, KY 40202, USA.
Naira Metreveli, Department of Physiology and Biophysics, School of Medicine, University of Louisville, 500 South Preston Street, Louisville, KY 40202, USA.
Suresh C. Tyagi, Department of Physiology and Biophysics, School of Medicine, University of Louisville, 500 South Preston Street, Louisville, KY 40202, USA
Neetu Tyagi, Email: n0tyag01@louisville.edu, Department of Physiology and Biophysics, School of Medicine, University of Louisville, 500 South Preston Street, Louisville, KY 40202, USA.
References
- Alvarez-Sabin J, Delgado P, Abilleira S, Molina CA, Arenillas J, Ribo M, Santamarina E, Quintana M, Monasterio J, Montaner J. Temporal profile of matrix metalloproteinases and their inhibitors after spontaneous intracerebral hemorrhage: relationship to clinical and radiological outcome. Stroke. 2004;35:1316–1322. doi: 10.1161/01.STR.0000126827.69286.90. [DOI] [PubMed] [Google Scholar]
- Beard RS, Jr, Bearden SE. Vascular complications of cystathionine beta-synthase deficiency: future directions for homocysteine-to-hydrogen sulfide research. Am J Physiol Heart Circ Physiol. 2011;300:H13–H26. doi: 10.1152/ajpheart.00598.2010. [DOI] [PMC free article] [PubMed] [Google Scholar]
- Beard RS, Jr, Reynolds JJ, Bearden SE. Hyperhomocysteinemia increases permeability of the blood–brain barrier by NMDA receptor-dependent regulation of adherens and tight junctions. Blood. 2011;118:2007–2014. doi: 10.1182/blood-2011-02-338269. [DOI] [PMC free article] [PubMed] [Google Scholar]
- Brew K, Nagase H. The tissue inhibitors of metalloproteinases (TIMPs): an ancient family with structural and functional diversity. Biochim Biophys Acta. 2010;1803:55–71. doi: 10.1016/j.bbamcr.2010.01.003. [DOI] [PMC free article] [PubMed] [Google Scholar]
- Chan A, Ortiz D, Rogers E, Shea TB. Supplementation with apple juice can compensate for folate deficiency in a mouse model deficient in methylene tetrahydrofolate reductase activity. J Nutr Health Aging. 2011;15:221–225. doi: 10.1007/s12603-010-0295-3. [DOI] [PubMed] [Google Scholar]
- Chen KC, Wang YS, Hu CY, Chang WC, Liao YC, Dai CY, Juo SH. OxLDL up-regulates microRNA-29b, leading to epigenetic modifications of MMP-2/MMP-9 genes: a novel mechanism for cardiovascular diseases. FASEB J. 2011;25:1718–1728. doi: 10.1096/fj.10-174904. [DOI] [PubMed] [Google Scholar]
- Colado MI, O’Shea E, Granados R, Misra A, Murray TK, Green AR. A study of the neurotoxic effect of MDMA (‘ecstasy’) on 5-HT neurones in the brains of mothers and neonates following administration of the drug during pregnancy. Br J Pharmacol. 1997;121:827–833. doi: 10.1038/sj.bjp.0701201. [DOI] [PMC free article] [PubMed] [Google Scholar]
- Cui J, Chen S, Zhang C, Meng F, Wu W, Hu R, Hadass O, Lehmidi T, Blair GJ, Lee M, Chang M, Mobashery S, Sun GY, Gu Z. Inhibition of MMP-9 by a selective gelatinase inhibitor protects neurovasculature from embolic focal cerebral ischemia. Mol Neurodegener. 2012;7:21. doi: 10.1186/1750-1326-7-21. [DOI] [PMC free article] [PubMed] [Google Scholar]
- Dayal S, Lentz SR. Murine models of hyperhomocysteinemia and their vascular phenotypes. Arterioscler Thromb Vasc Biol. 2008;28:1596–1605. doi: 10.1161/ATVBAHA.108.166421. [DOI] [PMC free article] [PubMed] [Google Scholar]
- Ellman GL. Tissue sulfhydryl groups. Arch Biochem Biophys. 1959;82:70–77. doi: 10.1016/0003-9861(59)90090-6. [DOI] [PubMed] [Google Scholar]
- Feng S, Cen J, Huang Y, Shen H, Yao L, Wang Y, Chen Z. Matrix metalloproteinase-2 and -9 secreted by leukemic cells increase the permeability of blood–brain barrier by disrupting tight junction proteins. PLoS One. 2011;6:e20599. doi: 10.1371/journal.pone.0020599. [DOI] [PMC free article] [PubMed] [Google Scholar]
- Fleming JL, Phiel CJ, Toland AE. The role for oxidative stress in aberrant DNA methylation in Alzheimer’s disease. Curr Alzheimers Res. 2012;9:1077–1096. doi: 10.2174/156720512803569000. [DOI] [PubMed] [Google Scholar]
- Ho PI, Ashline D, Dhitavat S, Ortiz D, Collins SC, Shea TB, Rogers E. Folate deprivation induces neurodegeneration: roles of oxidative stress and increased homocysteine. Neurobiol Dis. 2003;14:32–42. doi: 10.1016/s0969-9961(03)00070-6. [DOI] [PubMed] [Google Scholar]
- Huang CW, Chen TH, Lin HS, Tseng YL, Lai SL, Chen WH, Chen SS, Liu JS. The relation between plasma homocysteine level and cardiovascular risk factors in cerebral ischemia. Acta Neurol Taiwan. 2007;16:81–85. [PubMed] [Google Scholar]
- Joshi R, Adhikari S, Patro BS, Chattopadhyay S, Mukherjee T. Free radical scavenging behavior of folic acid: evidence for possible antioxidant activity. Free Radic Biol Med. 2001;30:1390–1399. doi: 10.1016/s0891-5849(01)00543-3. [DOI] [PubMed] [Google Scholar]
- Kalani A, Kamat PK, Tyagi SC, Tyagi N. Synergy of homocysteine, microRNA, and epigenetics: a novel therapeutic approach for stroke. Mol Neurobiol. 2013;48:157–168. doi: 10.1007/s12035-013-8421-y. [DOI] [PMC free article] [PubMed] [Google Scholar]
- Kamat PK, Tota S, Saxena G, Shukla R, Nath C. Okadaic acid (ICV) induced memory impairment in rats: a suitable experimental model to test anti-dementia activity. Brain Res. 2010;1309:66–74. doi: 10.1016/j.brainres.2009.10.064. [DOI] [PubMed] [Google Scholar]
- Kumar M, Tyagi N, Moshal KS, Sen U, Kundu S, Mishra PK, Givvimani S, Tyagi SC. Homocysteine decreases blood flow to the brain due to vascular resistance in carotid artery. Neurochem Int. 2008;53:214–219. doi: 10.1016/j.neuint.2008.07.008. [DOI] [PMC free article] [PubMed] [Google Scholar]
- Matte C, Scherer EB, Stefanello FM, Barschak AG, Vargas CR, Netto CA, Wyse AT. Concurrent folate treatment prevents Na+, K+-ATPase activity inhibition and memory impairments caused by chronic hyperhomocysteinemia during rat development. Int J Dev Neurosci. 2007;25:545–552. doi: 10.1016/j.ijdevneu.2007.10.003. [DOI] [PubMed] [Google Scholar]
- Mattson MP, Chan SL, Duan W. Modification of brain aging and neurodegenerative disorders by genes, diet, and behavior. Physiol Rev. 2002;82:637–672. doi: 10.1152/physrev.00004.2002. [DOI] [PubMed] [Google Scholar]
- McNeil CJ, Beattie JH, Gordon MJ, Pirie LP, Duthie SJ. Differential effects of nutritional folic acid deficiency and moderate hyperhomocysteinemia on aortic plaque formation and genome-wide DNA methylation in vascular tissue from ApoE−/−mice. Clin Epigenetics. 2011;2:361–368. doi: 10.1007/s13148-011-0022-x. [DOI] [PMC free article] [PubMed] [Google Scholar]
- Muradashvili N, Qipshidze N, Munjal C, Givvimani S, Benton RL, Roberts AM, Tyagi SC, Lominadze D. Fibrinogen-induced increased pial venular permeability in mice. J Cereb Blood Flow Metab. 2012;32:150–163. doi: 10.1038/jcbfm.2011.144. [DOI] [PMC free article] [PubMed] [Google Scholar]
- Narayanan N, Tyagi N, Shah A, Pagni S, Tyagi SC. Hyperhomocysteinemia during aortic aneurysm, a plausible role of epigenetics. Int J Physiol Pathophysiol Pharmacol. 2013;5:32–42. [PMC free article] [PubMed] [Google Scholar]
- Obeid R, Herrmann W. Mechanisms of homocysteine neurotoxicity in neurodegenerative diseases with special reference to dementia. FEBS Lett. 2006;580:2994–3005. doi: 10.1016/j.febslet.2006.04.088. [DOI] [PubMed] [Google Scholar]
- Pogribny IP, Karpf AR, James SR, Melnyk S, Han T, Tryndyak VP. Epigenetic alterations in the brains of Fisher 344 rats induced by long-term administration of folate/methyl-deficient diet. Brain Res. 2008;1237:25–34. doi: 10.1016/j.brainres.2008.07.077. [DOI] [PubMed] [Google Scholar]
- Rosell A, Ortega-Aznar A, Alvarez-Sabin J, Fernandez-Cadenas I, Ribo M, Molina CA, Lo EH, Montaner J. Increased brain expression of matrix metalloproteinase-9 after ischemic and hemorrhagic human stroke. Stroke. 2006;37:1399–1406. doi: 10.1161/01.STR.0000223001.06264.af. [DOI] [PubMed] [Google Scholar]
- Schmued LC, Stowers CC, Scallet AC, Xu L. Fluoro-Jade C results in ultra high resolution and contrast labeling of degenerating neurons. Brain Res. 2005;1035:24–31. doi: 10.1016/j.brainres.2004.11.054. [DOI] [PubMed] [Google Scholar]
- Selhub J. Homocysteine metabolism. Annu Rev Nutr. 1999;19:217–246. doi: 10.1146/annurev.nutr.19.1.217. [DOI] [PubMed] [Google Scholar]
- Sudduth TL, Powell DK, Smith CD, Greenstein A, Wilcock DM. Induction of hyperhomocysteinemia models vascular dementia by induction of cerebral microhemorrhages and neuroinflammation. J Cereb Blood Flow Metab. 2013;33:708–715. doi: 10.1038/jcbfm.2013.1. [DOI] [PMC free article] [PubMed] [Google Scholar]
- Swarnkar S, Singh S, Sharma S, Mathur R, Patro IK, Nath C. Rotenone induced neurotoxicity in rat brain areas: a histopathological study. Neurosci Lett. 2011;501:123–127. doi: 10.1016/j.neulet.2011.03.036. [DOI] [PubMed] [Google Scholar]
- Thaler R, Agsten M, Spitzer S, Paschalis EP, Karlic H, Klaushofer K, Varga F. Homocysteine suppresses the expression of the collagen cross-linker lysyl oxidase involving IL-6, Fli1, and epigenetic DNA methylation. J Biol Chem. 2011;286:5578–5588. doi: 10.1074/jbc.M110.166181. [DOI] [PMC free article] [PubMed] [Google Scholar]
- Topakian R, Barrick TR, Howe FA, Markus HS. Blood–brain barrier permeability is increased in normal-appearing white matter in patients with lacunar stroke and leucoaraiosis. J Neurol Neurosurg Psychiatry. 2010;81:192–197. doi: 10.1136/jnnp.2009.172072. [DOI] [PubMed] [Google Scholar]
- Tucker KL, Qiao N, Scott T, Rosenberg I, Spiro A., III High homocysteine and low B vitamins predict cognitive decline in aging men: the Veterans Affairs Normative Aging Study. Am J Clin Nutr. 2005;82:627–635. doi: 10.1093/ajcn.82.3.627. [DOI] [PubMed] [Google Scholar]
- Tyagi N, Givvimani S, Qipshidze N, Kundu S, Kapoor S, Vacek JC, Tyagi SC. Hydrogen sulfide mitigates matrix metalloproteinase-9 activity and neurovascular permeability in hyperhomocysteinemic mice. Neurochem Int. 2010;56:301–307. doi: 10.1016/j.neuint.2009.11.002. [DOI] [PMC free article] [PubMed] [Google Scholar]
- Tyagi N, Kandel M, Munjal C, Qipshidze N, Vacek JC, Pushpakumar SB, Metreveli N, Tyagi SC. Homocysteine mediated decrease in bone blood flow and remodeling: role of folic acid. J Orthop Res. 2011;29:1511–1516. doi: 10.1002/jor.21415. [DOI] [PMC free article] [PubMed] [Google Scholar]
- Tyagi N, Moshal KS, Sen U, Vacek TP, Kumar M, Hughes WM, Jr, Kundu S, Tyagi SC. H2S protects against methionine-induced oxidative stress in brain endothelial cells. Antioxid Redox Signal. 2009;11:25–33. doi: 10.1089/ars.2008.2073. [DOI] [PMC free article] [PubMed] [Google Scholar]
- Tyagi N, Sedoris KC, Steed M, Ovechkin AV, Moshal KS, Tyagi SC. Mechanisms of homocysteine-induced oxidative stress. Am J Physiol Heart Circ Physiol. 2005;289:H2649–H2656. doi: 10.1152/ajpheart.00548.2005. [DOI] [PubMed] [Google Scholar]
- Visse R, Nagase H. Matrix metalloproteinases and tissue inhibitors of metalloproteinases: structure, function, and biochemistry. Circ Res. 2003;92:827–839. doi: 10.1161/01.RES.0000070112.80711.3D. [DOI] [PubMed] [Google Scholar]
- Wald DS, Law M, Morris JK. Homocysteine and cardiovascular disease: evidence on causality from a meta-analysis. BMJ. 2002;325:1202. doi: 10.1136/bmj.325.7374.1202. [DOI] [PMC free article] [PubMed] [Google Scholar]
- Wardlaw JM, Doubal F, Armitage P, Chappell F, Carpenter T, Munoz MS, Farrall A, Sudlow C, Dennis M, Dhillon B. Lacunar stroke is associated with diffuse blood–brain barrier dysfunction. Ann Neurol. 2009;65:194–202. doi: 10.1002/ana.21549. [DOI] [PubMed] [Google Scholar]


