

Notch1 is required to generate the earliest embryonic hematopoietic stem cells (HSCs), and Notch-deficient embryos die early in gestation. Gerhardt et al. show that, unlike Notch1-deficient mice, mice lacking the Notch1 transcriptional activation domain (TAD) survive until late gestation. Notch1 TAD-deficient HSCs emerge and successfully migrate to the fetal liver but are decreased in frequency by E14.5. The Notch1 TAD is important to properly assemble the Notch1/Rbpj/Maml transcription complex. These results reveal an essential role for the Notch1 TAD in fetal development.
Keywords: Notch, hematopoietic stem cell, transcriptional activation domain
Abstract
Notch1 is required to generate the earliest embryonic hematopoietic stem cells (HSCs); however since Notch-deficient embryos die early in gestation, additional functions for Notch in embryonic HSC biology have not been described. We used two complementary genetic models to address this important biological question. Unlike Notch1-deficient mice, mice lacking the conserved Notch1 transcriptional activation domain (TAD) show attenuated Notch1 function in vivo and survive until late gestation, succumbing to multiple cardiac abnormalities. Notch1 TAD-deficient HSCs emerge and successfully migrate to the fetal liver but are decreased in frequency by embryonic day 14.5. In addition, TAD-deficient fetal liver HSCs fail to compete with wild-type HSCs in bone marrow transplant experiments. This phenotype is independently recapitulated by conditional knockout of Rbpj, a core Notch pathway component. In vitro analysis of Notch1 TAD-deficient cells shows that the Notch1 TAD is important to properly assemble the Notch1/Rbpj/Maml trimolecular transcription complex. Together, these studies reveal an essential role for the Notch1 TAD in fetal development and identify important cell-autonomous functions for Notch1 signaling in fetal HSC homeostasis.
Notch signaling is an evolutionarily conserved pathway that regulates binary cell fate decisions during fetal and adult development (Artavanis-Tsakonas et al. 1999). Signaling initiates when Notch receptors bind Notch ligands on a neighboring cell, leading to cleavage and nuclear translocation of the intracellular portion of Notch (ICN). Within the nucleus, Notch forms a transcriptional activation complex through interactions with the DNA-binding protein Rbpj and Mastermind (Maml), which functions as a coactivator via recruitment of the histone acetyltransferase p300 (Oswald et al. 2001; Fryer et al. 2002; Nam et al. 2006; Kovall and Blacklow 2010). The assembly and function of the Notch transcription complex require multiple distinct intracellular Notch1 (ICN1) domains, which play specific roles in mediating Notch1 activity (Aster et al. 2000; Gordon et al. 2008; Kopan and Ilagan 2009). These include the RAM and Ankyrin repeat (ANK) domains. The RAM domain contains a high-affinity binding site for Rbpj, while the ANK domain forms weak contacts with Rbpj and is essential for recruiting Maml (Nam et al. 2006; Wilson and Kovall 2006; Gordon et al. 2008). The C terminus of ICN1 contains a PEST sequence that modulates Notch protein degradation (Kovall and Blacklow 2010) and is frequently involved in loss-of-function mutations in human T-cell acute lymphoblastic leukemia (T-ALL) (Weng et al. 2004) and chronic lymphocytic leukemia (Puente et al. 2011). Between the ANK and PEST domains is the Notch transcriptional activation domain (TAD), which is capable of autonomous transcriptional activation (Kurooka et al. 1998; Kurooka and Honjo 2000; Fryer et al. 2002). Following formation of a functional transcriptional complex, Notch1 is subsequently phosphorylated in both the TAD and PEST domains by Maml-associated kinases, such as CDK8 (Fryer et al. 2004). Phosphorylation of these sites targets Notch1 for ubiquitination by ligases that include FBXW7 and ensuing proteasomal degradation (Fryer et al. 2002, 2004; O’Neil et al. 2007; Thompson et al. 2007).
Unlike the RAM, ANK, and PEST domains, which are highly conserved, the TAD shows substantial evolutionary divergence among the four mammalian Notch receptors. The Notch1 TAD is homologous to its Drosophila counterpart, while Notch2 contains a recognizable TAD whose activity is weaker than Notch1 (Kurooka et al. 1998). In contrast, Notch3 contains a TAD that shares minimal function and sequence conservation with the Notch1 counterpart (Kurooka et al. 1998; Ong et al. 2006), while Notch4 lacks a TAD. The Notch1 TAD is required for optimal transcriptional activity of ICN1 in vitro and for ICN1-induced T-ALL in vivo (Aster et al. 2000). The Notch1 TAD directly interacts with the transcriptional coactivators PCAF and GCN5, and since these interactions also require the ANK domain (Kurooka et al. 1998; Kurooka and Honjo 2000), they are believed to augment Notch1-induced transcription by recruiting additional coactivators or stabilizing the association of p300 with the Notch transcriptional complex (Oswald et al. 2001; Fryer et al. 2002; Wallberg et al. 2002). However, study of the TAD has been limited to cell culture-based systems.
Notch1 exerts multiple essential roles in development. Loss of either Notch1 or components of the Notch signaling pathway leads to early embryonic demise associated with defects in vasculogenesis, somitogenesis, and cardiogenesis (Swiatek et al. 1994; Conlon et al. 1995; Lawson et al. 2001; Koo et al. 2005). Notch1 is also required between embryonic day 9.5 (E9.5) and E10.5 to generate the first definitive adult hematopoietic stem cells (HSCs) in the aorta–gonad–mesonephros (AGM) region (Kumano et al. 2003; Hadland et al. 2004). Definitive HSCs are defined by their ability to provide long-term, multilineage reconstitution (Dzierzak and Speck 2008). Shortly after generation, HSCs migrate to the fetal liver (FL), where they undergo a phase of dramatic expansion while retaining their capacity for long-term reconstitution (Morrison et al. 1995; Ema and Nakauchi 2000). Ultimately, HSCs migrate to the bone marrow (BM) in late gestation, where they persist, providing a continuous supply of blood cells through adulthood (Dzierzak and Speck 2008). Since constitutive loss of Notch signaling results in major vascular defects and death by E10.5 (Krebs et al. 2000), it has been difficult to study Notch1 functions in fetal hematopoiesis after induction of the definitive HSCs. As Notch1 is not essential for adult HSC homeostasis (Mancini et al. 2005; Maillard et al. 2008), it is unclear whether Notch signaling provides important functions in HSCs subsequent to establishing the earliest definitive HSCs in the AGM.
In order to investigate the role of the Notch1 TAD in development, we generated Notch1 knock-in mice lacking the TAD. In contrast to Notch1-null mice, our mice lacking the Notch1 TAD (ΔTAD/ΔTAD) frequently develop to late gestation and eventually succumb to multiple cardiovascular anomalies (High and Epstein 2007; High et al. 2009). We obtained viable ΔTAD/ΔTAD embryos at E14.5 in order to investigate the requirement of the Notch1 TAD in FL hematopoiesis. Although the ΔTAD/ΔTAD embryos have an intact hematopoietic system and HSCs successfully migrate from the AGM to the FL, the number of E14.5 FL HSCs in ΔTAD/ΔTAD embryos was markedly reduced. Competitive transplants of highly purified long-term FL HSCs into lethally irradiated recipient mice revealed cell-intrinsic defects of the ΔTAD/ΔTAD HSCs, a finding that was confirmed in Rbpjf/f × Vav-Cre conditional knockout mice. Our studies identify an important and novel function for Notch1 in fetal HSC homeostasis and highlight the role of the Notch1 TAD in mammalian development.
Results
Generation of ΔTAD/ΔTAD mice
To determine the function of the Notch1 transactivation domain in vivo, we generated knock-in mice expressing a Notch1 mutant lacking the TAD (ΔTAD/ΔTAD). We constructed a gene targeting vector by PCR-directed deletion of the 609-base-pair (bp) sequence encoding the TAD from the mouse Notch1 gene (Fig. 1A). The Notch1 ΔTAD knock-in mutation was achieved by homologous recombination of the targeting vector with the endogenous Notch1 gene in mouse embryonic stem cells. We verified deletion of the TAD by sequencing and PCR genotyping of genomic DNA from offspring (Fig. 1B). The level of Notch1 mRNA expression in mouse embryonic fibroblasts (MEFs) generated from ΔTAD/ΔTAD and wild-type (+/+) littermate controls was similar (Fig. 1C). In order to confirm that the deletion of the Notch1 TAD had the expected effect on the structure of the Notch1 protein, primary CD4 T cells from +/+, +/ΔTAD, or ΔTAD/ΔTAD FL transplant recipients were isolated and activated to stimulate Notch signaling. Immunoblotting for expression of cleaved Notch1 (Val1744) in nuclear extracts showed the presence of the ∼100-kD band specific for cleaved Notch1 in the +/+ and +/ΔTAD T cells and an ∼80-kD band in the +/ΔTAD and ΔTAD/ΔTAD T cells that is the expected size of a Notch1 protein bearing the ΔTAD mutation. Taken together, these results demonstrate that the ΔTAD mutation did not impair transcription, translation, cleavage, or nuclear localization of Notch1. However, the amount of ΔTAD protein was increased relative to wild-type Notch1 protein (Fig. 1D). Given that the TAD mutation does not appear to influence mRNA levels (Fig. 1C), this difference likely stems from post-transcriptional factors.
Figure 1.

The Notch1 TAD deletion is a hypomorphic mutation. (A) The Notch1 TAD was deleted by homologous recombination using a targeting vector designed to delete the genomic region of mouse Notch1 corresponding to the TAD (extending roughly from a Xho site to a SacI site). (B) Deletion of the TAD (609 bp) was verified by PCR using primers flanking the TAD. (C) Loss of the Notch1 TAD does not affect Notch1 mRNA expression. mRNA was prepared from +/+ and ΔTAD/ΔTAD MEFs and subsequently used for qPCR. Transcripts from +/+ and ΔTAD/ΔTAD cells were amplified with unique primers. PCR products specific for ΔTAD/ΔTAD transcripts yielded product below the limit of detection in +/+ cells. Primers specific for +/+ transcripts yielded product below the limit of detection in ΔTAD/ΔTAD cells. “F” indicates forward primer, and “R” indicates reverse primer. (D) Notch1 expression. Nuclear extracts were prepared from splenic CD4+ T cells derived from transplanted +/+, +/ΔTAD, and ΔTAD/ΔTAD FL cells and were used for Western blot. Blots were probed with antibody specific for Notch1 cleaved at Val1744. β-Actin was the loading control. (E) Cross-sections of wild-type and ΔTAD/ΔTAD hearts at E18.5. The ΔTAD/ΔTAD heart shows a ventricular septal defect (VSD). (RV) right ventricle; (LV) left ventricle. (F) Deletion of the Notch1 TAD is a hypomorphic mutation. Notch1+/in32 mice were bred with +/ΔTAD to generate Notch1in32/ΔTAD embryos. Notchin32/ΔTAD embryos were harvested at E9.5. Control embryos from +/ΔTAD × +/ΔTAD matings were harvested at E10.5. Normal gross development was observed in ΔTAD/ΔTAD E10.5 mutant embryos. Retarded development and an enlarged pericardial sac were observed in Notch1in32/ΔTAD embryos. See also Supplemental Figure S1.
Although the TAD deletion leaves intact PEST sequences that are known to influence Notch1 degradation, it is also believed that sequences in the TAD stimulate Notch1 protein turnover (Fryer et al. 2004; Chiang et al. 2006). We tested the relative stability of ΔTAD and wild-type Notch1 proteins by looking at the rate of disappearance of the activated forms of these proteins in cells treated with a γ secretase inhibitor (GSI), which blocks the generation of active Notch1. Immunoblot analysis conducted with +/+, +/ΔTAD, and ΔTAD/ΔTAD cells documented the existence of a long-lived pool of ΔTAD protein in both the +/ΔTAD and ΔTAD/ΔTAD cells (Supplemental Fig. S1A), suggesting that decreased turnover contributes to the accumulation of ΔTAD protein.
ΔTAD is a hypomorphic Notch1 mutation
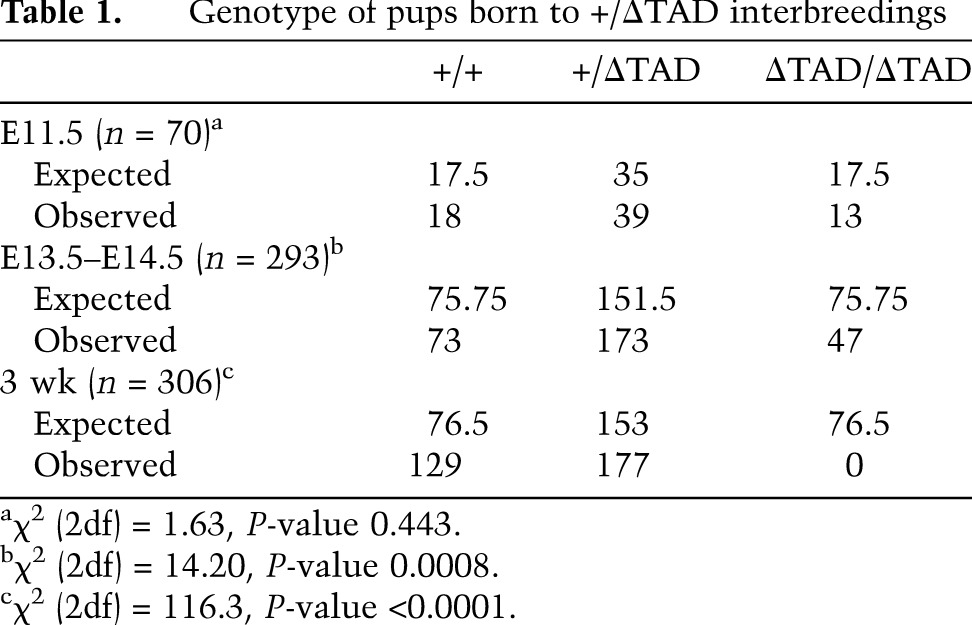
No viable ΔTAD/ΔTAD progeny were born by breeding heterozygous (+/ΔTAD) adults, indicating the mutation resulted in death shortly after birth or during embryonic development (Table 1). Timed matings yielded ΔTAD/ΔTAD embryos at expected Mendelian ratios at mid-gestation (E11.5). Genotypic analysis of E13.5–E14.5 litters revealed partial embryonic lethality of ΔTAD/ΔTAD embryos (Table 1), although mutant embryos that were recovered at this time appeared grossly normal (Supplemental Fig. S1B). Histopathology of ΔTAD/ΔTAD embryos that survived to late gestation (E18.5) revealed multiple cardiovascular defects, including abnormal outflow tract (OFT) development and ventricular septal defects (Fig. 1E). These cardiovascular abnormalities were similar to those caused by genetic or pharmacologic inhibition of the Notch pathway and are reminiscent of inhibiting Notch signaling in cardiac neural crest and second heart field myocardial precursors, both of which cause perinatal lethality (High et al. 2007, 2009). In contrast to ΔTAD/ΔTAD embryos, +/ΔTAD embryos were born at Mendelian ratios and appeared normal.
Table 1.
Genotype of pups born to +/ΔTAD interbreedings
Although the failure of the Notch1 ΔTAD retrovirus to induce T-cell leukemia in BM transplants (Aster et al. 2000) suggests that the Notch1 TAD deletion is a hypomorphic mutation, the increased amount of the ΔTAD protein raised the possibility that the TAD deletion might actually enhance Notch1 function in vivo. To directly address this issue, we used a genetic approach in which Notch1 dose was titrated by crossing +/ΔTAD mice to mice heterozygous for loss of Notch1 function (+/Notch1in32) (Swiatek et al. 1994). We hypothesized that if the Notch1 TAD deletion was a hypomorphic mutation, then a further decrease in Notch signaling in ΔTAD/Notch1in32 embryos would cause developmental abnormalities reminiscent of Notch1 loss-of-function mutations (Swiatek et al. 1994). Timed matings between +/ΔTAD and +/Notch1in32 produced embryos that were sacrificed at E9.5–E10.5, the time when mice with Notch1 loss-of-function mutations (Notch1in32/in32) first exhibit developmental defects (Swiatek et al. 1994; Oka et al. 1995). Three of the four possible genotypes from this mating develop normally, and at mid-gestation, the +/+, +/ΔTAD, and Notch1in32/+ embryos were physiologically similar and comparable with the ΔTAD/ΔTAD embryos (Fig. 1F; data not shown). In contrast to their littermates and the ΔTAD/ΔTAD embryos at E9.5, all embryos (n = 3) with a Notch1 loss of function on one allele and deletion of the Notch1 TAD on the other allele (Notch1in32/ΔTAD) were developmentally stunted and had abnormal yolk sac vasculature and enlarged pericardial sacs, defects frequently seen in homozygous Notch1 loss-of-function mutants (Fig. 1F, bottom right image). We were unable to obtain Notch1in32/ΔTAD embryos at E11.5, indicating that embryonic lethality occurred before E11.5. Further support for the hypomorphic nature of the Notch1 ΔTAD was evident in the E18.5 ΔTAD/ΔTAD thymus, in which the number of thymocytes and percentage of CD4+CD8+ double-positive (DP) T cells was significantly decreased compared with littermate controls (Supplemental Fig. S1C,D). Together, these data suggest that the TAD deletion produced a hypomorphic Notch1 allele.
Notch1 signaling in FL HSCs
Survival of the ΔTAD/ΔTAD mice to E14.5 provided the opportunity to study Notch function in FL hematopoiesis, which was previously difficult to study in vivo due to the early embryonic death of Notch1-null mice. To characterize Notch1 signaling in FL HSCs, we measured Notch1 expression and signaling in E14.5 murine FL HSCs. Using a Notch1 mAb to measure Notch1 surface expression by flow cytometry (Fig. 2A), we confirmed the presence of Notch1 on the surface of E14.5 FL hematopoietic cells (CD45+) (Schmitt and Zuniga-Pflucker 2002; Fiorini et al. 2009). Beginning at E14.5, the surface markers Kit, Sca1, CD150, and CD48 and the absence of lineage markers can be used to stringently identify a population of long-term HSCs (LT-HSCs) (Kiel et al. 2005; Kim et al. 2006), referred to hereafter as SLAM-LSKs (Lin−Sca1+Kit+CD150+CD48−). Notch1 expression was greater on the LT-HSC-enriched CD45+ SLAM-LSKs than on the bulk population of hematopoietic cells (CD45+) (Fig. 2B).
Figure 2.

Notch1 signaling in the E14.5 FL. (A) Notch1 is expressed on the surface of FL hematopoietic progenitors and HSCs. E14.5 FLs from wild-type B6 embryos were stained for SLAM-LSK markers and Notch1 or isotype control antibody. Flow cytometry plots are representative of three independent experiments. (B) Average fold mean fluorescent intensity (MFI) of Notch1-expressing E14.5 FL hematopoietic cells (CD45+) and SLAM-LSKs over isotype control. (C) Notch1 is cleaved in E14.5 FL HSCs (CD45+ SLAM-LSKs). Wild-type DN3 thymocytes, DP thymocytes, and BM SLAM-LSKs were used as additional controls for detection of cleaved Notch1. Following surface staining, cells were fixed, permeabilized, and stained for ICN1 (Val1744). (D) Graph represents average fold MFI of ICN1 over background staining. (E) Expression of Hes1 mRNA in sorted hematopoietic cells. All values were normalized to Ef1α. Populations are similar to C.
Surface Notch1 expression marks cells with the potential to signal through Notch1 but does not measure active Notch1 signaling. Since Notch1 cleavage is a prerequisite for Notch1 activation, measuring cleaved ICN1 is a more accurate indication of Notch activity. We used intracellular flow cytometry to measure the cleaved Notch1 intracellular peptide in E14.5 FL SLAM-LSK LT-HSCs (Fig. 2C). The level of expression in FL HSCs was similar to expression in DN3 thymocytes, a population known to have robust Notch signaling, and higher than in both DP thymocytes and BM SLAM-LSKs, which are populations known to have low Notch activity (Fig. 2D; Huang et al. 2003; Maillard et al. 2008; Fiorini et al. 2009; Yashiro-Ohtani et al. 2009).
To measure downstream events of Notch cleavage and further validate Notch activity, we quantified expression of the direct Notch target Hes1 in sorted hematopoietic cells (Fig. 2E). Consistent with previous studies, Hes1 mRNA was present at high levels in DN3 thymocytes and low levels in DP thymocytes and BM SLAM-LSKs (Maillard et al. 2008; Yashiro-Ohtani et al. 2009). We detected significantly higher expression of Hes1 in E14.5 FL SLAM-LSKs compared with DP thymocytes and BM SLAM-LSKs, although the level was not as high as in DN3 thymocytes. These data are consistent with a recent study using a GFP allele knocked into the murine Hes1 locus, which showed higher levels of Hes1 expression in FL HSCs compared with more differentiated FL progenitors and BM HSCs (Oh et al. 2013). Together, these data demonstrate that Notch1 is activated in FL HSCs and point to a possible physiologic role for Notch signaling in the FL.
The Notch1 TAD is not required for HSC emergence
Survival of the ΔTAD/ΔTAD mice to mid-gestation provided the opportunity to investigate the functional effect of Notch signaling on several crucial stages of embryonic HSC development, including hemogenic endothelium differentiation, migration of HSCs to the FL, and expansion, survival, and maturation in the FL. As Notch1 is required to generate the first definitive LT-HSCs, we investigated the effect of the Notch1 TAD deletion on the generation of embryonic HSCs. To address this, we analyzed phenotypic HSCs in the AGM, which at E11.5 are found within a population of clustered hematopoietic cells that coexpress the endothelial marker CD144 (VE-cadherin) and the pan-hematopoietic marker CD45 (North et al. 2002; Taoudi et al. 2005). The numbers of CD144+CD45+ cells were similar in the AGM and FL of +/+, +/ΔTAD, and ΔTAD/ΔTAD E11.5 embryos (Fig. 3A,B). An alternative method of assessing emerging phenotypic HSCs in the AGM relies on the identification of cells that coexpressed Kit and CD31. The Kit+CD31+ cells of the AGM from the ΔTAD/ΔTAD E11.5 embryos were similar in number to wild-type littermates (Supplemental Fig. S2A; Yokomizo and Dzierzak 2010). These data suggest that the Notch1 TAD is unnecessary for either the emergence of embryonic HSCs or their migration to the FL.
Figure 3.

Increased apoptosis in FL ΔTAD/ΔTAD LT-HSCs. (A) Flow cytometry analysis of E11.5 AGM regions and E11.5 FLs from +/+ and ΔTAD/ΔTAD embryos. Cells were gated on 7-AAD−TER−119− populations. Endothelial cells were identified as CD144+, hematopoietic progenitors are CD45+, and HSCs are CD45+CD144+. (B) Absolute numbers of cells gated as CD45+CD144+ (as depicted in A) in E11.5 AGM regions and E11.5 FLs from three independent experiments. (C) Cell cycle analysis of +/+ and ΔTAD/ΔTAD E14.5 FL SLAM-LSKs. Representative flow cytometry plot of the cell cycle by DAPI and Ki-67. (D) The bar graph represents percentages of SLAM-LSKs in each cell cycle stage from three independent experiments. (E) Increased apoptosis in ΔTAD/ΔTAD E14.5 FL SLAM-LSKs. Representative flow cytometry plots of Annexin V+ cells from +/+ (dotted line) and ΔTAD/ΔTAD (bold gray line) E14.5 FL SLAM-LSKs. Annexin V expression on internal control Lin+ cells of +/+ (solid black line) and ΔTAD/ΔTAD (light-gray shading) was used to determine the positive gate for Annexin V staining. (F) The bar graph represents the normalized percentage of Annexin V+ 7-AAD− cells from E14.5 +/+ and ΔTAD/ΔTAD FL SLAM-LSKs (n = 4). Values were determined by subtracting the mean percentage of +/+ Annexin V+ Lin+ cells (calculated as percent Annexin V+ cells ± SEM, which was 1.600 ± 0.147; n = 4) from the mean percentage of Annexin V+ +/+ SLAM-LSKs and by subtracting the mean percentage of ΔTAD/ΔTAD Annexin V+ Lin+ cells (4.025 ± 0.728; n = 4) from the mean percentage of Annexin V+ ΔTAD/ΔTAD SLAM-LSKs.
Notch1 ΔTAD FL LT-HSCs exhibit survival defects
After migration to the FL, HSCs continue their maturation and expansion (Ema and Nakauchi 2000; Kieusseian et al. 2012). We next asked whether ΔTAD/ΔTAD FL HSCs exhibited defects in growth and/or survival. We tested the capacity of ΔTAD/ΔTAD FL cells to progress through the cell cycle by labeling with DAPI and Ki67. We observed no defects of cell cycle entry or progression of ΔTAD/ΔTAD FL SLAM-LSKs or LSKs (Fig. 3C,D; Supplemental Fig. 2B). To assess survival, we measured 7-AAD and Annexin V expression in FL SLAM-LSKs from +/+ and ΔTAD/ΔTAD embryos (Fig. 3E,F). The percentage of early apoptotic (7-AAD−/Annexin V+) SLAM-LSKs was significantly increased in ΔTAD/ΔTAD FL cells compared with +/+ FL cells (Fig. 3F). We observed a similar increase in Annexin V in ΔTAD/ΔTAD LSKs (Supplemental Fig. S2C). These data suggest that signaling involving the Notch1 TAD contributes to FL LT-HSC survival but not to the proliferation of these cells. Analysis of FL histology among littermates indicated that while total FL cellularity was reduced in E14.5 ΔTAD/ΔTAD FLs, gross structural abnormalities were not evident (Supplemental Fig. S2DE). Because the ΔTAD mutation is constitutive, we cannot exclude the possibility that non-cell-autonomous defects in the FL niche contribute to the observed decrease in HSC survival.
FL transplants indicate a role for the Notch1 ΔTAD in HSC development
To investigate the role of the Notch1 TAD in HSC function, we performed FL transplants from E14.5 ΔTAD/ΔTAD embryos. Unsorted E14.5 FL cells from +/ΔTAD or ΔTAD/ΔTAD (C57BL/6 CD45.2+) were transplanted into congenic, lethally irradiated SJL (B6-Ly5.2/Cr CD45.1+) recipients (Fig. 4A). B-cell, T-cell, and myeloid lineages were present in recipients of ΔTAD/ΔTAD E14.5 FL cells; however, there was a partial block in thymocyte development from the CD4−CD8− double-negative (DN) to the CD4+CD8+ DP stage, as evidenced by decreases in the percentage and absolute numbers of thymic CD45.2-derived cells (Fig. 4B; Supplemental Fig. S3A,B). We also observed decreased percentages of CD4+ and CD8+ T cells in the peripheral blood but did not find differences in the number or percentage of splenic CD19+ or Gr1+ cells (Fig. 4B; Supplemental Fig. S3A,B). The T-cell findings were reminiscent of conditional Notch1 and Rbpj knockout alleles (Wolfer et al. 2002; Tanigaki et al. 2004) and consistent with the hypomorphic nature of the ΔTAD allele.
Figure 4.

Competitive defects and reduced LT-HSC frequency in ΔTAD FL HSCs. (A) Schematic for noncompetitive E14.5 FL transplants. (B) Multilineage reconstitution of primary recipients by ΔTAD/ΔTAD E14.5 FL cells. Representative flow cytometry plots from the thymus and spleen of +/+ or ΔTAD/ΔTAD reconstituted recipients at 16 wk. (C) E14.5 FL cells (2 × 10⁶) from B6 (CD45.2+) +/+, +/ΔTAD, or ΔTAD/ΔTAD embryos were transplanted into lethally irradiated SJL (CD45.1+) recipients. Bar graph represents mean reconstitution at 16 wk in BM, measured by the percentage of CD45.2+ cells. (D) E14.5 FL cells (1 × 10⁶) from B6 (CD45.2+) +/ΔTAD or ΔTAD/ΔTAD embryos were transplanted in competition with 1 × 10⁶ wild-type CD45.1+ E14.5 FL cells into lethally irradiated SJL CD45.1 recipients. The bar graph represents mean reconstitution at 16 wk in peripheral blood, measured by the percentage of CD45.2 cells. (E) SLAM-LSK gating strategy to identify LT-HSCs. (F) Percentage of LSK from +/+, +/ΔTAD, or ΔTAD/ΔTAD E14.5 FL cells. All cells were first gated on DAPI−CD45.2+. (G) Number of LSKs (left panel) and SLAM-LSKs (right panel) per 106 cells from +/+, +/ΔTAD, or ΔTAD/ΔTAD E14.5 FLs.
While multilineage reconstitution of recipient mice verified the existence of HSCs in the FLs of ΔTAD/ΔTAD donors, the percentage and absolute numbers of CD45.2+ cells in the BM were significantly reduced when compared with reconstitution by +/+ and +/ΔTAD FL littermate controls (Fig. 4C, Supplemental Fig. S3B,C). It is unlikely that the decrease of ΔTAD/ΔTAD-derived cells in the periphery was due to aberrant HSC self-renewal at the expense of progenitor differentiation or retention of cells in the BM, as CD45.2+ HSCs did not accumulate in the BM of recipient mice (Supplemental Fig. S3D). The ability of ΔTAD/ΔTAD HSCs to home to recipient BM and give rise to cells of multiple blood lineages demonstrates that functional HSCs can be generated even in the absence of the TAD, although loss of the TAD may negatively impact the efficiency of repopulation and/or function. To further explore defects in the ΔTAD/ΔTAD FL HSCs, we performed competitive whole FL transplants, which test the ability of these cells to compete against wild-type FL counterparts. We transplanted unfractionated FL cells from E14.5 +/ΔTAD or ΔTAD/ΔTAD (CD45.2+) at a 1:1 ratio with competitor CD45.1+ E14.5 FL cells. When compared with reconstitution by +/ΔTAD FL cells, we observed minimal contribution to the peripheral blood hematopoietic compartment from ΔTAD/ΔTAD FL cells (Fig. 4D).
The observed defects in both the noncompetitive and competitive transplants of ΔTAD/ΔTAD FL cells could be due to several developmental abnormalities, such as decreased numbers of HSCs, impaired HSC function, or a combination of both. To investigate these possibilities, we first assessed the frequency of ΔTAD/ΔTAD FL HSCs by flow cytometric analysis of cells expressing SLAM-LSK markers (Fig. 4E). We observed a striking reduction in the ΔTAD/ΔTAD FL LSK and SLAM-LSK cells in the CD45+ population (Fig. 4F,G; Kiel et al. 2005). The dramatic decrease in the SLAM-LSK HSCs in the ΔTAD/ΔTAD FL provides a potential explanation for the competitive disadvantage observed in the whole FL transplants.
Competitive SLAM-LSK FL transplants reveal cell-intrinsic defects in ΔTAD/ΔTAD FL HSCs
Although the ΔTAD/ΔTAD FL HSCs exhibited reconstitution defects at the population level, it was critical to determine whether this defect was due to a cell-intrinsic shortcoming in the HSC population or other potential developmental abnormalities. We thus performed competitive transplants with purified CD45.2+ SLAM-LSKs from the FLs of E14.5 +/+, +/ΔTAD, and ΔTAD/ΔTAD littermates (Fig. 4E). To simplify the description of the experiments, CD45.2+ FL SLAM-LSKs are henceforth referred to as donor cells. For competitor cells, we sorted CD45.1+/CD45.2+ SLAM-LSKs from adult BM. SJL (B6-Ly5.2/Cr CD45.1+) mice were lethally irradiated and transplanted with 350 donor FL CD45.2+ SLAM-LSKs and 350 BM competitor CD45.1+/CD45.2+ BM SLAM-LSKs, along with a protective dose of helper splenocytes (Fig. 5A). The reconstitution capacity of the donor cells was defined by the percentage of CD45.2+ cells in the peripheral blood of transplant recipients. We found that the ΔTAD/ΔTAD FL SLAM-LSKs were markedly deficient in reconstituting irradiated hosts in the face of competition with normal BM SLAM-LSKs (Fig. 5B,C) Consistent with this result, we observed a reciprocal increase in competitor CD45.1+/CD45.2+ cells (Supplemental Fig. S4A). To confirm that ΔTAD/ΔTAD FL HSCs were present in the populations selected for study, we transplanted unsorted and LSK-depleted cells from ΔTAD/ΔTAD FLs directly into irradiated recipients. Unsorted ΔTAD/ΔTAD FL cells provided multilineage reconstitution, while +/+ and ΔTAD/ΔTAD FLs depleted for LSK cells did not (Supplemental Fig. S4B). In addition to the ΔTAD/ΔTAD FL cells, the +/ΔTAD SLAM-LSK FL cells also significantly underperformed in competitive reconstitution assays (Fig. 5B,C).
Figure 5.

Impaired competitive reconstitution by Notch1 TAD-deficient FL HSCs and Rbpj-deficient FL cells. (A) Schematic representation of competitive transplants from B6 (CD45.2+) FL E14.5 +/+, +/ΔTAD, and ΔTAD/ΔTAD FL and BM cells from adult B6/SJL F1 (CD45.1+/CD45.2+) mice were FACS-sorted for SLAM-LSK. Three-hundred-fifty FL SLAM-LSKs and 350 BM SLAM-LSKs were transplanted in competition (1:1) into lethally irradiated CD45.1+ recipients. (B) Representative flow cytometry plots from peripheral blood (16 wk post-transplant) of recipients showing reconstitution by CD45.2+ cells. (C) Donor cell reconstitution at week 16 was measured by CD45.2+ percentage in peripheral blood of recipients. The plot of data points is from five independent experiments. (D) Competitive reconstitution of Rbpj-deficient FL hematopoietic cells. E14.5 FL cells from Rbpjf/f; Vav-Cre Rosa26YFP and Rbpj+/+; Vav-Cre Rosa26YFP control embryos were transplanted in competition with CD45.1+/CD45.2+ adult BM cells at a ratio of 10,000 FL cells:200,000 BM cells. (E,F) Donor cell reconstitution was measured by the percentage of YFP+ cells in the blood (E) and BM (F) at 16 wk post-transplant.
As these data suggested an important cell-autonomous defect in HSC function in the ΔTAD/ΔTAD mice, we performed secondary BM transplants in mice that had received unfractionated E14.5 FL cells (Fig. 4A–C). Donor-derived (either ΔTAD/ΔTAD or +/+) CD45.2+ SLAM-LSKs were sorted from the BM of primary recipients 16 wk post-transplant, and 1000 CD45.2+ SLAM-LSKs were transferred into secondary irradiated hosts. When we analyzed the peripheral blood of the secondary hosts for the presence of CD45.2+ cells, we found a significant decrease in the ability of the ΔTAD/ΔTAD SLAM-LSKs to reconstitute the secondary hosts (Supplemental Fig. S4C,D). These data suggest that Notch1, via the TAD, is required for both the survival of emergent HSCs after migration to the FL and optimal function of FL HSCs in the transplant setting.
Competitive transplants reveal cell-intrinsic defects in Rbpjf/f × Vav-Cre FL HSCs
Our findings in the Notch1 ΔTAD model suggested that Notch1 is critical for FL HSC homeostasis. To verify this finding, we used a second genetic model in which Rbpj is conditionally deleted in fetal HSCs. Rbpj is the DNA-binding protein that mediates Notch-dependent transcriptional activation (Tamura et al. 1995), and constitutive loss of Rbpj mirrors loss of Notch function (Oka et al. 1995). Specific hematopoietic deletion of Rbpj was attained by breeding mice with floxed Rbpj alleles to mice expressing Cre recombinase under the regulation of Vav1 genetic elements. Vav1 expression is restricted to hematopoietic cells, and the Vav-Cre transgene becomes active between E12.5 and E14.5 (Ogilvy et al. 1999; Stadtfeld and Graf 2005), thus restricting the deletion of Rbpj to hematopoietic cells after HSC emergence without affecting embryonic survival or the generation of Notch1-dependent HSC precursors. We performed a transplant of 10,000 unsorted E14.5 FL cells from Rbpj+/+; Vav-Cre Rosa26YFP or Rbpjf/f; Vav-Cre Rosa26YFP embryos in competition with 200,000 congenic BM competitors (Fig. 5D). Consistent with the competitive transplants of the ΔTAD/ΔTAD FL HSCs, Rbpjf/f; Vav-Cre FL cells exhibited a competitive reconstitution defect, as indicated by the low percentage of YFP+ cells in the peripheral blood or BM of transplant recipients 16 wk post-transplant (Fig. 5E,F). These results confirm a novel and specific cell-intrinsic role for Notch signaling in FL HSC function.
Notch1 TAD loss impairs formation of the Notch transcriptional activation complex
Because the Notch1 TAD is important for optimal transcription, we hypothesized that loss of the TAD results in decreased transcription of Notch target genes in cells from ΔTAD/ΔTAD embryos. To begin to test this hypothesis, we retrovirally expressed ICN1ΔTAD in 8946 T cells, which depend on a conditional human MYC transgene for growth. We previously showed that 8946 cells are rescued from MYC withdrawal by retroviral expression of ICN1 via up-regulation of endogenous Notch target genes, including murine Myc (Weng et al. 2006). As compared with wild-type ICN1, expression of multiple ICN1 targets, including CD25, Notch1, Notch3, Dtx1, Ptcra, and Myc, was decreased in 8946 cells following ICN1ΔTAD expression, a result consistent with the decreased activity of ICN1ΔTAD in luciferase reporter gene assays (Supplemental Fig. 5A–C).
Although multiple direct targets of Notch1 in T cells are known, the identity of genes directly regulated by Notch in fetal HSCs is largely unknown. To identify potential targets of Notch in FL SLAM-LSKs, we used an ex vivo system in which SLAM-LSK cells were cultured on OP9-DL1 feeder cells, which generate lower levels of activated Notch1 than OP9-DL4 feeder cells due to differences in the affinity of Notch1 for these two ligands (Andrawes et al. 2013). The decision to use OP9-DL1 feeder cells and short time periods (4 h and 10 h) of coincubation was made in an effort to enrich for Notch target genes that are likely to be involved in HSC homeostasis rather than genes involved in induction of T-cell development. C57BL/6 E14.5 FLs were cultured on OP9-DL1 stromal cells (Holmes and Zuniga-Pflucker 2009) in the presence of vehicle control (DMSO) for the “Notch on” state or GSI for the “Notch off” state. Treated SLAM-LSK HSCs were sorted, and microarray-based gene expression profiling was performed on mRNA harvested from these cells (Fig 6A).
Figure 6.

Decreased binding of the Notch1 transcriptional complex to the Hes1 promoter element in extracts prepared from ΔTAD MEFs. (A) B6 E14.5 FL cells were cultured on OP9-DL1 cells for the times indicated (4 h or 10 h) in the presence of vehicle control (DSMO) in the “Notch on” state or GSI in the “Notch off” state. SLAM-LSKs were sorted from the coculture, and RNA obtained from the SLAM-LSKs was used for microarray analysis. Selected genes with decreased expression in the presence of GSI are shown. (*) Genes with decreased expression after both 4 h and 10 h of treatment in the presence of GSI; Q-value (percent) is used to express the false discovery rate. (B) qPCR measurements from E14.5 FL SLAM-LSKs for Hes1, Jag1, and Itgal (Integrin-α/LFA-1) mRNA transcripts. All mRNA values were normalized to Ef1α. (C) +/+ MEFs were treated for 24 h with GSI or DMSO vehicle control. GSI was washed out at 18 h, and cells were cultured in vehicle control for an additional 6 h. Hes1 mRNA was normalized to Ef1α values. Graph is representative of four independent experiments. (D,E) Graph of absolute values of Hes1 mRNA (D) and Jag1 mRNA (E) from ΔTAD/ΔTAD and +/+ MEFs. Values were normalized to Ef1α from four independent experiments for Hes1 and two independent experiments for Jag1. (F) Schematic for oligonucleotide immunoprecipitation. (G) +/ΔTAD nuclear lysates were incubated with the Hes1 promoter oligonucleotide. (Left panel) Western blot for cleaved Notch1 (Val1744) in +/ΔTAD nuclear lysates (input) shows increased ΔTAD protein relative to wild-type (+) Notch1 protein. At three concentrations (1 μg, 0.75 μg, and 0.5 μg) of oligonucleotide, wild-type protein binding to Hes1 promoter is enriched relative to ΔTAD protein binding. (H) Association of Maml1 with Hes1 oligonucleotide in the presence of +/+, +/ΔTAD, or ΔTAD/ΔTAD MEF nuclear lysates. Western blot for total Maml1 (left panel) and oligonucleotide-bound Maml1 (right panel) from +/+ or ΔTAD/ΔTAD nuclear lysates incubated with 1 μg of Hes1 oligonucleotide. (I) Model of impaired formation and/or stabilization of Notch ternary complex with loss of the Notch1 TAD.
The most prominent known Notch target gene affected by GSI treatment was Hes1, a result consistent with recent embryonic HSC profiling studies (McKinney-Freeman et al. 2012; Guiu et al. 2013) and studies using a Hes1-GFP knock-in allele (Oh et al. 2013). Hes1 is known to have important functions in HSC fate specification and maintenance of T-ALL cells (Wendorff et al. 2010; Guiu et al. 2013), both of which may be relevant to the phenotypes observed in the ΔTAD FL HSCs. We also identified Itgal (LFA-1) and Jag1 as GSI-sensitive genes following both 4-h and 10-h exposures to DL1. These results were validated independently by quantitative PCR (qPCR) on multiple biological replicates of the SLAM-LSK microarray experiment (Fig. 6B). The Notch ligand Jag1 is an important Notch target gene that is required for cardiac OFT development (High et al. 2009), while ItgaL may have functions in hematopoietic cell migration and adhesion (Peter and O’Toole 1995; Torensma et al. 1996; Asaumi et al. 2001)
We used MEFs to investigate the mechanism by which the Notch1 TAD influences gene transcription, as we were unable to obtain a sufficient number of HSCs for analysis. Similar to HSCs, we verified that Hes1 was sensitive to Notch inhibition in MEFs and, by performing a GSI washout assay, verified Hes1 as a direct Notch target in these cells (Fig. 6C). Analysis of Hes1 and Jag1 expression in MEFs originating from either +/+ or ΔTAD/ΔTAD littermate embryos showed that Hes1 mRNA expression (Fig. 6D) and Jag1 mRNA expression (Fig. 6E) in ΔTAD/ΔTAD MEFs was significantly lower than in +/+ MEFs, supporting our hypothesis that TAD loss negatively impacts expression of Notch targets.
Because Hes1 is a TAD-sensitive Notch1 target in MEFs, we used the Hes1 promoter as a model to better understand the function of the TAD. To determine whether absence of the Notch1 TAD influenced the binding of the Notch1 trimolecular complex to DNA targets, we performed pull-down experiments using a biotinylated oligonucleotide containing the Rbpj-binding sequence of the Hes1 promoter (Fig. 6F; Nam et al. 2007). Specificity of binding to the Hes1-biotinylated oligonucleotide was shown by the lack of Notch1 binding after mutation of the Rbpj-binding sites (Supplemental Fig. S5D). In order to compare binding of wild-type and ΔTAD forms of Notch1 to the Hes1 promoter oligonucleotide, we used +/ΔTAD MEFs. These cells express both forms of Notch1, with the ΔTAD protein (as previously observed in T cells) (Fig. 1D) being more abundant (Fig. 6G). Nuclear lysates from +/ΔTAD MEFs were incubated with the biotinylated oligonucleotide to allow protein binding, and oligonucleotide–protein complexes were captured with streptavidin-coated beads, eluted, and analyzed on Western blots. Even though +/ΔTAD MEFs have more ΔTAD than wild-type Notch1 protein, binding of the wild-type protein to the oligonucleotide probe was greater, a difference that became strikingly obvious when the Hes1-biotinylated oligonucleotide was titrated out (Fig. 6G). Similarly, association of Maml1 with the Hes1 oligonucleotide was lower in extracts prepared from ΔTAD/ΔTAD MEFs than wild-type MEFs, despite similar levels of Maml1 protein (Fig. 6H). Thus, absence of the TAD impairs the formation of the Notch transcriptional activation complex on response elements of Notch target genes, such as Hes1 (Fig. 6I).
Discussion
Successful ex vivo HSC expansion has proven to be a formidable challenge due to our limited understanding of the mechanisms regulating HSC expansion in vivo. The complicated origins and migratory development of HSCs have made this difficult task even more daunting, further confounded by the fact that the BM, the site of harvest for clinically relevant HSCs, provides a niche that supports adult HSC quiescence (Essers et al. 2009; Seita and Weissman 2010). In contrast, the FL is an important developmental site of HSC expansion (Ema and Nakauchi 2000); however, only a handful of factors, such as Sox17, Pu.1, Hoxa9, Gata2, and Cited2, have been shown to be critical for FL HSC homeostasis (Kim et al. 2004, 2007; Argiropoulos and Humphries 2007; Chen et al. 2007; de Pater et al. 2013). Recently, Notch1 was linked to Sox17, as it was identified as a direct Sox17 transcriptional target (Clarke et al. 2013). Although Notch1 has been proposed to contribute to ex vivo HSC expansion and is expressed in the FL (Butler et al. 2010; McKinney-Freeman et al. 2012; Oh et al. 2013), it is not known whether Notch signaling has a role in the physiological expansion of HSCs. To date, the only known physiologic requirement for Notch in HSCs is to induce the emergence of the first definitive HSC in the E9.5 AGM.
We now report that Rbpj-dependent Notch1 signaling is a key regulator of FL HSC homeostasis. Previous studies of Notch signaling in fetal HSCs were hampered by the embryonic lethality that occurs at E9.5, prior to the onset of FL hematopoiesis. By deleting the Notch1 TAD, we generated a hypomorphic allele that allowed us to assay the requirement for Notch1 signaling in FL HSCs. Constitutive loss of the TAD resulted in a decrease of phenotypic HSCs in the FL, primarily due to increased apoptosis. In addition to the role of Notch signaling in FL HSC survival, our studies of purified ΔTAD FL HSCs revealed a separate requirement for Notch1 signaling in FL HSC function. In these experiments, we sorted phenotypic FL LT-HSCs at a time in embryonic development (E14.5) after HSCs have successfully migrated to the FL and begun their maturation and expansion. We found that both homozygous and heterozygous loss of the Notch1 TAD impaired the function of purified FL HSCs in competitive reconstitution assays and that homozygous loss of the TAD also impaired HSC function in serial transplantation assays. As previous studies suggested that Notch signaling is not essential for adult HSC homeostasis (Maillard et al. 2008; Gao et al. 2009), the persistent HSC defect in serial transplantation suggests that inhibiting Notch in the early embryo induces LT-HSC defects. Purified FL SLAM-LSK cells were used in these assays; thus, we believe the observed reconstitution defects are intrinsic to FL HSCs and inherent to the ΔTAD mutation.
These findings were corroborated by experiments using Rbpj-deficient FL hematopoietic cells (Rbpjf/f; Vav-Cre Rosa26YFP), where we observed similar defects in competitive reconstitution assays. The Vav-Cre mediated deletion of Rbpj occurs after HSCs have migrated to the FL; thus, the reconstitution defect reflects a requirement for Notch signaling in the FL and not in the generation of HSCs. Together, these two different murine models provide strong evidence for cell-autonomous functions of Notch signaling in FL HSC homeostasis.
While we focused on the hematopoietic defects in the ΔTAD/ΔTAD embryos, these mice exhibited a variety of developmental defects, culminating in embryonic death. Through histological analysis of the ΔTAD/ΔTAD embryos at E18.5, we demonstrated the importance of the Notch1 TAD in cardiac development. While it is known that Notch signaling is required for OFT formation, as evidenced by the association of mutations of the Notch signaling pathway with OFT defects and cardiac disease (Rochais et al. 2009; Rentschler et al. 2010), our data suggest that Notch1 is the critical receptor for proper OFT formation (Oda et al. 1997). Whether the effect on cardiac development results from qualitative or quantitative defects in embryonic Notch1 signaling remains to be determined.
The fact that ΔTAD mice do not die at E9.5, as occurs with the complete loss of Notch1, indicates that the TAD is not essential for all Notch functions. It follows that although the TAD plays an important role in enhancing Notch1 target gene expression, it is likely dispensable for expression of a subset of Notch targets that exceed a critical threshold for downstream functions. This is evident not only with our in vitro experiments using ΔTAD MEFs, where Hes1 is expressed at reduced levels in TAD-deficient cells, but also in the defects in T-cell development seen in recipient mice reconstituted with ΔTAD/ΔTAD HSCs and the failure of ΔTAD alleles to drive leukemia in BM transduction experiments. (Aster et al. 2000). Our ex vivo analysis of GSI-sensitive targets in FL HSCs suggests that Notch targets in FL HSCs differ from T cells and provide a starting point to elucidate how Notch functions in FL HSCs. It is tempting to speculate that conditions of stress, such as reconstitution in a competitive environment or serial transplantation, both of which require rapid expansion, necessitate increased Notch target gene expression, which is compromised in the absence of the TAD. While there are likely many Notch1 TAD-dependent genes, our profiling of FL HSC targets and initial studies using MEFs have identified Hes1 as a model target gene that is dependent on TAD function. Although the in vitro studies of the Notch1 TAD demonstrated its role in transcriptional activation (Kurooka et al. 1998; Kurooka and Honjo 2000), our data also reveal that the TAD is important for the proper assembly of the Notch1/Rbpj/Maml transcription complex (Gordon et al. 2008). Using +/ΔTAD MEFS, we demonstrate preferential binding of Maml1 and wild-type ICN1 to the Hes1 promoter region even though the ICN1 ΔTAD protein was present in excess. The decreased binding of Maml1 is particularly striking, as Maml acts to stabilize the ICN/RBPJ complex in vitro (Nam et al. 2006; Wilson and Kovall 2006) and is required for target gene expression. The simplest explanation for these observations would be for the TAD to participate in intermolecular contacts that stabilize the complex. Although we know that the Ram–Ank domains of Notch1 are sufficient for formation of a stable Notch1 trimolecular complex in purified systems (Nam et al. 2006; Wilson and Kovall 2006), our finding raises the alternative possibility that cofactors that interact with the TAD promote the assembly of the core Notch1 transcriptional activation complex (Fig. 7).
Figure 7.

Model of Notch1 +/+ and ΔTAD/ΔTAD FL development and function. (Top panel) Formation of the Notch1 transcriptional complex promotes optimal transcription of Notch target genes, allowing for generation of HSCs from the AGM, expansion of HSCs in the FL, and robust function of FL HSCs in competitive transplants. Lack of the Notch1 TAD (bottom panel) impairs formation of the Notch1 transcriptional complex (top panel), resulting in reduced transcription of Notch target genes. Lack of the TAD allows for generation of HSCs from the AGM but leads to a decreased number of HSCs in the FL as well as impaired function of FL HSCs in competitive transplants.
Activation of the Notch pathway in vitro by ligand stimulation has been employed to expand hematopoietic progenitors from human cord blood HSCs, demonstrating that manipulation of the Notch pathway is a viable and effective therapeutic strategy (Varnum-Finney et al. 2011). Ex vivo expansion of murine HSCs has also been achieved using a method that relies on the presentation of Notch ligands on endothelial cells (Butler et al. 2010). Although these examples point to the potential that manipulation of the Notch signaling pathway has for HSC expansion, prior studies had not provided a clear indication that physiologic Notch signaling is essential for HSC homeostasis beyond establishment of the first definitive LT-HSC. Our data show that Notch1 exerts important functions in FL HSCs. Since the current attempts to expand HSCs ex vivo recapitulate embryonic hematopoiesis (Clarke et al. 2013), identification of Notch as a critical player in this process provides a new rationale for studying Notch in this clinically relevant context. Recent data suggest that enhanced Notch signals in the adult BM promote HSC differentiation at the expense of self-renewal (Chiang et al. 2013; Lee et al. 2013). Our current data show that in the FL, enhanced Notch signals are compatible with both HSC expansion and self-renewal. While a substantial effort is necessary to fully understand these context-specific differences in Notch signaling in fetal and adult hematopoiesis, our current findings extend our understanding of the crucial cross-talk between hematopoietic development and Notch biology with regard to FL HSC expansion and maturation.
Materials and methods
Mice
ΔTAD/ΔTAD mice were generated by mutation of the Notch1 gene in embryonic stem cells using homologous recombination. The Notch1 TAD is from base pairs 43091–43699 of the mouse Notch1 gene, between the XhoI and SacI restriction sites. The Notch1 TAD deletion is from base pairs 6580–7188 of the mouse Notch1 coding sequence (this region encompasses the glutamic acid at amino acid position 2193 to valine at amino acid 2396). A gene targeting vector was constructed to mediate PCR-directed deletion of the TAD from mouse Notch1. The targeting vector also introduced an EcoRI site in the mutant TAD exon. Thus, the amino acid sequence resulting from the mutant TAD region was MLSPVDSLGILSSAANGH. The targeting vector was transfected into mouse embryonic stem cells, and clones with deletion of the Notch1 TAD were injected into blastocysts. Mice with germline transmission of the Notch1 TAD deletion were selected for breeding and backcrossed to the C57BL/6 background for more than six generations. The Extract-N-Amp tissue PCR kit (Sigma, XNAT2) was used to genotype adult and embryonic tissue. Primer sequences are provided in the Supplemental Material. Notch1in32 mice (Swiatek et al. 1994) on a C57BL/6 background were provided by Jan Kitajewski (Columbia University). B6-Ly5.2/Cr (strain code 01B96) mice were obtained from the Frederick National Laboratory of the National Cancer Institute. CD45.1+/CD45.2+ mice were obtained from the first generation of matings between C57BL/6 and B6-Ly5.2/Cr mice. Rbpjf/f; Vav1-CreRosa26YFP mice were on a C57BL/6 background. Vav1-Cre mice (Stadtfeld and Graf 2005) were provided by Thomas Graf (Centre for Genomic Regulation [CRG], Barcelona). Genomic DNA from yolk sac tissue was used for genotyping by PCR. All mice were housed in specific pathogen-free facilities at the University of Pennsylvania or the Parc Recerca Biomedica Barcelona (PRBB) animal facility. Experiments were performed according to the guidelines from the National Institutes of Health with approved protocols from the University of Pennsylvania Animal Care and Use Committee or with approved protocols from PRBB Committee and Generalitat de Catalunya.
Cell culture
MEFs were generated following a standard protocol (Conner 2001). Cells were grown in DMEM (Cellgro) supplemented with 10% fetal bovine serum (FBS) (Gibco), 1% penicillin/streptomycin (Gibco), 1% L-glutamine (Gibco), 100 μM 2-mercaptoethanol (Sigma), and 1% NEAA (Gibco). MEFs were not used beyond passage 25. Primary CD4 cells were cultured for 48 h in the presence of T-cell-depleted splenocytes (as a source of antigen-presenting cells) at a T-cell:splenocyte ratio of 1:4. Soluble anti-CD3 (eBioscience, 145-2C11) and anti-CD28 (eBioscience, 37.51) were added at 1 μg/mL. T-cell culture medium was IMDM (Gibco) supplemented with 10% FBS, 1% penicillin/streptomycin, 1% L-glutamine, and 5 ng/mL rIL-2 (Peprotech). OP9-DL1 cells were maintained in OP9 medium: MEM-Alpha (Gibco) supplemented with 20% FBS (Hyclone), 1% penicillin/streptomycin, 1% L-glutamine, and 1% NEAA. For short-term culture of HSCs, 5 × 10⁵ OP9-DL1 cells were seeded in 10-cm plates in OP9 medium with 5% FBS. Red blood cell-lysed E14.5 FL cells (15 × 106) were added to OP9-DL1 cells and cultured in OP9 medium with 5% FBS, 5 ng/mL Flt3 (PeproTech), and 100 ng/mL mSCF (PeproTech) in the presence of 1 μM GSI (EMD, γ-Secretase Inhibitor XXI, Compound E) or DMSO for 4 h or 10 h. Nonadherent cells were collected and stained for CD45.2 and SLAM-LSK markers. GFP− (to exclude contaminating OP9-DL1 cells) CD45.2+ SLAM-LSK cells were sorted into 200 μL of Arturus pico pure extraction buffer for RNA preparation.
8946 cell culture and transduction
8946 cells were maintained in RPMI supplemented with 10% FBS (Hyclone), 2 mM L-glutamine, 1 mM sodium pyruvate, and 1% penicillin/streptomycin. Migr1 and Mig-ICN1 retroviral vectors (constructed with the human ICN1 coding sequence) have been previously described (Aster et al. 2000). For generation of the Mig-ICN1 ΔTAD vector, the region containing base pairs 6609–7262 (corresponding to 218 amino acids) was deleted from human ICN1 coding sequence by site-directed mutagenesis of Mig-ICN1 (Stragene QuikChange site-directed mutagenesis kit). Production of high-titer retrovirus MigR1 control, Mig-ICN1, and Mig-ICN1 ΔTAD were produced as described (Pear et al. 1996). Cells were centrifuged with the appropriate amount of viral supernatant and 4 μg/mL hexadimethidrine bromide (Sigma) at 2500 rpm for 90 min at 25°C. GFP+ cells were sorted 48 h post-transduction. Sorted cells were treated with 20 ng/mL doxycycline for 24 h to suppress the human MYC transgene, a time point that did not affect 8946 cell viability. Cells were then harvested for RNA preparation, and qPCR was performed to measure mRNA expression of the indicated genes. mRNA expression values are absolute and were normalized to Ef1a. GFP expression after doxycycline treatment was also confirmed by flow cytometry
Luciferase assays
U20S cells were seeded 1 × 10⁴ cells per well in 96-well plates, with 24 wells per condition. Four hours after seeding, the medium was changed, and cells were transfected with Fugene6 and 25–50 ng of plasmid DNA per well, including the pcDNA3 (EV), pcDNA3-ICN, pcDNA3-ICN-ΔTAD, pCMV-MAML, and internal transfection control pRL-TK. One day post-transfection, the medium was changed, and 48 h post-transfection, the cells were lysed, and firefly luciferase levels were measured in one step with Britelite plus (Perkin-Elmer). Renilla luciferase was measured with Stop-n-Glo reagent from Promega. All readings were made using a Promega Glomax 96-microplate Luminometer at 1-sec intervals.
Western analysis
Nuclear lysates were prepared using the Active Motif nuclear complex coimmunoprecipitation kit (54001), and whole-cell lysates were prepared with RIPA buffer; protease inhibitors were included for both. Protein concentration was determined with the Bio-Rad protein assay dye reagent (Bio-Rad). Proteins were separated using SDS-PAGE and transferred to PVDF membranes. Antibodies used for Western blot were cleaved Notch1 (Val1744) antibody (Cell Signaling Technology, no. 2421), MAML1 (D3E9) rabbit mAb (Cell Signaling Technology, no. 11959), β-actin (Sigma), and secondary anti-mouse-HRP (Pierce) or anti-rabbit-HRP (Pierce). Blots were visualized with SuperSignal west pico chemilumenscence (Thermo Scientific) or SuperSignal west femto chemilumenscence substrate (Thermo Scientific).
Oligonucleotide pull-down
MEFs generated from embryos of the same litter were isolated as described above and grown to similar early passages (passages 6–9). Adherent MEFs were trypsinized, washed twice in PBS, centrifuged, and resuspended in hypotonic buffer for nuclear extraction per the manufacturer’s recommendation (Active Motif, no. 54001). Nuclear protein lysates were quantified by Bio-Rad Bradford assay. One-hundred micrograms to 150 μg of protein was incubated with 2 μg/μL annealed biotinylated oligonucleotides for 4–12 h at 4°C with rotation. Lysate and biotinylated oligonucleotide mixture was supplemented with 1 μg/μL poly-IC, and the volume was brought up to 500 μL by addition of binding buffer (12 mM HEPES, 4 mM Tris at pH 8.0, containing 60 mM KCl, 5% glycerol, 500 μM EDTA, 1 mM DTT, 1× protease inhibitors [Roche]). Streptavidin beads (Invitrogen) were washed twice in binding buffer, and 25–30 μL of beads was added to the nuclear lysate and biotinylated oligonucleotide mixture and incubated for 4–8 h at 4°C with rotation (Puente et al. 2011). The incubated mixture was centrifuged at 6000 rpm for 1 min, and the supernatant was collected and stored at −80°C. Beads were washed four times in 1 mL of binding buffer, resuspended in 25 μL of Laemmli buffer, boiled for 10 min at 100°C, and centrifuged at 13,000 rpm for 10 min. Eluted proteins were separated by SDS-PAGE in a 7%–8% gel, and Western blot was prepared with cleaved Notch1 (Val1744) antibody as described above. Oligonucleotide sequences are provided in the Supplemental Material (Supplemental Table S1).
Flow cytometry and cell sorting
AGM, FL, or BM cells (from adult tibia and femurs) were harvested and resuspended in PBS supplemented with 10% heat-inactivated FBS (Gibco) and 1% penicillin/streptomycin (Gibco). Antibodies used for identification of HSCs in E11.5 AGM and E11.5 FL cells were CD144 Alexa Fluor 647 (eBioscience, BV13), CD45.2 V450 (BD, 104), 7-AAD (eBioscience), and TER-119 PerCP-Cy5.5 (BD, TER-119). E11.5 AGM single-cell suspensions were prepared by treating with collagenase type I (Sigma) prior to staining. For SLAM-LSK staining, the antibodies used were CD45.2 FITC (BD, 104), Sca-1 (Ly6A/E) PerCP-Cy5.5 or FITC (eBioscience, D7), CD48 APC or phycoerythrin (PE) (eBioscience, HM48-1), CD150 PE-Cy7 (Biolegend, TC15-12F12.2), c-Kit APC-Cy7 (eBioscience, 2B8), and DAPI (BD). Lineage markers for BM cells were B220 (BD, RA3-6B2), Gr-1 (BD, RB6-8C5), CD3 (BD, 17A2), TER-119 (BD, TER-119). Mac-1 (BD, M1/70), CDllC (BD, HL3), NK1.1 (BD, PK136), CD4 (BD, RM4-5), CD8α (BD, 53-6.7), and CD19 (BD, 1D3), all conjugated to PE unless indicated otherwise. Lineage markers used for FL cells were B220 (BD, RA3-6B2), Gr-1 (BD, RB6-8C5), CD3 (BD, 17A2), and TER-119 (BD, TER-119), all conjugated to PE unless indicated otherwise. For intracellular cleaved Notch1 detection, cells were first stained for surface markers and then fixed and permeabilized using the eBioscience transcription factor staining buffer set (00-5523). Fixed/permeabilized cells were incubated with primary rabbit antibody to Notch1 cleaved at Val1744 (Cell Signaling, no. 2421) at a 1:100 dilution in permeabilization buffer and secondary Alexa Fluor 488 goat anti-rabbit IgG (H+L, Invitrogen) at a 1:300 dilution in permeabilization buffer. Surface Notch was detected by anti-Notch1 (eBioscience, 22E5) conjugated to APC.
For Annexin V detection, cells were first stained for SLAM-LSK markers (lineage markers were conjugated to V450) and then incubated with Annexin V (PE) in binding buffer provided in the Annexin V apoptosis detection kit (eBioscience, 88-8102-72). 7-AAD viability staining solution (eBioscience) was added to cells prior to analysis. Lin+ FL cells were used as an internal control to determine the percentage of Annexin V+ FL LSKs and SLAM-LSKs in each sample. Values were determined by subtracting the mean percentage of +/+ Annexin V+ Lin+ cells (calculated as percent Annexin V+ cells ± SEM, which was 1.600 ± 0.147; n = 4) from the mean percentage of Annexin V+ +/+ SLAM-LSKs and by subtracting the mean percentage of ΔTAD/ΔTAD Annexin V+ Lin+ cells (4.025 ± 0.728; n = 4) from the mean percentage of Annexin V+ ΔTAD/ΔTAD SLAM-LSKs.
Cell cycle analysis was performed by first staining for SLAM-LSK markers; cells were then fixed and permeabilized using the eBioscience transcription factor staining buffer set followed by incubation with DAPI and Ki-67 FITC (eBioscience SolA15) at a 1:200 dilution. Cells were not stained for CD45.2 for cell cycle analysis. Cells were analyzed on a BD LSRII equipped with an ultraviolet laser. Acquisition was performed with DAPI on a linear scale. Acquisition for flow cytometry was performed on a LSRII (Becton Dickinson). All cells were sorted on a BD FACSAria into PBS supplemented with 2% FBS and 1% penicillin/streptomycin. All flow cytometry data were analyzed with FlowJo (TreeStar). LT-HSC numbers were calculated from the number of cells within the live cell gate. LSK (DAPI−Lin−Sca1+Kit+) or SLAM-LSK (DAPI−Lin−Sca1+Kit+CD48−CD150+) cells from E14.5 FLs were acquired on a BD LSRII flow cytometer.
HSC transplants
For noncompetitive transplants, unfractionated FL cells or sorted SLAM-LSK FL cells from E14.5 embryos (C57BL/6) were transplanted intravenously with congenic splenocyte support cells into congenic recipients. Red blood cells were lysed with ACK lysing buffer (Lonza). For competitive transplants of ΔTAD/ΔTAD cells, unfractionated FL cells (1 × 10⁶ cells) or sorted CD45.2+SLAM-LSK FL cells (350 cells) from E14.5 embryos (C57BL/6) were transplanted intravenously into congenic recipients with equal numbers of unfractionated FL or sorted BM SLAM-LSKs. Live/dead cells were identified by DAPI staining. For secondary transplants, 1000 donor-derived +/+ or ΔTAD/ΔTAD CD45.2+ SLAM-LSKs were sorted from the BM of primary transplant recipients (primary transplant was noncompetitive E14.5 FL cell transplant) and transplanted with congenic splenocyte support cells into congenic recipients. For Rbpjf/f; Vav-Cre Rosa26YFP competitive FL transplants, 1 × 10⁴ nucleated E14.5 FL cells from Rbpjf/f; Vav-Cre Rosa26YFP or Rbpj+/+; Vav-Cre Rosa26YFP were transplanted with 2 × 10⁵ nucleated BM competitor cells. Rbpj deletion in FL-engrafted cells was confirmed by PCR on genomic DNA prepared from purified sorted BM YFP+ cells obtained 4 mo post-transplantation. All cells were washed with cold PBS prior to injection. Mice were maintained on antibiotic water for 2 wk post-transplant.
Statistical analysis
For ΔTAD/ΔTAD competitive FL transplants, regression analysis was performed to evaluate the difference of mean CD45.2 percentage in reconstituted recipients. Experiment and genotype were treated as independent factors. For noncompetitive FL transplants, two-way analysis of variance was used to calculate significance of mean CD45.2 reconstitution. For Rbpjf/f; Vav-Cre Rosa26YFP competitive FL transplants, the data were transformed using the arc–sine transformation of the observation/100. The t-test was used to evaluate the difference between the transformed mean reconstitution from the Rbpjf/f; Vav-Cre Rosa26YFP and Rbpj+/+; Vav-Cre Rosa26YFP cells. Unless noted, the Student’s t-test was used to calculate the P-value in all other experiments. Welch-Satterthwaite’s method was used when there was evidence of unequal variances in the two groups. All error bars represent SEM. All statistical analyses were performed with SAS/STAT software version 9.3 of the SAS system for Windows and GraphPad Prism version 5 for Mac.
qPCR
RNA was extracted using the Qiagen RNeasy minikit or microkit. For SLAM-LSKs, cells were sorted into 200 μL of Arcturus pico pure extraction buffer, and RNA was prepared using the Arcturus pico pure RNA extraction kit (Life Technologies, KIT0204). cDNA was synthesized from RNA with the SuperScript II kit (Invitrogen). Transcripts were amplified with SYBR Green PCR master mix (Applied Biosystems), and qPCR was performed on the ABI Prism 7900HT system (Applied Biosystems). Absolute quantities of mRNA were normalized to ef1α. Primer sequences are provided in the Supplemental Material.
Mircroarray analysis of SLAM-LSKs
SLAM-LSKs were sorted into 200 μL of Arcturus pico pure extraction buffer. RNA from SLAM-LSKs was extracted using the Arcturus pico pure RNA extraction kit. Microarray services were provided by the University of Pennsylvania Molecular Profiling Facility, including quality control tests of the total RNA samples by Agilent Bioanalyzer and nanodrop spectrophotometry. All protocols were conducted as described in the NuGEN Ovation pico WTA system version 2 user’s guide and the Affymetrix GeneChip expression analysis technical manual. Briefly, 10 ng of total RNA was converted to first strand cDNA using reverse transcriptase primed by poly(dT) and random oligomers that incorporated an RNA priming region. Second strand cDNA synthesis was followed by ribo-SPIA linear amplification of each transcript using an isothermal reaction with RNase, RNA primer, and DNA polymerase, and the resulting ssDNA was assessed by Bioanalyzer and then fragmented and biotinylated by terminal transferase end labeling. ssDNA yields ranged from 7.8 to 11.3 μg, and 5.5 μg of labeled ssDNA was added to Affymetrix hybridization cocktails, heated for 2 min at 99°C, and hybridized for 16 h at 45°C to Mouse Gene 2.0st GeneChips (Affymetrix). The microarrays were then washed at low (6× SSPE) and high (100 mM MES, 0.1 M NaCl) stringency and stained with streptavidin-PE. Fluorescence was amplified by adding biotinylated anti-streptavidin and an additional aliquot of streptavidin-PE stain. A confocal scanner was used to collect fluorescence signal after excitation at 570 nm.
Data collection analysis
The final microarray analysis reflects data from seven biologically independent experiments (for the 4-h GSI time point) and four independent experiments (for the 10-h GSI time point). All data obtained from the 4-h and 10-h GSI time courses were analyzed independently of each other. CEL files were analyzed using Partek Genomics suite. Separately for each analysis, Affymetrix CEL files (containing probe intensities) were exported from Command Console software and imported into the Partek Genomics suite (version 6.6, Partek, Inc.), where RMA was applied, yielding normalized, log2-transformed signal intensities. Transcript identifications were filtered to exclude technical controls, leaving 34,365 identifications for differential expression analysis. To find differentially expressed genes, SAM (Significance Analysis for Microarrays, samr version 2.0, Stanford University) was applied using a two-class (GSI vs. DMSO) paired (by experiment) design. Fold change and Q-value (representing false discovery rate) were calculated for all transcript identifications. Genes were prioritized based on Q-value and fold decrease in GSI versus DMSO treatment. Excel data sets are available in the Supplemental Material, and raw data files will be provided on the Gene Expression Omnibus database, accession no. GSE53713
Histology
Samples were fixed overnight with 4% paraformaldehyde, dehydrated through an ethanol series, and subsequently paraffin-embedded and sectioned. Hematoxylin and eosin staining was performed using standard protocols. Images were analyzed using Adobe Photoshop (sizing, brightness, or contrast adjustments, etc.). Brightness and contrast was adjusted linearly across the entire image for any particular image.
Acknowledgments
We thank Kristin Toscano for technical assistance, and Avinash Bhandoola and Will Bailis for thoughtful discussion. The following cores at the University of Pennsylvania contributed to this study: mouse husbandry (University Laboratory Animal Resources), the Abramson Cancer Center Flow Cytometry Core (P30-CA016520), the University of Pennsyvania Molecular Profiling Core (P30-DK090969), and the Abramson Family Cancer Research Institute Cores. This work was supported by T32CA009140 and T32GM007229 to D.M.G.; a Leukemia and Lymphoma Society Fellow Award and T32HL007843 to K.V.P.; a Financial Peace University fellowship (AP2008-01883) to T.D.; a National Marfan Foundation Award to R.J.; a Career Award for Medical Scientists from the Burroughs Wellcome Fund and K08 HL107449 to S.R.; grants from the National Institutes of Health to W.S.P. (R01AI047833), J.C.A. and W.S.P. (P01CA119070), and J.E. (U01HL100405); and grants from the Spanish government (PLE09-0111 and SAF2010-15450) and Red Temática de Investigación Cooperativa en Cáncer (RD12/0036/0054) to A.B.
Footnotes
Supplemental material is available for this article.
Article is online at http://www.genesdev.org/cgi/doi/10.1101/gad.227496.113.
References
- Andrawes MB, Xu X, Liu H, Ficarro SB, Marto JA, Aster JC, Blacklow SC 2013. Intrinsic selectivity of Notch 1 for Delta-like 4 over Delta-like 1. J Biol Chem 288: 25477–25489 [DOI] [PMC free article] [PubMed] [Google Scholar]
- Argiropoulos B, Humphries RK 2007. Hox genes in hematopoiesis and leukemogenesis. Oncogene 26: 6766–6776 [DOI] [PubMed] [Google Scholar]
- Artavanis-Tsakonas S, Rand MD, Lake RJ 1999. Notch signaling: cell fate control and signal integration in development. Science 284: 770–776 [DOI] [PubMed] [Google Scholar]
- Asaumi N, Omoto E, Mahmut N, Katayama Y, Takeda K, Shinagawa K, Harada M 2001. Very late antigen-5 and leukocyte function-associated antigen-1 are critical for early stage hematopoietic progenitor cell homing. Ann Hematol 80: 387–392 [DOI] [PubMed] [Google Scholar]
- Aster JC, Xu L, Karnell FG, Patriub V, Pui JC, Pear WS 2000. Essential roles for ankyrin repeat and transactivation domains in induction of T-cell leukemia by Notch1. Mol Cell Biol 20: 7505–7515 [DOI] [PMC free article] [PubMed] [Google Scholar]
- Butler JM, Nolan DJ, Vertes EL, Varnum-Finney B, Kobayashi H, Hooper AT, Seandel M, Shido K, White IA, Kobayashi M, et al. 2010. Endothelial cells are essential for the self-renewal and repopulation of Notch-dependent hematopoietic stem cells. Cell Stem Cell 6: 251–264 [DOI] [PMC free article] [PubMed] [Google Scholar]
- Chen Y, Haviernik P, Bunting KD, Yang YC 2007. Cited2 is required for normal hematopoiesis in the murine fetal liver. Blood 110: 2889–2898 [DOI] [PMC free article] [PubMed] [Google Scholar]
- Chiang MY, Xu ML, Histen G, Shestova O, Roy M, Nam Y, Blacklow SC, Sacks DB, Pear WS, Aster JC 2006. Identification of a conserved negative regulatory sequence that influences the leukemogenic activity of NOTCH1. Mol Cell Biol 26: 6261–6271 [DOI] [PMC free article] [PubMed] [Google Scholar]
- Chiang MY, Shestova O, Xu L, Aster JC, Pear WS 2013. Divergent effects of supraphysiologic Notch signals on leukemia stem cells and hematopoietic stem cells. Blood 121: 905–917 [DOI] [PMC free article] [PubMed] [Google Scholar]
- Clarke RL, Yzaguirre AD, Yashiro-Ohtani Y, Bondue A, Blanpain C, Pear WS, Speck NA, Keller G 2013. The expression of Sox17 identifies and regulates haemogenic endothelium. Nat Cell Biol 15: 502–510 [DOI] [PMC free article] [PubMed] [Google Scholar]
- Conlon RA, Reaume AG, Rossant J 1995. Notch1 is required for the coordinate segmentation of somites. Development 121: 1533–1545 [DOI] [PubMed] [Google Scholar]
- Conner DA 2001. Mouse embryo fibroblast (MEF) feeder cell preparation. Curr Protoc Mol Biol 51: 23.2.1–23.2.7 [DOI] [PubMed] [Google Scholar]
- de Pater E, Kaimakis P, Vink CS, Yokomizo T, Yamada-Inagawa T, van der Linden R, Kartalaei PS, Camper SA, Speck N, Dzierzak E 2013. Gata2 is required for HSC generation and survival. J Exp Med 210: 2843–2850 [DOI] [PMC free article] [PubMed] [Google Scholar]
- Dzierzak E, Speck NA 2008. Of lineage and legacy: the development of mammalian hematopoietic stem cells. Nat Immunol 9: 129–136 [DOI] [PMC free article] [PubMed] [Google Scholar]
- Ema H, Nakauchi H 2000. Expansion of hematopoietic stem cells in the developing liver of a mouse embryo. Blood 95: 2284–2288 [PubMed] [Google Scholar]
- Essers MA, Offner S, Blanco-Bose WE, Waibler Z, Kalinke U, Duchosal MA, Trumpp A 2009. IFNα activates dormant haematopoietic stem cells in vivo. Nature 458: 904–908 [DOI] [PubMed] [Google Scholar]
- Fiorini E, Merck E, Wilson A, Ferrero I, Jiang W, Koch U, Auderset F, Laurenti E, Tacchini-Cottier F, Pierres M, et al. 2009. Dynamic regulation of Notch 1 and Notch 2 surface expression during T cell development and activation revealed by novel monoclonal antibodies. J Immunol 183: 7212–7222 [DOI] [PubMed] [Google Scholar]
- Fryer CJ, Lamar E, Turbachova I, Kintner C, Jones KA 2002. Mastermind mediates chromatin-specific transcription and turnover of the Notch enhancer complex. Genes Dev 16: 1397–1411 [DOI] [PMC free article] [PubMed] [Google Scholar]
- Fryer CJ, White JB, Jones KA 2004. Mastermind recruits CycC:CDK8 to phosphorylate the Notch ICD and coordinate activation with turnover. Mol Cell 16: 509–520 [DOI] [PubMed] [Google Scholar]
- Gao J, Graves S, Koch U, Liu S, Jankovic V, Buonamici S, El Andaloussi A, Nimer SD, Kee BL, Taichman R, et al. 2009. Hedgehog signaling is dispensable for adult hematopoietic stem cell function. Cell Stem Cell 4: 548–558 [DOI] [PMC free article] [PubMed] [Google Scholar]
- Gordon WR, Arnett KL, Blacklow SC 2008. The molecular logic of Notch signaling—a structural and biochemical perspective. J Cell Sci 121: 3109–3119 [DOI] [PMC free article] [PubMed] [Google Scholar]
- Guiu J, Shimizu R, D’altri T, Fraser ST, Hatakeyama J, Bresnick EH, Kageyama R, Dzierzak E, Yamamoto M, Espinosa L, et al. 2013. Hes repressors are essential regulators of hematopoietic stem cell development downstream of Notch signaling. J Exp Med 210: 71–84 [DOI] [PMC free article] [PubMed] [Google Scholar]
- Hadland BK, Huppert SS, Kanungo J, Xue Y, Jiang R, Gridley T, Conlon RA, Cheng AM, Kopan R, Longmore GD 2004. A requirement for Notch1 distinguishes 2 phases of definitive hematopoiesis during development. Blood 104: 3097–3105 [DOI] [PMC free article] [PubMed] [Google Scholar]
- High F, Epstein JA 2007. Signalling pathways regulating cardiac neural crest migration and differentiation. Novartis Found Symp 283: 152–161 [DOI] [PubMed] [Google Scholar]
- High FA, Zhang M, Proweller A, Tu L, Parmacek MS, Pear WS, Epstein JA 2007. An essential role for Notch in neural crest during cardiovascular development and smooth muscle differentiation. J Clin Invest 117: 353–363 [DOI] [PMC free article] [PubMed] [Google Scholar]
- High FA, Jain R, Stoller JZ, Antonucci NB, Lu MM, Loomes KM, Kaestner KH, Pear WS, Epstein JA 2009. Murine Jagged1/Notch signaling in the second heart field orchestrates Fgf8 expression and tissue–tissue interactions during outflow tract development. J Clin Invest 119: 1986–1996 [DOI] [PMC free article] [PubMed] [Google Scholar]
- Holmes R, Zuniga-Pflucker JC 2009. The OP9-DL1 system: generation of T-lymphocytes from embryonic or hematopoietic stem cells in vitro. Cold Spring Harb Protoc 2009: pdb.prot5156. [DOI] [PubMed] [Google Scholar]
- Huang EY, Gallegos AM, Richards SM, Lehar SM, Bevan MJ 2003. Surface expression of Notch1 on thymocytes: correlation with the double-negative to double-positive transition. J Immunol 171: 2296–2304 [DOI] [PubMed] [Google Scholar]
- Kiel MJ, Yilmaz OH, Iwashita T, Terhorst C, Morrison SJ 2005. SLAM family receptors distinguish hematopoietic stem and progenitor cells and reveal endothelial niches for stem cells. Cell 121: 1109–1121 [DOI] [PubMed] [Google Scholar]
- Kieusseian A, Brunet de la Grange P, Burlen-Defranoux O, Godin I, Cumano A 2012. Immature hematopoietic stem cells undergo maturation in the fetal liver. Development 139: 3521–3530 [DOI] [PubMed] [Google Scholar]
- Kim HG, de Guzman CG, Swindle CS, Cotta CV, Gartland L, Scott EW, Klug CA 2004. The ETS family transcription factor PU.1 is necessary for the maintenance of fetal liver hematopoietic stem cells. Blood 104: 3894–3900 [DOI] [PubMed] [Google Scholar]
- Kim I, He S, Yilmaz OH, Kiel MJ, Morrison SJ 2006. Enhanced purification of fetal liver hematopoietic stem cells using SLAM family receptors. Blood 108: 737–744 [DOI] [PMC free article] [PubMed] [Google Scholar]
- Kim I, Saunders TL, Morrison SJ 2007. Sox17 dependence distinguishes the transcriptional regulation of fetal from adult hematopoietic stem cells. Cell 130: 470–483 [DOI] [PMC free article] [PubMed] [Google Scholar]
- Koo BK, Lim HS, Song R, Yoon MJ, Yoon KJ, Moon JS, Kim YW, Kwon MC, Yoo KW, Kong MP, et al. 2005. Mind bomb 1 is essential for generating functional Notch ligands to activate Notch. Development 132: 3459–3470 [DOI] [PubMed] [Google Scholar]
- Kopan R, Ilagan MX 2009. The canonical Notch signaling pathway: unfolding the activation mechanism. Cell 137: 216–233 [DOI] [PMC free article] [PubMed] [Google Scholar]
- Kovall RA, Blacklow SC 2010. Mechanistic insights into Notch receptor signaling from structural and biochemical studies. Curr Top Dev Biol 92: 31–71 [DOI] [PubMed] [Google Scholar]
- Krebs LT, Xue Y, Norton CR, Shutter JR, Maguire M, Sundberg JP, Gallahan D, Closson V, Kitajewski J, Callahan R, et al. 2000. Notch signaling is essential for vascular morphogenesis in mice. Genes Dev 14: 1343–1352 [PMC free article] [PubMed] [Google Scholar]
- Kumano K, Chiba S, Kunisato A, Sata M, Saito T, Nakagami-Yamaguchi E, Yamaguchi T, Masuda S, Shimizu K, Takahashi T, et al. 2003. Notch1 but not Notch2 is essential for generating hematopoietic stem cells from endothelial cells. Immunity 18: 699–711 [DOI] [PubMed] [Google Scholar]
- Kurooka H, Honjo T 2000. Functional interaction between the mouse Notch1 intracellular region and histone acetyltransferases PCAF and GCN5. J Biol Chem 275: 17211–17220 [DOI] [PubMed] [Google Scholar]
- Kurooka H, Kuroda K, Honjo T 1998. Roles of the ankyrin repeats and C-terminal region of the mouse Notch1 intracellular region. Nucleic Acids Res 26: 5448–5455 [DOI] [PMC free article] [PubMed] [Google Scholar]
- Lawson ND, Scheer N, Pham VN, Kim CH, Chitnis AB, Campos-Ortega JA, Weinstein BM 2001. Notch signaling is required for arterial-venous differentiation during embryonic vascular development. Development 128: 3675–3683 [DOI] [PubMed] [Google Scholar]
- Lee SU, Maeda M, Ishikawa Y, Li SM, Wilson A, Jubb AM, Sakurai N, Weng L, Fiorini E, Radtke F, et al. 2013. LRF-mediated Dll4 repression in erythroblasts is necessary for hematopoietic stem cell maintenance. Blood 121: 918–929 [DOI] [PMC free article] [PubMed] [Google Scholar]
- Maillard I, Koch U, Dumortier A, Shestova O, Xu L, Sai H, Pross SE, Aster JC, Bhandoola A, Radtke F, et al. 2008. Canonical Notch signaling is dispensable for the maintenance of adult hematopoietic stem cells. Cell Stem Cell 2: 356–366 [DOI] [PMC free article] [PubMed] [Google Scholar]
- Mancini SJ, Mantei N, Dumortier A, Suter U, MacDonald HR, Radtke F 2005. Jagged1-dependent Notch signaling is dispensable for hematopoietic stem cell self-renewal and differentiation. Blood 105: 2340–2342 [DOI] [PubMed] [Google Scholar]
- McKinney-Freeman S, Cahan P, Li H, Lacadie SA, Huang HT, Curran M, Loewer S, Naveiras O, Kathrein KL, Konantz M, et al. 2012. The transcriptional landscape of hematopoietic stem cell ontogeny. Cell Stem Cell 11: 701–714 [DOI] [PMC free article] [PubMed] [Google Scholar]
- Morrison SJ, Hemmati HD, Wandycz AM, Weissman IL 1995. The purification and characterization of fetal liver hematopoietic stem cells. Proc Natl Acad Sci 92: 10302–10306 [DOI] [PMC free article] [PubMed] [Google Scholar]
- Nam Y, Sliz P, Song L, Aster JC, Blacklow SC 2006. Structural basis for cooperativity in recruitment of MAML coactivators to Notch transcription complexes. Cell 124: 973–983 [DOI] [PubMed] [Google Scholar]
- Nam Y, Sliz P, Pear WS, Aster JC, Blacklow SC 2007. Cooperative assembly of higher-order Notch complexes functions as a switch to induce transcription. Proc Natl Acad Sci 104: 2103–2108 [DOI] [PMC free article] [PubMed] [Google Scholar]
- North TE, de Bruijn MF, Stacy T, Talebian L, Lind E, Robin C, Binder M, Dzierzak E, Speck NA 2002. Runx1 expression marks long-term repopulating hematopoietic stem cells in the midgestation mouse embryo. Immunity 16: 661–672 [DOI] [PubMed] [Google Scholar]
- Oda T, Elkahloun AG, Pike BL, Okajima K, Krantz ID, Genin A, Piccoli DA, Meltzer PS, Spinner NB, Collins FS, et al. 1997. Mutations in the human Jagged1 gene are responsible for Alagille syndrome. Nat Genet 16: 235–242 [DOI] [PubMed] [Google Scholar]
- Ogilvy S, Metcalf D, Gibson L, Bath ML, Harris AW, Adams JM 1999. Promoter elements of vav drive transgene expression in vivo throughout the hematopoietic compartment. Blood 94: 1855–1863 [PubMed] [Google Scholar]
- Oh P, Lobry C, Gao J, Tikhonova A, Loizou E, Manent J, van Handel B, Ibrahim S, Greve J, Mikkola H, et al. 2013. In vivo mapping of Notch pathway activity in normal and stress hematopoiesis. Cell Stem Cell 13: 190–204 [DOI] [PMC free article] [PubMed] [Google Scholar]
- Oka C, Nakano T, Wakeham A, de la Pompa JL, Mori C, Sakai T, Okazaki S, Kawaichi M, Shiota K, Mak TW, et al. 1995. Disruption of the mouse RBP-Jκ gene results in early embryonic death. Development 121: 3291–3301 [DOI] [PubMed] [Google Scholar]
- O’Neil J, Grim J, Strack P, Rao S, Tibbitts D, Winter C, Hardwick J, Welcker M, Meijerink JP, Pieters R, et al. 2007. FBW7 mutations in leukemic cells mediate NOTCH pathway activation and resistance to γ-secretase inhibitors. J Exp Med 204: 1813–1824 [DOI] [PMC free article] [PubMed] [Google Scholar]
- Ong CT, Cheng HT, Chang LW, Ohtsuka T, Kageyama R, Stormo GD, Kopan R 2006. Target selectivity of vertebrate Notch proteins. Collaboration between discrete domains and CSL-binding site architecture determines activation probability. J Biol Chem 281: 5106–5119 [DOI] [PubMed] [Google Scholar]
- Oswald F, Tauber B, Dobner T, Bourteele S, Kostezka U, Adler G, Liptay S, Schmid RM 2001. p300 acts as a transcriptional coactivator for mammalian Notch-1. Mol Cell Biol 21: 7761–7774 [DOI] [PMC free article] [PubMed] [Google Scholar]
- Pear WS, Aster JC, Scott ML, Hasserjian RP, Soffer B, Sklar J, Baltimore D 1996. Exclusive development of T cell neoplasms in mice transplanted with bone marrow expressing activated Notch alleles. J Exp Med 183: 2283–2291 [DOI] [PMC free article] [PubMed] [Google Scholar]
- Peter K, O’Toole TE 1995. Modulation of cell adhesion by changes in αL β2 (LFA-1, CD11a/CD18) cytoplasmic domain/cytoskeleton interaction. J Exp Med 181: 315–326 [DOI] [PMC free article] [PubMed] [Google Scholar]
- Puente XS, Pinyol M, Quesada V, Conde L, Ordonez GR, Villamor N, Escaramis G, Jares P, Bea S, Gonzalez-Diaz M, et al. 2011. Whole-genome sequencing identifies recurrent mutations in chronic lymphocytic leukaemia. Nature 475: 101–105 [DOI] [PMC free article] [PubMed] [Google Scholar]
- Rentschler S, Jain R, Epstein JA 2010. Tissue–tissue interactions during morphogenesis of the outflow tract. Pediatr Cardiol 31: 408–413 [DOI] [PMC free article] [PubMed] [Google Scholar]
- Rochais F, Dandonneau M, Mesbah K, Jarry T, Mattei MG, Kelly RG 2009. Hes1 is expressed in the second heart field and is required for outflow tract development. PLoS ONE 4: e6267. [DOI] [PMC free article] [PubMed] [Google Scholar]
- Schmitt TM, Zuniga-Pflucker JC 2002. Induction of T cell development from hematopoietic progenitor cells by Delta-like-1 in vitro. Immunity 17: 749–756 [DOI] [PubMed] [Google Scholar]
- Seita J, Weissman IL 2010. Hematopoietic stem cell: self-renewal versus differentiation. Wiley Interdiscip Rev Syst Biol Med 2: 640–653 [DOI] [PMC free article] [PubMed] [Google Scholar]
- Stadtfeld M, Graf T 2005. Assessing the role of hematopoietic plasticity for endothelial and hepatocyte development by non-invasive lineage tracing. Development 132: 203–213 [DOI] [PubMed] [Google Scholar]
- Swiatek PJ, Lindsell CE, del Amo FF, Weinmaster G, Gridley T 1994. Notch1 is essential for postimplantation development in mice. Genes Dev 8: 707–719 [DOI] [PubMed] [Google Scholar]
- Tamura K, Taniguchi Y, Minoguchi S, Sakai T, Tun T, Furukawa T, Honjo T 1995. Physical interaction between a novel domain of the receptor Notch and the transcription factor RBP-Jκ/Su(H). Curr Biol 5: 1416–1423 [DOI] [PubMed] [Google Scholar]
- Tanigaki K, Tsuji M, Yamamoto N, Han H, Tsukada J, Inoue H, Kubo M, Honjo T 2004. Regulation of αβ/γδ T cell lineage commitment and peripheral T cell responses by Notch/RBP-J signaling. Immunity 20: 611–622 [DOI] [PubMed] [Google Scholar]
- Taoudi S, Morrison AM, Inoue H, Gribi R, Ure J, Medvinsky A 2005. Progressive divergence of definitive haematopoietic stem cells from the endothelial compartment does not depend on contact with the foetal liver. Development 132: 4179–4191 [DOI] [PubMed] [Google Scholar]
- Thompson BJ, Buonamici S, Sulis ML, Palomero T, Vilimas T, Basso G, Ferrando A, Aifantis I 2007. The SCFFBW7 ubiquitin ligase complex as a tumor suppressor in T cell leukemia. J Exp Med 204: 1825–1835 [DOI] [PMC free article] [PubMed] [Google Scholar]
- Torensma R, Raymakers RA, van Kooyk Y, Figdor CG 1996. Induction of LFA-1 on pluripotent CD34+ bone marrow cells does not affect lineage commitment. Blood 87: 4120–4128 [PubMed] [Google Scholar]
- Varnum-Finney B, Halasz LM, Sun M, Gridley T, Radtke F, Bernstein ID 2011. Notch2 governs the rate of generation of mouse long- and short-term repopulating stem cells. J Clin Invest 121: 1207–1216 [DOI] [PMC free article] [PubMed] [Google Scholar]
- Wallberg AE, Pedersen K, Lendahl U, Roeder RG 2002. p300 and PCAF act cooperatively to mediate transcriptional activation from chromatin templates by Notch intracellular domains in vitro. Mol Cell Biol 22: 7812–7819 [DOI] [PMC free article] [PubMed] [Google Scholar]
- Wendorff AA, Koch U, Wunderlich FT, Wirth S, Dubey C, Bruning JC, MacDonald HR, Radtke F 2010. Hes1 is a critical but context-dependent mediator of canonical Notch signaling in lymphocyte development and transformation. Immunity 33: 671–684 [DOI] [PubMed] [Google Scholar]
- Weng AP, Ferrando AA, Lee W, Morris JPt, Silverman LB, Sanchez-Irizarry C, Blacklow SC, Look AT, Aster JC 2004. Activating mutations of NOTCH1 in human T cell acute lymphoblastic leukemia. Science 306: 269–271 [DOI] [PubMed] [Google Scholar]
- Weng AP, Millholland JM, Yashiro-Ohtani Y, Arcangeli ML, Lau A, Wai C, Del Bianco C, Rodriguez CG, Sai H, Tobias J, et al. 2006. c-Myc is an important direct target of Notch1 in T-cell acute lymphoblastic leukemia/lymphoma. Genes Dev 20: 2096–2109 [DOI] [PMC free article] [PubMed] [Google Scholar]
- Wilson JJ, Kovall RA 2006. Crystal structure of the CSL–Notch–Mastermind ternary complex bound to DNA. Cell 124: 985–996 [DOI] [PubMed] [Google Scholar]
- Wolfer A, Wilson A, Nemir M, MacDonald HR, Radtke F 2002. Inactivation of Notch1 impairs VDJβ rearrangement and allows pre-TCR-independent survival of early αβ lineage thymocytes. Immunity 16: 869–879 [DOI] [PubMed] [Google Scholar]
- Yashiro-Ohtani Y, He Y, Ohtani T, Jones ME, Shestova O, Xu L, Fang TC, Chiang MY, Intlekofer AM, Blacklow SC, et al. 2009. Pre-TCR signaling inactivates Notch1 transcription by antagonizing E2A. Genes Dev 23: 1665–1676 [DOI] [PMC free article] [PubMed] [Google Scholar]
- Yokomizo T, Dzierzak E 2010. Three-dimensional cartography of hematopoietic clusters in the vasculature of whole mouse embryos. Development 137: 3651–3661 [DOI] [PMC free article] [PubMed] [Google Scholar]