

The Drosophila transcription factor Bicoid (Bcd) binds thousands of genomic sites during early embryogenesis, but it is unclear how many of these binding events are functionally important. Here, Small and colleagues test the role of the maternal factor Zelda (Zld) in Bcd-mediated binding and transcription. Embryos lacking Zld show enhanced Bcd binding to a subset of genomic locations, causing early activation of target genes normally silent until later stages. This study demonstrates a critical role for Zld in controlling Bcd binding and target gene activation in the early embryo.
Keywords: DNA binding, Drosophila, enhancer, pattern formation, pioneer factor, transcription
Abstract
In vivo cross-linking studies suggest that the Drosophila transcription factor Bicoid (Bcd) binds to several thousand sites during early embryogenesis, but it is not clear how many of these binding events are functionally important. In contrast, reporter gene studies have identified >60 Bcd-dependent enhancers, all of which contain clusters of the consensus binding sequence TAATCC. These studies also identified clusters of TAATCC motifs (inactive fragments) that failed to drive Bcd-dependent activation. In general, active fragments showed higher levels of Bcd binding in vivo and were enriched in predicted binding sites for the ubiquitous maternal protein Zelda (Zld). Here we tested the role of Zld in Bcd-mediated binding and transcription. Removal of Zld function and mutations in Zld sites caused significant reductions in Bcd binding to known enhancers and variable effects on the activation and spatial positioning of Bcd-dependent expression patterns. Also, insertion of Zld sites converted one of six inactive fragments into a Bcd-responsive enhancer. Genome-wide binding experiments in zld mutants showed variable effects on Bcd-binding peaks, ranging from strong reductions to significantly enhanced levels of binding. Increases in Bcd binding caused the precocious Bcd-dependent activation of genes that are normally not expressed in early embryos, suggesting that Zld controls the genome-wide binding profile of Bcd at the qualitative level and is critical for selecting target genes for activation in the early embryo. These results underscore the importance of combinatorial binding in enhancer function and provide data that will help predict regulatory activities based on DNA sequence.
Transcription factors (TFs) are driven thermodynamically to bind to thousands of sites in genomic DNA, oftentimes nonspecifically (Lin and Riggs 1975; Walter et al. 1994; Phair et al. 2004; Elf et al. 2007; Zeitlinger et al. 2007; Li et al. 2008). The genome-wide binding profile of most factors is best represented as a continuum of individual binding events of different strengths (Biggin 2011), and there is evidence of a positive correlation between binding strength and function (i.e., enhancer activity) (Fisher et al. 2012). However, it is still not possible to accurately predict functional binding by simply scanning genomic sequences.
Here we focus on the DNA-binding activities of Bicoid (Bcd), a homeodomain (HD)-containing TF in Drosophila (Berleth et al. 1988; Driever et al. 1989). bcd mRNA is produced maternally and sequestered near the anterior pole of the mature oocyte (Berleth et al. 1988). After egg deposition, bcd mRNA is translated into protein, which diffuses toward the posterior, forming a long-range anterior gradient (Driever and Nusslein-Volhard 1988b; Little et al. 2011). Bcd contains a lysine (K) at position 50 of its HD, and K50 HD proteins bind to sequence motifs with the consensus TAATCC (Treisman et al. 1989; Noyes et al. 2008). Previous studies have identified >40 zygotic target genes of Bcd and 66 enhancers that directly mediate Bcd-dependent transcription (Driever and Nusslein-Volhard 1989; Struhl et al. 1989; Hoch et al. 1990; Howard and Struhl 1990; Riddihough and Ish-Horowicz 1991; Small et al. 1992; Wimmer et al. 1995; Kuhnlein et al. 1997; La Rosee et al. 1997; Gao and Finkelstein 1998; Fujioka et al. 1999; Hartmann et al. 2001; Schroeder et al. 2004; Biemar et al. 2005; Ochoa-Espinosa et al. 2005; Kantorovitz et al. 2009; Chen et al. 2012).
In vivo measurements of the Bcd protein gradient suggest that there are ∼20,000 Bcd molecules in the anterior-most nuclei of the embryo and ∼1000 molecules in nuclei near the middle of the embryo (Gregor et al. 2007; Drocco et al. 2011; Little et al. 2011). In contrast, genomic DNA from Drosophila contains >100,000 Bcd-binding motifs. How does Bcd recognize its target enhancers in the sequence background of genomic DNA? A major characteristic of all Bcd-dependent enhancers is that they contain clusters of TAATCC consensus motifs, and indeed motif clustering was used in two previous studies to identify new Bcd-dependent enhancers (Ochoa-Espinosa et al. 2005; Chen et al. 2012). However, a significant fraction of the tested clusters of TAATCC motifs failed to function as Bcd-dependent enhancers in reporter gene assays, and a majority of the negative fragments showed no in vivo binding in subsequent ChIP–chip (chromatin immunoprecipitation [ChIP] coupled with microarray analysis) (Li et al. 2008; Chen et al. 2012). These results support the idea that binding accessibility and enhancer function are influenced by factors that are independent of the primary sequences of the Bcd-binding sites.
Recent studies in cancer cells suggest that the genome-wide occupancy profiles of TFs are influenced by “pioneer factors” that “shape enhancer accessibility” (Ross-Innes et al. 2012; Theodorou et al. 2013). In Drosophila, the ubiquitously distributed TF Zelda (Zld) may play such a role in early embryo patterning. Zld is a maternally produced Zinc finger-containing protein that is required for the activation of many zygotic genes during the maternal-to-zygotic transition (MZT) (Staudt et al. 2006; Liang et al. 2008). Zelda binds to a “TAGteam” consensus, which is the most overrepresented motif found in regions of strong DNA binding by multiple TFs (highly occupied target [HOT] regions or hot spots) (modEncode Consortium et al. 2010; Harrison et al. 2011; Nien et al. 2011; Struffi et al. 2011; Kvon et al. 2012). Zld sites are also enriched near the promoter regions of many early zygotic genes, including those that spatially organize the embryo along the anterior–posterior (AP) and dorsal–ventral (DV) axes (ten Bosch et al. 2006; De Renzis et al. 2007; Liang et al. 2008; Harrison et al. 2011; Nien et al. 2011; Satija and Bradley 2012). Mutating Zld sites in enhancers from DV-expressed genes affects the timing and robustness of expression patterns driven by these enhancers (ten Bosch et al. 2006; Yanez-Cuna et al. 2012).
Here we examine the role of Zld in activating Bcd-dependent target genes. We show that Zld is required for effective Bcd binding to known Bcd-dependent enhancers and that there is a correlation between the number of Zld sites and the effects on individual enhancers. Loss of Zld leads to a redistribution of the global Bcd-binding profile, which causes the activation in early embryos of target genes that are normally silent until later in development. We conclude that multiple TFs—global TFs like Zld and position-specific TFs like Bcd—coregulate target genes and drive the proper developmental process.
Results
A correlation between Zld-binding motifs and Bcd-dependent enhancer activation
The 66 Bcd-dependent enhancers direct patterns of gene expression at various positions along the AP axis of early embryos (e.g., Fig. 1A,B; Chen et al. 2012). In two previous studies from our laboratory, we also identified 38 fragments that contain Bcd site clusters but fail to activate reporter gene expression in the early embryo (e.g., Fig. 1C,D; Supplemental Table). To identify sequence motifs correlated with active fragments, we used the discriminative search algorithm DREME (Bailey 2011) on the 66 active fragments, using the 38 inactive fragments as a negative control set. Five motifs (containing 10 different words in total) were identified under the cutoff E-value 1 (Supplemental Fig. 1). The top enriched word (CAGGTAG) appears in 33 active fragments out of 66, compared with one out of 38 inactive fragments, and corresponds to a known Zld-binding site (Liang et al. 2008).
Figure 1.

Zld-binding sites are overrepresented in active fragments. (A–D) Four typical reporter constructs driven by different DNA fragments show either Bcd-dependent patterns (A,B) or no expression in early embryos (C,D). Schematics below each embryo represent the distribution of Bcd-binding sites in corresponding DNA fragments. Bcd sites were identified by the ClusterDraw program (Lifanov et al. 2003) using the B1H PWM (Noyes et al. 2008). The cutoff P-value for Bcd sites was 5 × 10⁻³. (E) Actual counts of eight canonical Zld-binding sites in active and inactive fragments. P-values were calculated by a χ2 test (Robin et al. 2007) and reflect the enrichment of each heptamer in active fragments. (F) Distribution of Zld-binding sites in active fragments (hatched bars) and inactive fragments (white bars).
Previous work showed that Zld binds to eight canonical sequence motifs (ten Bosch et al. 2006; Liang et al. 2008; Nien et al. 2011). All eight were overrepresented in active fragments, but two motifs (CAGGTAG and CAGGTAA) showed a stronger bias than the other six (Fig. 1E). We also plotted the distribution of Zld site motif number in active and inactive fragments using all eight canonical Zld motifs (Fig. 1F). On average, active fragments contain two to three Zld motifs per kilobase, while inactive fragments contain less than one per kilobase (P < 0.005; one-tail Poisson). Finally, 63 of the 66 active fragments correspond to in vivo Zld-binding peaks from previous studies, compared with only 17 of the 38 inactive fragments (Harrison et al. 2011).
Adding Zld sites can activate a negative fragment and fine-tune enhancer activity
If Zld is involved in Bcd-dependent gene regulation, we hypothesized that adding Zld sites to inactive fragments might convert them into active enhancers in the early embryo. To test this, we used site-directed mutagenesis to introduce four new Zld sites into six different inactive fragments (GscB, HC_45, HC_68, HC_51, HC_71, and HC_72). Two of these negative fragments (GscB and HC_45) were taken from genomic regions associated with the goosecoid (gsc) gene, which is expressed in anterior regions (Hahn and Jackle 1996) but has not been shown to be a direct Bcd target. A third fragment (HC_71) was taken from the run locus, which is a known Bcd target gene (Chen et al. 2012). The other three were not associated with known Bcd target genes. Inserting four Zld sites caused the transcriptional activation of three fragments (HC_45, HC_71, and HC_72) in early embryos but had no effect on the other three (Fig. 2; Supplemental Fig. 2). All three activated fragments showed early ubiquitous expression during nuclear cycle 12 (nc12); this expression was abolished in mutants lacking Zld (Supplemental Fig. 2; data not shown). Slightly later in development, each of the three activated fragments drove distinct patterns. The HC_71 fragment with four inserted Zld sites directed expression pattern in ventral regions, while the ubiquitous pattern of the HC_72 fragment (plus four Zld sites) morphed into a pattern of two broad stripes during nc14 (Supplemental Fig. 2). Both patterns were abolished in zld mutants but not affected in bcd mutants, suggesting that the addition of the Zld sites converts these fragments into Zld-dependent, but not Bcd-dependent, enhancers (Supplemental Fig. 2). In contrast, the expression pattern of HC_45 became restricted to a strong stripe in anterior regions starting in nc13 and persisting until late in nc14 (Fig. 2J). This head stripe was greatly reduced in zld mutants (Fig. 2L) and completely abolished in embryos lacking Bcd (Fig. 2M), indicating that the HC_45 fragment was converted into a Bcd-dependent enhancer by the addition of four Zld sites. This was confirmed by ChIP and quantitative PCR (ChIP-qPCR) experiments, which showed that both Zld and Bcd binding to the HC_45 fragment were significantly enhanced when the sites were inserted (Fig. 2N). We also scrambled the nucleotide substitutions used to insert Zld sites into the HC_45 fragment, which abolished activation (Fig. 2K).
Figure 2.

Adding Zld sites activates the inactive fragment HC_45 and fine-tunes enhancer activity. (A–E) Maps of HC_45 variants that carry different numbers and combinations of extra Zld sites. Blue bars represent Bcd-binding sites (P < 0.005), and red bars represent Zld sites introduced to the HC_45 element. The number of extra Zld sites increases from 0 to 4, corresponding to A–E. Within each box, different combinations of Zld sites are shown. (F–J) lacZ RNA expression in a wild-type embryo carrying HC_45-lacZ transgenes with increasing numbers of additional Zld sites. (K) lacZ expression driven by HC_45 with scrambled sequences in the nucleotides that were mutated to add new Zld sites in J. (L,M) lacZ expression driven by HC_45_4Z in zld− (L) and bcd− (M) embryos. Note that there is still some expression of the HC_45_4Z construct in zld mutants. This suggests that another unknown factor can bind the inserted sites. (N) Zld (in red) and Bcd (in blue) ChIP-qPCR with HC_45 (blank bars) and HC_45_4Z (hatched bars). Primers were chosen to amplify only the transgenic fragment. A flanking region near the landing site was used as negative control (see the Supplemental Material for sequences). Zld- and Bcd-binding signals were normalized with the negative control and expressed as fold enrichment (see the Materials and Methods). Error bars represent standard deviations. Significant differences (P < 0.05, Student's t-test) are shown by double asterisks.
In summary, only the HC_45 fragment (from the gsc locus) could be converted into a robust Bcd-dependent enhancer by inserting four Zld sites. To better understand the relationship between Zld binding and HC_45-mediated activation, we tested a series of elements containing subsets of the four inserted sites mentioned above (Fig. 2A–E). Three constructs contained only one inserted site at different positions, but none of these insertions caused a detectable activation of the HC_45 element (Fig. 2B,G; data not shown). We also tested two constructs containing two inserted sites; both constructs directed weak expression in the anterior stripe (Fig. 2C,H; data not shown). Finally, we tested four constructs containing all combinations of three sites; all four constructs with three sites drove stronger activation of the anterior stripe compared with those containing two inserted sites, but activation was weaker than the level detected when all four sites were added (Fig. 2D,I; data not shown). The posterior boundaries of the weaker expression patterns were shifted anteriorly (Fig. 2, cf. I and J), suggesting that Zld can affect the apparent response of an element to the Bcd gradient. Taken together, these results suggest that adding different numbers of Zld sites to this site can fine-tune the timing and strength of Bcd-mediated enhancer activation. However, it is still unclear why most of the tested negative fragments could not be converted into Bcd-dependent enhancers by inserting Zld sites (see the Discussion).
Bcd-dependent gene activation in zld mutants
We next assayed the activities of a number of Bcd-dependent enhancers in mutant embryos lacking Zld. In previous work, Bcd-dependent enhancers were divided into three groups based on where the posterior limits of their expression patterns are positioned along the AP axis (Fig. 3A,B; Chen et al. 2012). Boundaries formed by type 0 enhancers are positioned very near the anterior pole (100%–75% EL), while those formed by type I enhancers are positioned between 75% and 65% EL. Finally, boundaries formed by type II enhancers lie in middle body and posterior regions. Since Bcd is expressed in a gradient, the boundaries directed by type 0, type I, and type II enhancers are formed in regions with very high, high, and lower levels of Bcd, respectively (Fig. 3A,B).
Figure 3.

Zld regulates Bcd-dependent enhancers by affecting Bcd-binding. (A) A wild-type (wt) Bcd gradient at nc13. (B) A schematic shows the definition of type 0, type I, and type II enhancers. Numbers represent positions within the embryo (anterior is 100, and posterior is 0). (C–P) lacZ expression patterns driven by type I and type II enhancers in wild-type (C,F,H,J,M,O) and zld− (D,G,I,K,N,P) embryos and enhancers with mutated Zld sites (E,L). (Q) Bcd ChIP_qPCR with different enhancers. Binding signals were normalized to the negative control defined in the legend for Figure 2. Error bars represent standard deviations from the mean. Significant differences (P < 0.05, Student's t-test) are shown by double asterisks.
We focused on the activities of the type I and type II enhancers, testing seven of each type in zld mutant embryos. For all type I enhancers, there was no detectable effect on activation levels in zld mutants (Fig. 3, cf. C,F,H and D,G,I; Supplemental Fig. 3), suggesting that these enhancers can be efficiently activated in the absence of Zld. We also mutated the Zld-binding sites in one type I enhancer (otd_EHE), which did not cause an obvious change of the expression level (Fig. 3E). However, the posterior expression boundaries driven by all type I enhancers were shifted posteriorly in zld mutants (Fig. 3D,G,I; Supplemental Figure 3).
In contrast, six of seven tested type II enhancers showed greatly diminished expression levels in zld mutants and, in some cases, anterior shifts of the very weak residual expression domains (Fig. 3K,N; Supplemental Fig. 3). We also mutated the Zld sites in one type II enhancer (run_HC36), which nearly abolished expression (Fig. 3L). These results suggest that Zld is critical for activation of enhancers that drive expression in regions with low levels of Bcd. The seventh type II enhancer that we tested (hb_P2) drove a slightly delayed anterior expression pattern in zld mutants, with a posterior boundary shifted toward the anterior (Fig. 3P). These effects are similar to the reported effects on the endogenous hb RNA expression pattern (Nien et al. 2011) and are consistent with a role for Zld in increasing the response of this enhancer to the low levels of Bcd in this region of the embryo.
How Zld functions at the molecular level to affect Bcd's transcriptional activities is not clear. One possibility is that removing Zld changes the Bcd gradient itself, but semiquantitative immunostains suggested that the gradient is unchanged in zld mutants (Supplemental Fig. 4). A more likely hypothesis is that Zld directly affects Bcd's ability to bind to its enhancers. To test this, we used ChIP-qPCR experiments with an anti-Bcd antibody in wild-type and zld mutant embryos. As expected, three type II enhancers that show reduced expression in zld mutants also showed significantly reduced levels of Bcd binding (Fig. 3Q). Interestingly, we also saw reduced Bcd binding to the two tested type I enhancers (Fig. 3Q), which was not expected because their associated expression patterns are not substantially changed in zld mutants. These results suggest that activation of at least some type I enhancers can occur even when Bcd binding is significantly reduced.
The genome-wide Bcd-binding profile in embryos lacking Zld
Previous work suggested that Zld and Bcd each binds to thousands of sites during early development (Li et al. 2008; Harrison et al. 2011; Nien et al. 2011). Furthermore, correlation analyses showed that >80% of the Bcd peaks associated with embryonically expressed genes overlap with Zelda peaks (Nien et al. 2011), suggesting that Zld is involved in Bcd-dependent regulation. To test this directly, we used ChIP-seq (ChIP combined with sequencing) to examine the genome-wide Bcd-binding profile in early embryos lacking zld and compared it with profiles from wild-type embryos. Two biological replicates each of wild-type and zld mutant embryos were examined (see the Materials and Methods).
The significant peaks of Bcd-binding (called by MACS) (see the Materials and Methods) were highly consistent between biological replicates (Supplemental Fig. 6A), so we merged the data from replicates of the same genotype. This yielded 3891 peaks in wild type and 2650 peaks in zld mutants. Next, we removed peaks present only in one replicate for each genotype and then filtered out heterochromatic peaks, which yielded 1719 peaks in wild type and 971 peaks in zld mutants. We also compared Bcd-binding peaks from our experiments with previous studies (Li et al. 2008). More than 89% of the 1% false discovery rate (FDR) peaks called in the ChIP–chip experiments overlapped with peaks called by MACS in our experiments (Supplemental Fig. 6B).
We then normalized the wild-type and zld mutant data sets so that the total read number for each genotype was the same (see the Materials and Methods). We immediately noticed that individual peaks showed very different effects of removing Zld and partitioned each peak into one of three groups (Fig. 4A–C). The first group contained 1079 peaks that appeared only in wild-type embryos (e.g., Fig. 4A), the second group contained 640 peaks that were called in both data sets (e.g., Fig. 4B), and the third group contained 279 peaks called only in the zld mutant data set (e.g., Fig. 4C). Most peaks in all three categories contained overrepresented Bcd-binding motifs (data not shown), suggesting that the great majority of peaks represent direct DNA-binding events. Of the 66 known Bcd-dependent enhancers, 65 showed peaks of Bcd-binding in wild-type embryos. In zld mutants, 11 of these were reduced to background levels, while the other 54 were still detectable (data not shown). However, binding to most of these enhancers was weakened in zld mutants (Fig. 5B), consistent with our ChIP-qPCR data (Fig. 3).
Figure 4.
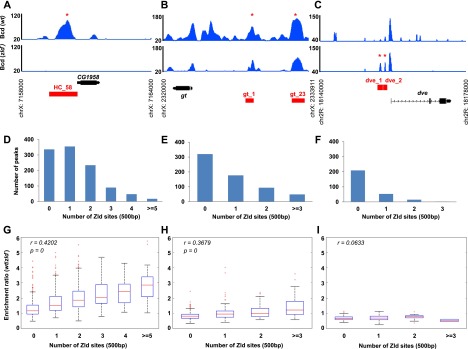
Three groups of Bcd-binding peaks behave differently in wild-type (wt) and zld− embryos. (A–C) ChIP-seq read profiles for Bcd binding in wild-type (top panel) and zld− (bottom panel). Bcd binding to 1079 peaks was abolished in zld−, as shown in A. (B) Six-hundred-forty other Bcd-binding peaks were called in both wild type and zld−, although peak heights may differ in the two genetic backgrounds. (C) Finally, 279 peaks were called by MACS only in the zld mutant samples. Read densities were calculated on tiling windows of 10 bp and expressed as the normalized number per million reads sequenced. To compare enrichment levels between wild type and zld−, wild-type read counts were scaled down 0.4474-fold to match the scale of zld−. The University of California at Santa Cruz (UCSC) gene annotation is shown at the bottom of each panel. The red boxes indicate the positions of enhancers. Genomic loci coordinates are shown next to the X-axis. (D–F) Distributions of Zld-binding sites in three groups of Bcd-binding peaks—wild-type-only peaks (D), shared peaks (E), and zld−-only peaks (F)—in a 500-bp window around peak summits. (G–I) Correlations between enrichment ratios (wild type/zld−) and number of Zld sites in wild-type-only peaks (G), shared peaks (H), and zld−-only peaks (I) in a 500-bp window around peak summits. Red lines represent medians. The bottom and top lines of the blue boxes represent the first and third quartiles, respectively. Error bars represent standard errors. Red crosses represent outliers that are beyond 1.5 times the interquartile range. (r) Pearson's correlation coefficient. P-values were calculated using a permutation test. Overlapping peaks of two biological replicates were used in D–I.
Figure 5.

Zld strengthens target gene responses to the Bcd gradient. (A) Correlation between Bcd-binding changes and mRNA expression changes in zld mutants. Each Bcd-dependent enhancer known to associate with a specific target gene is represented as a circle, and the different colors represent different numbers of Zld sites per kilobase. When multiple enhancers were associated with one gene, the average of Bcd-binding enrichment ratios of all enhancers was used. One-hour to 2-h mRNA expression data were obtained from Liang et al. (2008). (r) Pearson's correlation coefficient. The P-value was calculated using a permutation test. (B) Change of Bcd binding to type 0, type I, and type II Bcd-dependent enhancers in wild-type (wt) and zld−. Red lines represent medians. The bottom and top lines of the blue boxes represent the first and third quartiles, respectively. Error bars represent standard errors. Red crosses represent outliers that are beyond 1.5 times the interquartile range. (C) Correlations between Bcd-binding strength and posterior boundary positions (PBPs) of 66 enhancers. (D) Correlation between Zld-binding strength and posterior boundary positions of 66 enhancers. Zld-binding peak heights were obtained from Harrison et al. (2011). Zld-binding peak height was assigned 0 if a given enhancer was not associated with any peak. (r) Pearson's correlation coefficient. The P-value was calculated using a permutation test.
Our Zld motif insertion experiments with the HC_45 genomic fragment (Fig. 2) suggest that the number of Zld sites in regulatory elements might fine-tune timing and/or levels of expression. To test whether a similar mechanism plays a general role in Bcd target gene activation, we analyzed Bcd- and Zld-binding sites in Bcd-bound regions in wild-type and zld mutant embryos. Specifically, we predicted that Bcd-binding peaks might be more affected by Zld removal if they contain higher numbers of Zld motifs. Consistent with this, we observed that the percentage of peaks containing at least one Zld site drops from 69% in wild-type-only peaks to 50% in shared peaks and to only 25% in zld-only peaks (Fig. 4D–F). Also, by correlating the binding enrichment ratio with the number of Zld-binding sites associated with each peak, we found that peaks containing more Zld sites tend to decrease more in zld mutants compared with those with fewer sites. This correlation was significant for peaks detected only in wild type (Fig. 4G) and for shared peaks (Fig. 4H). In contrast, no such trend was detected in peaks found only in zld mutants because they are Zld-independent (Fig. 4I).
Zld-binding can strengthen target gene responses to the Bcd gradient
Previous studies suggest that Zld potentiates the “morphogenetic capacity” of the Dorsal gradient (Rushlow and Shvartsman 2012). We carefully analyzed the 66 known Bcd-dependent enhancers to test whether Zld has similar function in the AP system. These enhancers display a wide range of effects on expression levels when Zld is removed (Fig. 3; Supplemental Fig. 3). We hypothesize that these effects are correlated with changes in Bcd binding in the zld mutant. To test this, we identified 36 genes associated with Bcd-dependent enhancers and plotted the wild-type:zld ratio of expression levels (calculated from Liang et al. 2008) with the same ratio of Bcd-binding strength (Fig. 5A). A highly significant positive correlation was observed, suggesting that reduced Bcd binding results in the down-regulation of Bcd target genes in zld mutants. Furthermore, enhancers with more Zld sites showed stronger reductions in RNA expression levels (cf. different colored dots in Fig. 5A).
Since type I and type II enhancers direct expression in regions with different Bcd concentrations, we hypothesized that Bcd binding to type II enhancers relies more on Zld's input. Indeed, we observed a significant reduction of Bcd binding to type II enhancers compared with type 0 or type I in zld mutants (Fig. 5B). Taken together, these observations substantiate the hypothesis that Zld helps efficiently activate Bcd-dependent target genes.
Next, we asked whether Zld is involved in positioning the expression patterns of Bcd-dependent enhancers. Previous studies suggested that there is no global correlation between boundary positioning and Bcd-binding strength (Ochoa-Espinosa et al. 2005; Segal et al. 2008). However, in these studies, binding strength was predicted computationally from the number of Bcd motifs and the in vitro binding affinity of individual sites, and it is not clear whether these predictions accurately reflect in vivo binding activities. To test this, we used Bcd-binding peak height from the experiments described here to estimate in vivo binding strength and correlated peak height with boundary position for all 66 Bcd-dependent enhancers (Fig. 5C). No correlation was observed, which supports the idea that differential binding affinity is not a key design principle that governs the responses of most target genes to the Bcd gradient.
If Zld is critical for efficient Bcd binding, we reasoned that Zld-binding strength might affect the apparent responses of Bcd target genes. Thus, we performed a similar analysis, correlating Zld-binding strength (estimated by peak height) (Harrison et al. 2011) with boundary position (Fig. 5D). In contrast to the results obtained for Bcd, we detected a weak positive correlation between Zld binding and the boundary positions of Bcd-dependent expression domains. This result is consistent with the posterior shift of boundary position as we added more Zld sites to the HC_45 fragment (Fig. 2J) and suggests that Zld binding is a critical combinatorial input for positioning some Bcd-dependent target genes.
Loss of Zld causes a functional redistribution of Bcd binding
The Bcd-binding peaks found only in zld mutants suggest that Zld normally prevents recruitment of Bcd to specific genomic locations. We thus analyzed these locations for common characteristics. One significant trend is that peaks found only in zld mutants are biased toward sequences located within 1600 base pairs (bp) of mapped transcription start sites (TSSs) (Fig. 6A). It is possible that these promoter-proximal regions are more “open” than other genomic regions. To test this further, we compared the positions of all peaks found only in zld mutants with the DNase I-hypersensitive sites (Li et al. 2011) and found a concordance of >90%. Together, these data suggest that Bcd-binding peaks in zld mutants are more likely to be formed in regions with more accessible chromatin configurations.
Figure 6.

Redistributed Bcd binding and precocious activation of target genes in zld− embryos. (A) Relative levels of Bcd binding to basal promoter regions increase in zld− compared with wild-type (wt) embryos. The percentages of peaks located within certain distances from peak summits to the nearest basal promoters are shown for different peak groups. TSSs were determined by looking for 5′ untranslated region (UTR) annotation from modENCODE submission: annotation of the developmental transcriptome of Drosophila melanogaster (ID: modENCODE_4057). P-values were calculated using a χ2 test. (B) Ectopic Bcd binding correlates with up-regulated transcription. Numbers in the second column represent peaks that are associated with up-regulated genes. To identify genes associated with Bcd-binding peaks, we located coding sequences within 1 kb upstream of and downstream from the peak summit and filtered out genes with the TSS outside this region. Up-regulated genes were identified by comparing 1- to 2-h wild-type and zld− microarray data from Liang et al. (2008). P-values were calculated by χ2 test between the zld-only peaks and wild-type-only or shared peaks. (C–J) Expression of endogenous genes in wild-type (C,E,G) and zld− (D,F,H) embryos. (I,J) lacZ expression of a dve enhancer in wild-type (I) and zld− (J) embryos. (K) Bcd ChIP-qPCR of three enhancer regions. Error bars represent standard deviations from the mean. (*) P < 0.05; (**) P < 0.005.
Some zld-only peaks were detected near genes that are not activated in early wild-type embryos. If these peaks reflect functional Bcd binding, the genes associated with them might be up-regulated in early zld mutant embryos. By comparing the locations of these peaks with previous expression microarray experiments (Liang et al. 2008), we found that zld-only peaks were likely to be associated with up-regulated transcripts in zld mutants (Fig. 6B). We next focused on peaks near three genes, engrailed (en), eyeless (ey), and defective proventriculus (dve), none of which are activated in early embryos (Fig. 6C,E,G). We first confirmed the increase in Bcd-binding by ChIP-qPCR (Fig. 6K) and then used in situ hybridization to assay en, ey, and dve expression in early embryos lacking zld.
Remarkably, all three genes were precociously activated. en was expressed throughout the early embryo, with higher levels near the anterior tip (Fig. 6D), while ey and dve were expressed in broad stripes in middle (Fig. 6F) and anterior regions (Fig. 6H), respectively. To test whether activation of these genes correlates with ectopic Bcd binding, we cloned two genomic fragments that showed higher levels of Bcd binding in zld mutants into reporter genes. These regions each contain multiple consensus “TAATCC” Bcd-binding motifs but did not direct expression in wild-type embryos (Fig. 6I; data not shown). However, in zld mutants, both constructs drove expression patterns similar to that observed for the endogenous dve gene (Fig. 6J; data not shown).
Discussion
Multiple roles for Zld in regulating Bcd-dependent target genes
Previous studies identified Zld as a critical factor in the activation of the zygotic genome during early development (Liang et al. 2008; Nien et al. 2011). Our results suggest that Zld plays multiple roles in the activation and patterning of Bcd-dependent target genes. Individual classes of Bcd target genes show different effects from removing Zld (Fig. 3). In general, levels of type II target gene expression (in middle regions of the embryo) are strongly reduced. These effects correlate well with the trend toward stronger Zld binding in enhancers with more posterior boundaries (Fig. 5) and suggest that Zld is more important for activation of target genes in areas where Bcd concentrations are low. Stronger binding by Zld can thus increase the apparent response of a given target gene (like hb) to the Bcd gradient, as has been suggested for the Dorsal gradient in Drosophila (Kanodia et al. 2012; Rushlow and Shvartsman 2012). In contrast, the expression domains of type I genes expand posteriorly in zld mutants, which is counterintuitive to the idea that Zld assists Bcd in activation of these genes. Previous work suggests that the posterior boundaries of type I genes are formed by three repressive gradients (Capicua, Run, and Kr) that antagonize Bcd-dependent activation (Lohr et al. 2009; Chen et al. 2012). Since loss of Zld causes a strong reduction of both run and Kr expression (Fig. 3; Nien et al. 2011), it is likely that these expansions are indirect.
Zld-binding sites are overrepresented in known enhancer regions that direct Bcd-dependent activation, and our ChIP-qPCR and ChIP-seq experiments show that in zld mutants, Bcd binding to many of its normal enhancers is reduced or absent. These strong effects of Zld on Bcd binding are consistent with the idea that Zld acts as a pioneer factor that enhances Bcd binding. Accumulating evidence suggests that pioneer factors control zygotic genome activation through their ability to open condensed chromatin (for review, see Zaret and Carroll 2011). For example, the Caenorhabditis elegans FoxA homolog PHA-4 is a pioneer factor that induces widespread chromatin decompaction prior to transcription (Fakhouri et al. 2010), possibly by recruiting the histone variant H2A.Z (Updike and Mango 2006). Also, in zebrafish, the global activators Nanog, Pou5f1, and SoxB1 were recently shown to act as pioneer factors controlling the MZT (Lee et al. 2013; Leichsenring et al. 2013) by establishing active histone marks associated with RNA polymerase II (Pol II) occupancy (Soufi et al. 2012; Leichsenring et al. 2013). In Drosophila, there is a strong correlation between chromatin accessibility and the overlapping patterns of TF binding (Kaplan et al. 2011; Li et al. 2011; Thomas et al. 2011; Bonn et al. 2012), but future experiments will be required to unravel the mechanisms that control chromatin accessibility.
How Zld affects the in vivo Bcd-binding profile
In the 180-Mb Drosophila genome, there are hundreds of genomic intervals that contain clusters of Bcd-binding motifs, but only approximately half are bound and activated by Bcd during early embryogenesis (Li et al. 2008; Chen et al. 2012). Our study shows that some inactive regions are bound and activated by Bcd in zld mutants, which suggests that Zld normally prevents Bcd binding to these regions in wild-type embryos. In these regions, there are very few Zld-binding motifs and no evidence of in vivo Zld binding, which suggests that Zld's role in keeping them off is indirect. We envision three nonexclusive indirect mechanisms. First, Zld may activate repressors that bind these normally inactive regions and reduce the level of Bcd binding in early embryos. For example, the known repressors Hb, Kr, Giant (Gt), and Sloppy-paired 1 (Slp1) bind to regions in the vicinity of the dve fragment that is activated in zld mutants (Fig. 6). However, we found no precocious expression of dve when tested in embryos lacking Kr, slp1, hb, or gt or in hb slp1 and Kr slp1 double-mutant combinations (Z Xu and S Small, unpubl.).
Second, by ensuring that Bcd binds efficiently to its normal binding locations, Zld may effectively lower the concentration of free Bcd molecules that are available for ectopic binding events in wild-type embryos. In zld mutants, there is no detectable change in amplitude or shape of the Bcd gradient (Supplemental Fig. 4) but a redistribution of its binding profile, with reduced binding to its normal sites and increased binding to promoter-proximal regions and to target enhancers that are not active in early wild-type embryos (Fig. 6). Promoters and enhancers are typically in more open chromatin configurations compared with other genomic regions (e.g., Li et al. 2011), which might explain Bcd's preference for binding to these loci. However, this scenario seems unlikely because embryogenesis is not perturbed when Bcd concentrations are increased by inserting up to five extra copies of the bcd gene into the genome (Driever and Nusslein-Volhard 1988a; Struhl et al. 1989; Liu et al. 2013). Neither dve nor ey is precociously activated in embryos containing six copies of bcd (Z Xu and S Small, unpubl.), which argues against this model.
Third, since Zld sites are present at hot spots where multiple TFs bind (Li et al. 2008, 2011; MacArthur et al. 2009; Satija and Bradley 2012), it may facilitate the binding of multiple activators and repressors to regions that function as enhancers. In this scenario, Zld would indirectly affect the balance between repressors and activators that is critical for positioning target gene expression boundaries in the early embryo. Indeed, type I Bcd target genes show pattern expansions in zld mutants, possibly because of delayed and reduced expression of the Kr and Run repressors that set these boundaries (Fig. 3). If Zld also affects Kr- or Run-binding efficiency, this could contribute to the observed expansions. An attractive idea is that Zld differentially affects the binding properties of multiple proteins, which would contribute to the specific patterning functions of individual enhancers.
Integration of binding activities by Bcd-dependent enhancers
Despite recent technical and computational advances (Crawford et al. 2006; Giresi et al. 2007; Heintzman et al. 2007; Visel et al. 2009; modEncode Consortium et al. 2010; Zhu et al. 2013), identifying active enhancers in genome sequences and predicting their expression patterns are still major goals in the post-genomic era. Open chromatin configurations and clustered binding sites are consistent features of enhancers, and all Bcd-dependent enhancers known thus far contain clusters of Bcd-binding motifs. Our results show that Bcd motif clusters containing Zld sites are more likely to be bound and activated by Bcd, suggesting that regions of the genome with closely linked Zld- and Bcd-binding motifs contain a “code” that is more likely to recruit Bcd compared with regions containing only Bcd motifs. But this code is not simple. We were able to convert only one inactive cluster (HC_45) into a Bcd-dependent enhancer by adding four consensus Zld sites. The HC_45 fragment is located in the gsc locus, which is actively transcribed in the early embryo (Hahn and Jackle 1996) and is located in a region of open chromatin that binds Bcd without added Zld sites, albeit weakly (Supplemental Fig. 2; Li et al. 2008, 2011). Among the fragments that could not be converted was a separate fragment from the gsc locus (GscB) that contains a cluster of Bcd-binding motifs but is located in a closed chromatin configuration and does not show in vivo Bcd binding (Supplemental Fig. 2). These results suggest that the HC_45 fragment is “primed” for activation, and the addition of Zld sites enhances a subthreshold activation potential.
Previous studies suggested that specific binding site spacing and orientation are critical for the transcriptional activities of several other Drosophila factors (Erives and Levine 2004; Zinzen et al. 2006; Liberman and Stathopoulos 2009; Swanson et al. 2011), but our preliminary analyses did not reveal obvious Bcd and Zld arrangements that correlate with activity state (data not shown). We thus favor the hypothesis that other factors are involved in distinguishing which enhancers are activated by Bcd. For example, there are synergistic interactions between Bcd and Hb that are required for the activation of several Bcd target genes (Simpson-Brose et al. 1994; Arnosti et al. 1996; Schroeder et al. 2004; Porcher et al. 2010). However, we do not see a significant overrepresentation of Hb motifs in the activated set of fragments. Our DREME search identified several other motifs as overrepresented in Bcd-dependent enhancers, including TTK, HTH, and EXD (Supplemental Fig. 1), each of which is ubiquitously expressed in the early embryo. We are currently investigating whether these proteins contribute to Bcd-dependent enhancer activity.
Materials and methods
Fly strains
Wild-type embryos were generated from a yw stock. To remove zld function, the FLP-FRT method was used to induce germline clones. Strains containing the zld294 FRT19A and ovoD FRT19A hsFLP122 chromosomes were generous gifts from Christine Rushlow (Liang et al. 2008). Briefly, we used standard crosses to generate virgin females of the genotype zld294 FRT 19A/ovoD FRT 19A hsFLP122, which were mated with wild-type males or transgenic males carrying different reporter constructs. This experiment removes maternal Zld from all embryos and the zygotic component from half. To remove bcd function, which is strictly maternal, homozygote bcdE1 virgins, which produce no Bcd protein, were mated with wild-type transgenic males.
TF-binding motifs
Sixty-six known Bcd-dependent enhancers and 38 inactive fragments were searched for overrepresented motifs using the DREME program with a search parameter of E-value = 1 (Bailey 2011). Among the inactive fragments, HC_39 and HC_53 were excluded because they drive lacZ expression starting at late nc14. The primer sequences of all 104 fragments used in this study were from Chen et al. (2012). Identified motifs were compared with the All Drosophila Motif Database using TOMTOM (Gupta et al. 2007). To test the distribution of Zld sites, we counted the number of the eight canonical Zld sites (ten Bosch et al. 2006; Liang et al. 2008; Nien et al. 2011) in each fragment and calculated the P-value of the χ2 test for differential distribution of the corresponding heptamer between active and inactive fragments.
Reporter gene constructs, transgenesis, and embryo expression assays
Wild-type and mutated genomic fragments tested in this study were cloned into the piB-HC-lacZ vector (Chen et al. 2012) using a SalI restriction site (mutated run_HC36 and otd_EHE) or a BglII site (all others) at the 5′ end and an AscI site at the 3′ end. This vector contains a 203-bp even-skipped (eve) basal promoter fragment (from −40 to +162 with respect to eve's TSS), a 3.5-kb lacZ coding fragment, and an 800-bp fragment from the α-tubulin gene. All constructs were inserted by PhiC31 integrase-mediated cassette exchange into a landing site on chromosome II (38F1), which was previously shown to support high levels of reporter expression with low background (Bateman et al. 2006).
To introduce extra Zld sites into inactive fragments, we searched for sequences in the fragments that are similar to the Zld-binding motif and made as few nucleotide changes as possible to generate one of four high-affinity Zld sites (CAGGTAG, TAGGTAG, CAGGTAA, and CAGGTAT) without introducing other TF-binding sites. To mutate Zld sites, we made two to three nucleotide substitutions per Zld site (P < 0.0005). Enhancers containing extra or mutated Zld sites were synthesized by Integrated DNA Technologies, Inc. To generate HC_45 fragments with different numbers of introduced Zld sites, we used recombinant PCR. Sequences of all mutated constructs are in the Supplemental Material. Embryos (2–4 h after egg laying) were collected and stained by in situ hybridization using digoxigenin- or fluorescein-labeled antisense RNA probes as previously described (Small 2000). In some experiments, DAPI staining was used to visualize nuclear division cycles. Bcd antibody staining procedures were as previously described (Ochoa-Espinosa et al. 2009).
ChIP-qPCR quantification
Two biological replicates were performed for each ChIP-qPCR experiment. Briefly, embryos (1–3 h after egg laying) were collected with embryo wash (0.03% Triton-X100, 140 mM NaCl) and dechorionated in 100% bleach for 2 min. For each experiment, six aliquots each of 100 μL of embryos were transferred to Eppendorf tubes containing 340 μL of buffer A1 (15 mM HEPES at pH 7.5, 15 mM NaCl, 60 mM KCl, 4 mM MgCl2, 0.5% Triton X-100, 0.5 mM DDT, complete EDTA-free protease inhibitor cocktail [Roche]). To each tube, 37% formaldehyde was added to a final concentration of 1.8%. Embryos were then homogenized with an Eppendorf micropestle and fixed on ice for 15 min. Cross-linking was stopped by adding glycine to a final concentration of 0.125 M. Homogenates were then centrifuged at 3000 rpm in a microcentrifuge for 3 min at 4°C. Supernatant was discarded, and 340 μL of buffer A1 was added to each tube. Pellets were suspended by vortexing and centrifuged two more times (three washes with buffer A1 in total) followed by two washes in 340 μL of buffer A2 (15 mM HEPES at pH 7.5, 140 mM NaCl, 1 mM EDTA, 0.5 mM EGTA, 1% Triton-X100, 0.1% sodium deoxycholate, 0.1% SDS, 0.5% N-lauroylsarcosine, complete EDTA-free protease inhibitor cocktail [Roche]). Pellets were then harvested by centrifuging at 14,000 rpm, snap-frozen in liquid nitrogen, and stored at −80°C for long-term storage.
For each ChIP experiment, pellets were combined to yield 60 mg total and sonicated in 200 μL of buffer A2. Sonication was performed four times for 30 sec on and 30 sec off with a Sonic Dismembrator model 550 (Fisher Scientific) equipped with a microtip at power setting 3. Affymetrix/USB ChIP assay kits were used for immunoprecipitation. The Bcd antibody (Ochoa-Espinosa et al. 2009) and preimmune serum were purified using the Protein A antibody purification kit (Sigma). Affinity-purified Zld antibody was a generous gift from Christine Rushlow (Nien et al. 2011).
Two microliters of chromatin-immunoprecipitated DNA or input DNA (1:100) was used for qPCR analysis (QuantiTect SYBR Green PCR kit, Qiagen). DNA concentrations were calculated by the standard curve method. For Bcd ChIP samples, a control ChIP was performed using preimmune serum. For Zld ChIP samples, a mock control without antibody was used. To calculate the amount of chromatin-immunoprecipitated DNA, we used the formula (conc[Bcd ChIP] − conc[preimmunoserum ChIP])/conc[Input] for Bcd binding or (conc[Zld ChIP] − conc[mock])/conc[Input]. Negative controls where no Bcd or Zld binding was reported (Li et al. 2008; Nien et al. 2011) were run in parallel with other samples. Primers used for each genomic region and for negative controls are listed in the Supplemental Material.
ChIP-seq and data analysis
ChIPs with the Bcd antibody were performed on two biological replicates each of 1- to –3-h wild-type and zld mutant embryos in parallel. A portion of each collection was DAPI-stained to check the developmental stage, and >50% of the embryos in each collection were within the desired age range (Supplemental Fig. 5). Libraries were made with NEXTflex ChIP-seq kit (BIOO Scientific, #5143-01) and barcoded with NEXTflex ChIP-seq barcodes (BIOO Scientific, #514120). Libraries were 50× single-end sequenced by HiSeq2000 (Illumina) at the New York University Genome Core Facility. Raw reads were mapped to Drosophila melanogaster genome release 5.3 by Bowtie2 using default settings on the Galaxy platform (Giardine et al. 2005; Langmead and Salzberg 2012). Mapped sequencing reads and peak files are available from the National Center for Biotechnology Information's Gene Expression Omnibus database (http://www.ncbi.nlm.nih.gov/geo) under accession number GSE55256. For each genotype, reads from two biological replicates were combined, and redundant reads were removed. Peaks were called using the MACS program with the respective genomic inputs as controls on the Cistrome platform (Zhang et al. 2008; Liu et al. 2011). Parameters used in the MACS program were as follows: effective genome size: 1.52 × 10⁸; bandwidth: 300 bp; model fold: 10 and 30; P-value cutoff 1.00 × 10⁻⁵; range for calculating regional λ: 1000 bp and 10,000 bp. Peaks were called separately on the data from each replicate and also on the merged data from combined replicates for each genotype. For further analysis, we used the euchromatic peaks called from the merged data, with the additional criteria that peaks must be present in both replicates. For analyzing enrichment of Bcd binding, we calculated the number of reads per kilobase per million mapped reads (RPKM) for wild-type ChIP, wild-type input, zld− ChIP, and zld− input. Enrichment of Bcd binding was calculated as the ratio between the RPKMs of each chromatin-immunoprecipitated sample and the relevant input control (Enrichmentwt = RPKMwt_chip/RPKMwt_input).
The Bcd-binding motif derived from bacteria one-hybrid experiments (Noyes et al. 2008) and the Zld-binding motif from Nien et al. (2011) were used for the binding site analysis, with a P-value cutoff of 0.0005 for counting Bcd- or Zld-binding sites. TSSs from the D. melanogaster genome annotation R5.3 were used for the promoter analysis (FlyBase).
Correlations between ChIP-seq, ChIP–chip, and DNase I
Overlapping Bcd-bound peaks from our two ChIP-seq replicates were compared with previous ChIP–chip data using two independent antibodies (Bcd-1 and Bcd-2) (Li et al. 2008). Peaks identified in both experiments were required to overlap by at least 200 bp. The same criterion was also applied to the comparison between ChIP-seq biological replicates and between ChIP-seq and DNase I data sets (Li et al. 2011). To control for the quality of the two ChIP-seq replicates, we also did correlation tests by comparing the respective enrichment ratio of each replicate using the 1-kb flanking region around the binding summits of peaks <5% FDR. Pearson's correlation coefficient is shown in the plot in Supplemental Figure 6A.
Correlations between posterior boundary positions and Bcd- or Zld-binding strength
For Bcd-binding strength to a given enhancer, we calculated the Bcd enrichment ratio (as described above) within this enhancer. For Zld-binding, we associated a given enhancer to a Zld peak if the peak single-nucleotide position is contained within this enhancer, and we used the peak height to represent Zld-binding strength to this enhancer (Harrison et al. 2011). Posterior boundary positions of all enhancers are from Chen et al. (2012). Pearson's correlation coefficient and a P-value calculated from permutation test are shown in each plot (Fig. 5C,D).
Acknowledgments
We thank Christine Rushlow for the anti-Zld antibody, the flies to generate zld germline clones, and comments on the manuscript; Sevinc Ercan for the ChIP-Seq protocol; Esteban Mazzoni for advice on data analysis; and the New York University GenCore for next-generation DNA sequencing. We thank Claude Desplan, Rhea Datta, Scott Barolo, and the anonymous reviewers for suggestions that significantly improved the manuscript. This work was supported by National Institutes of Health grant RO1 GM51946 to S.S. and was conducted in a facility constructed with support from Research Facilities Improvement Grant C06 RR-15518-01 from the National Center for Research Resources, National Institutes of Health.
Footnotes
Supplemental material is available for this article.
Article is online at http://www.genesdev.org/cgi/doi/10.1101/gad.234534.113.
References
- Arnosti DN, Barolo S, Levine M, Small S 1996. The eve stripe 2 enhancer employs multiple modes of transcriptional synergy. Development 122: 205–214 [DOI] [PubMed] [Google Scholar]
- Bailey TL 2011. DREME: motif discovery in transcription factor ChIP-seq data. Bioinformatics 27: 1653–1659 [DOI] [PMC free article] [PubMed] [Google Scholar]
- Bateman JR, Lee AM, Wu CT 2006. Site-specific transformation of Drosophila via phiC31 integrase-mediated cassette exchange. Genetics 173: 769–777 [DOI] [PMC free article] [PubMed] [Google Scholar]
- Berleth T, Burri M, Thoma G, Bopp D, Richstein S, Frigerio G, Noll M, Nusslein-Volhard C 1988. The role of localization of bicoid RNA in organizing the anterior pattern of the Drosophila embryo. EMBO J 7: 1749–1756 [DOI] [PMC free article] [PubMed] [Google Scholar]
- Biemar F, Zinzen R, Ronshaugen M, Sementchenko V, Manak JR, Levine MS 2005. Spatial regulation of microRNA gene expression in the Drosophila embryo. Proc Natl Acad Sci 102: 15907–15911 [DOI] [PMC free article] [PubMed] [Google Scholar]
- Biggin MD 2011. Animal transcription networks as highly connected, quantitative continua. Dev Cell 21: 611–626 [DOI] [PubMed] [Google Scholar]
- Bonn S, Zinzen RP, Girardot C, Gustafson EH, Perez-Gonzalez A, Delhomme N, Ghavi-Helm Y, Wilczynski B, Riddell A, Furlong EE 2012. Tissue-specific analysis of chromatin state identifies temporal signatures of enhancer activity during embryonic development. Nat Genet 44: 148–156 [DOI] [PubMed] [Google Scholar]
- Chen H, Xu Z, Mei C, Yu D, Small S 2012. A system of repressor gradients spatially organizes the boundaries of Bicoid-dependent target genes. Cell 149: 618–629 [DOI] [PMC free article] [PubMed] [Google Scholar]
- Crawford GE, Holt IE, Whittle J, Webb BD, Tai D, Davis S, Margulies EH, Chen Y, Bernat JA, Ginsburg D, et al. 2006. Genome-wide mapping of DNase hypersensitive sites using massively parallel signature sequencing (MPSS). Genome Res 16: 123–131 [DOI] [PMC free article] [PubMed] [Google Scholar]
- De Renzis S, Elemento O, Tavazoie S, Wieschaus EF 2007. Unmasking activation of the zygotic genome using chromosomal deletions in the Drosophila embryo. PLoS Biol 5: e117. [DOI] [PMC free article] [PubMed] [Google Scholar]
- Driever W, Nusslein-Volhard C 1988a. The bicoid protein determines position in the Drosophila embryo in a concentration-dependent manner. Cell 54: 95–104 [DOI] [PubMed] [Google Scholar]
- Driever W, Nusslein-Volhard C 1988b. A gradient of bicoid protein in Drosophila embryos. Cell 54: 83–93 [DOI] [PubMed] [Google Scholar]
- Driever W, Nusslein-Volhard C 1989. The bicoid protein is a positive regulator of hunchback transcription in the early Drosophila embryo. Nature 337: 138–143 [DOI] [PubMed] [Google Scholar]
- Driever W, Ma J, Nusslein-Volhard C, Ptashne M 1989. Rescue of bicoid mutant Drosophila embryos by bicoid fusion proteins containing heterologous activating sequences. Nature 342: 149–154 [DOI] [PubMed] [Google Scholar]
- Drocco JA, Grimm O, Tank DW, Wieschaus E 2011. Measurement and perturbation of morphogen lifetime: effects on gradient shape. Biophys J 101: 1807–1815 [DOI] [PMC free article] [PubMed] [Google Scholar]
- Elf J, Li GW, Xie XS 2007. Probing transcription factor dynamics at the single-molecule level in a living cell. Science 316: 1191–1194 [DOI] [PMC free article] [PubMed] [Google Scholar]
- Erives A, Levine M 2004. Coordinate enhancers share common organizational features in the Drosophila genome. Proc Natl Acad Sci 101: 3851–3856 [DOI] [PMC free article] [PubMed] [Google Scholar]
- Fakhouri TH, Stevenson J, Chisholm AD, Mango SE 2010. Dynamic chromatin organization during foregut development mediated by the organ selector gene PHA-4/FoxA. PLoS Genet 6: e1001060. [DOI] [PMC free article] [PubMed] [Google Scholar]
- Fisher WW, Li JJ, Hammonds AS, Brown JB, Pfeiffer BD, Weiszmann R, MacArthur S, Thomas S, Stamatoyannopoulos JA, Eisen MB, et al. 2012. DNA regions bound at low occupancy by transcription factors do not drive patterned reporter gene expression in Drosophila. Proc Natl Acad Sci 109: 21330–21335 [DOI] [PMC free article] [PubMed] [Google Scholar]
- Fujioka M, Emi-Sarker Y, Yusibova GL, Goto T, Jaynes JB 1999. Analysis of an even-skipped rescue transgene reveals both composite and discrete neuronal and early blastoderm enhancers, and multi-stripe positioning by gap gene repressor gradients. Development 126: 2527–2538 [DOI] [PMC free article] [PubMed] [Google Scholar]
- Gao Q, Finkelstein R 1998. Targeting gene expression to the head: the Drosophila orthodenticle gene is a direct target of the Bicoid morphogen. Development 125: 4185–4193 [DOI] [PubMed] [Google Scholar]
- Giardine B, Riemer C, Hardison RC, Burhans R, Elnitski L, Shah P, Zhang Y, Blankenberg D, Albert I, Taylor J, et al. 2005. Galaxy: a platform for interactive large-scale genome analysis. Genome Res 15: 1451–1455 [DOI] [PMC free article] [PubMed] [Google Scholar]
- Giresi PG, Kim J, McDaniell RM, Iyer VR, Lieb JD 2007. FAIRE (formaldehyde-assisted isolation of regulatory elements) isolates active regulatory elements from human chromatin. Genome Res 17: 877–885 [DOI] [PMC free article] [PubMed] [Google Scholar]
- Gregor T, Wieschaus EF, McGregor AP, Bialek W, Tank DW 2007. Stability and nuclear dynamics of the bicoid morphogen gradient. Cell 130: 141–152 [DOI] [PMC free article] [PubMed] [Google Scholar]
- Gupta S, Stamatoyannopoulos JA, Bailey TL, Noble WS 2007. Quantifying similarity between motifs. Genome Biol 8: R24. [DOI] [PMC free article] [PubMed] [Google Scholar]
- Hahn M, Jackle H 1996. Drosophila goosecoid participates in neural development but not in body axis formation. EMBO J 15: 3077–3084 [PMC free article] [PubMed] [Google Scholar]
- Harrison MM, Li XY, Kaplan T, Botchan MR, Eisen MB 2011. Zelda binding in the early Drosophila melanogaster embryo marks regions subsequently activated at the maternal-to-zygotic transition. PLoS Genet 7: e1002266. [DOI] [PMC free article] [PubMed] [Google Scholar]
- Hartmann B, Reichert H, Walldorf U 2001. Interaction of gap genes in the Drosophila head: tailless regulates expression of empty spiracles in early embryonic patterning and brain development. Mech Dev 109: 161–172 [DOI] [PubMed] [Google Scholar]
- Heintzman ND, Stuart RK, Hon G, Fu Y, Ching CW, Hawkins RD, Barrera LO, Van Calcar S, Qu C, Ching KA, et al. 2007. Distinct and predictive chromatin signatures of transcriptional promoters and enhancers in the human genome. Nat Genet 39: 311–318 [DOI] [PubMed] [Google Scholar]
- Hoch M, Schroder C, Seifert E, Jackle H 1990. Cis-acting control elements for Kruppel expression in the Drosophila embryo. EMBO J 9: 2587–2595 [DOI] [PMC free article] [PubMed] [Google Scholar]
- Howard KR, Struhl G 1990. Decoding positional information: regulation of the pair-rule gene hairy. Development 110: 1223–1231 [DOI] [PubMed] [Google Scholar]
- Kanodia JS, Liang HL, Kim Y, Lim B, Zhan M, Lu H, Rushlow CA, Shvartsman SY 2012. Pattern formation by graded and uniform signals in the early Drosophila embryo. Biophys J 102: 427–433 [DOI] [PMC free article] [PubMed] [Google Scholar]
- Kantorovitz MR, Kazemian M, Kinston S, Miranda-Saavedra D, Zhu Q, Robinson GE, Gottgens B, Halfon MS, Sinha S 2009. Motif-blind, genome-wide discovery of cis-regulatory modules in Drosophila and mouse. Dev Cell 17: 568–579 [DOI] [PMC free article] [PubMed] [Google Scholar]
- Kaplan T, Li XY, Sabo PJ, Thomas S, Stamatoyannopoulos JA, Biggin MD, Eisen MB 2011. Quantitative models of the mechanisms that control genome-wide patterns of transcription factor binding during early Drosophila development. PLoS Genet 7: e1001290. [DOI] [PMC free article] [PubMed] [Google Scholar]
- Kuhnlein RP, Bronner G, Taubert H, Schuh R 1997. Regulation of Drosophila spalt gene expression. Mech Dev 66: 107–118 [DOI] [PubMed] [Google Scholar]
- Kvon EZ, Stampfel G, Yanez-Cuna JO, Dickson BJ, Stark A 2012. HOT regions function as patterned developmental enhancers and have a distinct cis-regulatory signature. Genes Dev 26: 908–913 [DOI] [PMC free article] [PubMed] [Google Scholar]
- Langmead B, Salzberg SL 2012. Fast gapped-read alignment with Bowtie 2. Nat Methods 9: 357–359 [DOI] [PMC free article] [PubMed] [Google Scholar]
- La Rosee A, Hader T, Taubert H, Rivera-Pomar R, Jackle H 1997. Mechanism and Bicoid-dependent control of hairy stripe 7 expression in the posterior region of the Drosophila embryo. EMBO J 16: 4403–4411 [DOI] [PMC free article] [PubMed] [Google Scholar]
- Lee MT, Bonneau AR, Takacs CM, Bazzini AA, Divito KR, Fleming ES, Giraldez AJ 2013. Nanog, Pou5f1 and SoxB1 activate zygotic gene expression during the maternal-to-zygotic transition. Nature 503: 360–364 [DOI] [PMC free article] [PubMed] [Google Scholar]
- Leichsenring M, Maes J, Mossner R, Driever W, Onichtchouk D 2013. Pou5f1 transcription factor controls zygotic gene activation in vertebrates. Science 341: 1005–1009 [DOI] [PubMed] [Google Scholar]
- Li XY, MacArthur S, Bourgon R, Nix D, Pollard DA, Iyer VN, Hechmer A, Simirenko L, Stapleton M, Luengo Hendriks CL, et al. 2008. Transcription factors bind thousands of active and inactive regions in the Drosophila blastoderm. PLoS Biol 6: e27. [DOI] [PMC free article] [PubMed] [Google Scholar]
- Li XY, Thomas S, Sabo PJ, Eisen MB, Stamatoyannopoulos JA, Biggin MD 2011. The role of chromatin accessibility in directing the widespread, overlapping patterns of Drosophila transcription factor binding. Genome Biol 12: R34. [DOI] [PMC free article] [PubMed] [Google Scholar]
- Liang HL, Nien CY, Liu HY, Metzstein MM, Kirov N, Rushlow C 2008. The zinc-finger protein Zelda is a key activator of the early zygotic genome in Drosophila. Nature 456: 400–403 [DOI] [PMC free article] [PubMed] [Google Scholar]
- Liberman LM, Stathopoulos A 2009. Design flexibility in cis-regulatory control of gene expression: synthetic and comparative evidence. Dev Biol 327: 578–589 [DOI] [PMC free article] [PubMed] [Google Scholar]
- Lifanov AP, Makeev VJ, Nazina AG, Papatsenko DA 2003. Homotypic regulatory clusters in Drosophila. Genome Res 13: 579–588 [DOI] [PMC free article] [PubMed] [Google Scholar]
- Lin S, Riggs AD 1975. A comparison of lac repressor binding to operator and to nonoperator DNA. Biochem Biophys Res Commun 62: 704–710 [DOI] [PubMed] [Google Scholar]
- Little S, Tkacik G, Kneeland T, Wieschaus E, Gregor T 2011. The Formation of the Bicoid morphogen gradient requires protein movement from anteriorly localized mRNA. PLoS Biol 9: e1000596. [DOI] [PMC free article] [PubMed] [Google Scholar]
- Liu T, Ortiz JA, Taing L, Meyer CA, Lee B, Zhang Y, Shin H, Wong SS, Ma J, Lei Y, et al. 2011. Cistrome: an integrative platform for transcriptional regulation studies. Genome Biol 12: R83. [DOI] [PMC free article] [PubMed] [Google Scholar]
- Liu F, Morrison AH, Gregor T 2013. Dynamic interpretation of maternal inputs by the Drosophila segmentation gene network. Proc Natl Acad Sci 110: 6724–6729 [DOI] [PMC free article] [PubMed] [Google Scholar]
- Lohr U, Chung HR, Beller M, Jackle H 2009. Antagonistic action of Bicoid and the repressor Capicua determines the spatial limits of Drosophila head gene expression domains. Proc Natl Acad Sci 106: 21695–21700 [DOI] [PMC free article] [PubMed] [Google Scholar]
- MacArthur S, Li XY, Li J, Brown JB, Chu HC, Zeng L, Grondona BP, Hechmer A, Simirenko L, Keranen SV, et al. 2009. Developmental roles of 21 Drosophila transcription factors are determined by quantitative differences in binding to an overlapping set of thousands of genomic regions. Genome Biol 10: R80. [DOI] [PMC free article] [PubMed] [Google Scholar]
- modEncode Consortium, Roy S, Ernst J, Kharchenko PV, Kheradpour P, Negre N, Eaton ML, Landolin JM, Bristow CA, Ma L et al. 2010. Identification of functional elements and regulatory circuits by Drosophila modENCODE. Science 330: 1787–1797 [DOI] [PMC free article] [PubMed] [Google Scholar]
- Nien CY, Liang HL, Butcher S, Sun Y, Fu S, Gocha T, Kirov N, Manak JR, Rushlow C 2011. Temporal coordination of gene networks by Zelda in the early Drosophila embryo. PLoS Genet 7: e1002339. [DOI] [PMC free article] [PubMed] [Google Scholar]
- Noyes MB, Christensen RG, Wakabayashi A, Stormo GD, Brodsky MH, Wolfe SA 2008. Analysis of homeodomain specificities allows the family-wide prediction of preferred recognition sites. Cell 133: 1277–1289 [DOI] [PMC free article] [PubMed] [Google Scholar]
- Ochoa-Espinosa A, Yucel G, Kaplan L, Pare A, Pura N, Oberstein A, Papatsenko D, Small S 2005. The role of binding site cluster strength in Bicoid-dependent patterning in Drosophila. Proc Natl Acad Sci 102: 4960–4965 [DOI] [PMC free article] [PubMed] [Google Scholar]
- Ochoa-Espinosa A, Yu D, Tsirigos A, Struffi P, Small S 2009. Anterior–posterior positional information in the absence of a strong Bicoid gradient. Proc Natl Acad Sci 106: 3823–3828 [DOI] [PMC free article] [PubMed] [Google Scholar]
- Phair RD, Scaffidi P, Elbi C, Vecerova J, Dey A, Ozato K, Brown DT, Hager G, Bustin M, Misteli T 2004. Global nature of dynamic protein-chromatin interactions in vivo: three-dimensional genome scanning and dynamic interaction networks of chromatin proteins. Mol Cell Biol 24: 6393–6402 [DOI] [PMC free article] [PubMed] [Google Scholar]
- Porcher A, Abu-Arish A, Huart S, Roelens B, Fradin C, Dostatni N 2010. The time to measure positional information: maternal hunchback is required for the synchrony of the Bicoid transcriptional response at the onset of zygotic transcription. Development 137: 2795–2804 [DOI] [PubMed] [Google Scholar]
- Riddihough G, Ish-Horowicz D 1991. Individual stripe regulatory elements in the Drosophila hairy promoter respond to maternal, gap, and pair-rule genes. Genes Dev 5: 840–854 [DOI] [PubMed] [Google Scholar]
- Robin S, Schbath S, Vandewalle V 2007. Statistical tests to compare motif count exceptionalities. BMC Bioinformatics 8: 84. [DOI] [PMC free article] [PubMed] [Google Scholar]
- Ross-Innes CS, Stark R, Teschendorff AE, Holmes KA, Ali HR, Dunning MJ, Brown GD, Gojis O, Ellis IO, Green AR, et al. 2012. Differential oestrogen receptor binding is associated with clinical outcome in breast cancer. Nature 481: 389–393 [DOI] [PMC free article] [PubMed] [Google Scholar]
- Rushlow CA, Shvartsman SY 2012. Temporal dynamics, spatial range, and transcriptional interpretation of the Dorsal morphogen gradient. Curr Opin Genet Dev 22: 542–546 [DOI] [PubMed] [Google Scholar]
- Satija R, Bradley RK 2012. The TAGteam motif facilitates binding of 21 sequence-specific transcription factors in the Drosophila embryo. Genome Res 22: 656–665 [DOI] [PMC free article] [PubMed] [Google Scholar]
- Schroeder MD, Pearce M, Fak J, Fan H, Unnerstall U, Emberly E, Rajewsky N, Siggia ED, Gaul U 2004. Transcriptional control in the segmentation gene network of Drosophila. PLoS Biol 2: E271. [DOI] [PMC free article] [PubMed] [Google Scholar]
- Segal E, Raveh-Sadka T, Schroeder M, Unnerstall U, Gaul U 2008. Predicting expression patterns from regulatory sequence in Drosophila segmentation. Nature 451: 535–540 [DOI] [PubMed] [Google Scholar]
- Simpson-Brose M, Treisman J, Desplan C 1994. Synergy between the hunchback and bicoid morphogens is required for anterior patterning in Drosophila. Cell 78: 855–865 [DOI] [PubMed] [Google Scholar]
- Small S 2000. In vivo analysis of lacZ fusion genes in transgenic Drosophila melanogaster. Methods Enzymol 326: 146–159 [DOI] [PubMed] [Google Scholar]
- Small S, Blair A, Levine M 1992. Regulation of even-skipped stripe 2 in the Drosophila embryo. EMBO J 11: 4047–4057 [DOI] [PMC free article] [PubMed] [Google Scholar]
- Soufi A, Donahue G, Zaret KS 2012. Facilitators and impediments of the pluripotency reprogramming factors' initial engagement with the genome. Cell 151: 994–1004 [DOI] [PMC free article] [PubMed] [Google Scholar]
- Staudt N, Fellert S, Chung HR, Jackle H, Vorbruggen G 2006. Mutations of the Drosophila zinc finger-encoding gene vielfaltig impair mitotic cell divisions and cause improper chromosome segregation. Mol Biol Cell 17: 2356–2365 [DOI] [PMC free article] [PubMed] [Google Scholar]
- Struffi P, Corado M, Kaplan L, Yu D, Rushlow C, Small S 2011. Combinatorial activation and concentration-dependent repression of the Drosophila even skipped stripe 3+7 enhancer. Development 138: 4291–4299 [DOI] [PMC free article] [PubMed] [Google Scholar]
- Struhl G, Struhl K, Macdonald PM 1989. The gradient morphogen bicoid is a concentration-dependent transcriptional activator. Cell 57: 1259–1273 [DOI] [PubMed] [Google Scholar]
- Swanson CI, Schwimmer DB, Barolo S 2011. Rapid evolutionary rewiring of a structurally constrained eye enhancer. Curr Biol 21: 1186–1196 [DOI] [PMC free article] [PubMed] [Google Scholar]
- ten Bosch JR, Benavides JA, Cline TW 2006. The TAGteam DNA motif controls the timing of Drosophila pre-blastoderm transcription. Development 133: 1967–1977 [DOI] [PubMed] [Google Scholar]
- Theodorou V, Stark R, Menon S, Carroll JS 2013. GATA3 acts upstream of FOXA1 in mediating ESR1 binding by shaping enhancer accessibility. Genome Res 23: 12–22 [DOI] [PMC free article] [PubMed] [Google Scholar]
- Thomas S, Li XY, Sabo PJ, Sandstrom R, Thurman RE, Canfield TK, Giste E, Fisher W, Hammonds A, Celniker SE, et al. 2011. Dynamic reprogramming of chromatin accessibility during Drosophila embryo development. Genome Biol 12: R43. [DOI] [PMC free article] [PubMed] [Google Scholar]
- Treisman J, Gonczy P, Vashishtha M, Harris E, Desplan C 1989. A single amino acid can determine the DNA binding specificity of homeodomain proteins. Cell 59: 553–562 [DOI] [PubMed] [Google Scholar]
- Updike DL, Mango SE 2006. Temporal regulation of foregut development by HTZ-1/H2A.Z and PHA-4/FoxA. PLoS Genet 2: e161. [DOI] [PMC free article] [PubMed] [Google Scholar]
- Visel A, Blow MJ, Li Z, Zhang T, Akiyama JA, Holt A, Plajzer-Frick I, Shoukry M, Wright C, Chen F, et al. 2009. ChIP-seq accurately predicts tissue-specific activity of enhancers. Nature 457: 854–858 [DOI] [PMC free article] [PubMed] [Google Scholar]
- Walter J, Dever CA, Biggin MD 1994. Two homeo domain proteins bind with similar specificity to a wide range of DNA sites in Drosophila embryos. Genes Dev 8: 1678–1692 [DOI] [PubMed] [Google Scholar]
- Wimmer EA, Simpson-Brose M, Cohen SM, Desplan C, Jackle H 1995. Trans- and cis-acting requirements for blastodermal expression of the head gap gene buttonhead. Mech Dev 53: 235–245 [DOI] [PubMed] [Google Scholar]
- Yanez-Cuna JO, Dinh HQ, Kvon EZ, Shlyueva D, Stark A 2012. Uncovering cis-regulatory sequence requirements for context-specific transcription factor binding. Genome Res 22: 2018–2030 [DOI] [PMC free article] [PubMed] [Google Scholar]
- Zaret KS, Carroll JS 2011. Pioneer transcription factors: establishing competence for gene expression. Genes Dev 25: 2227–2241 [DOI] [PMC free article] [PubMed] [Google Scholar]
- Zeitlinger J, Zinzen RP, Stark A, Kellis M, Zhang H, Young RA, Levine M 2007. Whole-genome ChIP–chip analysis of Dorsal, Twist, and Snail suggests integration of diverse patterning processes in the Drosophila embryo. Genes Dev 21: 385–390 [DOI] [PMC free article] [PubMed] [Google Scholar]
- Zhang Y, Liu T, Meyer CA, Eeckhoute J, Johnson DS, Bernstein BE, Nusbaum C, Myers RM, Brown M, Li W, et al. 2008. Model-based analysis of ChIP-seq (MACS). Genome Biol 9: R137. [DOI] [PMC free article] [PubMed] [Google Scholar]
- Zhu Y, Sun L, Chen Z, Whitaker JW, Wang T, Wang W 2013. Predicting enhancer transcription and activity from chromatin modifications. Nucleic Acids Res 41: 10032–10043 [DOI] [PMC free article] [PubMed] [Google Scholar]
- Zinzen RP, Senger K, Levine M, Papatsenko D 2006. Computational models for neurogenic gene expression in the Drosophila embryo. Curr Biol 16: 1358–1365 [DOI] [PubMed] [Google Scholar]