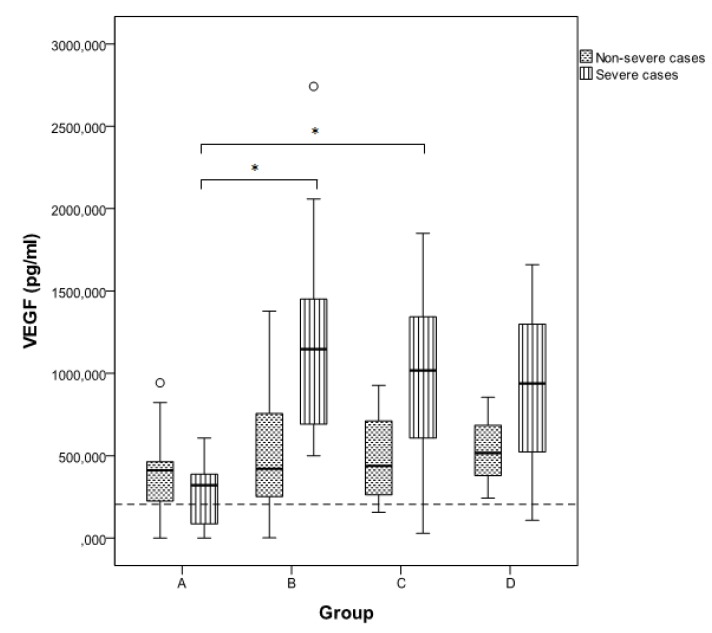
Figure 1.
Comparison of VEGF levels between severe and non-severe cases in groups A–D. Data are given as median (thick line), 25th–75th percentile (box) and range (whiskers). Significant differences between groups (p < 0.05) are shown with an asterisk. Group E is not shown, as only one sample was available from non-severe cases. The dotted line is set to 204.03 pg/mL and represents the mean VEGF value of the control group.

