

Abstract
Background: The purpose was to design and characterize inhalable microparticulate/nanoparticulate dry powders of mannitol with essential particle properties for targeted dry powder delivery for cystic fibrosis mucolytic treatment by dilute organic solution spray drying, and, in addition, to tailor and correlate aerosol dispersion performance delivered as dry powder inhalers based on spray-drying conditions and solid-state physicochemical properties.
Methods: Organic solution advanced spray drying from dilute solution followed by comprehensive solid-state physicochemical characterization and in vitro dry powder aerosolization were used.
Results: The particle size distribution of the spray-dried (SD) powders was narrow, unimodal, and in the range of ∼500 nm to 2.0 μm. The particles possessed spherical particle morphology, relatively smooth surface morphology, low water content and vapor sorption (crystallization occurred at exposure above 65% relative humidity), and retention of crystallinity by polymorphic interconversion. The emitted dose, fine particle fraction (FPF), and respirable fraction (RF) were all relatively high. The mass median aerodynamic diameters were below 4 μm for all SD mannitol aerosols.
Conclusion: The in vitro aerosol deposition stage patterns could be tailored based on spray-drying pump rate. Positive linear correlation was observed between both FPF and RF values with spray-drying pump rates. The interplay between various spray-drying conditions, particle physicochemical properties, and aerosol dispersion performance was observed and examined, which enabled tailoring and modeling of high aerosol deposition patterns.
Key words: : cystic fibrosis, aerosol performance modeling, osmotic agent, respiratory, lung, confocal Raman chemical imaging, DPI, particle engineering design, solid-state
Introduction
Cystic fibrosis (CF) is the most common life-shortening, chronic hereditary disease among the Caucasian population, affecting approximately 60,000 individuals worldwide.(1) CF leads to accumulation of thick and sticky mucus that affects the lungs. This lung disease is characterized by a cycle of bacterial infection and lung damage, causing death at early ages for CF patients.(2) Pulmonary delivery of a therapeutic dose to the local lung has tremendous advantages over other administration routes.(3) Pulmonary drug delivery systems include nebulizers, pressurized metered-dose inhalers, soft-mist inhalers, and dry powder inhalers (DPIs). Within each class, further differentiation is based on metering, means of dispersion, or design. DPIs have unique advantages, including high dose delivery, higher chemical stability relative to the liquid state, and the potential to tailor particle properties in the solid state. The performance of DPI formulations is influenced by several particle properties, including size, size distribution, morphology, and particle surface properties (i.e., surface morphology and interparticulate forces including van der Waals, electrostatic, and capillary forces), as described in detail by the authors.(3–11)
There are several methods available to make respirable particles, including micronization, precipitation, freeze drying, and spray drying.(3,4,12) Spray drying is a high-throughput process with the ability to produce particles in a more controlled manner, such as directing particle size and size distribution, and particle morphology, which are important particle features for pulmonary dry powder drug delivery by inhalation. As the chronic lung infection of CF resides in the lower respiratory tract and small peripheral airways(13) where disease progression starts,(14,15) the microparticulate and nanoparticulate aerosols (∼0.5–2 μm in diameter)(16–18) have particle deposition(3) by sedimentation and diffusion(19) mechanisms,(20) respectively.
The advantages of particle engineering by spray drying for the design of DPI formulations are related to the optimization of important particle properties such as surface morphology, particle morphology, particle size, and size distribution by controlling and tailoring spray-drying parameters such as feeding solution conditions (i.e., solvent type, concentration, and feeding rate) and dry gas conditions (i.e., gas type, inlet and outlet temperatures, and flow rate).(4,12,21) Organic solution advanced spray drying in closed-mode for pulmonary applications as DPIs has been reported in our previous studies.(22–25) The essential particle properties for targeted delivery to smaller airways and deep lung region include microparticulate/nanoparticulate size range with relatively narrow unimodal sizing distribution (enhance dosing reproducibility), spherical particle morphology with relatively smooth surface morphology (reduce mechanical interlocking, van der Waals, and electrostatic forces), and low water content (lower capillary condensation).(8,26)
D-Mannitol is a nonreducing sugar alcohol that is used as an osmotic agent.(27) D-Mannitol has also been used as a sugar carrier in carrier-based dry powder for inhalation.(28) Dry powder mannitol, when inhaled, creates an osmotic gradient that facilitates an efflux of water into the airway lumen by which it increases the water content in the airway surface liquid and promotes the clearance of mucus by ciliary movement and cough action. The detailed mechanisms are described in the literature.(29–34) A DPI formulation of mannitol as a marketed pharmaceutical product (Bronchitol™) is approved in Europe and has been very recently approved in the United States. The polymorphic system of D-mannitol has been well documented.(35,36)
In this comprehensive and systematic study, the organic solution closed-mode advanced spray-drying technique was employed using organic solvent (i.e., an alcohol) to minimize the residual water content and to reduce the primary particle size in the solid state. In addition, inhalable mannitol aerosol powders were designed and optimized to target the lung regions where excess viscous mucus is present in CF lungs. In this study, the interplay between spray-drying conditions, mannitol polymorphic interconversion behavior, physicochemical properties in the solid state, and their influence on in vitro aerosol dispersion performance deposition patterns as high performing microparticulate/nanoparticulate DPIs are reported for the first time.
Materials and Methods
Materials
Raw D-mannitol (C6H14O6; MW 182.17 g/mol) was from Sigma-Aldrich (St. Louis, MO). Methanol [high-performance liquid chromatography (HPLC) grade, ACS-certified grade, purity 99.9%] and chloroform (HPLC grade, ACS-certified grade, purity 99.9%) were obtained from Fisher Scientific (Fair Lawn, NJ). HYDRANAL-Coulomat AD was from Sigma-Aldrich. AQUA STAR methanol was from EMD Chemical Inc. (Gibbstown, NJ). Raw D-mannitol was used as received and stored under room conditions. Ultra-high purity (UHP) nitrogen gas (Scotts Gross, Lexington, KY) was used for all experiments.
Preparation of spray-dried (SD) particles by organic solution advanced spray drying (no water) in closed-mode
Organic solution advanced spray-drying process in the absence of water using dilute drug solutions was performed in closed-mode using a Büchi B-290 Mini Spray Dryer with a high-performance cyclone in closed-mode and UHP dry nitrogen gas as the atomizing drying gas, and connected to the B-295 Inert Loop (Büchi Labortechnik AG, Flawil, Switzerland). The feeding solution was prepared by dissolving mannitol in methanol to make a dilute drug solution with a concentration of 0.1% w/v. The following optimized conditions, as reported in our previous studies,(22–25) were used during spray drying: atomization rate, 600 L/hr; aspirate rate, 35 m3/hr; pump rate (%): 3 mL/min (10%) (low pump rate), 15 mL/min (50%) (medium pump rate), and 30 mL/min (100%) (high pump rate). The inlet temperature was set at 150°C. The corresponding outlet temperatures for each SD mannitol formulations are summarized in Table 1. The stainless steel nozzle diameter was 0.7 mm. SD mannitol particles were separated from the nitrogen drying air in a cyclone and collected in a sample collection vial. All SD powders were carefully stored in sealed glass vials that were stored in sealed glass desiccators over Indicating Drierite/Drierite™ desiccant at −20°C under ambient pressure.
Table 1.
Summary of Organic Solution Advanced Spray Drying in Closed-Mode Conditions
| Chemical agent | Pump rate (%) | Inlet temperature (°C) | Outlet temperature (°C) |
|---|---|---|---|
| Mannitol | 10 | 150 | 82 |
| 50 | 150 | 58 | |
| 100 | 150 | 38 |
Scanning electron microscopy (SEM)
Using conditions previously reported,(22–25) visual imaging and analysis of particle size, morphology, and surface morphology were achieved by SEM using a Hitachi S-800 microscope (Hitachi, Tokyo, Japan). Samples were placed on double-sided adhesive carbon tabs (Ted Pella, Inc., Redding, CA) that/which were adhered to aluminum stubs (Ted Pella, Inc.) and were coated with gold/palladium alloy thin film using a Hummer VI sputtering system from Technics. The coating process operated at 10 mA in AC with 8 kV of voltage for 3 min. The electron beam with an accelerating voltage of 20 kV was used at a working distance of 30 mm. SEM images were captured by Evex NanoAnalysis (Evex Analytic Inc., Princeton, NJ). Several magnification levels were used.
Laser light diffraction particle sizing and size distribution
Using conditions previously reported,(22–25) the mean size and size distribution of SD mannitol particles in chloroform suspension were determined by ultraviolet laser diffraction of nanoparticle size analyzer SALD-7101 (Shimadzu Scientific Instruments, Kyoto, Japan). Samples were dispersed in chloroform and ultrasonicated for 10 seconds in a water bath ultrasonicater Branson 5210 (Branson Ultrasonics Corp., Danbury, CT) before particle size was measured. Sample particle dispersion was immediately transferred to a particle size measuring cell and kept stirring during measuring in a nanoparticle size analyzer. The low refractive index 1.60–0.10 was used. A volume-based dimension of particle amount distribution was obtained for samples. DV10, DV50, and DV90 were used as particle size characterization parameters. The Span value was calculated using the equation defined as [(DV90 – DV10)/DV50]. All experiments were done in triplicate (n=3).
X-ray powder diffraction (XRPD)
Using conditions previously reported,(22–25) XRPD patterns of mannitol samples were collected with a Rigaku X-ray diffractometer (Rigaku, Tokyo, Japan) with Cu Kα radiation (40 kV, 44 mA, and λ=1.5406 Å) between 5.0° and 60.0° (2θ) with a scan rate of 2.00°/min at ambient temperature. The sample was placed on a quartz plate in an aluminum sample holder without further grinding.
Differential scanning calorimetry (DSC)
Using conditions previously reported,(22–25) thermal properties of mannitol samples were measured using a TA Q200 DSC (TA Instruments, New Castle, DE) equipped with T-Zero® technology and an automated computer-controlled RSC-90 cooling accessory. Approximately 2 mg of sample was packed into hermetic anodized aluminum T-Zero DSC pans, which were then hermetically sealed with the T-Zero hermetic sealer (TA Instruments). An empty hermetically sealed aluminum pan was used as the reference pan. UHP nitrogen was used as a purging gas at a rate of 50 mL/min. The sample was heated from 10°C to 200°C at a scanning rate of 5.00°C/min. All experiments were done in triplicate (n=3).
Hot-stage microscopy (HSM) under cross-polarizers
Using conditions previously reported,(22–25) HSM studies were performed under an OLYMPUS BX51 polarized microscope (Olympus, Tokyo, Japan) equipped with an INSTEC STC200 heat unit and an INSTEC HCS302 hot stage (Boulder, CO). The polarized light was filtered by γ 530 nm U-TP530 (Olympus). Mannitol samples were mounted on cover glass and heated from 25°C (room temperature) to 200°C at a heating rate of 5.00°C/min. The heating program was controlled by WinTemp software. Pictures of the samples were captured by a SPOT insight digital camera (Diagnostic Instruments, Inc.).
Karl Fischer (KF) coulometric titration
Using conditions previously reported,(22–25) the water content of mannitol powders was assessed by KF coulometric titration. The measurements were performed with a 737 KF Coulometer coupled with 703 Ti Stand (Metrohm Ltd., Antwerp, Belgium). Around 6–7 mg of sample was dissolved in AQUA STAR methanol with a 5-mL volumetric. The sample solution was injected into a reaction cell filled with HYDRANAL KF reagent. The water content of sample was obtained by simple calculation. All experiments were done in triplicate (n=3).
Gravimetric vapor sorption (GVS)
Using conditions previously reported,(22,23,25,37) water vapor sorption isotherms were measured gravimetrically using an automated microelectronic balance coupled to a computerized VTI SGA-CX symmetric vapor sorption analyzer (Hialeah, Florida). All measurements were taken at 25°C using a sample size of 1.0–1.5 mg. Samples were subjected to drying treatment at 25°C under 0% relative humidity (RH; nitrogen gas purging) for up to a maximum of 7 hr with equilibrium criterion of weight change less than or equal to 0.0001% in a 10-min interval. At the end of the drying cycle, the samples were exposed to a sequence of increasing RH with an increment of 5% RH on each step, which started at 5% RH until 95% RH. The criterion used to establish equilibrium during adsorption was a weight change of less than or equal to 0.03% in a 10-min interval for up to 3 hr. The data point was acquired every 2 min or 0.01% weight change. The standby temperature was set as 25°C.
Confocal Raman microscopy (CRM) and spectroscopy for chemical imaging and mapping
CRM has demonstrated utility in the noninvasive and nondestructive microspectroscopic analysis of DPI aerosol formulations, as described in detail by the authors.(38,39) Using conditions previously reported,(24,39) dispersive Raman spectra and mapping images of mannitol samples were obtained using an Aramis confocal Raman spectrometer and fluorescence microscope system (Horiba Jobin Yvon, Edison, NJ). The system is equipped with an Olympus BX41 confocal optical microscope and an Olympus U-LH 100-W Hg lamp and U-RFL-T power source used for fluorescence excitation and bright-field illumination (Olympus America, Inc., Chester Valley, PA). Raman spectra were obtained using both a 785-nm diode laser and a 633-nm HeNe laser. Raman spectral maps were obtained using a 10× objective with the stage moved in increments of 5 to 10 μm. Each map point was acquired using 32 to 128 accumulations each with 2 sec of detector exposure time. A confocal hole of 500 μm, a grating of 600–900 grooves/mm, and a slit width of 100 μm were used. Spectra were subjected to baseline correction and smoothing prior to further analysis.
Fourier-transform Raman (FT-Raman) experiments were performed using a Nicolet FT-Raman 960 spectrometer equipped with InGaAs and Ge detectors (ThermoFisher Scientific, Madison, WI). Samples were analyzed using a 180° collector or a horizontal video-controlled stage with a 50-μm spot size, and 32 to 1,024 co-added scans were collected at 4-cm–1 resolution. A 1.064-μm laser was used with a power setting of 0.6 W.
Attenuated total reflectance-Fourier transform infrared spectroscopy (ATR-FTIR)
A Varian FTS-7000e FTIR spectrometer (Varian Inc., Palo Alto, CA) equipped with a DTGS detector and a PIKE MIRacle ATR ZnSe accessory was used for all experiments. Each spectrum was collected for 32 scans at a spectral resolution of 8 cm–1 over the wavelength number range of 4,000–700 cm–1. A background spectrum was done under the same experimental conditions and was subtracted from each sample spectrum. Spectral data were acquired with Varian Resolutions Pro software.
In vitro aerosol dispersion performance by the Next Generation Impactor (NGI)
In accordance with United States Pharmacopeia (USP) Chapter <601> specifications on aerosols(40) and using conditions previously reported,(22,24) the aerosol dispersion performance of SD mannitol powders was conducted using the Next Generation Impactor® (NGI; MSP Corporation, Shoreview, MN) with a stainless steel induction port (i.e., USP throat) attachment (NGI Model 170; MSP Corporation), equipped with specialized stainless steel NGI gravimetric insert cups (MSP Corporation) and HandiHaler® (a high shear stress DPI device; Boehringer Ingelheim, Ingelheim, Germany) inhaler device. The airflow rate (Q) of 60 L/min (adult airflow rate) was adjusted and measured before each experiment by a Copley DFM 2000 flow meter (Copley Scientific, Nottingham, UK). The NGI was coupled with a Copley HCP5 vacuum pump (Copley Scientific) and a Copley TPK 2000 critical flow controller (Copley Scientific). The aerosolization was experimentally designed by Design Expert 8.0.7.1 software (Stat-Ease Corp., Minneapolis, MN). The mass of powder deposited on each stage was quantified by a gravimetric method using type A/E glass fiber filters with diameter 55 mm (PALL Corporation, Port Washington, NY). Each clear HP size-3 capsule (Quali-V®; Qualicaps, Madrid, Spain) contained about 10 mg of powder. Three capsules were used in each experiment. In vitro aerosolization was evaluated in triplicate under ambient conditions.
For the NGI Q=60 L/min, the Da50 aerodynamic cutoff diameter for each NGI stage was calibrated by the manufacturer and stated as follows: stage 1, 8.06 μm; stage 2, 4.46 μm; stage 3, 2.82 μm; stage 4, 1.66 μm; stage 5, 0.94 μm; stage 6, 0.55 μm; and stage 7, 0.34 μm. The emitted dose (ED) was determined as the difference between the initial mass of powder loaded in the capsules and the remaining mass of powder in the capsules following aerosolization. The ED (%) (Equation 1) was used to express the percentage of ED based on the total dose (TD) used. The fine particle dose (FPD) was defined as the dose deposited on stages 2 through 7. The fine particle fraction (FPF %) (Equation 2) was expressed as the percentage of FPD to ED. The respirable fraction (RF %) (Equation 3) was used as the percentage of FPD to total deposited dose (DD) on all impactor stages.
 |
 |
 |
In addition, the mass median aerodynamic diameter (MMAD) of aerosol particles and geometric standard deviation (GSD) were calculated by using a mathematic program written by Dr. Warren Finlay.(41) All experiments were done in triplicate (n=3).
Data and statistical analyses
All experiments were performed in at least triplicate (n=3). The results were analyzed statistically using Microsoft Office Excel 2007 (Microsoft Corp., Redmond, WA). The results are expressed as means±standard deviation. The aerosolization studies were experimentally designed using design of experiments by Design Expert™ 8.0.7.1 software (Stat-Ease Corp.). The level of statistical significance (p) was determined at p<0.05.
Results
SEM
Three different batches of SD mannitol particles were successfully produced by using low (10%), medium (50%), and high (100%) pump rates from dilute organic solution advanced spray drying. The detailed spray-drying conditions were introduced in Materials and Methods and Table 1. The particle morphology and surface structure of the mannitol samples were visualized via SEM in Figure 1. The particle shape of raw D-mannitol (Fig. 1a) was irregular. The particle size of raw D-mannitol was far beyond the respiratory size for dry powder inhalation, which is less than 10 μm. Generally, smooth and spherical mannitol particles (Fig. 1b–d) were produced at each spray-drying condition. However, as the pump rate increased from 10% (low) to 100% (high), the surface of SD mannitol particles became slightly rougher. In addition, both nanoparticles and microparticles of SD mannitol (linear geometry) were produced by spray drying under optimized conditions.
FIG. 1.
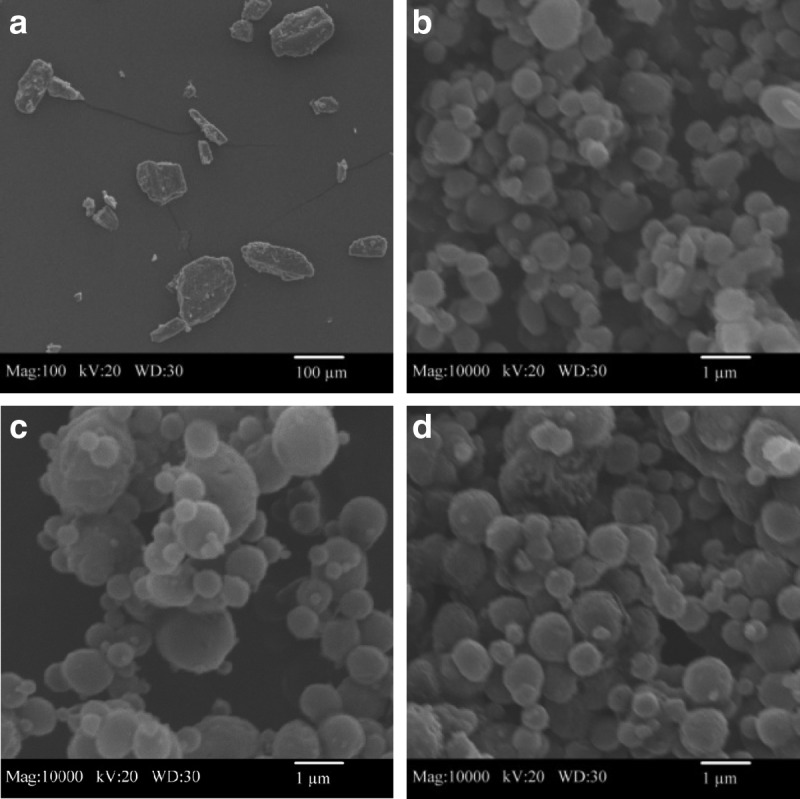
SEM micrographs of raw (magnification 100×) and SD mannitol particles (magnification 10,000×) for: (a) raw D-mannitol; (b) SD mannitol (10% pump rate); (c) SD mannitol (50% pump rate); and (d) SD mannitol (100% pump rate).
Laser light diffraction particle sizing and size distribution
The laser sizing data of SD mannitol particles are summarized in Table 2. The particle size distributions of SD mannitol were all in unimodal distribution by laser light diffraction. The median volumetric diameter (DV50) increased from 0.486 μm to 0.702 μm for SD mannitol as the spray-drying pump rate increased from 10% (low) to 100% (high). The DV90 was in the range of 1.147–1.302 μm for SD mannitol particles. Therefore, the majority of SD mannitol particles were in the nanoparticulate size range in the solid-state range. The Span value for SD mannitol was between 1 and 2.
Table 2.
Laser Sizing of SD Mannitol Particles
| Particles | Pump rate (%) | DV10 (μm) | DV50 (μm) | DV90 (μm) | Span value |
|---|---|---|---|---|---|
| Mannitol | 10 | 0.346±0.002 | 0.486±0.006 | 1.147±0.205 | 1.646±0.398 |
| 50 | 0.354±0.003 | 0.521±0.016 | 1.302±0.101 | 1.819±0.145 | |
| 100 | 0.482±0.132 | 0.702±0.141 | 1.247±0.016 | 1.156±0.498 |
Data are presented as means±SD (n=3).
XRPD
XRPD patterns (Fig. 2) of raw D-mannitol showed sharp and intensive peaks indicating the existence of long-range molecular order. SD mannitol samples showed that the peaks remained after the spray-drying process. The XRPD data reflected that raw D-mannitol and SD mannitol samples were in the crystalline phase. However, the peak positions and intensity varied with samples.
FIG. 2.

XRPD patterns for raw and SD mannitol particles.
DSC
The thermograms obtained from mannitol samples are shown in Figure 3, and detailed values of melting peak enthalpy and temperature are tabulated in Table 3. It is seen that raw D-mannitol had one sharp endotherm with peak temperature at ∼166.4°C and enthalpy of 303.4 J/g in Figure 3a. Interestingly, the endothermic temperature and enthalpy of SD mannitol samples decreased from ∼165.3°C, 164.7°C, and 164.3°C and ∼304.2 J/g, 288.7 J/g, and 282.4 J/g as the spray-drying pump rates increased from 10% (low) to 100% (high), respectively.
FIG. 3.

Representative DSC thermograms of raw and SD mannitol particles for: (a) raw D-mannitol; (b) SD mannitol (10% pump rate; (c) SD mannitol (50% pump rate); and (d) SD mannitol (100% pump rate) (n=3).
Table 3.
DSC Thermal Analysis of Raw And SD Mannitol Particles
| Melting point (°C) | |||
|---|---|---|---|
| Samples | Enthalpy (J/g) | Onset | Peak |
| Raw | 303.40±2.21 | 165.04±0.03 | 166.41±0.19 |
| SD (10% pump rate) | 304.23±9.06 | 163.69±0.03 | 165.34±0.04 |
| SD (50% pump rate) | 288.67±10.47 | 162.66±0.04 | 164.68±0.06 |
| SD (100% pump rate) | 282.43±4.45 | 161.40±0.45 | 164.29±0.14 |
Data are presented as means±SD (n=3).
HSM under cross-polarizers
Raw and SD mannitol [50% (medium) pump rate as a representative sample] powders were visualized under cross-polarized light microscopy as a function of increasing temperature for the presence/absence of birefringency. There were no obvious differences at room temperature (25°C) and physiologic temperature (37°C) in terms of morphology or shape for both samples in Figure 4. The raw D-mannitol crystal was highly crystalline as seen from HSM pictures in Figure 4a. The evident phase transition (thermodynamic melting process) of D-mannitol initialized from 181°C with subtle change in birefringency and finished at 182°C, which was in a relatively narrow temperature range. The SD mannitol had phase transition of melting at a slightly lower temperature (178°C) than the raw D-mannitol. As with raw D-mannitol, the melting temperature range for SD mannitol was narrow as well.
FIG. 4.

Representative HSM micrographs of raw and SD mannitol particles for: (a) raw D-mannitol; and (b) SD mannitol (50% pump rate).
KF coulometric titration
The residual water content in the powders is summarized in Table 4. It is noted that the water content of raw D-mannitol had a lower value (∼0.53% w/w) than its SD samples. The water content for SD mannitol increased with spray-drying pump rates from low to high and was higher than that of raw D-mannitol. However, the water content values were all below 2% (i.e., very low), which is significantly important for chemical and formulation stability. The low water content value ruled out the possibility of hemihydrates of mannitol.(42)
Table 4.
Water Content of Raw And SD Mannitol Particles
| Samples | Water content (% w/w) |
|---|---|
| Raw | 0.53±0.26 |
| SD (10% pump rate) | 1.16±0.04 |
| SD (50% pump rate) | 1.69±0.08 |
| SD (100% pump rate) | 1.96±0.32 |
Data are presented as means±SD (n=3).
GVS
The dynamic water vapor sorption profiles are plotted in Figure 5 for raw D-mannitol and SD mannitol [50% (medium) pump rate as a representative sample]. Overall, the mass of raw mannitol almost did not change across the whole RH range from 0% to 95% RH levels. The SD mannitol followed the same behavior upon RH increments except for the small increase at the 95% RH point. This is in agreement with the fact that mannitol is the least hygroscopic of polyols and does not start to absorb moisture until the RH is over 90%.(43) However, there was a small weight loss observed from the RH range of 65% to 90%.
FIG. 5.

Water vapor sorption isotherms at 25°C for raw and SD mannitol (50% pump rate) particles (weight change % vs. RH).
CRM and spectroscopy for chemical imaging and mapping
Raman spectroscopy is highly sensitive to the polymorphic form of mannitol, as shown by the FT-Raman spectra of bulk samples of each phase in Figure 6a obtained using a 1.064-μm laser. The bulk samples of alpha, beta, and delta mannitol were prepared by rapid evaporation from water, slow evaporation from water, and lyophilization, respectively, and were checked by XRPD. As shown in Figure 6a, the Raman spectral region between 2,850 and 3,000 cm−1 is particularly specific for each polymorphic form. These results can be compared with the spectra obtained by CRM of a mapped region (2,910 to 2,940 cm−1) of SD mannitol from a 50% (medium) pump rate experiment, as shown in Figure 6b and c. The CRM spectra were obtained using a 633-nm laser, as mannitol shows minimal fluorescence. From examination of the map and spectra in Figure 6b and c, the material is seen to be primarily the alpha polymorph of mannitol. No indication of heterogeneity was observed in the map in Figure 6b for bands in the 2,910 to 2,940 cm−1 region associated with alpha mannitol, with the only trend observed being the result of sample topology differences. Spectra taken from three individual points in this map are compared in Figure 6c, highlighting the lack of significant differences observed and the close similarity with the reference spectrum of the alpha phase shown in Figure 6a. A similar analysis of Raman bands in the region of 860 to 900 cm−1 (data not shown), which are also selective for the D-mannitol polymorphic form, yielded the same result.
FIG. 6.

(a) FT-Raman spectra of bulk phases of mannitol; (b) CRM map of a region of flattened SD mannitol (50% pump rate) particles obtained using a 50× objective, showing Raman band intensity between 2,910 and 2,940 cm–1 as blue intensity; and (c) expanded CRM spectra of three points on the map in (b).
ATR-FTIR
Figure 7 shows the FTIR spectra of mannitol particles. Differences were mainly detected in the band range of 1,500 to 1,200 cm−1, indicating the differences of C-H deformation vibration. These are attributed to different mannitol polymorphs.(44)
FIG. 7.

ATR-FTIR spectra for raw and SD mannitol particles.
In vitro aerosol dispersion performance by the NGI
Figure 8 shows SD particle deposition profiles on each NGI stage at Q=60 L/min. As indicated in the profile, the SD mannitol powder produced from high spray-drying pump rate exhibited low particle deposition on stage 1 (Da50 cutoff diameter of 8.06 μm) and high particle deposition on stages 2–4. However, compared with the other two formulations, the particle deposition fraction was reduced for particles generated from the high pump rate on stages 5–7 that were in the aerodynamic nanometer size range. The aerosol dispersion performance parameter values are listed in Table 5. The FPF and RF for SD mannitol particles exhibited high values, while having similar ED values, as pump rates increased for spray drying. All SD mannitol powder had MMAD of less than 4 μm from HandiHaler under Q of 60 L/min. However, the GSD decreased, indicating the aerodynamic size distribution became narrower as the pump rates increased from 10% to 100%.
FIG. 8.

In vitro aerosol dispersion performance using the NGI at an airflow rate (Q) of 60 L/min with the HandiHaler DPI device for SD mannitol (n=3).
Table 5.
Aerosol Dispersion Performance Parameters of SD Mannitol Particles
| Aerosol dispersion performance parameters | |||||
|---|---|---|---|---|---|
| SD mannitolPump rate (%) | ED (%) | FPF (%) | RF (%) | MMAD (μm) | GSD |
| 10 | 85.07±2.13 | 36.02±3.70 | 60.54±5.77 | 3.16±0.47 | 2.57±0.18 |
| 50 | 83.72±2.58 | 44.18±2.77 | 65.67±1.74 | 2.76±0.09 | 2.32±0.12 |
| 100 | 82.33±10.61 | 54.84±4.84 | 80.95±6.36 | 3.49±0.36 | 1.85±0.08 |
Data are presented as means±SD (n=3).
Discussion
The present work clearly demonstrated that mannitol microparticulate/nanoparticulate aerosols can be successfully produced by advanced spray-drying dilute organic solutions. By using the advanced spray-drying technique with low concentration of organic solvent solution, the microparticulate/nanoparticulate aerosols were successfully produced with narrow particle size distribution, low water content, suitable particle shape, and morphology. The narrow particle size distribution is essentially critical for pulmonary dry powder inhalation, as it enables the aerosols to target a specific lung region without spreading the dose in the whole lungs. Targeted aerosols lower the therapeutic dose and toxic effects. Therefore, they enhance the therapeutic outcome. More importantly, microparticulate/nanoparticulate aerosols ensure particle penetration to the middle and deep lung regions of CF patients where excessive mucus locates. In addition, the particle engineering process of spray drying can optimize particle size, shape, as well as morphology, which will result in better aerosol dispersion performance given as dry powder formulations. Low water content (<6% w/w) of particles slows down the chemical degradation process via hydrolysis and decreases capillary forces between particles.
In general, the majority of SD mannitol particles were in the nanoparticulate primary size range of ∼0.5–1 μm (Table 2), which is beneficial for deep lung deposition by the diffusion (Brownian motion) mechanism, whereas particles in the size range of ∼1–2 μm would have particle deposition by sedimentation. The narrow particle size distribution with Span values in the range of 1–2 (Table 2) theoretically indicates reproducible aerosol particle aerodynamic performance, which is clinically important for therapeutic reproducibility.
As pump rates in the spray-drying process increased from 10% (low) to 100% (high), the DV50 increased from ∼0.486 μm to ∼0.702 μm for SD mannitol. The increased particle size (DV50 in Table 2), particle surface roughness (Fig. 1b–d), and water content (Table 4) of SD mannitol were attributed to the larger droplet size of solution as pump rates increased during atomization and rush-drying process given at the same primary drying temperature and period in spray drying.
From the XRPD patterns (Fig. 2), it can be seen that SD mannitol particles presented many intensive peaks in their XRPD patterns, indicating SD particles retained long-range molecular order/crystalline phase. Mannitol polymorphic behavior has been reported.(35,36) The simulated X-ray diffractograms of alpha, beta, and delta forms (stability order: beta>alpha>delta) of anhydrous mannitol are shown in Figure 9. The characteristic peaks of each polymorph in the diffractograms were symboled for identification purpose. The alpha form was identified using the peaks at 13.6° and 17.2° 2θ. The peaks at 14.6° and 23.4° 2θ were used to label the beta form. The delta form was validated using a peak at 9.7° 2θ. The XRPD patterns in Figure 2 indicated that the raw D-mannitol was in the beta polymorphic form that is the most thermodynamically stable form verified by DSC data (Fig. 3a and Table 3) and is in agreement with the literature.(45) The SD mannitol powders were a mixture of different polymorphs. As the pump rate increased, the alpha and beta polymorphic content decreased with increasing polymorphic delta form content based on intensity of the characteristic peaks of each polymorph. According to the XRPD data (Fig. 2), SD mannitol from low to high pump rates consisted of beta and alpha polymorphic forms (10% pump rate), a majority of alpha polymorph (50% pump rate), and alpha and delta (100% pump rate) polymorphs, respectively. This observed trend of polymorphic composition was also supported by DSC thermal analysis data in Table 3, because their meting peak temperature and enthalpy values descended as more metastable mannitol crystalline forms (polymorph thermodynamic stability: beta>alpha>delta) were present. In contrast, Kumon et al.(46) reported that SD mannitol was in the beta polymorph form under their spray-drying condition, which is different from the spray-drying conditions reported here. The CRM results in Figure 6 for the 50% (medium) pump rate sample indicated the presence of homogeneous alpha mannitol, supported by XRPD results showing the dominant alpha form in Figure 2. In addition, the comparison of the FTIR spectrum of SD mannitol [50% (medium) pump rate; Fig. 7] with the literature report44 suggested the existence of mainly the alpha form of mannitol.
FIG. 9.

Reference X-ray patterns of different polymorphs of mannitol obtained from the Cambridge structure database program of ConQuest 1.10 (The Cambridge Crystallographic Data Centre, Cambridge, UK). The solid star symbol indicates characteristic peaks of alpha, beta, and delta mannitol, respectively, which were used for identification in this study.
The small weight loss of raw and SD mannitol from 65% RH to 90% RH may suggest crystallization of mannitol. It is reported that the SD composited formulation of salmon calcitonin and mannitol had a weight loss at 60% RH due to the crystallization of mannitol in GVS at 25°C.(47) Upon storage, amorphous mannitol transformed to the delta polymorphic form during RH exposure at 51%, which crystallized further into the alpha polymorphic form at 69% RH.(47) A solution-mediated transformation was suggested based on their findings. The deliquescence point of the delta polymorphic form is approximately 85% RH, above which the beta polymorph may form. The stoichiometric plot of water vapor absorbed/dry compound versus RH (Fig. 10), translated from the gravimetric water vapor sorption equilibrium data (Fig. 5), provides insightful molecular information. The SD mannitol reached ∼0.5 mole/mole ratio at equilibrium of 95% RH. It suggested that SD thermodynamic metastable microparticulate/nanoparticulate mannitol particles [50% (medium) pump rate] with more surface area and higher free energy took up a high percentage of moisture at the 95% RH level, or this may simply indicate the formation of mannitol hemihydrate.(42) Due to the increased surface area/energy,(25) the SD mannitol had slightly higher water content than raw D-mannitol (Table 4), but they were all under 2% (i.e., very low). The low water vapor sorption (Fig. 5) and water content (Table 4) of SD mannitol is critical for formulation stability issues such as chemical stability,(48) polymorphic interconversion,(49) and interparticulate capillary force.(8,26)
FIG. 10.

Water vapor sorption isotherms at 25°C for raw and SD mannitol (50% pump rate) particles (water vapor sorbed/dry compound mole/mole vs. RH).
Excellent aerosol dispersion performance of SD mannitol particles was achieved at Q of 60 L/min (adult airflow rate) with HandiHaler, which gave low particle deposition on stage 1 (below 40% deposition) as in Figure 8. The HandiHaler is a high shear stress DPI device.(50) The particles on stage 1 would be predicted to deposit in larger airways (i.e., bronchi) in vivo.(5,20) The respiratory aerosol formulation with the ability to effectively reach the smaller airways (i.e., bronchioles) or even the bronchioalveolar regions is crucial for enhanced effective treatment of CF.(16–18) As demonstrated here for the first time, the SD mannitol particles from different pump rates from organic solution (closed-mode) had a significant effect on their aerosol dispersion performance. High pump rate (100%) particles exhibited FPF of ∼55% and RF of ∼81%. The MMAD values for all aerosols were suitable for efficiently targeting the smaller airways as inhaled dry powder aerosols. Interestingly, positive linear correlation of FPF and RF with spray-drying pump rates (Fig. 11a and b) exhibited excellent linear regression correlation values of r2 of 0.9998 and 0.9543, respectively.
FIG. 11.

Linear correlation plots of (a) FPF and (b) RF versus spray-drying pump rates for SD mannitol (n=3).
The difference in aerosol dispersion performance among SD mannitol particles may arise from the presence of different polymorphic composition after organic solution advanced spray drying in closed-mode from dilute mannitol solution in methanol, resulting in distinctive physicochemical properties (thermal properties, XRPD, water vapor sorption, etc.) of aerosols, and from particle properties (water content, sizing, etc.). SD mannitol particles from medium and particularly from low pump rates exhibited higher particle deposition on stage 1. Those deposited particles on stage 1 represent the aerosolized agglomerates (not primary particles).(51) However, for all aerosols, the primary particles or reduced aggregates were entrained and deposited on stages 5–7, which have lower Da50 cutoffs into the nanometer aerodynamic size. It is known that the interparticulate forces (i.e., interfacial forces) increase as particle size decreases because the surface area increases,(5) the SD nanoparticulate particles do aerosolize, as shown from deposition profiles on stages 5–7 in Figure 8. The excellent aerosol dispersion properties of such particles can be advantageous in the treatment of CF and other pulmonary diseases by DPIs.
Conclusions
This study has demonstrated for the first time that the SD microparticulate/nanoparticulate DPI aerosols of mannitol were successfully produced at three pump rates (high, medium, and low) from dilute mannitol solution (methanol) using organic solution advanced spray drying in closed-mode. The primary SD mannitol particles possessed necessary particle and surface properties that minimize the interparticulate interactions and provide excellent aerosol performance as DPIs. Comprehensive physicochemical characterization of SD mannitol particles indicated that crystallinity was retained following organic solution advanced spray drying due to polymorphic interconversion. The type of crystalline polymorphs present were correlated with the spray-drying pump rate. As high-performing DPIs, aerosol deposition patterns for all three pump rates were distinct. Positive linear correlation between aerosol dispersion parameters (FPF and RF) and spray-drying pump rate revealed this interplay.
Acknowledgments
The authors gratefully acknowledge fellowship support from the UK Center of Membrane Sciences, the Graduate School Academic Year Fellowship, and the Daniel R. Reedy Quality Achievement Fellowship awarded to Xiaojian Li. The authors thank Dr. Dicky Sick Ki Yu for SEM access, Dr. Tonglei Li for XRPD and HSM access, and Dr. Hilt for ATR-FTIR access at the University of Kentucky.
Author Disclosure Statement
The authors declare that there are no conflicts of interest.
References
- 1.Gibson RL, Burns JL, and Ramsey BW: Pathophysiology and management of pulmonary infections in cystic fibrosis. Am J Respir Crit Care Med. 2003;168:918–951 [DOI] [PubMed] [Google Scholar]
- 2.Elphick H, and Southern K: Antifungal therapies for allergic bronchopulmonary aspergillosis in people with cystic fibrosis. Cochrane Database Syst Rev. 2000;(4):CD002204. [DOI] [PubMed] [Google Scholar]
- 3.Hickey AJ, and Mansour HM: Delivery of drugs by the pulmonary route. In: Florence AT, and Siepmann J, (eds). Modern Pharmaceutics. Taylor & Francis, New York; pp. 191–219, 2009 [Google Scholar]
- 4.Hickey AJ, and Mansour HM: Formulation challenges of powders for the delivery of small molecular weight molecules as aerosols. In: Rathbone MJ, (ed). Modified-Release Drug Delivery Technology. Informa Healthcare, New York; pp. 573–602, 2008 [Google Scholar]
- 5.Hickey AJ, Mansour HM, Telko MJ, Xu Z, Smyth HD, Mulder T, McLean R, Langridge J, and Papadopoulos D: Physical characterization of component particles included in dry powder inhalers. I. Strategy review and static characteristics. J Pharm Sci. 2007;96:1282–1301 [DOI] [PubMed] [Google Scholar]
- 6.Hickey AJ, Mansour HM, Telko MJ, Xu Z, Smyth HD, Mulder T, McLean R, Langridge J, and Papadopoulos D: Physical characterization of component particles included in dry powder inhalers. II. Dynamic characteristics. J Pharm Sci. 2007;96:1302–1319 [DOI] [PubMed] [Google Scholar]
- 7.Suarez S, and Hickey AJ: Drug properties affecting aerosol behavior. Respir Care. 2000;45:652–666 [PubMed] [Google Scholar]
- 8.Wu X, Li X, and Mansour HM: Surface analytical techniques in solid-state particle characterization: implications for predicting performance in dry powder inhalers. KONA Powder Particle J. 2010;3–19 [Google Scholar]
- 9.Xu Z, Mansour HM, and Hickey AJ: Particle interactions in dry powder inhaler unit processes. J Adhes Sci Technol: Special Issue on Adhesion Aspects in Pharmaceutical Sciences. 2011;25:451–482 [Google Scholar]
- 10.Xu Z, Mansour HM, Mulder T, McLean R, Langridge J, and Hickey AJ: Heterogeneous particle deaggregation and its implication for therapeutic aerosol performance. J Pharm Sci. 2010;99:3442–3461 [DOI] [PubMed] [Google Scholar]
- 11.Adi H, Traini D, Chan HK, and Young PM: The influence of drug morphology on aerosolisation efficiency of dry powder inhaler formulations. J Pharm Sci. 2008;97:2780–2788 [DOI] [PubMed] [Google Scholar]
- 12.Mansour HM, Rhee YS, and Wu X: Nanomedicine in pulmonary delivery. Int J Nanomedicine. 2009;4:299–319 [DOI] [PMC free article] [PubMed] [Google Scholar]
- 13.Taylor RF, Morgan DW, Nicholson PS, Mackay IS, Hodson ME, and Pitt TL: Extrapulmonary sites of Pseudomonas aeruginosa in adults with cystic fibrosis. Thorax. 1992;47:426–428 [DOI] [PMC free article] [PubMed] [Google Scholar]
- 14.Tiddens HA: Detecting early structural lung damage in cystic fibrosis. Pediatr Pulmonol. 2002;34:228–231 [DOI] [PubMed] [Google Scholar]
- 15.Worlitzsch D, Tarran R, Ulrich M, Schwab U, Cekici A, Meyer KC, Birrer P, Bellon G, Berger J, Weiss T, Botzenhart K, Yankaskas JR, Randell S, Boucher RC, and Doring G: Effects of reduced mucus oxygen concentration in airway Pseudomonas infections of cystic fibrosis patients. J Clin Invest. 2002;109:317–325 [DOI] [PMC free article] [PubMed] [Google Scholar]
- 16.Usmani OS, Biddiscombe MF, and Barnes PJ: Regional lung deposition and bronchodilator response as a function of β2-agonist particle size. Am J Respir Crit Care Med. 2005;172:1497–1504 [DOI] [PubMed] [Google Scholar]
- 17.Stahlhofen W, Gebhart J, and Heyder J: Experimental determination of the regional deposition of aerosol particles in the human respiratory tract. Am Ind Hyg Assoc J. 1980;41:385–398a [DOI] [PubMed] [Google Scholar]
- 18.Murray JF, and Nadel JA: Textbook of Respiratory Medicine. Saunders, Philadelphia; 1988 [Google Scholar]
- 19.Raabe OG: Comparison of the criteria for sampling ‘inhalable’ and ‘respirable’ aerosols. Ann Occup Hyg. 1982;26:33–45 [PubMed] [Google Scholar]
- 20.Suarez S, and Hickey AJ: Drug properties affecting aerosol behavior. Respir Care. 2000;45:652–666 [PubMed] [Google Scholar]
- 21.Mizoe T, Ozeki T, and Okada H: Preparation of drug nanoparticle-containing microparticles using a 4-fluid nozzle spray drier for oral, pulmonary, and injection dosage forms. J Control Release. 2007;122:10–15 [DOI] [PubMed] [Google Scholar]
- 22.Wu X, Zhang W, Hayes DJ, and Mansour HM: Physicochemical characterization and aerosol dispersion performance of organic solution advanced spray-dried cyclosporine A multifunctional particles for dry powder inhalation aerosol delivery. Int J Nanomedicine. 2013;8:1–15 [DOI] [PMC free article] [PubMed] [Google Scholar]
- 23.Wu X, Hayes D, Jr, Zwischenberger JB, Kuhn RJ, and Mansour HM: Design and physicochemical characterization of advanced spray-dried tacrolimus multifunctional particles for inhalation. Drug Des Devel Ther. 2013;7:59–72 [DOI] [PMC free article] [PubMed] [Google Scholar]
- 24.Meenach SA, Vogt FG, Anderson KW, Hilt JZ, McGarry RC, and Mansour HM: Design, physicochemical characterization, and optimization of organic solution advanced spray-dried inhalable DPPC and DPPC:DPPE-PEG microparticles and nanoparticles for targeted respiratory nanomedicine delivery as dry powder inhalation aerosols. Int J Nanomedicine. 2013;8:275–293 [DOI] [PMC free article] [PubMed] [Google Scholar]
- 25.Li X, and Mansour HM: Physicochemical characterization and water vapor sorption of organic solution advanced spray-dried inhalable trehalose microparticles and nanoparticles for targeted dry powder pulmonary inhalation delivery. AAPS PharmSciTech. 2011;12:1420–1430 [DOI] [PMC free article] [PubMed] [Google Scholar]
- 26.Dunbar CA, Hickey AJ, and Holzner P: Dispersion and characterization of pharmaceutical dry powder aerosols. KONA Powder Particle J. 1998;16:7–45 [Google Scholar]
- 27.Teper A, Jaques A, and Charlton B: Inhaled mannitol in patients with cystic fibrosis: a randomised open-label dose response trial. J Cyst Fibros. 2011;10:1–8 [DOI] [PubMed] [Google Scholar]
- 28.Mansour HM, Xu Z, and Hickey AJ: Dry powder aerosols generated by standardized entrainment tubes from alternative sugar blends: 3. Trehalose dihydrate and D-mannitol carriers. J Pharm Sci. 2010;99:3430–3441 [DOI] [PubMed] [Google Scholar]
- 29.Daviskas E, Anderson SD, Eberl S, Chan HK, and Young IH: The 24-h effect of mannitol on the clearance of mucus in patients with bronchiectasis. Chest. 2001;119:414–421 [DOI] [PubMed] [Google Scholar]
- 30.Wills PJ, and Cole PJ: Mucolytic and mucokinetic therapy. Pulm Pharmacol. 1996;9:197–204 [DOI] [PubMed] [Google Scholar]
- 31.Brannan JD, Gulliksson M, Anderson SD, Chew N, and Kumlin M: Evidence of mast cell activation and leukotriene release after mannitol inhalation. Eur Respir J. 2003;22:491–496 [DOI] [PubMed] [Google Scholar]
- 32.King M, and Rubin BK: Pharmacological approaches to discovery and development of new mucolytic agents. Adv Drug Deliv Rev. 2002;54:1475–1490 [DOI] [PubMed] [Google Scholar]
- 33.Daviskas E, and Anderson SD: Hyperosmolar agents and clearance of mucus in the diseased airway. J Aerosol Med. 2006;19:100–109 [DOI] [PubMed] [Google Scholar]
- 34.Jaques A, Daviskas E, Turton JA, McKay K, Cooper P, Stirling RG, Robertson CF, Bye PT, Lesouëf PN, Shadbolt B, Anderson SD, and Charlton B: Inhaled mannitol improves lung function in cystic fibrosis. Chest. 2008;133:1388–1396 [DOI] [PubMed] [Google Scholar]
- 35.Burger A, Henck JO, Hetz S, Rollinger JM, Weissnicht AA, and Stottner H: Energy/temperature diagram and compression behavior of the polymorphs of D-mannitol. J Pharm Sci. 2000;89:457–468 [DOI] [PubMed] [Google Scholar]
- 36.Takada A, Nail SL, and Yonese M: Influence of ethanol on physical state of freeze-dried mannitol. Pharm Res. 2009;26:1112–1120 [DOI] [PubMed] [Google Scholar]
- 37.Mansour HM, and Zografi G: The relationship between water vapor absorption and desorption by phospholipids and bilayer phase transitions. J Pharm Sci. 2007;96:377–396 [DOI] [PubMed] [Google Scholar]
- 38.Mansour HM, and Hickey AJ: Raman characterization and chemical imaging of biocolloidal self-assemblies, drug delivery systems, and pulmonary inhalation aerosols. A review. AAPS PharmSciTech. 2007;8:E01–E16 [DOI] [PMC free article] [PubMed] [Google Scholar]
- 39.Park CW, Rhee YS, Vogt F, Hayes DJ, Zwischenberger JB, DeLuca PP, and Mansour HM: Advances in microscopy and complementary imaging techniques to assess the fate of drugs ex-vivo in respiratory drug delivery. Invited paper. Adv Drug Deliv Rev. 2012;64:344–356 [DOI] [PubMed] [Google Scholar]
- 40.<601> Aerosols, Nasal Sprays, Metered-Dose Inhalers, and Dry Powder Inhalers Monograph USP 29-NF 24 The United States Pharmacopoeia and The National Formulary: The Official Compendia of Standards. Vol. 29/24 The United States Pharmacopeial Convention, Inc., Rockville, MD; pp. 2617–2636, 2006 [Google Scholar]
- 41.Finlay WH: The ARLA respiratory deposition calculator. 2008. Available at: www.mece.ualberta.ca/arla/impactor_mmad_calculator.html Accessed January17, 2013
- 42.Nunes C, Suryanarayanan R, Botez CE, and Stephens PW: Characterization and crystal structure of D-mannitol hemihydrate. J Pharm Sci. 2004;93:2800–2809 [DOI] [PubMed] [Google Scholar]
- 43.Mitchell H: Sweeteners and Sugar Alternatives in Food Technology. Blackwell Publishers, Oxford, Ames, Iowa; 2006 [Google Scholar]
- 44.Ye P, and Byron T: Characterization of D-mannitol by thermal analysis, FTIR, and Raman spectroscopy. Am Lab. 2008;40:24–27 [Google Scholar]
- 45.Tang P, Chan HK, Chiou H, Ogawa K, Jones MD, Adi H, Buckton G, Prud'homme RK, and Raper JA: Characterisation and aerosolisation of mannitol particles produced via confined liquid impinging jets. Int J Pharm. 2009;367:51–57 [DOI] [PubMed] [Google Scholar]
- 46.Kumon M, Kwok PC, Adi H, Heng D, and Chan HK: Can low-dose combination products for inhalation be formulated in single crystalline particles? Eur J Pharm Sci. 2010;40:16–24 [DOI] [PubMed] [Google Scholar]
- 47.Chan HK, Clark AR, Feeley JC, Kuo MC, Lehrman SR, Pikal-Cleland K, Miller DP, Vehring R, and Lechuga-Ballesteros D: Physical stability of salmon calcitonin spray-dried powders for inhalation. J Pharm Sci. 2004;93:792–804 [DOI] [PubMed] [Google Scholar]
- 48.Tong P, and Zografi G: Effects of water vapor absorption on the physical and chemical stability of amorphous sodium indomethacin. AAPS PharmSciTech. 2004;5:e26. [DOI] [PMC free article] [PubMed] [Google Scholar]
- 49.Yoshinari T, Forbes RT, York P, and Kawashima Y: Moisture induced polymorphic transition of mannitol and its morphological transformation. Int J Pharm. 2002;247:69–77 [DOI] [PubMed] [Google Scholar]
- 50.Donovan MJ, Kim SH, Raman V, and Smyth HD: Dry powder inhaler device influence on carrier particle performance. J Pharm Sci. 2011;101:1097–1107 [DOI] [PubMed] [Google Scholar]
- 51.Hickey AJ: Inhalation Aerosols: Physical and Biological Basis for Therapy, 2nd ed. Informa Healthcare, New York; 2007 [Google Scholar]