

Abstract
Radiotherapy dose calculations can be evaluated by Monte Carlo (MC) simulations with acceptable accuracy for dose prediction in complicated treatment plans. In this work, Standard, Livermore and Penelope electromagnetic (EM) physics packages of GEANT4 application for tomographic emission (GATE) 6.1 were compared versus Monte Carlo N-Particle eXtended (MCNPX) 2.6 in simulation of 6 MV photon Linac. To do this, similar geometry was used for the two codes. The reference values of percentage depth dose (PDD) and beam profiles were obtained using a 6 MV Elekta Compact linear accelerator, Scanditronix water phantom and diode detectors. No significant deviations were found in PDD, dose profile, energy spectrum, radial mean energy and photon radial distribution, which were calculated by Standard and Livermore EM models and MCNPX, respectively. Nevertheless, the Penelope model showed an extreme difference. Statistical uncertainty in all the simulations was <1%, namely 0.51%, 0.27%, 0.27% and 0.29% for PDDs of 10 cm2× 10 cm2 filed size, for MCNPX, Standard, Livermore and Penelope models, respectively. Differences between spectra in various regions, in radial mean energy and in photon radial distribution were due to different cross section and stopping power data and not the same simulation of physics processes of MCNPX and three EM models. For example, in the Standard model, the photoelectron direction was sampled from the Gavrila-Sauter distribution, but the photoelectron moved in the same direction of the incident photons in the photoelectric process of Livermore and Penelope models. Using the same primary electron beam, the Standard and Livermore EM models of GATE and MCNPX showed similar output, but re-tuning of primary electron beam is needed for the Penelope model.
Keywords: Energy spectrum, GEANT4 application for tomographic emission, linac simulation, Monte Carlo N-Particle eXtended, photon radial distribution, radial mean energy
INTRODUCTION
Monte Carlo (MC) simulation is a good tool for benchmarking photon and electron dose calculations in teletherapy and brachytherapy by radiation. These methods have acceptable accuracy and reproducibility for dose prediction in complicated treatment plans.[1,2,3] The major weakness of the MC method is that it is inherently a time consuming method. However, with respect to the development of computer technology and variance reduction techniques, the MC method is becoming a practical approach in dose calculations for three-dimensional (3D) conventional radiotherapy and it has been recently applied in conformal radiation therapy techniques such as intensity modulated radiation therapy, microbeam radiation therapy and proton beam therapy.[4,5,6]
The accuracy of an MC code depends on its inner accuracy in particle transport and user's precision in utilizing the code. MC codes can be used to find the effect of pre-target electron beam parameters, thickness and shape of different targets on photon energy spectra at the exit window of a Linac head, tumor and organ-at-risk dose evaluation and many other simulations.[7,8,9]
The most frequently used MC general purpose codes for modeling of radiotherapy beams are ETRAN/ITS, EGS4, EGSnrc, Monte Carlo N-Particle (MCNP), PENELOPE, GEANT3 and GEANT4. The programming language of these codes are FORTRAN, except the GEANT4, which is written in C++.[2]
The GEANT4 application for tomographic emission (GATE) package is the most recently developed MC code as the upper layer of widespread GEANT4 MC Toolkit. To achieve a modular, versatile and scripted simulation, GEANT4 libraries are encapsulated in the GATE. GATE is an open source software package initially developed for nuclear medicine (positron emission tomography and single-photon emission computed tomography) applications. For radiation therapy applications, some specific tools have been added to it from version 6.0 (February 2010).[10] GATE includes a simple and flexible geometry input, which makes it a very good tool for simulating complex geometries and experimental arrangements. GATE is a new code and is less experienced compared with the above-mentioned codes. It seems that an essential step in validation of this code is its comparison against validated codes like MCNP.
This paper compares two MC codes, GATE (version 6.1) and Monte Carlo N-Particle eXtended (MCNPX) (version 2.6), for linac head simulation and generation of dose distributions in a homogeneous water phantom for different radiation field sizes. The energy spectrum, radial mean energy, photon radial distribution, percentage depth doses (PDDs) and beam profiles were calculated by the two codes and the results were compared.
MATERIALS AND METHODS
Reference Data
To evaluate the performance and accuracy of the MCNPX simulation, the calculated values of PDD curves and beam profiles were compared with the measured values. The measurements were performed using a 6 MV Elekta Compact linear accelerator and a 50 × 50 × 50 cm3 Scanditronix water phantom. Two Scanditronix diode detectors, one as reference and the other for measurement, were used to obtain the PDD and beam profile in 10 × 10 cm2 field size at the source to surface distance of 100 cm. Inline beam profile in the depth of 10 cm was measured.
MCNPX Simulations
MCNPX, the abbreviation for MCNP eXtended, is a FORTRAN 90 MC radiation transport computer code, which transports many particle types at almost all energies. This code is used for modeling the interaction of radiation with matter and was chosen for comparison with GATE because it is generally accepted as an accurate implement for radiotherapy dosimetry applications. This 3D code takes into account Rayleigh and Compton scattering and the probability of florescent emission after photoelectric absorption and bremsstrahlung for photon transport. The energy loss model used for electron transport is continuous slowing down approximation. The code breaks the electron's path into several steps when an electron is facing a significant energy loss. Energy distribution of pulses created in a detector was determined by * F8 tally.
Photoelectric absorption, Compton interaction and Gamma Conversion for photon interactions have been considered. For X-rays, the energy cut off was set to 10 keV, which means below that value the photon will be absorbed in the same voxel. Ionization, multiple scattering, bremsstrahlung and positron annihilation were considered for electron and positron interactions. The cutoff energy applied on the electrons and positrons was 300 keV.
The input file was set as all calculations were performed in coupled electron–photon mode. Tuning procedure of the primary electron beam characteristics was performed as recommended by Verhaegen and Seuntjens.[2] The mean electron beam energy of 6 MeV and a full width at half maximum (FWHM) electron spot of 2 mm had the best fit to the measurements. In addition, the FWHM energy was set to 3% of the mean energy. Dose calculations were performed in a 40 × 40 × 40 cm3 water phantom as the PDDs were computed for depths from 0 to 25 cm in 1 × 1 × 0.5 cm3 voxels around the central axis and the beam profiles were calculated at a depth of 10 cm in 1 × 0.5 × 1 cm3 voxels. The number of initial histories was 2 × 10⁹ for all the field sizes.
GATE Simulations
GATE MC Package (version 6.1) is developed by the international OpenGATE collaboration and was used to compute the dose in a water phantom. This version of GATE is based on GEANT4 version 9.3-9.4 and 9.4.p04 release version was used. To simulate physical processes, Standard, Livermore and Penelope models were used, which are available for the Electromagnetic (EM) interactions of photons and electrons. There are two distinct phases for all processes: (I) computation and use of total cross-sections, (II) making the final state. Both phases are established on the theoretical models and calculated data. To determine the cross-sections and sample the final state, data can be taken from a set of open data libraries: Evaluated Photons Data Library 97, Evaluated Electrons Data Library, Evaluated Atomic Data Library, stopping power data and binding energy values based on data of Scofield. In general, the models used to create useful data sets perform selection, renormalization, comparison processes and averaging of the available experimental data. For all major photon and electron interactions, the Standard model is appropriate for energies down to 10 keV and the Rayleigh scatter and atomic relaxation are not included in this model. In comparison with the other models, the Standard model works with simpler transport algorithms and is faster and most efficient in computation. It uses parameterization schemes for the cross sections. The Livermore and Penelope models are more CPU time consuming and include EM interactions at lower energies than those covered by the Standard model. The current Livermore and Penelope implementation can handle energies down to 250 eV.[11,12]
All the setting was set similar to MCNPX simulation except for the phase space, which was added to the geometry to store incoming particles from the patient-independent part, i.e. the accelerator head above the secondary collimator. The phase space was attached to a cylinder of 10 cm radius in x-y plane and 0.002 mm thickness in the z direction 1 mm above the X collimator and stored the parameters of all the particles leaving this volume (particle's type, (x, y, z) position, (x, y, z) direction, energy, weight).
Running time of 106 initial histories for GATE simulation on a desktop with 3.2 GHz CPU were 60.8, 52.2 and 47.6 s for Standard, Livermore and Penelope Models, respectively. MCNPX was run on a desktop with 2.8 GHz CPU and it needed 340.1 s to simulate same initial histories.
Figure 1 shows a cross sectional view of a 6 MV Elekta Compact linear accelerator, which was simulated by two codes. Statistical uncertainties are shown in Table 1.
Figure 1.
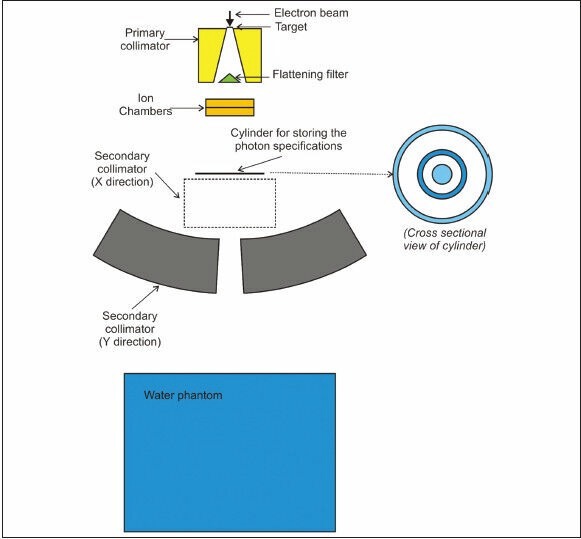
Cross sectional view of 6 MV Elekta compact linear accelerator head simulated by the two codes. Cross sectional view of cylinder shows areas which photon energy spectra were calculated
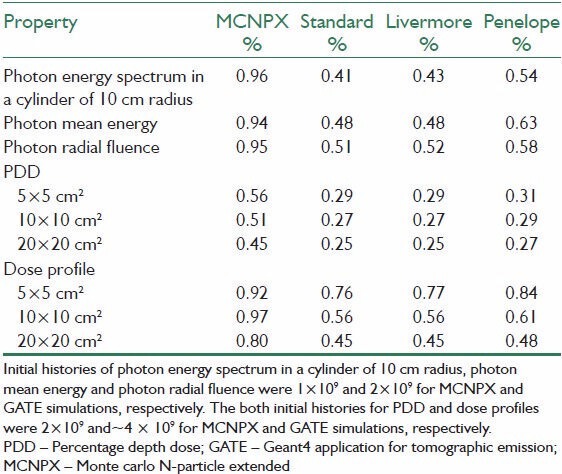
Table 1.
The averaged statistical uncertainties of simulation results
Comparison of Calculated and Measured Data
Numerical evaluation methods are the best tools to compare the measured and calculated dose distribution values. Low's γ-index[13] is a quantitative quality index that indicates the calculation accuracy. It specifies the quality in the regions that pass the acceptance criteria and disagreement in the regions that fail the criteria. The passing criterion is 3% in the dose difference (DD) and 3 mm in distance-to-agreement (DTA) (the physical distance). To evaluate the γ-index, a MATLAB code was written based on Low's formula.[13] In this formalism, the minimum of the following function for all of the calculated points (rc) against each reference point (rr) should be found:
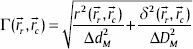
where
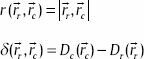
Here, Dc (rc) is the calculated dose distribution at position rc and Dr (rr) is the reference dose distribution at position rr. ΔDM and Δ dM refer to DD criterion and DTA criterion, respectively.
RESULTS AND DISCUSSION
The aim of this paper was to compare the results of GATE and MCNPX. The methodologies and fundamental data used by each code are discussed in the literature.[2,14,15,16] It seems that an essential step in validation of GATE code is comparing it against validated codes like MCNP. To do this, similar geometry was used for the two codes.
MCNPX Model Commissioning
To obtain mean energy of the electron beam, the calculated and measured PDD for the 10 × 10 cm2 field size were compared, which is shown in Figure 2 with its related γ-index. The absorbed dose values were normalized to depth of maximum dose (dmax) for PDD distribution because the statistical uncertainty was <2% at dmax. Dose profile comparison at depth of 10 cm for the 10 × 10 cm2 field size and the related γ-index are shown in Figure 3. To evaluate γ-index, DD and DTA criteria were set to 2% and 2 mm, respectively. As shown in Figures 2 and 3, PDD and dose profile calculation passed γ-index everywhere.
Figure 2.
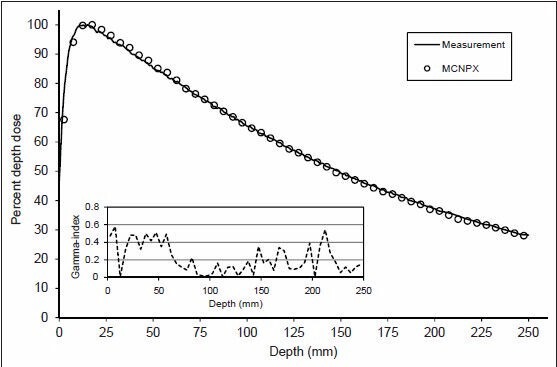
Calculated and measured percentage depth dose curves and related γ-index for 10 × 10 cm2 field size of 6 MV photons
Figure 3.
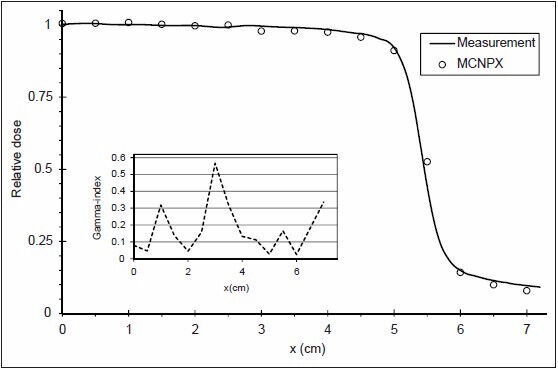
Calculated and measured dose profiles and related γ-index, at 10 cm depth and 10 × 10 cm2 field size of 6 MV photons
The differences between the measurements and calculations might be due to estimation in linac components, variations of the linac's output and uncertainties of the measurements. Uncertainty in the code library and statistical uncertainty in MC results should be added to the above cases.[17,18]
Specifications of Produced Photons
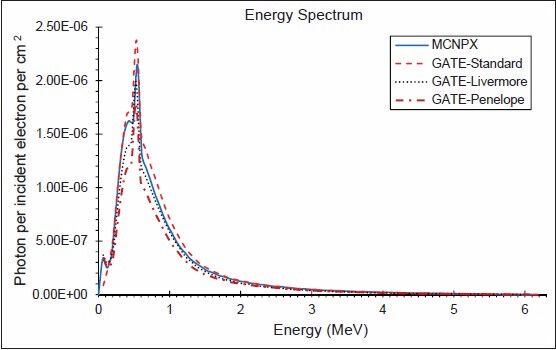
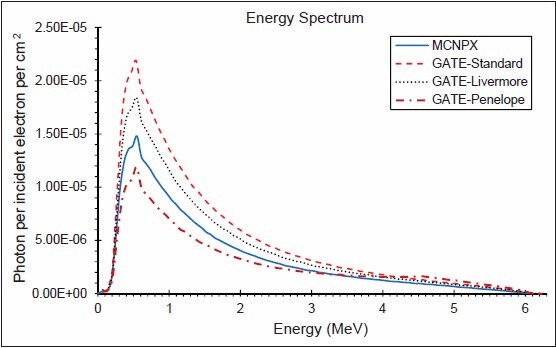
The photon energy distributions in a cylinder of 10 cm radius and 0.002 mm thickness in the z direction located 1 mm above the secondary collimator were calculated using the three EM models and MCNPX. The spectra throughout the disc, in similar disc, but 2 cm radius, an annulus between 4 and 5 cm and another between 9 and 10 cm are shown in Figures 4–7, respectively. Although the spectra have the same shape, the Standard model has the highest energy fluence, followed by the Livermore model, which has more energy fluence than the MCNPX. The minimum fluence of energy belongs to the Penelope model. Photon energy distributions in different areas have not been previously investigated in the literature. The spectrum throughout the big disc is largely similar to the spectrum obtained by Grevillot et al. and Sheikh-Bagheri and Rogers.[10,19]
Figure 4.
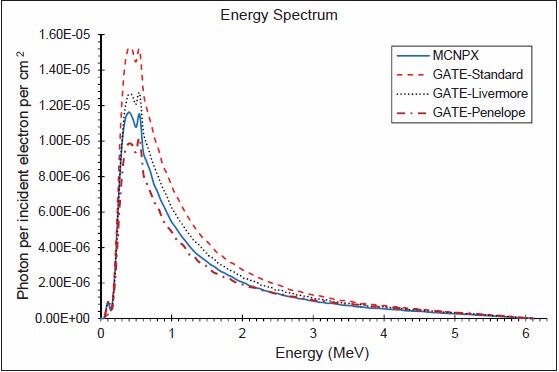
Photon energy spectrum in a cylinder of 10 cm radius and 0.002 mm thickness in the z direction (6 MV photons)
Figure 7.
Photon energy spectrum between 90 and 100 mm from central axis and 0.002 mm thickness in the z direction (6 MV photons)
Figure 8 shows photon mean energy as a function of the radial position from central axis, 1 mm above the secondary collimator, which was calculated by MCNPX and the three EM models. This diagram is partially similar to the results obtained by Grevillot et al.[10] Because of the shape of flattening filter, the closer distance to the central axis, the more beam hardening and more mean energy is observed. All diagrams follow this pattern, although the Penelope model exaggerates this form. Mean energy has no changes between the flattening filter and primary collimator from 5.4 to 8.2 cm. The edge of the primary collimator is located in 8.2 cm, beam hardening occurs for passing photons and mean average energy is increased. Beyond 9 cm, mean energy reduction is due to low energy secondary photons because the primary collimator absorbs high-energy primary photons.
Figure 8.
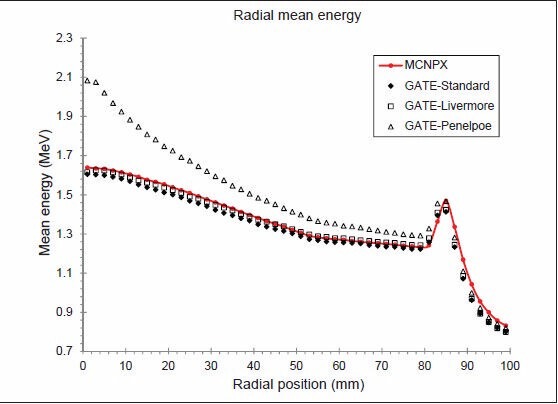
Photon mean energy as a function of the radial position before the secondary collimators for 6 MV photons
Figure 5.
Photon energy spectrum in a cylinder of 20 mm radius and 0.002 mm thickness in the z direction (6 MV photons)
Figure 6.
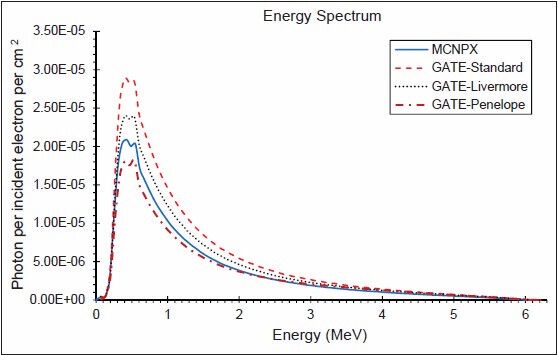
Photon energy spectrum between 40 and 50 mm from central axis and 0.002 mm thickness in the z direction (6 MV photons)
Photon radial distribution before the secondary collimators is shown in Figure 9. The three EM models and MCNPX have a similar pattern. From central axis to 5.4 cm, as the thickness of the flattening filter is decreased, the number of transmitted photons is increased. Between the flattening filter and primary collimator from 5.4 to 8.2 cm, photon fluence is gradually decreased. Primary collimator causes a sharp decline in the amount of transmitted photons. Standard and Livermore models generate more photon fluence; however, Penelope model and MCNPX produce less photon fluence. Due to area normalization applied to photon radial distribution in this work, the results are different from the work of Grevillot et al.[10]
Figure 9.
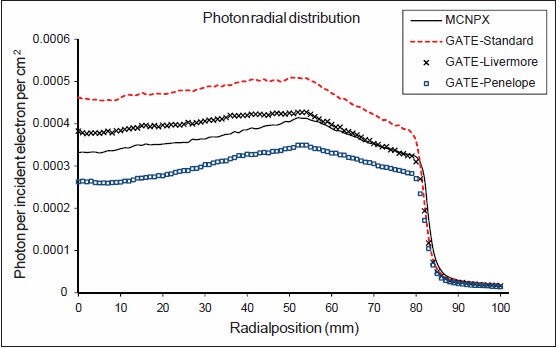
Photon radial distribution before the secondary collimators
Differences among spectra in various regions in the disc, radial mean energy and photon radial distribution are due to various cross section and stopping power data and not the same simulation of physics processes. For example, in the photoelectric process of Livermore and Penelope models, the photoelectron moves in the same direction of the incident photons; however, the photoelectron direction is sampled from the Gavrila-Sauter distribution in the Standard model. The Livermore and Penelope cross sections were obtained from the calculations of Scofield, but the Standard model uses parameterized cross sections from another data set. For elements with atomic number Z > 5, Livermore and Penelope models can simulate Auger interactions, but atomic relaxation is not simulated in Standard model.
Depth Dose Distributions
The three EM models and MCNPX calculated depth dose distributions of 5 × 5, 10 × 10 and 20 × 20 cm2 and their differences are shown in Figure 10. Table 1 shows the statistical uncertainties of these fields.
Figure 10.
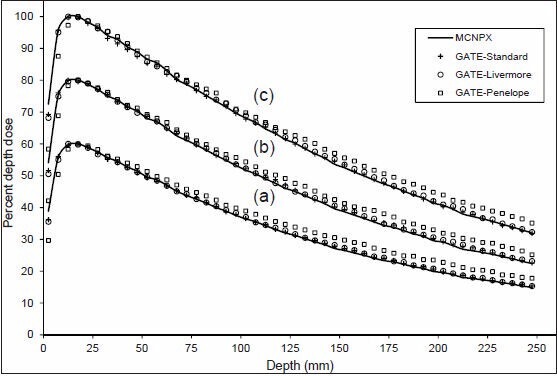
Depth dose distributions for the three electromagnetic models compared to MCNPX for (a) 5 × 5, (b) 10 × 10 and (c) 20 × 20 cm2 field size (6 MV photons). Percentage depth dose curves are normalized to dmax (and multiplied by 100). In addition, for inclusion on the same graph, curves for 10 × 10 and 5 × 5 cm2 field sizes are scaled by 0.8 and 0.6, respectively
It has been showed that MC dose calculations do not match well at narrow depths.[14,16] Despite this fact, there is a good overall agreement among the depth dose distributions in Figure 10, except for the Penelope model, which underestimates the dose in the buildup region and overestimates the dose in the tail region. Near the central axis, the Penelope model has more mean energy than the other models and MCNPX, according to Figure 8. Higher mean energy leads to an increase in penetration depth, similar to PDD curve, which is shifted to right.
Dose Profiles
Beam profiles were calculated at the depth of 10 cm for the 5 × 5, 10 × 10 and 20 × 20 cm2 field sizes by the three EM models and MCNPX. The comparisons of these profiles are shown in Figure 11. Statistical uncertainties in calculation of dose profiles are shown in Table 1.
Figure 11.
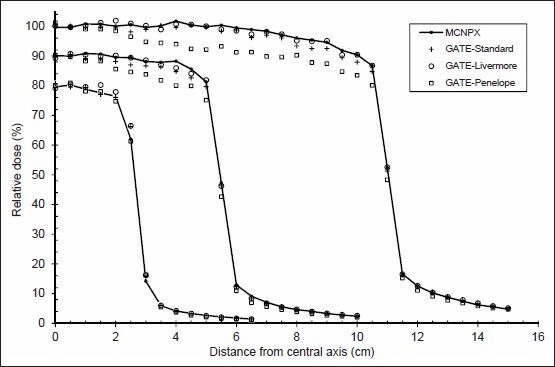
Dose profiles for the three electromagnetic models in comparison with MCNPX for 5 × 5, 10 × 10 and 20 × 20 cm2 field sizes (6 MV photons). Curves for 10 × 10 and 5 × 5 cm2 field sizes are scaled by 0.9 and 0.8, respectively
In particular, three EM models produce the beam profile values within a 5.6% level, except for Penelope model for 10 × 10 and 20 × 20 field sizes, where large differences occur. The curves corresponding to beam profiles are underestimated in the Penelope model. As can be seen in Figure 11, this difference is increased with the field size.
The energy spectrum and radial distribution of primary electron beam affect dose profiles and this effect is decreased with depth.[2,20] The primary electron beam characteristics were the same for both codes, so primary electron beam could not affect the differences detected between the two codes.
As mentioned in section 3.4, the Penelope model has higher mean energy than MCNPX and the other models, so that the distance from the central axis is decreased and mean energy is increased. This causes reduction in dose deposition by increasing distance from the central axis, i.e. higher doses should be deposited near the central axis. When dealing with some cancer treatment cases such as pregnant women, dose in the penumbra is much more important because the fetus is placed in this area.[21]
CONCLUSIONS
In this study, the Elekta Compact 6 MV head was simulated using GATE and MCNPX MC codes. The same physical interaction data and methodologies were not used in their computations, because different groups write them with different underlying structures. The discrepancies in cross sections used for bremsstrahlung effect and discrepancies in photon and electron transport in these codes lead to different calculation results. Among three EM models used by GATE, Standard and Livermore models were consistent with MCNPX calculations and no significant systematic deviations were observed between PDD, dose profile, energy spectrum, radial mean energy and photon radial distribution. However, the Penelope model showed an excessive difference and its primary electron beam should be re-tuned for accurate dose calculations.
The Standard and Livermore EM models of GATE are appropriate for calculation of dose distributions in MC simulations.
BIOGRAPHIES

Hamid-Reza Sadoughi received B.Sc degree in physics from Ferdowsi University, Mashhad, Iran (2006), M.Sc degree in medical physics from Tehran University of Medical Science, Tehran, Iran (2009) and Ph.D. degree in medical physics from Mashhad University of Medical Sciences, Mashhad, Iran (2014). His research interest is Monte Carlo in treatment planning and dose calculation.
E-mail: sadoughi.hamid@gmail.com
Shahrokh Nasseri Medical Physics Research Center, Medical Physics Department, Faculty of Medicine, Mashhad University of Medical Sciences, Mashhad, Iran.
E-mail: nasseriSH@mums.ac.ir
Mahdi Momennezhad Medical Physics Research Center, Medical Physics Department, Faculty of Medicine, Mashhad University of Medical Sciences, Mashhad, Iran.
E-mail: momennezhadM@mums.ac.ir
Hamid-Reza Sadeghi Medical Physics Research Center, Medical Physics Department, Faculty of Medicine, Mashhad University of Medical Sciences, Mashhad, Iran.
E-mail: sadeghihr871@mums.ac.ir
Mohammad-Hossein Bahreyni-Toosi Medical Physics Research Center, Medical Physics Department, Faculty of Medicine, Mashhad University of Medical Sciences, Mashhad, Iran E-mail: bahreinimh@yahoo.com Tel: 098 5118002321 Fax: 098 5118002320 Postal address: Department of Medical Physics, Faculty of Medicine, Mashhad University of Medical Sciences, Mashhad, Iran.
E-mail: bahreinimh@yahoo.com
ACKNOWLEDGMENTS
We would like to thank the Elekta Medical Systems, for providing detailed information on the Elekta Compact linear accelerators.
Footnotes
Source of Support: This work is extracted from a PhD thesis that was supported by the vice chancellor for research of Mashhad University of Medical Sciences grant No. 901150
Conflict of Interest: None declared.
REFERENCES
- 1.Ahnesjö A, Aspradakis MM. Dose calculations for external photon beams in radiotherapy. Phys Med Biol. 1999;44:R99–155. doi: 10.1088/0031-9155/44/11/201. [DOI] [PubMed] [Google Scholar]
- 2.Verhaegen F, Seuntjens J. Monte Carlo modelling of external radiotherapy photon beams. Phys Med Biol. 2003;48:R107–64. doi: 10.1088/0031-9155/48/21/r01. [DOI] [PubMed] [Google Scholar]
- 3.Jabbari K, Anvar HS, Tavakoli MB, Amouheidari AR. Monte Carlo simulation of Siemens ONCOR linear accelerator with EGSnrc code. J Med Signals Sens. 2013;3:172–9. [PMC free article] [PubMed] [Google Scholar]
- 4.Boudreau C, Heath E, Seuntjens J, Ballivy O, Parker W. IMRT head and neck treatment planning with a commercially available Monte Carlo based planning system. Phys Med Biol. 2005;50:879–90. doi: 10.1088/0031-9155/50/5/012. [DOI] [PubMed] [Google Scholar]
- 5.Kohno R, Hotta K, Nishioka S, Matsubara K, Tansho R, Suzuki T. Clinical implementation of a GPU-based simplified Monte Carlo method for a treatment planning system of proton beam therapy. Phys Med Biol. 2011;56:N287–94. doi: 10.1088/0031-9155/56/22/N03. [DOI] [PubMed] [Google Scholar]
- 6.Martinez-Rovira I, Sempau J, Prezado Y. Monte Carlo-based treatment planning system calculation engine for microbeam radiation therapy. Med Phys. 2012;39:2829–38. doi: 10.1118/1.4705351. [DOI] [PubMed] [Google Scholar]
- 7.Bush K, Zavgorodni S, Beckham W. Inference of the optimal pretarget electron beam parameters in a Monte Carlo virtual linac model through simulated annealing. Med Phys. 2009;36:2309–19. doi: 10.1118/1.3130102. [DOI] [PubMed] [Google Scholar]
- 8.Jabbari K, Roayaei M, Saberi H. Calculation of excess dose to the eye phantom due to a distanced shielding for electron therapy in head and neck cancers. J Med Signals Sens. 2012;2:144–8. [PMC free article] [PubMed] [Google Scholar]
- 9.Sawkey DL, Faddegon BA. Determination of electron energy, spectral width, and beam divergence at the exit window for clinical megavoltage x-ray beams. Med Phys. 2009;36:698–707. doi: 10.1118/1.3070547. [DOI] [PMC free article] [PubMed] [Google Scholar]
- 10.Grevillot L, Frisson T, Maneval D, Zahra N, Badel JN, Sarrut D. Simulation of a 6 MV Elekta Precise Linac photon beam using GATE/GEANT4. Phys Med Biol. 2011;56:903–18. doi: 10.1088/0031-9155/56/4/002. [DOI] [PubMed] [Google Scholar]
- 11.GEANT4 Collaboration. Physics reference manual. 2012. Available from: https://twiki.cern.ch/twiki/bin/view/Geant4/ElectromagneticPhysics .
- 12.OpenGATE-Collaboration. User's guide (Version 6.1) 2013. Available from: http://www.opengatecollaboration.org/UsersGuide .
- 13.Low DA, Harms WB, Mutic S, Purdy JA. A technique for the quantitative evaluation of dose distributions. Med Phys. 1998;25:656–61. doi: 10.1118/1.598248. [DOI] [PubMed] [Google Scholar]
- 14.Mesbahi A, Fix M, Allahverdi M, Grein E, Garaati H. Monte Carlo calculation of Varian 2300C/D Linac photon beam characteristics: A comparison between MCNP4C, GEANT3 and measurements. Appl Radiat Isot. 2005;62:469–77. doi: 10.1016/j.apradiso.2004.07.008. [DOI] [PubMed] [Google Scholar]
- 15.Poon E, Verhaegen F. Accuracy of the photon and electron physics in GEANT4 for radiotherapy applications. Med Phys. 2005;32:1696–711. doi: 10.1118/1.1895796. [DOI] [PubMed] [Google Scholar]
- 16.Siebers JV, Keall PJ, Libby B, Mohan R. Comparison of EGS4 and MCNP4b Monte Carlo codes for generation of photon phase space distributions for a Varian 2100C. Phys Med Biol. 1999;44:3009–26. doi: 10.1088/0031-9155/44/12/311. [DOI] [PubMed] [Google Scholar]
- 17.Atarod M, Shokrani P, Azarnoosh A. Out-of-field beam characteristics of a 6 MV photon beam: Results of a Monte Carlo study. Appl Radiat Isot. 2013;72:182–94. doi: 10.1016/j.apradiso.2012.10.013. [DOI] [PubMed] [Google Scholar]
- 18.Ding GX. Dose discrepancies between Monte Carlo calculations and measurements in the buildup region for a high-energy photon beam. Med Phys. 2002;29:2459–63. doi: 10.1118/1.1514237. [DOI] [PubMed] [Google Scholar]
- 19.Sheikh-Bagheri D, Rogers DW. Monte Carlo calculation of nine megavoltage photon beam spectra using the BEAM code. Med Phys. 2002;29:391–402. doi: 10.1118/1.1445413. [DOI] [PubMed] [Google Scholar]
- 20.Sheikh-Bagheri D, Rogers DW. Sensitivity of megavoltage photon beam Monte Carlo simulations to electron beam and other parameters. Med Phys. 2002;29:379–90. doi: 10.1118/1.1446109. [DOI] [PubMed] [Google Scholar]
- 21.Atarod M, Shokrani P. Monte Carlo study of fetal dosimetry parameters for 6 MV photon beam. J Med Signals Sens. 2013;3:31–6. [PMC free article] [PubMed] [Google Scholar]