Abstract
Advances in optical imaging technologies combined with the use of genetically encoded fluorescent proteins have enabled the visualization of stem cells over extensive periods of time in vivo and ex vivo. The generation of genetically encoded fluorescent protein reporters that are fused with subcellularly localized proteins, such as human histone H2B, has made it possible to direct fluorescent protein reporters to specific subcellular structures and identify single cells in complex populations. This facilitates the visualization of cellular behaviors such as division, movement, and apoptosis at a single-cell resolution and, in principle, allows the prospective and retrospective tracking towards determining the lineage of each cell.
Keywords: Embryonic stem cells, Mouse embryo, In vitro culture, Ex utero culture, Live imaging, Fluorescent protein, Time lapse, Automated image analysis, Cell tracking
1 Introduction
Embryonic stem (ES) cells have been extensively used in order to elucidate the biological mechanisms underlying pluripotency, differentiation, and cellular reprogramming; a deep understanding of these mechanisms could then lay the foundations for an efficient and safe application of these cells for therapeutic purposes. In contrast to the well-known unlimited potential of ES cells, our understanding on their biology is much more limited. Moreover, recent findings regarding heterogeneities in gene expression in stem cell cultures revealed the limitation of static stem cell analysis, which relies only on the status of cells at a certain time point and thus lacks important information about cells' changing their state over time (1, 2). Therefore, extensive analysis of stem cells in vitro (i.e., in live ES cell cultures) as well as in their natural environment in situ (i.e., in developing preimplantation embryos) requires execution in a proper spatial and temporal context for a thorough understanding of stem cell biology.
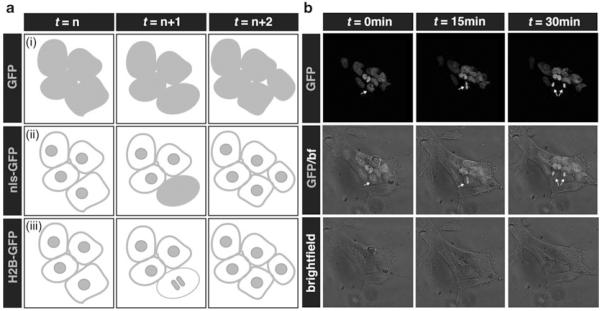
The remarkable advances in live imaging technologies combined with the use of genetically encoded fluorescent proteins (FPs) have enabled the visualization of stem cells over extensive periods of time in vivo, as well as ex vivo (3–5). The generation of genetically modified FPs that are fused with subcellularly localized proteins such as human histone H2B (H2B) (6), or tagged with localization sequences such as myristoyl anchors (Myr) (7), has made it possible to direct fluorescent protein reporters to specific subcellular structures and observe cellular behaviors such as division, movement, and apoptosis at a single-cell resolution and, in principle, prospectively and retrospectively trace the lineage of each cell (3, 7, 8) (Fig. 1). To this end, the generation of dual-tagged ES cells that express simultaneously fluorescent FPs labeling different subcellular components (e.g., the plasma membrane and the nucleus) has provided high-resolution live imaging of single-cell morphology and easier analysis and tracking of live cells in vitro as well as in vivo (9).
Fig. 1.
Fusions of fluorescent proteins (FPs) to human histone H2B label active chromatin and allow for single-cell identification and tracking. (a) Schematic cartoons depict cell tracking approaches using FPs. (i) Individual cells with cytoplasmic FPs cannot be identified nor tracked. (ii) FP fusions to nuclear localization sequences (nls-GFP) can be used to identify and track individual cells by labeling individual nuclei. During cell divisions, however, nuclear envelops break down causing the diffusion of the fluorescent signal to the cytoplasm. Cells cannot be tracked through cell divisions. (iii) FP fusions to human histone H2B protein are bound to chromatin structures throughout cell cycle. During cell divisions, the fluorescent signal is condensed as chromatin structures undergo compaction and enables to identify and track the dividing nucleus. (b) Panels show single time points from a 2D time-lapse movie of a mouse ES cell colony carrying a Nanog:H2B-GFP reporter growing in serum + LIF conditions. Images acquired every 15 min. Arrows indicate a dividing cell and its daughter cells
Most importantly, fluorescence microscopy in combination with confocal imaging has allowed the visualization of whole embryos and subcellular structures at a single-cell resolution. Various confocal modalities are available to serve specific purposes in live imaging. Of these, laser point scanning microscopes (e.g., Zeiss LSM 500) are most commonly used and provide higher resolution, with the expense of longer exposure time however, which can cause phototoxicity during embryo imaging. Slit-scanning confocals (e.g., Zeiss LSM5LIVE) or Nipkow-type spinning disc confocals (e.g., Perkin Elmer Ultra View) have faster scanning speed and shorter exposure times, which can compromise imaging resolution. Another option is two-photon laser scanning microscopy (TPLSM), which provides temporal and spatial resolution as well as low phototoxicity for studying preimplantation development (10). In this book chapter, we describe protocols using laser scanning confocal microscope modalities, since they are the most commonly used types.
Long-term imaging, including 4D (3D over time, usually referred to as 3D time-lapse) information, could generate enormous amounts of data that are then further analyzed to address various questions. However, the massive size of such datasets rules out the possibility of employing manual analysis and raises an imperious demand for automated, robust image analysis techniques. The goals of such analysis are (1) to accurately locate cells of interest, (2) to quantitatively characterize their states (e.g., level of reporter expression) and properties, and (3) to robustly, prospectively, and retrospectively track them. To achieve these goals, two major image analysis techniques are applied: cell segmentation (i.e., the process of breaking up a complex multicell image into individual cells) and cell tracking (i.e., where cells are identified in the data from each time point and followed across time points). For a glossary of terms used in the computational analysis of images see (11, 12). Efficient cell segmentation and tracking require the implementation of servers for high-content data storage that allows real-time access to the data as they are being acquired. In this chapter, we describe protocols for imaging live ES cells in vitro, i.e., in stem cell cultures, as well as in vivo, i.e., in the early mouse embryo. We also discuss image segmentation and object tracking techniques that are used to extract spatial and temporal information about the observed cells.
2 Materials
2.1 Medium
2.1.1 Medium and Reagents for Mouse Embryonic Stem Cell Culture
For ES cells, variations in culture medium can induce differential cellular behaviors. Therefore, depending on cell line origin, some culture modifications need to be made in order to prevent their differentiation and maintain their pluripotent state. It is preferable to grow ES cells on gelatinized dishes that contain a layer of adherent feeder cells (mitotically inactivated primary mouse fibro-blasts); however, certain ES cell lines (e.g., R1) can be propagated efficiently without feeders, simply on dishes coated with gelatin. We routinely culture ES cells in medium supplemented with serum and the cytokine leukemia inhibitory factor (LIF), which is essential for maintenance of pluripotency. The medium and reagents required for mouse ES cell maintenance are listed below:
75 % DMEM (Invitrogen, 11965-092) + 15 % fetal bovine serum + 1 % Sodium pyruvate (Invitrogen, 11360-070) + 1 % Non-essential amino acid (Invitrogen, 11140-050) + 1 % l-glutamine (Invitrogen, 25030-081) + 1 % Pen/Strep (Invitrogen, 15140-122) + 0.01 % LIF (Millipore, ESG1106).
0.25 % Trypsin-EDTA (Invitrogen, 25300-054).
0.5 % gelatin (Sigma, G9391).
2.1.2 Media and Reagents for Preimplantation Mouse Embryo Culture
Culture and manipulation medium for preimplantation embryos are commercially available. Some very commonly used are the following:
M2—for preimplantation embryo manipulation in an atmospheric environment (Millipore, MR-015-D).
KSOM—for preimplantation embryo culture in a CO2 environment (KSOM + AA, Millipore, MR-121-D).
Acid Tyrode's solution—for removal of the zona pellucida, the glycoprotein coat encapsulating preimplantation-stage mammalian embryos (Millipore, MR-004-D).
2.2 Culturing Mouse ES Cells and Preimplantation Embryos for Live Imaging
Humidified CO2 incubator.
On-stage environmental chamber.
Gas mixtures: for ES cells, use 5 % CO2 in air. For embryos, use 5 % CO2, 5 % O2 and 90 % N2.
Plastic cover slips (Fisher, 12–547).
24-well dishes (Becton Dickinson, 353047).
35-mm glass bottom dishes for embryos (MatTek, P35G-1.5-14-C) [NOTE 1].
Mouth pipette: Assembled with mouthpiece (HPI Hospital Products Med. Tech., 1501P), latex tubing (Fisherbrand, 22-362-772), and 1,000 μl tip as an adaptor for a Pasteur pipette. A Pasteur pipette is hand-pulled over a flame (Bunsen burner) to a diameter of 1.5× the size of the sample (which in this case are mouse embryos).
Glass rods for embryo culture dishes: After a Pasteur pipette is pulled, the broken out thinner portion of the pipette can be used. Forceps are used to cut the thin pulled glass to pieces of ~0.5–1 cm in length (so that they fit in the glass bottom portion of a MatTek dish).
Embryo-tested mineral oil (Sigma, M8410).
2 % Bacto Agar + 0.9 % NaCl: The glass bottom of a MatTek dish should be covered with a thin layer of agar to prevent embryos from adhering to the glass.
1 ml Syringe with 26-gauge (Becton Dickinson, 305111 for uterus) or blunt 30-gauge needle (Becton Dickinson, 305106 for oviduct) is used for recovery of embryos by flushing oviducts or uteri. Use a sharpening stone to make a blunt end on the needle.
2.3 Microscopes
Stereomicroscope with transmitted light for embryo collection.
Laser scanning confocal mounted on an inverted compound microscope with 5×, 10×, 20×, and 40× objectives. 5× or 10× “scanning” objectives are usually used dry and for identification and position samples. 3D time-lapse imaging of preimplantation mouse embryos routinely uses 20× or 40× (with oil) objectives for high-magnification imaging.
Computer workstation with image data acquisition and processing software.
3 Methods
3.1 Microscope Setup for Culturing and Imaging Mouse ES Cells and Preimplantation Embryos
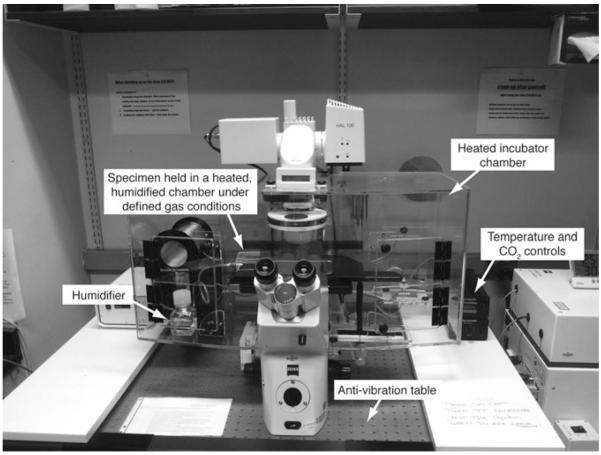
The environmental chamber setup on an inverted microscope should recapitulate in utero conditions as closely as possible, by maintaining the correct temperature, humidity, along with the right gas content that is required for mouse ES cell and preimplantation embryo development (Fig. 2).
Fig. 2.
Microscope setup for live imaging of early mouse embryos as well as in vitro ES cell cultures. Inverted microscopes with environmental chambers provide optimal conditions for ex utero and in vitro culture of mouse embryos and mouse ES cells
Before preparing ES cells or embryos, turn on the temperature control. Ensure that all the doors of the environmental chamber are tightly closed. It usually takes approximately 15–20′ for the chamber temperature to reach 37.5 °C and stabilize.
The CO2 controller can be turned on just prior to imaging. Calibrate the flow rate before using [NOTE 2].
3.2 Culturing and Imaging ES Cells
3.2.1 Preparation of Culturing Dish for Live Imaging ES Cultures (Fig. 3)
Fig. 3.
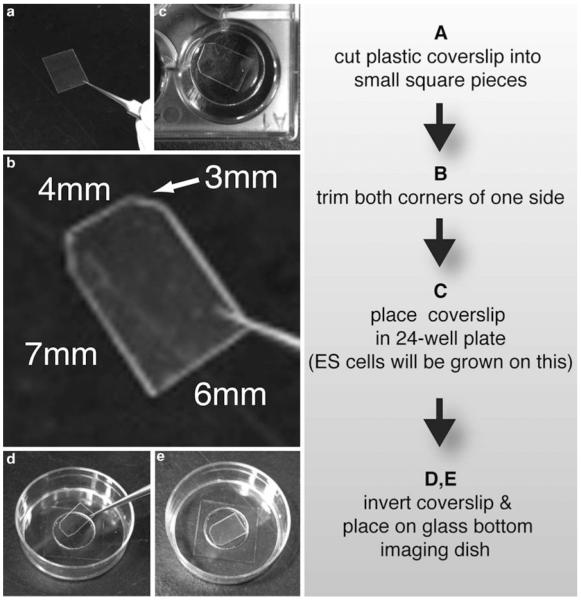
Preparation of dish for live imaging of ES cell cultures. (a) A plastic coverslip is cut to four equal size square pieces. (b) Both top corners of each square piece are then cut, resulting into a coverslip of hexagonal shape. (c) The coverslip is placed in the bottom of a well of a 24-well dish where ES cells can be cultured on top. (d) After ES cells have adhered and grown on top of the coverslip, this is then inverted and (e) placed on the bottom of a MatTek dish
Cut a plastic coverslip so that it can fit later into the bottom of a MatTek dish (see shape and dimensions in Fig. 3).
Place the cut coverslip in a well of a 24-well dish and coat with gelatin overnight [NOTE 3].
Aspirate gelatin and place with 4 × 10⁴ feeders. Once feeders have settled to the bottom of the well (usually after 3–4 h), then seed 4 × 10⁴ ES cells. If feeders are not used, ES cells can be seeded directly onto the gelatinized plastic coverslip.
After 12–24 h remove the plastic coverslip with forceps and place it inverted (i.e., with the cells facing downwards) in the bottom of a MatTek Dish. Gently add 3–4 ml of ES cell media so that it fully covers the bottom of the dish [NOTE 4]. Cover the drop completely with mineral oil to prevent evaporation. Place the dish for at least 30 min-1 h in the humidified microscope incubator at 37.5 °C, with 5 % CO2.
3.2.2 Live Imaging of ES Cell Cultures (Fig. 4)
Fig. 4.
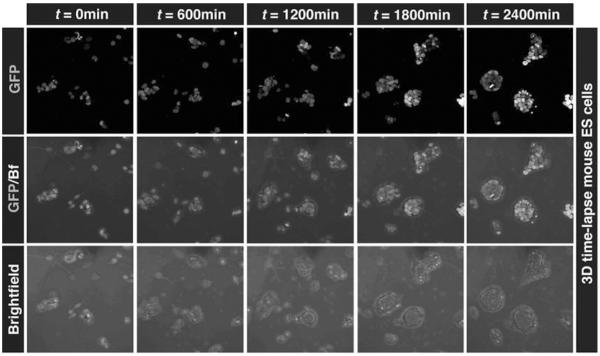
Time-lapse imaging of ES cell cultures. Our live imaging conditions allow live imaging of individual ES cells as they give rise to stem cell colonies. Panels show single time points from a 3D time-lapse movie of an ESC colony carrying a Nanog:H2B-GFP reporter growing in serum + LIF conditions
We try to minimize cell exposure to laser light by reducing laser power and exposure time, decreasing the frequency and/or increasing the size of the optical sections and scan speed. We usually acquire images every 15 min and image stacks of up to 80 μm with 2 μm intervals.
3.3 Culturing and Imaging Preimplantation Mouse Embryos
Before implantation, mouse embryos float freely as they have not yet developed any anchor or physical contact in utero. Therefore, in vitro culture of preimplantation embryos should provide closely resembling conditions as those in utero, particularly with respect to the appropriate media, temperature, and gas settings. These conditions are now largely well established, allowing proper development of preimplantation embryos ex utero.
3.3.1 Preparation of Ex Utero Culturing Dish for Mouse Preimplantation Embryos (Fig. 5)
Fig. 5.
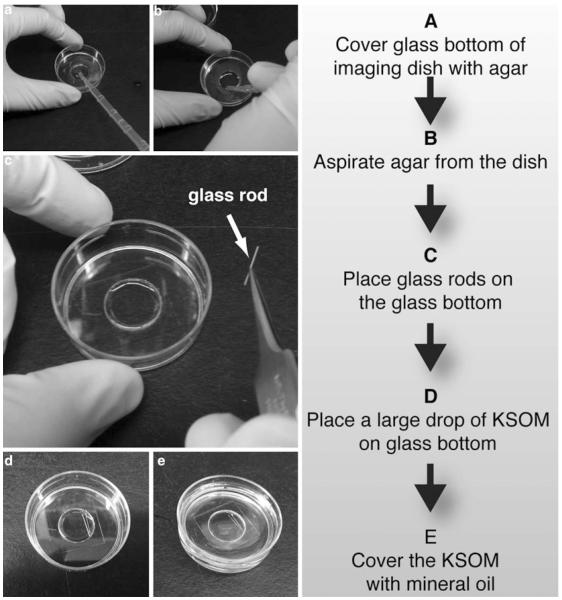
Preparation of culturing dish for live imaging of preimplantation mouse embryos. (a) A glass-bottom dish is covered with agar. (b) The dish is tilted and the agar is aspirated off. (c) After aspirating off the agar, the dish remains with a thin layer of agar. (d) The glass rod is fitted into the glass bottom of the dish. (e) A drop of KSOM medium is placed on the bottom of the dish and mineral oil is then added to cover the KSOM drop
The bottom of a MatTek dish for culture should be covered with an extremely thin layer of agar to prevent embryos without zona pellucida from sticking to the glass, as this would limit their proper development [NOTE 5].
Place 2–3 glass rods on top of the agar. These serve as holders for the embryos and keep them from floating away from the imaging field, during the time-lapse movie [NOTE 6].
Add a drop of KSOM to cover the glass bottom portion of the dish (~400 μl). Cover the drop completely with mineral oil to prevent evaporation. Place the dish in the humidified microscope incubator at 37.5 °C with preimplantation gas mixture (5 % CO2, 5 % O2 and 90 % N2) for at least 15 min so that the medium equilibrates.
3.3.2 Collection of Preimplantation Mouse Embryos
Before beginning the isolation of embryos, pre-warm M2 medium and acid Tyrode's solution at 37.5 °C.
After sacrificing a pregnant female mouse, dissect out the oviduct or uterus (depending on the desired stage of embryo). Place the tissue in a drop of M2.
Flush the oviduct/uterus with pre-warmed M2 medium. Use a 1 ml syringe with a 26-gauge needle (for uteri) or a blunt 30-gauge needle (for oviducts, insert into the infundibulum).
Collect embryos with a mouth pipette and wash with M2 to remove debris (usually pass through 1–3 drops of M2).
Prepare five drops of acid Tyrode's on a 10 cm Petri dish. Place embryos into the first drop briefly, then move to the second drop, and incubate for approximately 2 min. If the zona pellucida has not dissolved after this incubation, embryos should be transferred and incubated successively into the next drops (until the zona pellucida has completely dissolved) [NOTE 7].
Once the zona pellucida is removed, wash embryos in ~3 consecutive drops of M2.
3.3.3 Live Imaging of Preimplantation Mouse Embryos (Fig. 6)
Fig. 6.
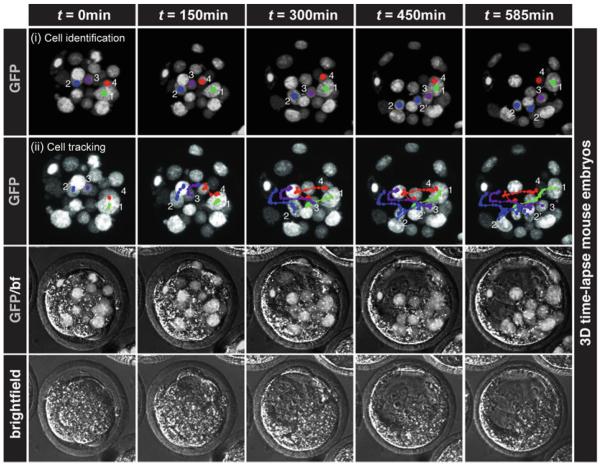
Time-lapse imaging of preimplantation mouse embryos. Our live imaging conditions allow for imaging of mouse embryos during preimplantation stages. Panels show single time points of 3D time-lapse movie of preimplantation embryos carrying a CAG:H2B-GFP reporter growing in KSOM medium from morula (~32-cell) to mid-blastocyst (~64-cell) stage. The nuclear-localized GFP signal provides single-cell resolution and facilitates cell tracking. (i) Identification of the H2B-GFP signal demarcating individual cells in the living embryo. (ii) The movements of individual cells are tracked using the nuclear-localized fluorescent signal. All panels represent 3D reconstructions of z-stacks acquired during time-lapse experiments
After the zona pellucida has been removed and thoroughly washed, place embryos close to the glass rods and position them on the microscope stage by using the 5× objective. With a mouth pipette, bring the embryos close together so that they can all be imaged in the same field.
Set up the parameters for embryo time-lapse imaging. Minimize embryo exposure to laser light by reducing laser power and exposure time, by decreasing the frequency and/or increasing the size of optical section and scan speed [NOTE 8].
3.4 Image Analysis and Tracking
High-quality image segmentation (e.g., the identification of individual cells, by virtue of their nuclear label) is an important prerequisite for performing downstream tasks comprising common image analysis pipelines. However, segmentation can be a daunting task because of cell deformation, irregularity in appearance, debris, imaging artifacts, and, most noticeably, noise and blurring. In practice, the quality of images varies depending on the imaging system, the nature of the sample, and the type of fluorescent reporter used.
Many segmentation methods have been exploited in the context of embryo data analysis. They each differ in their underlying image processing technique: deformable models (e.g., level set) (13, 14), blob or local maximum detection (15–17), watershed (18, 19), and Markov random field (e.g., graph cut) (20). They also differ in channels needed—both the nuclei and the membrane channels are always preferred for analysis, yet quite often the membrane channel is unavailable because of other experimental considerations. When cell shape can be qualitatively characterized, this information could be also incorporated to improve the segmentation quality (15, 21). These methods are mostly adjusted to specific imaging techniques and experimental conditions, often resulting in custom-made image processing methodologies; that, however, obscures a united comparison between these methodologies. Moreover, researchers interested in image analysis of their results implement algorithms in open-source software like ImageJ (http://rsbweb.nih.gov/ij/), Farsight (http://www.farsight-toolkit.org/wiki/Main_Page), Gofigure2 (http://sourceforge.net/), and ilastik (http://ilastik.org/). Since ImageJ was released in the first place, many researchers have been familiar with its usage and keep developing multiple plug-ins that are made available for the community and contain user manuals. The amount of plug-ins for ImageJ keeps on increasing and they are regularly updated (Table 1 shows a list of useful plug-ins for time-lapse imaging analysis). These are relatively simple methods, but most ofthem are purely manual or semi-automated, which is inapplicable given the huge amount of data generated during time-lapse imaging. Therefore, there is an increasing trend towards developing generic, trainable software frameworks based on machine learning approaches that can interact with biologists to solve a variety of problems (22, 23).
Table 1.
A selection of useful ImageJ plug-ins for analyzing time-lapse images
| Name | Description | Link |
|---|---|---|
| Manual tracking | Semi-automated movement and quantification of objects between frames of a temporal stack, in 2D and 3D | http://rsbweb.nih.gov/ij/plugins/track/track.html |
| MTrackJ | Manual tracking of moving objects in image sequences and measurement of basic track statistics | http://www.imagescience.org/meijering/software/mtrackj/ |
| MTrack2 | Manual tracking of moving objects in image sequences | http://valelab.ucsf.edu/~nico/IJplugins/MTrack2.html |
| Circadian gene expression (CGE) | Quantifying level of reporter expression by tracking individual cells | http://bigwww.epfl.ch/sage/soft/circadian/ |
Cell tracking is another challenging problem, mainly due to low temporal resolution, cell deformation, dense population, and, inevitably, segmentation errors (5). Early cell tracking methods were derived from classic tracking methods which exploited industrial video analysis (e.g., surveillance, motion recognition, traffic monitoring), which included level set (24–26), Kalman/particle filter (27, 28), and graph matching methods (29, 30). Realizing their limitations in capturing large displacement, complex mitosis events, and, most importantly, scalability, researchers are now switching to an association-based approach that is usually expressed as (integer) linear programming problem (31, 32). With the help of some powerful commercial solvers such as CPLEX and Gurobi, this approach has proven to be highly efficient in tracking even thousands of cells (21). To avoid tedious parameter tuning, an advanced machine learning technique has been developed, which automatically optimizes the tracking model using biologists' annotations of preferred tracks (33). Some algorithmic software packages are available, but they still need to be adapted and evaluated for application to cell tracking in mouse embryos and lineage reconstructions (30, 31, 33).
In summary, despite many encouraging advances in biomedical image analysis, cell segmentation remains the core problem in most image-processing pipelines. Cell tracking can be performed in a very robust manner by using machine learning and high-dimensional features, provided that high-quality segmentation is available. For this to be achieved, it will require combined efforts from multiple scientific disciplines: higher resolution microscopy from physicists, better reporters from biologists, and more intelligent algorithms from computer scientists should be provided.
4 Notes
Confocal images usually require imaging through less than 1.5 mm thick glass-bottom dishes.
CO2 is supplied through a humidifier bottle, which contains ddH2O. The flow amount and rate of CO2 are monitored through the bubbles generated in the humidifier. The proper amount of CO2 supplies should be determined empirically. For preimplantation embryos, 2–3 bubbles per seconds yield good results.
While adding gelatin, the plastic coverslip should not float; in fact, it can be pushed towards the bottom of the well with a tip.
ES cell medium must be added very gently so as to ensure that the coverslip is not removed from the bottom of the MatTek dish. If it does get removed, then it can be gently placed back with the help of a tip, taking however care not to disturb the cells.
Using a disposable plastic pipette, make a drop of melted agar on the glass bottom portion of the MatTek dish. Immediately afterwards, tilt the dish and aspirate off the agar. At the surrounding edge on the glass bottom, agar can accumulate and form a thicker layer than in the middle. This can be useful to fix the glass rod later.
Place the first glass rod across the glass bottom portion. Immobilize the glass rod by pushing one of its ends at the edge of the glass bottom where the agar is thicker. Then, place the second and third rods in close range. After setting up the dish on the microscope stage, place the embryos in between the rods and then reposition the rods in order to stabilize the embryos.
When culturing and imaging embryos from the morula stage, removing the zona pellucida is not recommended, since without zona pellucida, embryos tend to aggregate.
Optimal imaging conditions (exposure time, laser power, imaging frequency, imaging interval, etc.) should be optimized empirically. For preimplantation embryos, 2 μm imaging slices at 15-min time intervals with a low laser power generally yield good results. We routinely find that 5 % of a 6.1 A power for Argon lasers works well on our systems.
Acknowledgments
We thank Marilena Papaioannou for critical reading and comments on this chapter. Work in our laboratory is supported by the Human Frontiers Science Program (HFSP) and National Institutes of Health (RO1-HD052115 and RO1-DK084391).
References
- 1.Chambers I, et al. Nanog safeguards pluripotency and mediates germline development (Translated from eng) Nature. 2007;450(7173):1230–1234. doi: 10.1038/nature06403. in eng. [DOI] [PubMed] [Google Scholar]
- 2.Toyooka Y, Shimosato D, Murakami K, Takahashi K, Niwa H. Identification and characterization of subpopulations in undifferentiated ES cell culture (Translated from eng) Development. 2008;135(5):909–918. doi: 10.1242/dev.017400. in eng. [DOI] [PubMed] [Google Scholar]
- 3.Nowotschin S, Eakin GS, Hadjantonakis AK. Live-imaging fluorescent proteins in mouse embryos: multi-dimensional, multi-spectral perspectives (Translated from eng) Trends Biotechnol. 2009;27(5):266–276. doi: 10.1016/j.tibtech.2009.02.006. in eng. [DOI] [PMC free article] [PubMed] [Google Scholar]
- 4.Garcia MD, Udan RS, Hadjantonakis AK, Dickinson ME. Live imaging of mouse embryos (Translated from eng) Cold Spring Harb Protoc. 2011;2011(4) doi: 10.1101/pdb.top104. pdb top104 (in eng) [DOI] [PMC free article] [PubMed] [Google Scholar]
- 5.Schroeder T. Long-term single-cell imaging of mammalian stem cells (Translated from eng) Nat Methods. 2011;8(4 Suppl):S30–S35. doi: 10.1038/nmeth.1577. in eng. [DOI] [PubMed] [Google Scholar]
- 6.Hadjantonakis AK, Papaioannou VE. Dynamic in vivo imaging and cell tracking using a histone fluorescent protein fusion in mice (Translated from eng) BMC Biotechnol. 2004;4:33. doi: 10.1186/1472-6750-4-33. in eng. [DOI] [PMC free article] [PubMed] [Google Scholar]
- 7.Rhee JM, et al. In vivo imaging and differential localization of lipid-modified GFP-variant fusions in embryonic stem cells and mice (Translated from eng) Genesis. 2006;44(4):202–218. doi: 10.1002/dvg.20203. in eng. [DOI] [PMC free article] [PubMed] [Google Scholar]
- 8.Hadjantonakis AK, Dickinson ME, Fraser SE, Papaioannou VE. Technicolour transgenics: imaging tools for functional genomics in the mouse (Translated from eng) Nat Rev Genet. 2003;4(8):613–625. doi: 10.1038/nrg1126. in eng. [DOI] [PubMed] [Google Scholar]
- 9.Nowotschin S, Eakin GS, Hadjantonakis AK. Dual transgene strategy for live visualization of chromatin and plasma membrane dynamics in murine embryonic stem cells and embryonic tissues (Translated from eng) Genesis. 2009;47(5):330–336. doi: 10.1002/dvg.20500. in eng. [DOI] [PMC free article] [PubMed] [Google Scholar]
- 10.McDole K, Xiong Y, Iglesias PA, Zheng Y. Lineage mapping the pre-implantation mouse embryo by two-photon microscopy, new insights into the segregation of cell fates (Translated from eng) Dev Biol. 2011;355(2):239–249. doi: 10.1016/j.ydbio.2011.04.024. in eng. [DOI] [PMC free article] [PubMed] [Google Scholar]
- 11.Roeder AH, Cunha A, Burl MC, Meyerowitz EM. A computational image analysis glossary for biologists (Translated from eng) Development. 2012;139(17):3071–3080. doi: 10.1242/dev.076414. in eng. [DOI] [PubMed] [Google Scholar]
- 12.Locke JC, Elowitz MB. Using movies to analyse gene circuit dynamics in single cells (Translated from eng) Nat Rev Microbiol. 2009;7(5):383–392. doi: 10.1038/nrmicro2056. in eng. [DOI] [PMC free article] [PubMed] [Google Scholar]
- 13.Yu W, Lee HK, Hariharan S, Bu W, Ahmed S. Quantitative neurite outgrowth measurement based on image segmentation with topological dependence (Translated from eng) Cytometry A. 2009;75(4):289–297. doi: 10.1002/cyto.a.20664. in eng. [DOI] [PubMed] [Google Scholar]
- 14.Zanella C, et al. Cells segmentation from 3-D confocal images of early zebrafish embryo-genesis (Translated from eng) IEEE Trans Image Process. 2010;19(3):770–781. doi: 10.1109/TIP.2009.2033629. in eng. [DOI] [PubMed] [Google Scholar]
- 15.Bao Z, et al. Automated cell lineage tracing in Caenorhabditis elegans (Translated from eng) Proc Natl Acad Sci U S A. 2006;103(8):2707–2712. doi: 10.1073/pnas.0511111103. in eng. [DOI] [PMC free article] [PubMed] [Google Scholar]
- 16.Keller PJ, Schmidt AD, Wittbrodt J, Stelzer EH. Reconstruction of zebrafish early embryonic development by scanned light sheet microscopy (Translated from eng) Science. 2008;322(5904):1065–1069. doi: 10.1126/science.1162493. in eng. [DOI] [PubMed] [Google Scholar]
- 17.Keller PJ, et al. Fast, high-contrast imaging of animal development with scanned light sheet-based structured-illumination microscopy (Translated from eng) Nat Methods. 2010;7(8):637–642. doi: 10.1038/nmeth.1476. in eng. [DOI] [PMC free article] [PubMed] [Google Scholar]
- 18.Fernandez R, et al. Imaging plant growth in 4D: robust tissue reconstruction and lineaging at cell resolution (Translated from eng) Nat Methods. 2010;7(7):547–553. doi: 10.1038/nmeth.1472. in eng. [DOI] [PubMed] [Google Scholar]
- 19.Olivier N, et al. Cell lineage reconstruction of early zebrafish embryos using label-free nonlinear microscopy (Translated from eng) Science. 2010;329(5994):967–971. doi: 10.1126/science.1189428. in eng. [DOI] [PubMed] [Google Scholar]
- 20.Lou X, Kothe U, Wittbrodt J, Hamprecht FA. Learning to segment dense cell nuclei with shape prior. IEEE conference on computer vision and pattern recognition; Providence, RI, US. 2012. [Google Scholar]
- 21.Lou X, et al. Digital embryo lineage tree reconstructor. IEEE international sysmposium on biomedical imaging: from Nano to Macro; Chicago, IL, US. 2011. [Google Scholar]
- 22.Carpenter AE, et al. Cell profiler: image analysis software for identifying and quantifying cell phenotypes (Translated from eng) Genome Biol. 2006;7(10):R100. doi: 10.1186/gb-2006-7-10-r100. in eng. [DOI] [PMC free article] [PubMed] [Google Scholar]
- 23.Sommer C, Strahle C, Kothe U, Hamprecht FA. Interactive learning and segmentation toolkit. IEEE international symposium on biomedical imaging: from Nano to Macro; Chicago, IL, US. 2011. [Google Scholar]
- 24.Dufour A, et al. Segmenting and tracking fluorescent cells in dynamic 3-D microscopy with coupled active surfaces (Translated from eng) IEEE Trans Image Process. 2005;14(9):1396–1410. doi: 10.1109/tip.2005.852790. in eng. [DOI] [PubMed] [Google Scholar]
- 25.Li K, et al. Cell population tracking and lineage construction with spatiotemporal context (Translated from eng) Med Image Anal. 2008;12(5):546–566. doi: 10.1016/j.media.2008.06.001. in eng. [DOI] [PMC free article] [PubMed] [Google Scholar]
- 26.Dzyubachyk O, van Cappellen WA, Essers J, Niessen WJ, Meijering E. Advanced level-set-based cell tracking in time-lapse fluorescence microscopy (Translated from eng) IEEE Trans Med Imaging. 2010;29(3):852–867. doi: 10.1109/TMI.2009.2038693. in eng. [DOI] [PubMed] [Google Scholar]
- 27.Meijering E, Dzyubachyk O, Smal I, van Cappellen WA. Tracking in cell and developmental biology (Translated from eng) Semin Cell Dev Biol. 2009;20(8):894–902. doi: 10.1016/j.semcdb.2009.07.004. in eng. [DOI] [PubMed] [Google Scholar]
- 28.Smal I, Draegestein K, Galjart N, Niessen W, Meijering E. Particle filtering for multiple object tracking in dynamic fluorescence microscopy images: application to microtubule growth analysis (Translated from eng) IEEE Trans Med Imaging. 2008;27(6):789–804. doi: 10.1109/TMI.2008.916964. in eng. [DOI] [PubMed] [Google Scholar]
- 29.Li F, Zhou X, Ma J, Wong ST. Multiple nuclei tracking using integer programming for quantitative cancer cell cycle analysis (Translated from eng) IEEE Trans Med Imaging. 2010;29(1):96–105. doi: 10.1109/TMI.2009.2027813. in eng. [DOI] [PMC free article] [PubMed] [Google Scholar]
- 30.Liu M, et al. Adaptive cell segmentation and tracking for volumetric confocal microscopy images of a developing plant meristem (Translated from eng) Mol Plant. 2011;4(5):922–931. doi: 10.1093/mp/ssr071. in eng. [DOI] [PubMed] [Google Scholar]
- 31.Padfield D, Rittscher J, Roysam B. Coupled minimum-cost flow cell tracking for high-throughput quantitative analysis (Translated from eng) Med Image Anal. 2011;15(4):650–668. doi: 10.1016/j.media.2010.07.006. (in eng). Chicago, IL, US. [DOI] [PubMed] [Google Scholar]
- 32.Kanade T, et al. Cell image analysis: algorithms, systems and applications. IEEE workshop on application of computer visions (WACV).2011. [Google Scholar]
- 33.Lou X, Hamprecht FA. Neural information processing systems (NIPS) Granada, Spain: 2011. Structured learning for cell tracking. [Google Scholar]


