Abstract
The biological effects of interleukin (IL)-1 are realized through binding to specific membrane-bound receptors. The efficiency of IL-1 action depends on the number of receptors on the cell. We determined the percentage of cells that express IL-1 receptor type I (IL-1RI) and IL-1 receptor type II (IL-1RII) by flow cytometry using phycoerythrin (PE)-labelled antibodies to the IL-1Rs, and the mean absolute number of membrane-bound IL-1Rs per cell using QuantiBRITE PE calibration beads. We showed that different subpopulations of immunocompetent cells expressed different numbers of molecules of membrane-bound IL-1RI and IL-1RII. We also established that when cells were stimulated with bacterial lipopolysaccharide, there was a significant increase in the number of IL-1RI expressed, and a significant decrease in the mean number of IL-1RII molecules per cell. Determination of the mean number of membrane-bound IL-1R molecules using this protocol enables us to obtain precise and reproducible data that are necessary for full evaluation of expression levels.
Keywords: Flow cytometry, Interleukin-1 receptor, Quantitative analysis, Peripheral blood mononuclear cells
Introduction
Interleukin-1 (IL-1) is an inflammatory cytokine with a wide range of biological and physiological effects. For example, it plays a central role in acute and chronic inflammation (Dinarello 1991, 2010). The biological effects of IL-1 are realized upon binding of the cytokine to the specific membrane-bound IL-1 type I receptor (IL-1RI) (Colotta et al. 1993; Sims et al. 1993; Stylianou et al. 1992). IL-1RI is a glycoprotein with a molecular mass of 80 kDa and is expressed predominantly on endothelial cells, smooth muscle cells, epithelial cells, hepatocytes, fibroblasts, keratinocytes, epidermal dendritic cells, and T lymphocytes (Dinarello 2001; Dower et al. 1985). A second type of IL-1 receptor, the IL-1 type II receptor (IL-1RII), is not capable of signal transfer, that is, it acts as a “decoy” receptor (Colotta et al. 1993; Mantovani et al. 2001). IL-1RII is a glycoprotein with a molecular mass of 60 kDa and is expressed on monocytes, neutrophils, and B lymphocytes (Mantovani et al. 2001; Matsushima et al. 1986).
It has been demonstrated that the biological activity of ligands is related to the density of receptors on the cell surface (Gudipaty et al. 2001; Moraga et al. 2009; Reynes et al. 2000). Investigation of the expression of membrane-bound IL-1R has been evaluated mainly by determining the percentage of cells that express this receptor or the fluorescence intensity indices (MFI, mean fluorescence intensity) of labelled antibodies against the receptor (Donati et al. 1997). However, research by MFI values does not allow obtaining uniform data from different laboratories and level of expression will change depending on flow cytometer. Also, it seems to be important to investigate the density of membrane-bound IL-1Rs on cells, because the efficacy of IL-1 might depend on this. Such data can only be obtained by determining the number of membrane-bound receptors on particular cells.
Most of the current methods for the quantitative evaluation of cell surface receptors by flow cytometry use commercial calibration beads. One of these kits is QuantiBRITE PE (BD Biosciences, San Jose, CA, USA), which enables determination of the absolute number of cell surface receptors using a known fluorochrome molecule/antibody ratio of 1:1.
In the study reported here in, we developed an optimized protocol for determining the expression level of IL-1RI and II using the QuantiBRITE PE kit, as well as estimating quantitatively the number of membrane-bound receptors on various subpopulations of immunocompetent cells from healthy donors.
Materials and methods
Blood samples
Whole blood samples were obtained from Blood Banking Station No. 1 of the “Novosibirsk Blood Center”. The samples were obtained from 150 healthy donors (83 male, 67 female; mean age: 34 ± 1 years) in Novosibirsk city (Southwestern Siberia, Russia). Peripheral blood samples (9 mL) were taken from the ulnar vein, under strict sterile conditions, in a VACUETTE blood collection system that contained the anticoagulant lithium heparin (Greiner Bio-One, Kremsmünster, Austria). Voluntary informed consent was obtained from all donors and the study was approved by the local ethics committee.
Isolation and cultivation of mononuclear cells
Mononuclear cells were isolated on a Ficoll density gradient (1.077 g/cm3) and then washed twice in RPMI-1640 culture medium (Biolot, St Petersburg, Russia) (Böyum 1968). Peripheral blood mononuclear cells (PBMCs; 2 × 10⁶/mL) were cultivated in 96-well round-bottom plates (TPP Techno Plastic Products AG, Trasadingen, Switzerland) in the presence or absence of Escherichia coli 055:B5 lipopolysaccharide (LPS; Sigma-Aldrich, St. Louis, MO, USA) at a final concentration of 200 ng/mL for 24 h. Cells were cultured in RPMI-1640 medium that contained 10 % fetal calf serum, 2 mM l-glutamine, 10 mM HEPES buffer, 0.5 mM 2-mercaptoethanol, 80 μg/mL gentamycin, and 100 μg/mL benzylpenicillin for 24 h in 5 % CO2 at 37 °C.
Reagents
The following phycoerythrin (PE)-labelled antibodies were used in the study: PE-conjugated goat polyclonal anti-human IL-1RI (cat. no. FAB269P; R&D Systems, Minneapolis, MN, USA) and PE-conjugated mouse monoclonal anti-human IL-1RII (cat. no. FAB663; R&D Systems). We have analyzed these antibodies by spectrophotometer method (Stadnichuk 1990) and established that only one molecule of PE was bound with one molecule of immunoglobulin, i.e. PE:Ab ratio was equal to 1:1. The following antibodies were used to immunophenotype PBMC subpopulations: FITC-conjugated mouse monoclonal anti-human CD14 (cat. no. 11-0149; eBioscience, San Diego, CA, USA), APC-conjugated mouse monoclonal anti-human CD3 (cat. no. 17-0037; eBioscience), and PE-Cy7-conjugated mouse monoclonal anti-human CD19 (cat. no. 25-0199; eBioscience). To minimize non-specific staining, we used human IgG (SIC Microgen, Moscow, Russia) at a final concentration of 3 mg/mL. To dilute the human IgG and also the QuantiBRITE beads (BD Biosciences, San Jose, CA, USA), 1x PBS (137 mM NaCl, 2.68 mM KCl, 10 mM Na2HPO4 12H2O, 1.47 mM KH2PO4, 0.53 mM EDTA and 0.1 % NaN3) with 1 % bovine serum albumin (BSA; Sigma-Aldrich) was used.
Calibration beads
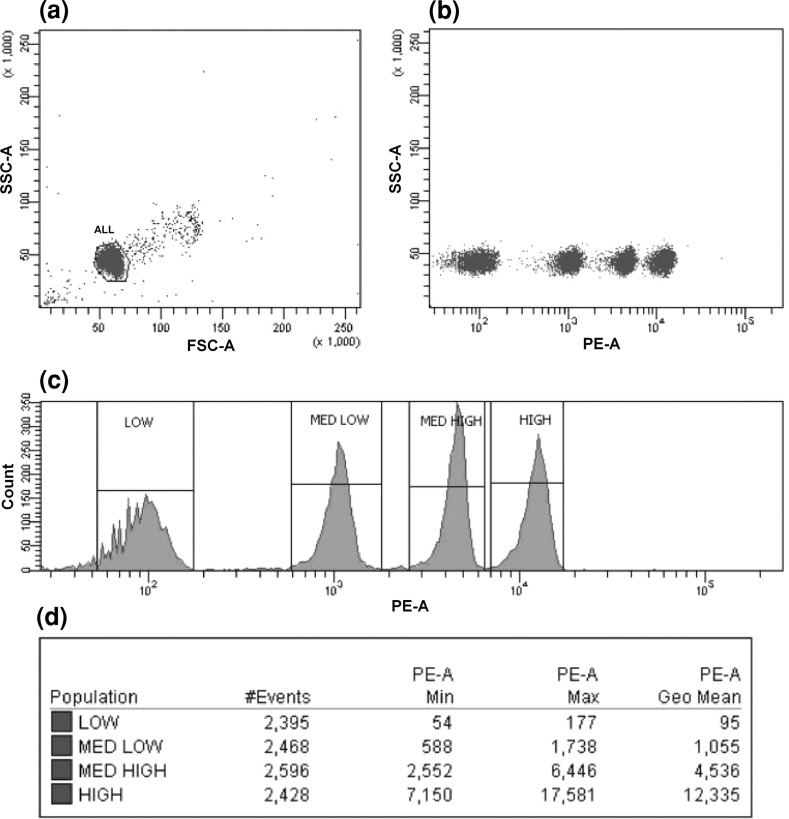
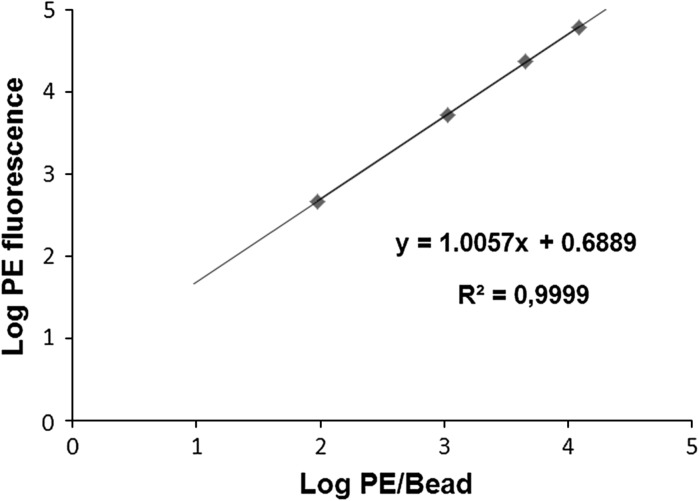
To estimate the absolute number of membrane-bound molecules of IL-1R, we used QuantiBRITE PE beads. Tubes of QuantiBRITE PE beads contain a lyophilized pellet of beads that have been conjugated with four concentrations of PE. Each type of beads has a known number of PE molecules per bead. Using this kit, we plotted a calibration curve and established a formula that enabled MFI values to be converted into the number of receptor molecules on a cell. The beads in a single tube were reconstituted in 500 μL of PBS, mixed, and analyzed by flow cytometry. Bead singlets were gated on an FSC-A/SSC-A dot plot and 10,000 gating events were recorded. Interval gates were adjusted on PE-associated fluorescence histogram around each of four bead peaks (Low, Med Low, Med High, High). The analysis of QuantiBRITE PE calibration beads is shown in Fig. 1. Log10 values for PE fluorescence geometric means and for values of PE molecules per bead (information provided with QuantiBRITE PE beads) were calculated. Using the values obtained, we plotted the log10 values for the number of PE molecules per bead against the log10 values for fluorescence intensity (Fig. 2). The formula obtained could be used subsequently to calculate the absolute number of receptors on subpopulations of cells. To obtain the fluorescence intensity values for the different subpopulations of cells, flow cytometry was performed using the same voltage parameters for the photomultiplier as those used for the analysis of the QuantiBRITE PE calibration beads. Given that the PE/antibody ratio was 1:1, PE/antibody values could be converted to antibody/cell values, which represented the number of receptors per cell.
Fig. 1.
Analysis of QuantiBRITE PE calibration beads. a Gate around the bead singlet on a dot plot of FSC versus SSC. b The bead singlets on a dot plot of PE versus SSC. c PE-associated fluorescence histogram of log values for the singlet bead populations. Interval gates were adjusted around the each of four bead peaks (Low, Med Low, Med High, High). d Statistics
Fig. 2.
Plot of linear regression of log10 values for the number of PE molecules per bead (x axis) against log10 fluorescence (y axis)
Immunostaining
To enable the reproducible determination of the level of expression of membrane-bound IL-1 receptors, we optimized the protocol for sample preparation. The optimized protocol was as follows. A freshly separated suspension of PBMCs was centrifuged for 10 min at 1,300 rpm and room temperature. Cells were washed twice in 1 mL of PBS with 1 % BSA. Subsequently, 25 μL of cells (1 × 10⁵) and 1 μL (3 μg) of human IgG were combined in marked 12 × 75-mm flow tubes, and incubated in the dark at room temperature for 20 min. The IgG was added to block Fc receptors and prevent nonspecific binding of Fc fragments. A saturating concentration of anti-IL-1RI and anti-IL-1RII antibodies was added, which was equal to 10 μL of each; this had been established previously by means of titration. Finally, we added 1 μL of anti-CD3 APC, anti-CD14 FITC, and anti-CD19 PE-Cy7 antibodies for immunophenotyping of the PBMC subpopulations. The cells and antibodies were incubated for 40 min at 4 °C in the dark. The cells were then washed twice to remove unbound antibodies in 1 mL of PBS with 1 % BSA. Subsequently, 100 μL of PBS were added to the tubes and the contents were analyzed immediately by flow cytometry without fixation.
Flow cytometry
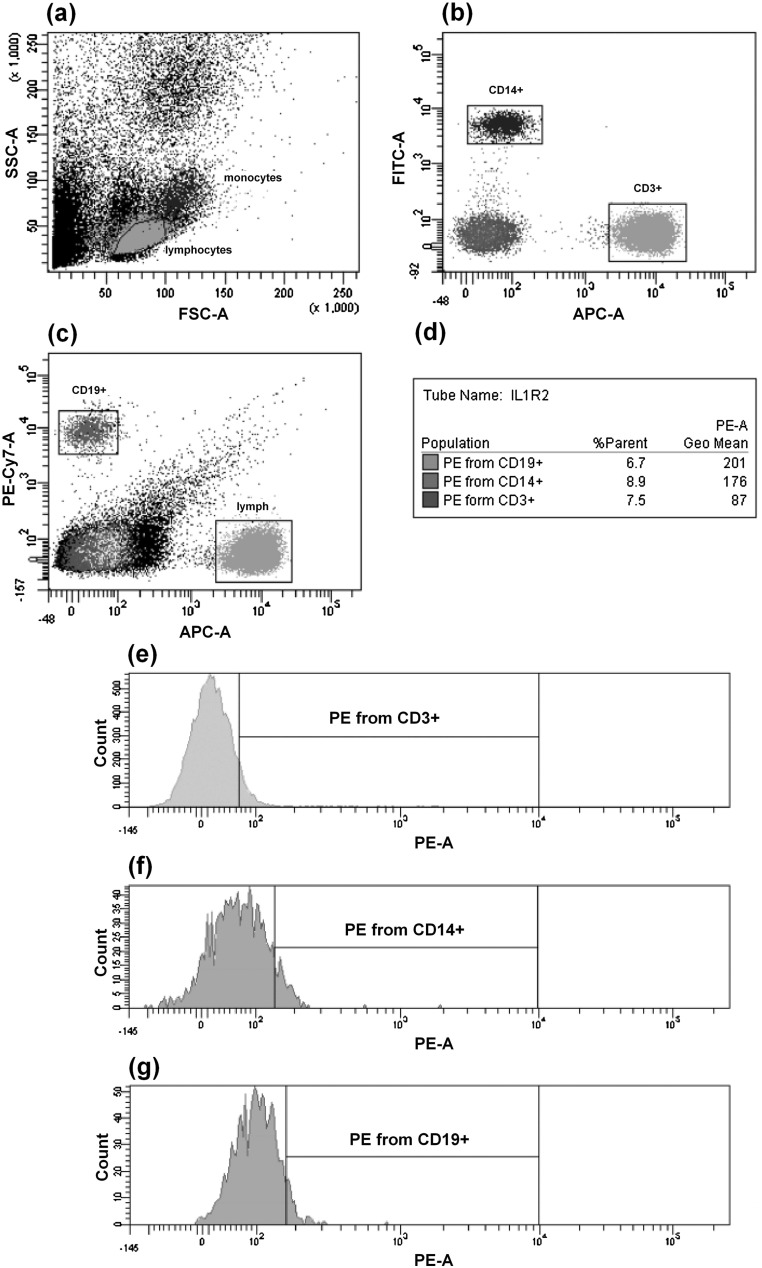
Flow cytometric analysis was performed using a BD FACSAria flow cytometer (equipped with three lasers—488, 633, and 405 nm) with FACSDiva software version 6.1.2 (BD Biosciences). To check the installation settings, we regularly made performance checks by means of Cytometer Setup and Tracking (CS&T) beads (BD Biosciences). We chose an appropriate cytometer configuration, and set the voltage parameters for the photomultiplier to be the same as those used for the analysis of the QuantiBRITE PE calibration beads. We gated the populations to be analyzed on the basis of indices of forward and side scattering (FSC-A/SSC-A dot plot) that were located within the lymphocytic and monocytic regions. Subsequently, we gated subpopulations of CD3+ T lymphocytes, CD19+ B lymphocytes and CD14+ monocytes (dot plots APC-A/FITC-A and APC-A/PE-Cy7-A) on the basis of markers of the different subpopulations. A minimum of 10,000 events were gated. Then, we established an interval gate on the control histogram, which was obtained with samples incubated in the absence of anti-human IL-1RI and IL-1RII antibodies, and subsequently, determined percent of positive events and mean fluorescence of cells carrying membrane-bound receptors for each of these subpopulations on PE/count histograms. An outline of the standard gating protocol is given in Fig. 3.
Fig. 3.
Dot plots and histograms representing a standard gating protocol. a Gates around lymphocytes and monocytes on an FSC versus SSC dot plot. b Gates around CD3+ and CD14+ cells on an APC CD3 versus FITC CD14 dot plot. c Gates around CD3+ and CD19+ cells on an APC CD3 versus PE-Cy7 CD19 dot plot. d Statistical analysis. e Histogram of IL-1RII PE from CD3+ T lymphocytes. f Histogram of IL-1RII PE from CD14+ monocytes. g Histogram of IL-1RII PE from CD19+ B lymphocytes. Interval gates were adjusted using isotype control sample
Statistical analysis
Statistical analysis was carried out using STATISTICA 7.0 (StatSoft, Tulsa, OK, USA). Data obtained were checked for normality of distribution (Kolmogorov–Smirnov and Shapiro–Wilk tests), and all distributions were normal. To compare results, we used a parametric Student’s t test. All differences were considered significant at P < 0.05.
Results
Expression of membrane-bound IL-1Rs on subpopulations of intact PBMCs
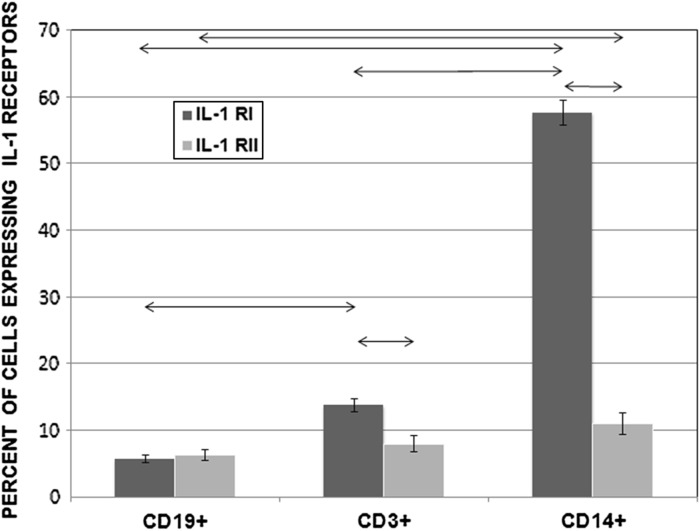
We determined the percentage of cells that expressed surface IL-1Rs in different subpopulations of intact PMBCs using PE-labelled antibodies. In CD14+ monocytes, 57.56 ± 1.89 % of cells expressed IL-1RI and 10.96 ± 1.64 % expressed IL-1RII. In the CD3+ T lymphocyte subpopulation, 13.74 ± 0.97 % of cells expressed IL-1RI and 7.97 ± 1.20 % expressed IL-1RII. In the CD3−/CD19+ B lymphocyte subpopulation, 5.72 ± 0.54 % of cells expressed IL-1RI and 6.33 ± 0.81 % expressed IL-1RII. Results are shown in Fig. 4.
Fig. 4.
Percentages of CD19+, CD3+, and CD14+ cells that expressed IL-1RI and IL-1RII among PBMCs from healthy donors (n = 150). Data are shown as the mean and standard error of mean (M ± SEM). Arrows on the figure indicate significant difference, P < 0.05
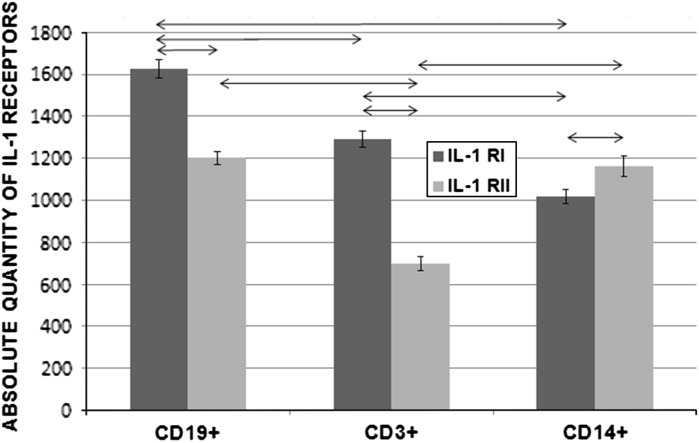
The mean number of membrane-bound IL-1Rs per cell was determined with the aid of BD Quantibrite PE calibration beads. When PBMC subpopulations were compared, the lowest levels of IL-1RI and IL-1RII were found in monocytes and T lymphocytes, respectively, and these differences were significant (P < 0.05). Each subpopulation had a different mean number of IL-1RI and IL-1RII molecules on the cells. Results are shown in Fig. 5.
Fig. 5.
Absolute numbers of IL-1RI and IL-1RII molecules on CD19+, CD3+, and CD14+ subpopulations of PBMCs from healthy donors (n = 150). Data are shown as the mean and standard error of mean (M ± SEM). Arrows on the figure indicate significant difference, P < 0.05
Expression of membrane-bound IL-1Rs on monocyte subpopulations cultured with and without LPS
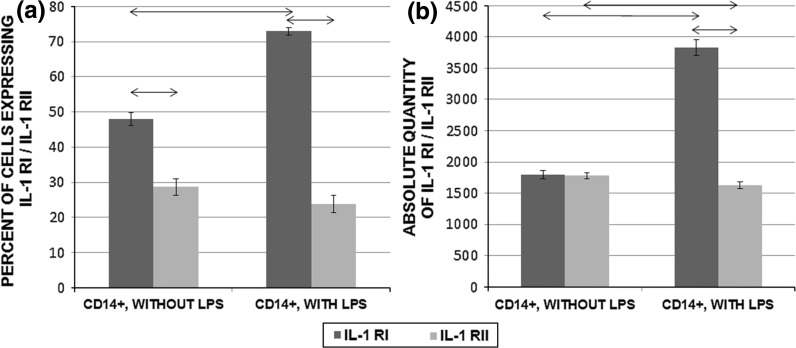
Mononuclear cells from PBMCs from healthy donors were cultured in the presence or absence of the mitogen LPS from E. coli serotype 055:B5. We estimated both the percentage of CD14+IL-1R+ cells and the absolute number of molecules of IL-1R on CD14+ cells. LPS-stimulated cells showed a significant increase in the relative percentage of IL-1RI-positive cells and the absolute number of molecules of IL-1RI as compared with unstimulated cells (P < 0.05). In contrast, there was a decrease in the percentage of cells that expressed IL-1RII and a significant decrease in the absolute number of molecules of IL-1RII (P < 0.05) in cells stimulated with LPS as compared with unstimulated cells. Results are shown in Fig. 6. Also significant differences were established between expression levels of intact CD14+ cells and CD14+ cells in unstimulated PBMCs culture by percent of IL-1R+ cells and absolute number of IL1Rs per cell (P < 0.05).
Fig. 6.
Expression of membrane-bound IL-1RI and IL-RII on monocyte subpopulations in PBMCs (2 × 10⁶/mL) cultured in the presence or absence of E. coli 055:B5 LPS (200 ng/mL) for 24 h (n = 150). a Percentage of CD14+ cells that expressed IL-1RI and IL-1RII among PBMCs cultured with or without LPS. b Absolute number of IL-1RIs and IL-1RII molecules on populations of CD14+ cells in PBMCs cultured with or without LPS. Data are shown as the mean and standard error of mean (M ± SEM). Arrows on the figure indicate significant difference, P < 0.05
Discussion
Standard methods for determining the expression of surface markers on the basis of the percentage of positive cells or fluorescence intensity characteristics seem to be insufficiently informative. In the light of studies that have suggested that the functional response of a cell to a ligand depends on the density of receptors on the cell surface (Gudipaty et al. 2001; Moraga et al. 2009; Reynes et al. 2000), investigating the mean number of receptors on a cell seems to be necessary to obtain more complete information about the expression of membrane-bound receptors and, consequently, ligand activity.
There are several methods for quantitating the number of membrane-bound molecules on the cell surface. In flow cytometry, fluorochrome calibration particles are used most frequently (D’hautcourt 2002; Rossmann et al. 2007). There are also methods based on the kinetics of binding of antibodies with the receptor (Orlova et al. 2011) and on usage of 125I-radiolabelled ligand (Takeuchi et al. 1999). In the present study, we used commercial calibration beads, QuantiBRITE PE, in conjunction with flow cytometry (Jasper et al. 2011; Pannu et al. 2001; Wang et al. 2011). The main advantages of this method are that it is informative, simple in execution and calculation, absence of radioactive labels and easily reproducible. The main drawback is that the level of antigen expression can only be determined using PE-labelled antibodies, because the manufacturer does not provide calibration beads conjugated with other types of fluorochrome.
In the present study, we developed a protocol to determine the absolute number of IL-1Rs on the cell surface using flow cytometry with QuantiBRITE PE calibration beads. To maximize the stability and reproducibility of the protocol, we determined optimal conditions for temperature, incubation time, and number of washings. By titration, we determined the concentration of antibodies required for saturation of receptors on the cell surface. To decrease non-specific binding of Fc fragments on the cell surface, we determined the optimal blocking conditions: incubation temperature, incubation conditions, and IgG concentration. Thus, we developed an optimized protocol for analysis of the expression level of membrane-bound IL-1Rs on different cell subpopulations, enabling stable and reproducible results to be obtained for both intact PBMCs and cell cultures.
Using this protocol, we investigated the expression levels of membrane-bound IL-1Rs on different subpopulations of PBMCs from healthy donors. By analysing the IL-1R levels using the same settings for the flow cytometer as those used for analysis of the calibration beads, it was possible to convert fluorescence intensity values into the number of PE molecules per cell on the basis of the known PE/antibody ratio (1:1).
In our analysis of the phenotypic characteristics of intact PBMCs from healthy donors, we observed quantitative differences among the subpopulations of T and B lymphocytes and monocytes with regard to the percentage of cells that carried IL-1RI and IL-1RII, and the absolute number of receptors on the cells. When subpopulations of PBMCs were compared, we observed that CD14+ monocytes had the greatest percentage of cells that carried IL-1RI, but the lowest number of IL-1RI molecules per cell. The opposite situation was found for the CD19+ population, which had the lowest percentage of cells expressing IL-1RI but the greatest density of these receptors per cell. We conclude that the percentage of cells that express IL-1Rs is not always associated with the absolute number of receptors.
In the course of the present study, we also investigated the expression level of membrane-bound IL-1RI and IL-1RII in cells stimulated with LPS from E. coli (serotype 055:B5). The expression level of IL-1Rs under these conditions was estimated on the monocyte subpopulation in PBMCs. This population was chosen because we had shown that they had the highest percentage of cells expressing IL-1RI and IL-RII. We found that LPS stimulation of CD14+ monocytes increased both the percentage of cells that expressed IL-1RI and the number of these receptors on the cells. In contrast, LPS lowered the mean number of IL-1RII molecules on the cells significantly and tended to decrease the percentage of cells that carried these receptors. Our results are in agreement with previous studies that have demonstrated that LPS increases the expression of IL-1RI and decreases the expression of IL-1RII, as determined by mRNA analysis (Penton-Rol et al. 1999; Saccani et al. 1998). When comparing intact CD14+ cells and unstimulated CD14+ cells cultivated within 24 h, an increase in the number of IL-1RIs and IL1R-IIs is noted. Also, decrease in percent of IL-1RI+ cells and increase in percent of IL-1RII+ cells were shown. Most likely, these alterations in IL-1Rs expression were caused by an effect of microenvironment changes in culture.
Our results show that different subpopulations of immunocompetent cells express different numbers of membrane-bound IL-1RI and IL-1RII, and this might not always correlate with the percentage of cells that carry these receptors.
In conclusion, we have designed an optimal protocol for estimating the expression level of membrane-bound IL-1Rs, with the aid of QuantiBRITE PE calibration beads. Determination of the mean number of membrane-bound molecules of IL-1Rs using this protocol enables us to obtain precise and reproducible data that are required for the more complete and informative estimation of receptor expression levels.
Acknowledgments
This study was supported by the Federal Target Program “Scientific and scientific-pedagogical personnel of innovative Russia” for 2009–2013 (state contract no. 02.740.11.0707).
Contributor Information
Filipp Filippovich Vasilyev, Email: vasilyevmd@gmail.com.
Julia Anatolievna Lopatnikova, Email: lopatnikova_j_a@ngs.ru.
Sergey Vitalievich Sennikov, Phone: +7-3832-221910, FAX: +7-3832-227028, Email: sennikovsv@gmail.com.
References
- Böyum A (1968) Separation of leukocytes from blood and bone marrow. Introduction. Scand J Clin Lab Invest Suppl 97:7 [PubMed]
- Colotta F, Re F, Muzio M, Bertini R, Polentarutti N, Sironi M, Giri JG, Dower SK, Sims JE, Mantovani A. Interleukin-1 type II receptor: a decoy target for IL-1 that regulated by IL-4. Science. 1993;261:472–475. doi: 10.1126/science.8332913. [DOI] [PubMed] [Google Scholar]
- D’hautcourt JL (2002) Quantitative flow cytometric analysis of membrane antigen expression. Curr Protoc Cytom 6.12.1–6.12.22 [DOI] [PubMed]
- Dinarello CA. Interleukin-1 and interleukin-1 antagonism. Blood. 1991;77:1627–1652. [PubMed] [Google Scholar]
- Dinarello CA. IL-1 receptor type I. In: Oppenheim JJ, Feldmann M, Durum SK, Hirano T, Vilcek J, Nicola NA, editors. Cytokine reference. Volume 2: receptors. London: Academic Press; 2001. pp. 1587–1600. [Google Scholar]
- Dinarello CA. IL-1: discoveries, controversies and future directions. Eur J Immunol. 2010;40:599–606. doi: 10.1002/eji.201040319. [DOI] [PubMed] [Google Scholar]
- Donati D, Degiannis D, Mazzola E, Gastaldi L, Raskova J, Raska KJ, Camussi G. Interleukin-1 receptors and receptor antagonist in haemodialysis. Nephrol Dial Transplant. 1997;12:111–118. doi: 10.1093/ndt/12.1.111. [DOI] [PubMed] [Google Scholar]
- Dower SK, Kronheim SR, March CJ, Conion PJ, Hopp TP, Gillis S, Urdal DL. Detection and characterization of high affinity plasma membrane receptors for human interleukin 1. J Exp Med. 1985;162:501–515. doi: 10.1084/jem.162.2.501. [DOI] [PMC free article] [PubMed] [Google Scholar]
- Gudipaty L, Humphreys BD, Buell G, Dubyak GR. Regulation of P2X(7) nucleotide receptor function in human monocytes by extracellular ions and receptor density. Am J Physiol Cell Physiol. 2001;280:C943–C953. doi: 10.1152/ajpcell.2001.280.4.C943. [DOI] [PubMed] [Google Scholar]
- Jasper GA, Arun I, Venzon D, Kreitman RJ, Wayne AS, Yuan CM, Marti GE, Stetler-Stevenson M. Variables affecting the quantitation of CD22 in neoplastic B cells. Cytometry B Clin Cytom. 2011;80:83–90. doi: 10.1002/cyto.b.20567. [DOI] [PMC free article] [PubMed] [Google Scholar]
- Mantovani A, Locati M, Vecchi A, Sozzani S, Allavena P. Decoy receptors: a strategy to regulate inflammatory cytokines and chemokines. Trends Immunol. 2001;22:328–336. doi: 10.1016/S1471-4906(01)01941-X. [DOI] [PubMed] [Google Scholar]
- Matsushima K, Akahoshi T, Yamada M, Furutani Y, Oppenheim JJ. Properties of a specific interleukin 1 (IL1) receptor on human Epstein Barr virus-transformed B lymphocytes: identity of a receptor for IL 1-alpha and IL 1-beta. J Immunol. 1986;136:4496–4502. [PubMed] [Google Scholar]
- Moraga I, Harari D, Schreiber G, Uzé G, Pellegrini S. Receptor density is key to the Alpha2/Beta interferon differential activities. Mol Cell Biol. 2009;29:4778–4787. doi: 10.1128/MCB.01808-08. [DOI] [PMC free article] [PubMed] [Google Scholar]
- Orlova DY, Borisov VI, Kozhevnikov VS, Maltscev VP, Chernyshev AV. Distribution function approach to the study of the kinetics of IgM antibody binding to FcγRIIIb (CD16b) receptors on neutrophils by flow cytometry. J Theor Biol. 2011;290:1–6. doi: 10.1016/j.jtbi.2011.08.026. [DOI] [PubMed] [Google Scholar]
- Pannu KK, Joe ET, Iyer SB. Performance evaluation of QuantiBRITE phycoerythrin beads. Cytometry. 2001;45:250–258. doi: 10.1002/1097-0320(20011201)45:4<250::AID-CYTO10021>3.0.CO;2-T. [DOI] [PubMed] [Google Scholar]
- Penton-Rol G, Orlando S, Polentarutti N, Bernasconi S, Muzio M, Introna M, Mantovani A. Bacterial lipopolysaccharide causes rapid shedding, followed by inhibition of mRNA expression, of the IL-1 type II receptor, with concomitant up-regulation of the type I receptor and induction of incompletely spliced transcripts. J Immunol. 1999;162:2931–2938. [PubMed] [Google Scholar]
- Reynes J, Portales P, Segondy M, Baillat V, André P, Réant B, Avinens O, Couderc G, Benkirane M, Clot J, Eliaou JF, Corbeau P. CD4 + T cell surface CCR5 density as a determining factor of virus load in persons infected with human immunodeficiency virus type 1. J Infect Dis. 2000;181:927–933. doi: 10.1086/315315. [DOI] [PubMed] [Google Scholar]
- Rossmann ED, Lenkei R, Lundin J, Mellstedt H, Osterborg A. Performance of calibration standards for antigen quantitation with flow cytometry in chronic lymphocytic leukemia. Cytometry B Clin Cytom. 2007;72:450–457. doi: 10.1002/cyto.b.20359. [DOI] [PubMed] [Google Scholar]
- Saccani S, Polentarutti N, Penton-Rol G, Sims JE, Mantovani A. Divergent effects of LPS on expression of IL-1 receptor family members in mononuclear phagocytes in vitro and in vivo. Cytokine. 1998;10:773–780. doi: 10.1006/cyto.1998.0359. [DOI] [PubMed] [Google Scholar]
- Sims JE, Gayle MA, Slack JL, Alderson MR, Bird TA, Giri JG, Colotta F, Re F, Mantovani A, Shanebeck K, Grabstein KH, Dower SK. Interleukin 1 signaling occurs exclusively via the type I receptor. Proc Natl Acad Sci USA. 1993;90:6155–6159. doi: 10.1073/pnas.90.13.6155. [DOI] [PMC free article] [PubMed] [Google Scholar]
- Stadnichuk IN. Phycobiliproteins. Moscow: VINITI; 1990. [Google Scholar]
- Stylianou E, O’Neill LA, Rawlinson L, Edbrooke MR, Woo P, Saklatvala J. Interleukin 1 induces NF-kappa B through its type I but not its type II receptor in lymphocytes. J Biol Chem. 1992;267:15836–15841. [PubMed] [Google Scholar]
- Takeuchi M, Nagai S, Tsutumi T, Mio T, Izumi T. The number of interleukin 1 receptors on lung fibroblasts in patients with idiopathic pulmonary fibrosis. Respiration. 1999;66:236–241. doi: 10.1159/000029384. [DOI] [PubMed] [Google Scholar]
- Wang L, Abbasi F, Jasper GA, Kreitman RJ, Liewehr DJ, Marti GE, Stetler-Stevenson M. Variables in the quantification of CD4 in normals and hairy cell leukemia patients. Cytometry B Clin Cytom. 2011;80:51–56. doi: 10.1002/cyto.b.20541. [DOI] [PMC free article] [PubMed] [Google Scholar]


