Abstract
Objective
We assessed the level of students' test anxiety, and the relationship between test anxiety and academic performance.
Methods
We recruited 166 third-quarter students. The Test Anxiety Inventory (TAI) was administered to all participants. Total scores from written examinations and objective structured clinical examinations (OSCEs) were used as response variables.
Results
Multiple regression analysis shows that there was a modest, but statistically significant negative correlation between TAI scores and written exam scores, but not OSCE scores. Worry and emotionality were the best predictive models for written exam scores. Mean total anxiety and emotionality scores for females were significantly higher than those for males, but not worry scores.
Conclusion
Moderate-to-high test anxiety was observed in 85% of the chiropractic students examined. However, total test anxiety, as measured by the TAI score, was a very weak predictive model for written exam performance. Multiple regression analysis demonstrated that replacing total anxiety (TAI) with worry and emotionality (TAI subscales) produces a much more effective predictive model of written exam performance. Sex, age, highest current academic degree, and ethnicity contributed little additional predictive power in either regression model. Moreover, TAI scores were not found to be statistically significant predictors of physical exam skill performance, as measured by OSCEs.
Key Indexing Terms: Chiropractic, Education, Performance Anxiety, Task Performance, Test Anxiety Scale
INTRODUCTION
Spielberger and Sarason1 define test anxiety as a situation-specific trait that refers to anxiety states experienced during examinations. This is a complex and multidimensional construct, embodying distinct individual perceptions, and physiologic and behavioral responses.2 While the mechanistic relationship between anxiety and student test performance is not well understood, it is widely accepted that emotionality and worry constitute the two primary dimensions of test anxiety.3–5 Emotionality is manifested physiologically during exams (eg, increased galvanic skin conductance, increased heart rate, dizziness, and nausea) and by feelings of panic.4–6 It has been proposed that emotionality reflects the individual's subjective awareness of heightened autonomic arousal rather than the arousal itself.7 Worry, also called cognitive test anxiety, compromises the range of cognitive reactions to test situations, including associated internal dialogue before, during, and after tests.4 The worry component of test anxiety most consistently correlates with declines in academic test performance.5,8 Meta-analyses and path analyses suggest that worry is the stronger influence on test performance.5,9–11
Two widely discussed models explaining the observation that test anxiety and test performance have an inverse relationship are the Cognitive Interference Model and the Additive Model of Test Anxiety. Research supporting the Cognitive Interference Model suggests that during tests a high level of anxiety creates intrusive thoughts that conflict with the student's ability to concentrate.12,13 The Additive Model of Test Anxiety, describes test anxiety as an additive function of an individual's trait test anxiety and situation-specific variables, such as low self-confidence for the specific task, perception of the exam as posing a high level of threat, or an awareness of being underprepared for the exam.4,14 Proponents of the Additive Model of Test Anxiety assert that individuals with high levels of test anxiety will experience severe performance declines only in situations that also activate the state test anxiety factor. It is helpful to appreciate that these two models are not mutually exclusive.
It is widely believed by academicians that studying the various dimensions of test anxiety can lead to effective strategies for test preparation, test taking, and test administration. Conflicting studies examining test anxiety and test performance may simply reflect differences in the rigor of the academic programs in which the studies were conducted (eg, nursing, medical school, technical, and liberal arts) and the level of study (undergraduate versus graduate). Medical training is known to have higher overall psychologic stress in comparison with the general population and age-matched peers.15–18 Chiropractic and medical school programs are characterized by challenging classes and high credit loads each academic term.19,20 Although we found no systematic studies relating anxiety and test performance in chiropractic students, the existence of substantial anxiety in chiropractic students is widely recognized.21,22 To our knowledge, this is the first systematic study to examine test anxiety and performance in chiropractic students.
We hypothesized that chiropractic students with high levels of anxiety would suffer detrimental effects on written and manual skills test performance. Therefore, the aim of this study was to assess the level of test anxiety in students at a chiropractic college and examine the relationship between their test anxiety and test performance. This information will inform chiropractic educators and researchers, and may suggest strategies by which chiropractic students may manage test anxiety to achieve test performance that more accurately reflects their acquired knowledge, understanding, and skills.
METHODS
Participants
We recruited 166 third-quarter chiropractic students in a 13-quarter curriculum who were taking two consecutive courses (head and neck physical examination, and immunology and endocrinology) taught by the same instructor. We examined test anxiety as a predictor of test performance in these courses. Before implementation, the study protocol was reviewed and approved by the institutional review board of Palmer College of Chiropractic.
Test Anxiety Assessment
A validated assessment instrument, the Spielberger Test Anxiety Inventory (TAI), was administered to all participating students midway in the term.23 The TAI is a self-report questionnaire of 20 statements to which respondents are asked to report how often they experience anxiety symptoms before, during, and after taking tests. Each statement response is scored with a 4-point Likert scale (1–4) yielding a total test anxiety score ranging from 20 to 80 points.
The TAI also yields two subscale scores that measure worry and emotionality, the 2 major components of test anxiety that reflect the cognitive concerns and emotional responses associated with evaluation of stress.23 Each subscale consists of 8 items, with a score range from 8 to 32 points. We asked 4 additional questions to identify the participant's age, sex, highest current academic degree, and ethnicity.
Test Performance Assessment
Total scores from all written examinations given in the 2 courses and the total of 2 manual skills assessment exams, objective structured clinical examinations (OSCEs),24 were used as test performance measures. The written examinations evaluated the student's knowledge and understanding of head and neck physical examinations, immunology, and endocrinology. The OSCEs evaluated the student's acquired skills in performing head and neck examinations.
Data Analysis
Data were analyzed using SPSS version 19.0 SPSS version 19 or later (IBM Corporation, Armonk, NY). Statistical test assumptions were verified and p values less than .05 were considered significant. The effect of total test anxiety (TAI), and worry and emotionality (TAI subscales) on test performance was evaluated via multiple linear regression analysis, controlling for sex, age, highest current academic degree, and ethnicity. Written exam and OSCE scores were examined as separate response variables. Correlation between sex, age, highest current academic degree, and ethnicity on the TAI subscales worry and emotionality also was examined.
Three levels of test anxiety (low, moderate, and high) were identified based on TAI scores to permit comparison with a previous study by Chapell et al.25 Students with TAI scores that were 1 SD or more above the mean study score were assigned to the high test anxiety group, students with a TAI score that was 1 SD or more below the mean study score were assigned to the low test anxiety group, and students with TAI scores between the high and low groups were assigned to the moderate anxiety group. Differences in test performance across these three groups were evaluated via independent 1-way ANOVA and significant differences were examined via orthogonal contrasts.
RESULTS
Demographic Information
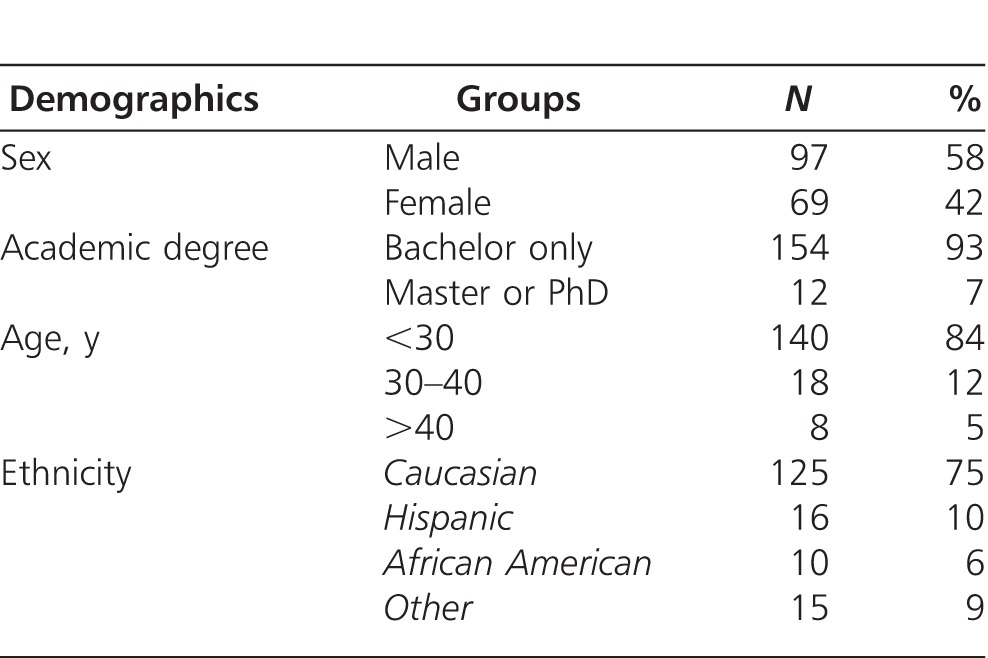
Demographic data are summarized in Table 1. In our sample, there was a slightly greater number of males. Highest current academic degree, age, and ethnicity were skewed substantially in favor of bachelor degrees, <30 years of age, and Caucasians, respectively. This sample of convenience included 69 females and 97 males, with ages ranging from 21 to 56 years (26.3 ± 6.0 years, mean ± SD).
Table 1.
Demographic Data for All Students
TAI Scores
The mean TAI score, measuring total test anxiety, for all students was 40.0 ± 13.53 (mean ± SD). The mean TAI score for females was significantly higher than that for males (42.9 ± 14.31 and 37.9 ± 12.60, respectively, p = .017).
The mean emotionality subscale score for females also was significantly higher than that for males (18.2 ± 6.33 and 15.6 ± 5.29, respectively, p = .004), while there was a small, but statistically insignificant difference between female and male worry subscale scores (15.5 ± 5.61 and 14.4 ± 5.31, respectively (p = .210).
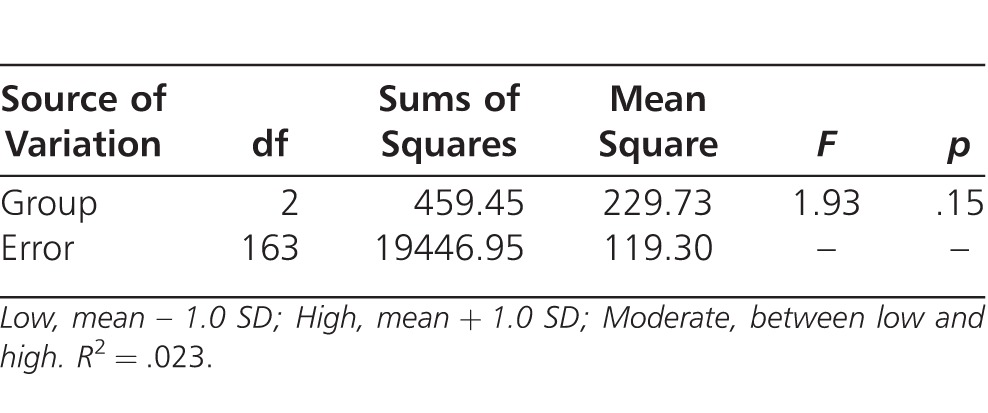
For comparison with the previous study by Chapell et al,25 individual TAI scores were grouped into low, moderate, and high levels based on 1 SD shifts relative to the mean TAI score for all students (Table 2). Independent 1-way ANOVA demonstrated no statistically significant differences in written exam performance between the three test anxiety levels defined by Chapell et al25 (Table 3).
Table 2.
Written Exam Scores for High, Low, and Moderate TAI Groups (1 SD Thresholds)
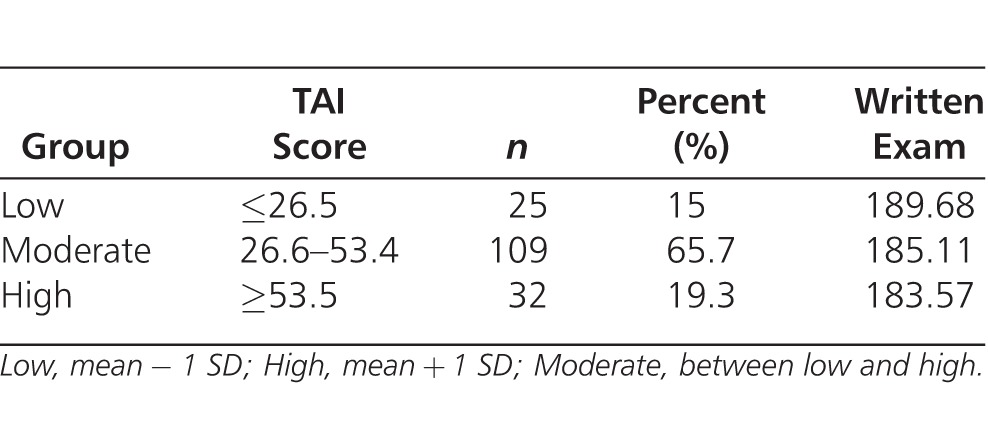
Table 3.
One-Way ANOVA: Written Exam Score Differences Between High, Low, and Moderate TAI Groups (1 SD Thresholds, n = 166)
Predictive Model Evaluation
Multiple regression analysis with hierarchical entry was used to examine total test anxiety (TAI score) as a predictor of written exam performance, while controlling for sex, age, highest current academic degree, and ethnicity (Table 4). Linear regression assumptions were evaluated for the data set before performing the analysis. The hierarchical entry order and selection of a 1-tailed comparison was informed by previous test anxiety studies.26,27 There was a small, but statistically significant, negative correlation between TAI scores and total written exam scores (Stage 1, −.210, R2 = 6.7%, p = .001, 1-tailed). Sex, age, degree, and ethnicity (stages 2 and 3) were not significant contributors to the prediction of written exam scores. There was no strong multicolinearity among the predictors.
Table 4.
Multiple Regression: Test Anxiety and Cofactors on Written Exam Scores
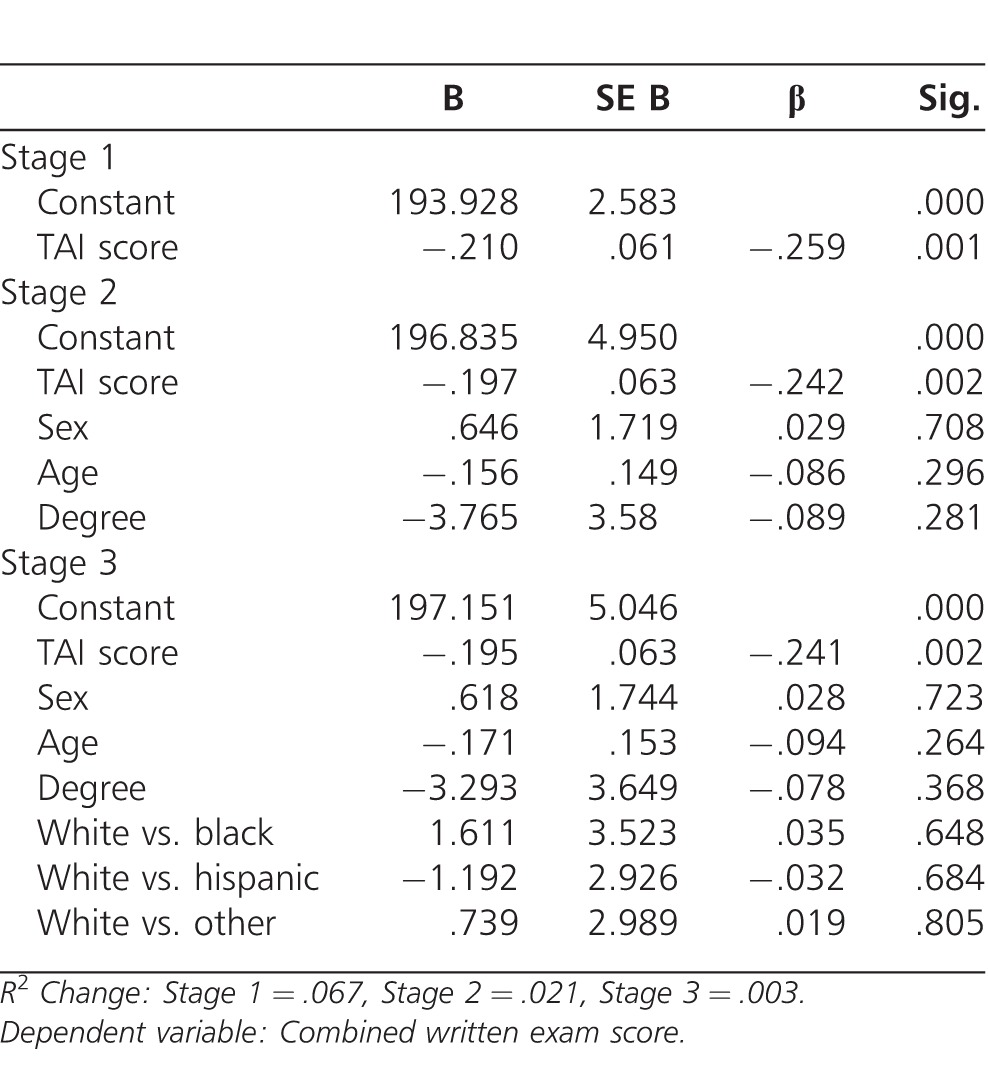
Subsequent multiple regression evaluation of the TAI subscales worry and emotionality (with the same predictive cofactors) demonstrated that this model had substantially greater predictive power on written exam scores (R2 = 15.9%, p = .005). Worry had a moderate negative correlation with written exam scores (−.342, p = .000, 1-tailed) and emotionality had a smaller, but statistically significant, negative correlation (−.157, p = .022, 1-tailed). A similar regression analysis revealed a small, but not statistically significant, negative correlation between TAI scores and OSCE scores (−.105, p = .089, 1-tailed).
DISCUSSION
The demographics of our sample were consistent with our college student population and appeared to be generally representative of contemporary chiropractic college populations.28,29 We found no specific examinations of chiropractic college student demographics in peer reviewed journals. However, comparison of student demographics with published chiropractic practitioner demographics suggested a fairly dramatic shift toward sex equalization, with less pronounced changes in age, academic degree, and ethnicity.
This study demonstrated that chiropractic students in our institution experienced substantial test anxiety in the 3rd quarter of the 13-quarter curriculum, but total test anxiety was a weak predictor of test performance. A majority of the students had either moderate (66%) or high (19%) TAI scores using the 1 SD criteria of Chapell et al.25 These findings are consistent with reports for medical training programs. In a study of 349 second-year medical students, Vontver et al30 and Knight et al31 found that mean trait anxiety scores were substantially higher than among 20- to 29-year-olds in the general population. Similarly, Lloyd and Gartrell32 reported that medical students in all 4 years of their training had mean anxiety scores more than 1 SD above the norm for the general population. By contrast, students in other health training programs appear to have less anxiety. Cheraghian et al33 reported that 14% of nursing students did not have test anxiety and 48.7% of them reported only low test anxiety. The reason for this difference is not clear, but multiple causes are likely. A number of factors strongly influence medical student performance, such as high academic expectations,34 heavy workload with multiple subjects in 1 term,35,36 and financial concerns, such as high tuition, and competition for scholarships and other financial aid.36 Chiropractic students are known to experience similar stresses during their training program.19,37
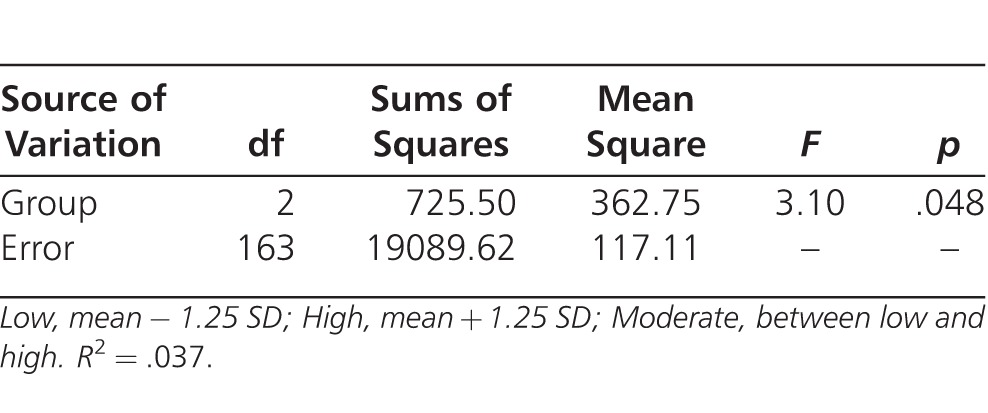
A post hoc analysis of our data with a 1.25 SD grouping criterion, rather than the 1 SD used by Chapell et al,25 found a significant difference between low (mean − 1.25 SD) and high (mean + 1.25 SD) TAI groups (p < .05; Tables 5, 6). Therefore, although we found no significant difference between the total test anxiety levels suggested by Chapell et al,25 our post hoc analysis suggested that a new grouping criterion (1.25 SD rather than 1 SD) can demonstrate statistical differences. In our study, chiropractic students with TAI scores 1.25 SD below the mean experienced no appreciable reduction in test performance, while students with TAI scores 1.25 SD above the mean had a statistically significant reduction in test performance. Unfortunately, this general measure of test anxiety, the TAI score, still was a weak explanatory factor. Grouping students by low, moderate, and high test anxiety using the modified criteria explained only 3.7% of the difference in test scores.
Table 5.
Written Exam Scores for High, Low, and Moderate TAI Groups (1.25 SD Thresholds)
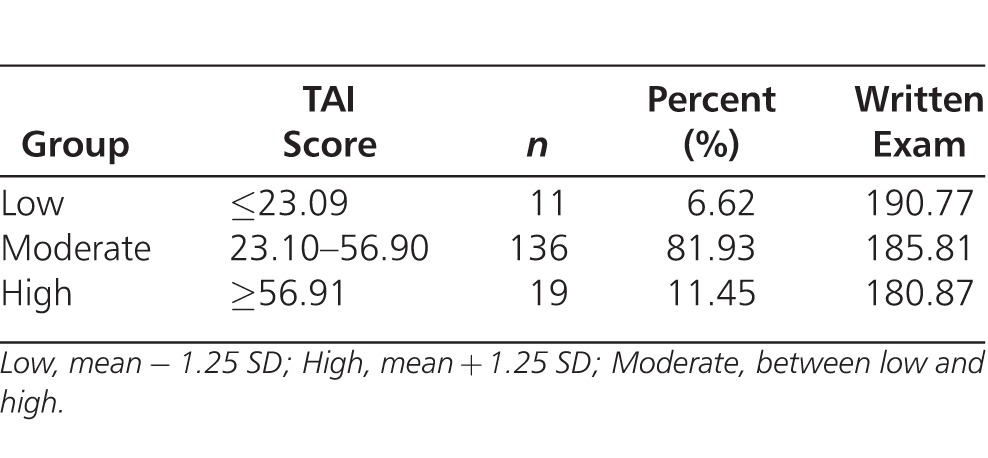
Table 6.
One-Way ANOVA Examining Written Exam Score Differences – High, Low, and Moderate TAI Groups With 1.25 SD (n = 166)
Multiple regression analysis in this study revealed a statistically significant, but small, negative correlation between total test anxiety (TAI scores) and academic performance. Higher TAI scores were associated with lower written exam scores (Table 4; R2 = 6.7%, p = .001). The finding that total test anxiety explains only a relatively small amount of the variation in test performance is in agreement with previous studies.5,9 In those studies, reported effects of total test anxiety on test performance were almost always less than 10% (R2 < .10). In addition, some investigators have reported no statistically significant detrimental effects of total test anxiety on academic performance.33
We found that the TAI subscales worry and emotionality were substantially stronger predictors (R2 = 15.9%) than total test anxiety (the TAI score, R2 = 6.7%). This is consistent with previous studies that reported student test performance correlated most highly with worry scores, but was unrelated or less strongly related to emotionality scores.4,5,9 Therefore, we concluded that the worry and emotionality subscales should be used as a test performance predictor, rather than total anxiety (the TAI score), the TAI-based test anxiety groupings recommended by Chapell et al,25 or our own modification (using a 1.25 SD grouping criterion). We also suggest that, in terms of test anxiety related effects, chiropractic educators should specifically target measures of worry (cognitive anxiety), rather than emotionality.
Comparisons of test anxiety effects by sex in the current study yielded mixed findings. Female students had higher total anxiety (TAI) scores and emotionality scores than male students, but the worry scores were equivalent. Furthermore, the significantly higher TAI scores for females were not reflected as significant sex influences in the multiple linear regression models. This apparent conflict is consistent with other studies. Female undergraduates and graduate students are reported to have higher test anxiety than their male counterparts,38–40 but despite this finding, female undergraduates and graduates have been reported to have equal or higher GPAs than their male counterparts.41–43 The question of how female students can have higher TAI scores and yet have equal or greater GPAs than male students remains to be answered. Women in the general population also are reported to have greater levels of anxiety than men.44,45 It has been suggested that differential sex effects may be mediated through a threat perception mechanism.14,46,47 Thus, the pronounced test anxiety levels in females may reflect a greater tendency in females to perceive evaluative situations as threatening rather than challenging, which would increase the likelihood of worry. Our data do not support this hypothesis because we found no significant sex differences in worry scores despite observing higher total anxiety and emotionality scores among female chiropractic students. Women and men may have substantially different coping mechanisms, counterbalancing sex-based emotional differences. This is an area requiring further research.
Although it is clear that test anxiety, particularly the worry and emotionality components, has an adverse effect on test performance, it explains only a small portion of test performance variability. Additional studies are needed to identify and clarify the roles of performance predictors as moderators or mediators and determine meaningful effect size thresholds for these factors. Moreover, the causal relationship between test anxiety and academic performance is far from clear. Poor academic performance is likely to increase test anxiety just as test anxiety adversely affects academic performance. Therefore, the cause and effect relationship between these two factors is complex and not easily teased apart. These observations are important, given the widespread dedication of resources at chiropractic institutions to make special accommodations for students with self-reported test anxiety. We need studies examining robust regression models that include predictors, such as class hours, lab hours, independent study hours, group study hours, general measures of academic ability (eg, ACT, SAT, or GRE scores), and previous test results. In addition, written and spoken English competency scores almost certainly will be better predictors of test performance than simple ethnic groupings, particularly for individuals in which English is not the native language.
Lastly, in addition to studies with a more robust complement of meaningful predictors, practice-related global assessments, such as national board scores, also should be evaluated as response variables. This information would help chiropractic educators who must identify students at greatest risk and make informed decisions relative to allocation of limited resources.
Limitations
Generalizability of the reported study is limited by the study design and sample. It is expected that chiropractic students generally reflect the study and test taking characteristics of students in similar professional health care training programs (eg, medical and osteopathic). However, it is not known currently if student or program characteristics unique to chiropractic programs assert meaningful effects on the relationship between test anxiety and test performance. Similarly, our sample was limited to third-quarter chiropractic students in a 13-quarter curriculum, and to 2 classes taught by the same instructor. Lastly, written exam and OSCE assessments may not be representative of overall academic performance. These study features must be considered when generalizing our results. The purpose of this study was to provide chiropractic educators and academic researchers information heretofore unavailable to them. To our knowledge, this is the first systematic study to examine test anxiety and performance in chiropractic students. If there are meaningful student or program characteristics unique to chiropractic programs, studies focused on students in chiropractic programs will be best suited to inform chiropractic educators and researchers. There is clearly a need for additional studies to explore test anxiety and performance in chiropractic students.
CONCLUSION
Moderate-to-high test anxiety was observed in 85% of the chiropractic students examined. However, total test anxiety, as measured by the TAI score, was a very weak predictive model for written exam performance. Multiple regression analysis demonstrated that replacing total anxiety (TAI) with worry and emotionality (TAI subscales) produces a much more effective predictive model of written exam performance. Sex, age, highest current academic degree, and ethnicity contributed little additional predictive power in either regression model.
Grouping TAI scores via a 1 SD criterion, as suggested by Chapell et al,25 did not reveal statistically significant differences, while grouping by 1.25 SD showed statistically significant, but very small, differences in written test performance. Moreover, TAI scores were not found to be statistically significant predictors of physical exam skill performance, as measured by OSCEs.
Although it is clear that test anxiety, particularly the worry and emotionality components, has an adverse effect on test performance, it explains only a small portion of test performance variability. Additional studies are needed to identify and clarify the roles of performance predictors as moderators or mediators and determine meaningful effect size thresholds for these factors. In addition, response variables that are practice-related global assessments (eg, national board scores) also should be evaluated. Information from these studies would be valuable for chiropractic educators who must identify students at greatest risk and make informed decisions relative to allocation of limited resources.
Generalizability of the reported study is limited by study design and sample. The written exam and OSCE assessments examined in our study may not be representative of overall academic performance. To our knowledge, this is the first systematic study to examine test anxiety and performance in chiropractic students. If there are meaningful student or program characteristics unique to chiropractic programs, studies focused on students in these programs will be best suited to inform chiropractic educators and researchers.
CONFLICT OF INTEREST
The authors have no conflicts of interest to declare.
Footnotes
This article was received August 1, 2013, revised October 7, 2013, and accepted October 8, 2013.
*This paper was selected as a 2013 Association of Chiropractic Colleges – Research Agenda Conference Prize Winning Paper – Award funded by the National Board of Chiropractic Examiners.
REFERENCES
- 1.Spielberger CD, Sarason IG. Stress and Anxiety, vol. 12. Washington, DC: Hemisphere Publishing Corporation;; 1989. [Google Scholar]
- 2.Zeidner M. Test Anxiety: The State of the Art. New York, NY: Plenum Press;; 1998. [Google Scholar]
- 3.Liebert RM, Morris LW. Cognitive and emotional components of test anxiety: a distinction and some initial data. Psychol Rep. 1967;20:975–978. doi: 10.2466/pr0.1967.20.3.975. [DOI] [PubMed] [Google Scholar]
- 4.Cassady JC, Johnson RE. Cognitive test anxiety and academic performance. Contemp Educ Psychol. 2002;27:270–295. [Google Scholar]
- 5.Hembree R. Correlates, causes, effects, and treatment of test anxiety. Rev Educ Res. 1988;58(1):47–77. [Google Scholar]
- 6.Deffenbacher JL. Worry and emotionality in test anxiety. In: Sarason IG, editor. Test Anxiety: Theory, Research, and Applications. Hillsdale, N.J: L. Erlbaum Associates; 1980. pp. 111–124. In. ed. [Google Scholar]
- 7.Schwarzer R. Worry and emotionality as separate components in test anxiety. Appl Psychol. 1984;33(2):205–220. [Google Scholar]
- 8.Morris LW, Liebert RM. Relationship of cognitive and emotional components of test anxiety to physiological arousal and academic performance. J Consult Clin Psychol. 1970;35(3):332–337. doi: 10.1037/h0030132. [DOI] [PubMed] [Google Scholar]
- 9.Seipp B. Anxiety and academic performance: a meta-analysis of findings. Anxiety Res. 1991;4(1):27–41. [Google Scholar]
- 10.Euma K, Ricea KG. Test anxiety, perfectionism, goal orientation, and academic performance. Anxiety Stress Coping. 2011;24(2):167–178. doi: 10.1080/10615806.2010.488723. [DOI] [PubMed] [Google Scholar]
- 11.Heng-Tsung DH, Shao-Ting AH. Comparing the effects of test anxiety on independent and integrated speaking test performance. TESOL Q. 2013;47(2):244–269. [Google Scholar]
- 12.Schwarzer R, Jerusalem M. Advances in anxiety theory: a cognitive process approach. In: Hagtvet KA, Johnsen TB, editors. Advances in Test Anxiety Research. Lisse, The Netherlands: Swets & Zeitlinger;; 1992. pp. 2–31. In. eds. [Google Scholar]
- 13.Naveh-Benjamin M. A comparison of training programs intended for different types of test-nxious students: further support for an information-processing model. J Educ Psychol. 1992;83(1):134–139. [Google Scholar]
- 14.Zohar D. An additive model of test anxiety: role of exam-specific expectations. J Educ Psychol. 1998;90(2):330–340. [Google Scholar]
- 15.Guthrie E, Black D, Bagalkote H, Shaw C, Campbell M, Creed F. Psychological stress and burnout in medical students: a five-year prospective longitudinal study. J R Soc Med. 1998;91:237–243. doi: 10.1177/014107689809100502. [DOI] [PMC free article] [PubMed] [Google Scholar]
- 16.Tyssen R, Vaglum P, Grønvold NT, Ekeberg O. Suicidal ideation among medical students and young physicians: a nationwide and prospective study of prevalence and predictors. J Affect Disord. 2001;64(1):69–79. doi: 10.1016/s0165-0327(00)00205-6. [DOI] [PubMed] [Google Scholar]
- 17.Dahlin M, Joneborg N, Runeson B. Stress and depression among medical students: a cross-sectional study. Med Educ. 2005;39:594–604. doi: 10.1111/j.1365-2929.2005.02176.x. [DOI] [PubMed] [Google Scholar]
- 18.Newton BW, Savidge MA, Barber L, et al. Differences in medical students' empathy. Acad Med. 2000;75:1215. doi: 10.1097/00001888-200012000-00020. [DOI] [PubMed] [Google Scholar]
- 19.Christensen MG. National Board of Chiropractic Examiners. Practice Analysis of Chiropractic: A Project Report, Survey Analysis, and Summary of the Practice of Chiropractic Within the United States. Greeley, CO: National Board of Chiropractic Examiners;; 2010. [Google Scholar]
- 20.The Council on Chiropractic Education. Standards for Doctor of Chiropractic Programs and Requirements for Institutional Status. Scottsdale, AZ: The Council on Chiropractic Education;; 2007. pp. 1–56. [Google Scholar]
- 21.Meseke CA, Nafziger R, Meseke JK. Student attitudes, satisfaction, and learning in a collaborative testing environment. J Chiropr Educ. 2010;24(1):19–29. doi: 10.7899/1042-5055-24.1.19. [DOI] [PMC free article] [PubMed] [Google Scholar]
- 22.Schutz CM, Gallagher ML, Tepe RE. Differences in learning and study strategies inventory scores between chiropractic students with lower and higher grade point averages. J Chiropr Educ. 2011;25(1):5–10. doi: 10.7899/1042-5055-25.1.5. [DOI] [PMC free article] [PubMed] [Google Scholar]
- 23.Spielberger CD. Test Anxiety Inventory: Preliminary Professional Manual. Menlo Park, CA: Mind Garden;; 1980. [Google Scholar]
- 24.Harden RM. What is an OSCE? Med Teach. 1988;10(1):19–22. doi: 10.3109/01421598809019321. [DOI] [PubMed] [Google Scholar]
- 25.Chapell MS, Blanding ZB, Silverstein ME, et al. Test anxiety and academic performance in undergraduate and graduate students. J Educ Psychol. 2005;97(2):268–274. [Google Scholar]
- 26.Hong E, Karstensson L. Antecedents of state test anxiety. Contemp Educ Psychol. 2002;27:348–367. [Google Scholar]
- 27.Rana RA, Mahmood N. The relationship between test anxiety and academic achievement. Bull Educ Res. 2010;32(2):63–74. [Google Scholar]
- 28.Johnson CD, Green BN. Diversity in the chiropractic profession: preparing for 2050. J Chiropr Educ. 2012;26(1):1–13. doi: 10.7899/1042-5055-26.1.1. [DOI] [PMC free article] [PubMed] [Google Scholar]
- 29.Gliedt JA, Briggs S, Williams JSM, Smith DP, Blampied J. Background, expectations and beliefs of a chiropractic student population: a cross-sectional survey. J Chiropr Educ. 2012;26(2):146–160. doi: 10.7899/JCE-11-031. [DOI] [PMC free article] [PubMed] [Google Scholar]
- 30.Vontver L, Irby D, Rakestraw P, Haddock M, Prince E, Stenchever M. The effects of two methods of pelvic examination instruction on student performance and anxiety. J Med Educ. 1980;55:778–785. doi: 10.1097/00001888-198009000-00007. [DOI] [PubMed] [Google Scholar]
- 31.Knight RG, Waal-Manning HJ, Spears GF. Some norms and reliability data for the State Trait Anxiety Inventory and the Zung Self-Rating Depression scale. Br J Clin Psychol. 1983;22:245–249. doi: 10.1111/j.2044-8260.1983.tb00610.x. [DOI] [PubMed] [Google Scholar]
- 32.Lloyd C, Gartrell NK. Psychiatric symptoms in medical students. Compr Psychiatry. 1984;25:552–565. doi: 10.1016/0010-440x(84)90036-1. [DOI] [PubMed] [Google Scholar]
- 33.Cheraghian B. Fereydouni Moghadam M, Baraz-Pardejani SH, Bavarsad N. Test anxiety and its relationship with academic performance among nursing students. J Knowl Health. 2008;3((3–4)):25–29. [Google Scholar]
- 34.Stewart SM, Lam TH, Betson CL, Wong CM, Wong AM. A prospective analysis of stress and academic performance in the first two years of medical school. Med Educ. 1999;33:243–250. doi: 10.1046/j.1365-2923.1999.00294.x. [DOI] [PubMed] [Google Scholar]
- 35.Guthrie EA, Black D, Shaw CM, Hamilton J, Creed FH, Tomenson B. Embarking upon a medical career: psychological morbidity in first year medical students. Med Educ. 1995;29:337–341. doi: 10.1111/j.1365-2923.1995.tb00022.x. [DOI] [PubMed] [Google Scholar]
- 36.Wolf TM, Faucett JM, Randall HM, Balson PM. Graduating medical students' ratings of stresses, pleasures, and coping strategies. J Med Educ. 1988;63(8):636–642. doi: 10.1097/00001888-198808000-00008. [DOI] [PubMed] [Google Scholar]
- 37.Spegman AM, Herrin S. Chiropractic interns' perceptions of stress and confidence. J Chiropr Educ. 2007;21(2):129–137. doi: 10.7899/1042-5055-21.2.129. [DOI] [PMC free article] [PubMed] [Google Scholar]
- 38.Hojat M, Glaser K, Xu G, Veloski JJ, Christian EB. Sex comparisons of medical students' psychosocial profiles. Med Educ. 1999;33(5):342–349. doi: 10.1046/j.1365-2923.1999.00331.x. [DOI] [PubMed] [Google Scholar]
- 39.Seipp B. Anxiety and academic performance: a meta-analysis of findings. Anxiety Res. 1991;4:27–41. [Google Scholar]
- 40.Hembree R. Correlates, causes, effects and treatment of test anxiety. Rev Educ Res. 1988;58(1):47–77. [Google Scholar]
- 41.Dwyer CA, Johnson LM. Grades, accomplishments and correlates. In: Willinham WW, Cole NS, editors. Gender and Fair Assessment. Mahawah, NJ: Erlbaum Associates;; 1997. pp. 127–156. In. eds. [Google Scholar]
- 42.Steinberg L, Brown BB, Dombusch SM. Beyond the Classroom: Why School Reform has Failed and What Parents Need To Do. New York, NY: Simon and Schuster;; 1996. [Google Scholar]
- 43.Dornbusch SM, Ritter PL, Leiderman PH, Roberts DF, Fraleigh MJ. The relation of parenting style to adolescent school performance. Child Develop. 1987;58:1244–1257. doi: 10.1111/j.1467-8624.1987.tb01455.x. [DOI] [PubMed] [Google Scholar]
- 44.Regier DA, Farmer ME, Rae DS, et al. One-month prevalence of mental disorders in the United States and sociodemographic characteristics: the Epidemiologic Catchment Area study. Acta Psychiatr Scand. 1993;88(1):35–47. doi: 10.1111/j.1600-0447.1993.tb03411.x. [DOI] [PubMed] [Google Scholar]
- 45.Regier DA, Boyd JH, Burke JD, et al. One-month prevalence of mental disorders in the United States. Based on five Epidemiologic Catchment Area sites. Arch Gen Psychiatry. 1988;45:977–986. doi: 10.1001/archpsyc.1988.01800350011002. [DOI] [PubMed] [Google Scholar]
- 46.Kurosawa K, Harackiewicz JM. Test anxiety, self-awareness, and cognitive interference: a process analysis. J Pers. 1995;63(4):931–951. [Google Scholar]
- 47.Arch E. Differential responses of females and males to evaluative stress: anxiety, self-esteem, efficacy and willingness to participate. In: Schwarzer R, van der Ploeg HM, Spielberger CD, editors. Advances in Test Anxiety Research. Lisse, The Netherlands: Swets & Zeitlinger;; 1987. pp. 97–106. In. eds. [Google Scholar]


