Abstract
An ultrasound elasticity microscope was used to map 3-D strain volume in an ex vivo porcine cornea to illustrate its ability to measure the mechanical properties of this tissue. Mechanical properties of the cornea play an important role in its function and, therefore, also in ophthalmic diseases such as kerataconus and corneal ectasia. The ultrasound elasticity microscope combines a tightly focused high-frequency transducer with confocal scanning to produce high-quality speckle over the entire volume of tissue. This system and the analysis were able to generate volume maps of compressional strain in all three directions for porcine corneal tissue, more information than any previous study has reported. Strain volume maps indicated features of the cornea and mechanical behavior as expected. These results constitute a step toward better understanding of corneal mechanics and better treatment of corneal diseases.
Keywords: Elasticity, Strain, Cornea, Keratoconus, High-frequency imaging, 3-D imaging
INTRODUCTION
Because of its function, mechanical behavior and elastic properties are important to the cornea. To focus, the cornea must maintain its shape, and yet, to protect itself and other parts of the eye, it needs some flexibility. Elastic properties play a significant role in some diseases affecting the cornea, most prominently post-LASIK (laser-assisted in situ keratomileusis) ectasia and keratoconus. It is also important to fully understand corneal elasticity because trauma and healing may affect mechanical behavior. Clinical applications that could potentially benefit from better measurements of corneal tissue mechanics using high-frequency ultrasonic strain imaging include keratoconus and post-LASIK ectasia.
Keratoconus is a disease in which mechanical properties of the cornea weaken, leading to progressive thinning and distortion of the cornea, as well as visual distortion. It affects about 1 in 2000 people in the general population (Kennedy et al. 1986). In early stages and mild cases, glasses or contact lenses can be used to maintain visual acuity. If these conservative approaches are not helpful, surgical treatment is often recommended. In approximately 20% of cases, keratoconus progresses to the point where corneal transplant is required (Rabinowitz 1998). Recently, a new experimental method of corneal collagen cross-linking with ultraviolet A (UVA) and the photosynthesizer riboflavin has been shown to slow or stop the progression of keratoconus (Mazzotta et al. 2007; Mencucci et al. 2007; Wollensak 2006).
High-resolution corneal mechanical measurements with ultrasonic imaging could lead to better understanding and improved treatment of keratoconus. Most current techniques track gross deformations so they measure only average mechanical properties. Higher-resolution measurements could determine if the keratoconus affects the entire corneal thickness or if it is more localized. Better in vivo mechanical measurements can also lead to earlier detection of this condition. In assessing UVA/riboflavin treatment, high-resolution measurements could determine how localized the treatment is and provide information regarding penetration depth. Post-treatment monitoring would also benefit from reliable elasticity measurements. In vivo elasticity measurements would be valuable in assessing the long-term effects of this new treatment. Accurate in vivo elasticity measurements could also be helpful in planning corneal transplant surgery for patients with keratoconus.
Post-LASIK ectasia is another condition in which there is corneal thinning and distortion. It is a rare but dreaded complication of corneal refractive surgery that occurs when too much structural corneal tissue is removed during surgery (Guirao 2005; Jaycock et al. 2005a, 2005b). Although pre-screening procedures are intended to prevent this complication, the criteria are based primarily on pre-operative corneal curvature and predicted post-operative corneal thickness. In other words, will there be enough tissue left after surgery to sustain structural integrity? However, total structural integrity is a combination of both thickness and stiffness. Further, if stiffness is non-homogenous throughout the thickness of the tissue, the total strength of any tissue is more complicated.
Elasticity maps from a high-frequency ultrasound elasticity microscope would provide critically useful information for improved screening to prevent post-LASIK ectasia. It could screen out softer-than-normal corneas whose thickness would otherwise allow surgery. It may also allow surgery in stiffer corneas that would otherwise be screened out as too thin. Finally, high-resolution mechanical measurements could lead to better predictions of post-operative shape in corneas that pass screening.
There are a number of techniques for measuring corneal elasticity, many of which have been reported in the literature. Unfortunately, they measure gross average properties throughout the corneal thickness or are destructive and cannot be used in vivo. The cornea is not homogeneous. Components such as the epithelium, Bowman’s layer, stroma and endothelium have different elastic moduli. It is not even known if the largest component of the cornea, the stroma, is elastically homogeneous. The stroma consists of alternating layers of collagen fibers. Because of mechanical behavior, fibers near the epithelium and Bowman’s layer experience different forces than those close to the endothelium, and therefore, it is conceivable that they have different mechanical properties. However, the technological capability to measure elastic differences as a function of corneal depth has not been available until now.
As this study reveals, a 3-D elasticity microscope can create a 3-D map of normal strains in an ex vivo porcine cornea. These strain maps are a key development toward recreating volume maps of elastic moduli that can be used to understand the local and global mechanical properties of the cornea.
METHODS
As shown in Figure 1, the 3-D elasticity microscope consists of a high-frequency single-element transducer precisely scanned with a stepper motor-driven three-axis positioning system. A fourth axis (not shown in this figure) precisely applies deformation of the specimen through a deformation plate. The vertical axis (Bislide MN10–0150-M01–21, Velmex, Bloomfield, NY, USA) controls the transducer position in the direction of ultrasonic propagation (also labeled as the axial direction). In one direction perpendicular to ultrasonic propagation (also labeled as a non-axial direction), the transducer is positioned by the horizontal axis (Bislide MN10–0100-M01–21, Velmex). In the final direction, also perpendicular to propagation, the transducer is positioned by the transverse axis (Unislide MA1503 Q1-S1.5, Velmex). Stepper motors are controlled by a motion control card (Model PCI-7354, National Instruments, Austin, TX, USA) installed in a desktop computer and a stepper motor driver (MID-7604, National Instruments, Austin, TX, USA). The vertical and horizontal axes have step sizes of 2.50 μm, and the transverse axis has a step size of 1.25 μm.
Fig. 1.
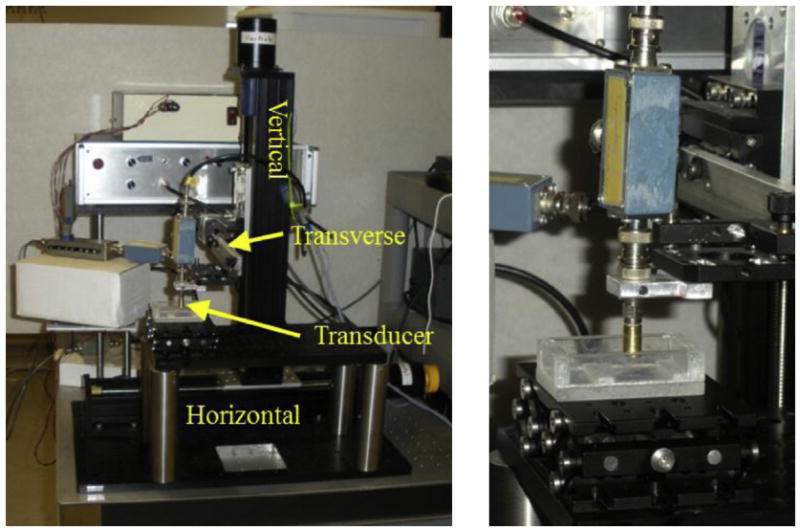
Photograph of elasticity microscope equipment. There are three imaging axes: horizontal, vertical and transverse. The deformation axis and slit pushing plate are not shown. On the right is a close-up of the high-frequency ultrasonic transducer (brass-colored cylinder).
The single-element ultrasonic transducer was custom designed and built using a LiNbO crystal. It has a center frequency of 53 MHz and bandwidth of 31 MHz. Its focal length is 4.18 mm with an f-number of 1.67. The resulting depth of field is 311 μm. Axial resolution is 23.9 μm, and non-axial resolution is 46.6 μm. The transducer was excited by a signal from a monocycle generator (AVB2-TB-C, Avtech Electrosystems Ltd., Ottawa, ON, Canada). A custom-built diode expander (Cohn et al. 1997) between the generator and transducer removes some baseline noise. After the signal is received, a custom-built diode limiter (Cohn et al. 1997) protects down-line electronics from the excitation pulse. The amplitude of the received signal is then controlled by a fixed amplified (MN AU-2 A-0150-BNC, Miteq, Hauppauge, NY, USA), an attenuator (PE7008–1, Pasternack, Irvine, CA, USA), another fixed amplifier (MN AU-1114-BNC, Miteq) and another attenuator (PE7008–1, Pasternack, Irvine, CA, USA). The received signal is finally captured by a high-frequency digitizing board (U1071a, Agilent Technologies, Santa Clara, CA, USA) in a desktop Windows-based computer. It is digitized at a rate of 250 MSa/s. A 10-MHz synchronized clock signal from the digitizing board is divided down with a custom-built clock divider to a 9.76-kHz signal, which triggers both the digitizer and the monocycle generator.
As shown in Figure 2, mechanical deformation was applied to specimens with a 25-mm-square aluminum plate that had a 2-mm-wide slit machined in it. The deformation plate was positioned with a stepper motor-driven screw axis similar to the positioning axes for the transducer. It is attached at a right angle to an aluminum arm that is bolted to the positioning stage of the axis. The slit is slightly shorter than the plate. In earlier experiments with 2-D imaging, scanning was done across the width of the slit for 1 mm in the center to avoid side lobe reflections from metal edges of the slit. This arrangement mechanically reduced artifacts from out-of-plane tissue deformation. Adjacent tissue constrains out-of-plane motion along the slit length. Along the slit width, there is a discontinuity of force at the edge that creates both axial and non-axial deformation in this plane. With the improvement of 3-D imaging, out-of-plane motion is no longer an issue, so deformation can be imaged along the entire length of the slit. For practical reasons, because of scanning time, current scans have been conducted only over a 1-mm non-axial square. (With current equipment, designed for ex vivo laboratory measurements, scanning time for one volume set is about 24 min. Faster scanning axes and future availability of high-frequency arrays should reduce scan rates to clinically acceptable levels.)
Fig. 2.
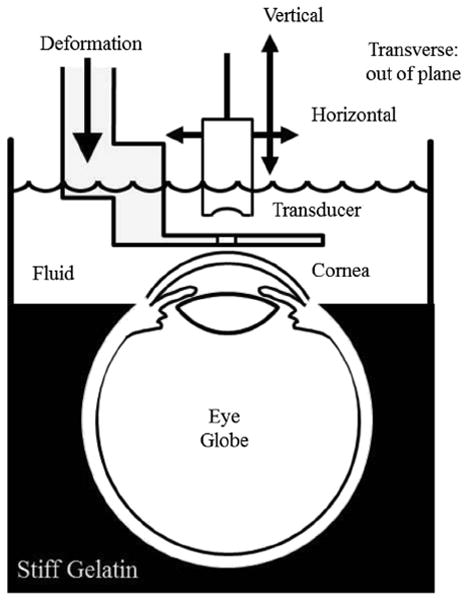
Diagram of experimental setup. The eye globe is held in place by gelatin up to the corneal/scleral junction. The rest of the breaker is filled with coupling fluid consisting of water and edema-inhibiting chemicals. Attached to a three-axis scanning system, the single-element transducer images through a slit in the deformation plate that is attached to a fourth motion axis. Machined from aluminum, the deformation plate is about 1 mm thick near the slit.
There are three primary reasons for using a slit in the deformation plate. First, it allows continuity with previous studies (Cohn et al. 1997, 2000; Hollman et al. 2002), which permits more appropriate comparisons. These studies used a slit with 2-D imaging to prevent out-of-plane motion. Second, the slit introduces interesting mechanical behavior. In particular, the slit creates a difference in behavior between the two non-axial directions that serves as a test of the 3-D capabilities. (This behavior is explained in more detail later.) If no difference is seen, the results should be suspect. Finally, the slit is needed as an acoustic window. Ultrasound scattering from corneal tissue is low. The system is operating close to the signal-to-noise ratio. Any loss of signal caused by reflections from the deformation plate would reduce image quality and affect speckle tracking. Of course, one of the future goals of this project is to adapt to a non-slit plate deformation that would be a more clinically useful setup. For instance, we want to explore impedance-matched plastics as part of the deformation plate to reduce signal amplitude loss, but this topic is beyond the scope of this study.
Another improvement over the previous experimental setup (Hollman et al. 2002) is better control of intraocular pressure in an ex vivo globe. Previously eye globe pressure was created by inflating the globe with a thin needle and hypodermic plunger and then conducting measurements after withdrawing the needle. For current experiments, intraocular pressure was maintained with a fluid reservoir connected to a needle through a tube. The needle remains in the globe throughout the measurements. Pressure is controlled by changing the reservoir height with a lab jack. Pressure was set at the normal average physiologic value of 15.5 mm Hg. This value was checked by removing the needle and attaching the tube to a monometer (840085, SPER Scientific, Scottsdale, AZ, USA) at the same height as the eye globe.
A fresh porcine eye was harvested by a medical tissue supplier (Visiontech Inc, Sunnyvale, TX, USA), immediately packed in ice and shipped overnight to our research laboratory. On receipt, the eye globe was embedded in gelatin up to the corneal/scleral junction in a glass beaker. The specimen and container were then placed in a refrigerator to aid setting of the gelatin. Once gelatin was set, the specimen was removed and allowed to warm up to room temperature.
Because there are concerns about the temperature dependence of soft tissue elasticity, it is better to measure as close to physiologic temperature as possible. Unfortunately, higher temperatures also promote tissue degradation in ex vivo specimens. Room temperature is a reasonable compromise between preservation at refrigerated temperatures and reducing possible effects of temperature-dependent mechanical properties.
On reaching room temperature, the globe was pressurized with the needle and fluid reservoir as described earlier. At this point, ultrasonic coupling fluid was added to the beaker, and the specimen was placed in the elasticity microscope. Because ex vivo corneal tissue is susceptible to edema, the coupling fluid consists of a special mixture of water and edema-inhibiting chemicals. Hollman (2010) reported that a combination of 10% dextran 40 and 25% glycerol (both from Sigma-Aldrich, St. Louis, MO, USA) was able to best stabilize corneal thickness. Without these chemicals, ex vivo corneas at room temperature rapidly swell, making them difficult to image as well as affecting mechanical properties. Dextran 40 is the main edema-inhibiting component of Optisol, a commercially available preservation fluid for transport of human transplant corneas. With transplants, however, the tissue is also refrigerated for better preservation. Unfortunately, higher temperatures promote greater edema. To work at room temperature, we found that glycerol (another hygroscopic chemical) is also needed.
Previously reported 2-D strain imaging (Hollman et al. 2002) used only water as a coupling medium so that edema was not properly controlled. Ultrasonic measurements in that study were all done properly, but the resulting strain included a component from edema as well as the applied mechanical deformation.
Once the specimen was set up in the ultrasonic elasticity microscope and pressurized, and the coupling fluid was added, 3-D scanning commenced. There were 45 imaging sites with a spacing of 20 μm in both non-axial directions. In the vertical direction, there were 10 sites with a spacing of 200 μm. After each scan the deformation plate was moved 31.25 μm and the specimen was re-scanned.
After all data were collected, confocal image processing took place offline. Ultrasonic signals were reduced to just the focal zone in the vertical direction. Overlap volumes in the vertical direction were correlated, they were adjusted in time and phase according to maximum correlation magnitude and then signals were merged together to create a data volume entirely within focus but larger than any single focal volume. Three-dimensional confocal merging was similar to the 2-D algorithm described in earlier articles (Cohn et al. 1997; Hollman et al. 2002).
To determine tissue deformation for a given deformation step, we compared image volumes before and after the step. A 3-D speckle tracking (ST) algorithm was used to compute local displacements within the volume. The fundamentals and details of the phase-sensitivity 3-D ST algorithm used in this study were described in a previous article (Chen et al. 2005). In brief, the displacements of each pixel point in 3-D directions are calculated by performing a 3-D cross-correlation between the pre- and post-deformed ultrasound radiofrequency data. The 3-D kernel measured 75 × 75 × 75 μm, and the search volume was 25 × 25 × 100 μm (horizontal, transverse, vertical) for 3-D cross-correlation. Normal strains were then calculated by taking a spatial derivative of the displacement in each direction.
RESULTS
In Figures 3-8, conventional normal strains resulting from the piston-slit deformation are illustrated. It can be difficult to present 3-D volumetric data on a static 2-D page, but fortunately the non-axial planes were fairly consistent throughout the volume so that the three orthogonal face planes portray mechanical behavior in the whole volume. To confirm this behavior, a single non-axial plane from mid-volume is also shown for each strain set. Note that each strain is displayed over a different range.
Fig. 3.
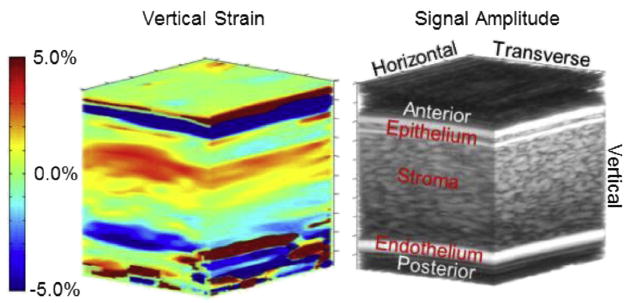
Three-dimensional image of vertical strain (left) with a conventional B-mode volume image (right) to highlight corneal anatomy. On the B-mode image, the top bright horizontal/transverse band is the fluid/epithelial boundary. The next bright horizontal/transverse band is the epithelial/stromal boundary. On the bottom the bright band is the endothelial/aqueous boundary. Above the epithelium and below the endothelium is noise from anechoic fluids for both B-mode and strain. Vertical strain in the epithelium is mostly green, indicating little deformation. Along the vertical direction (from anterior to posterior), strain in the stroma gradually transitions from positive to negative.
Fig. 8.
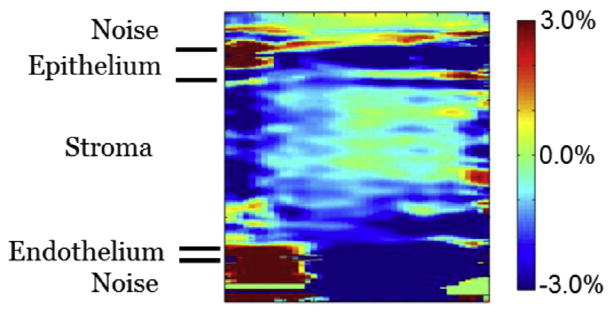
Two-dimensional slice of transverse strain in the transverse/vertical plane at the midpoint of the horizontal dimension. This is from the same data illustrated in Figure 7. It confirms the general strain trend shown in Figure 7. There does appear to be slightly larger negative strain along the transverse edges.
Figure 3 illustrates the vertical strain result. As will be the case in the next several figures, the colored image is a representation of strain, whereas the black and white image is a conventional B-mode volume image. The B-mode image is shown indicate corneal anatomy. Near the anterior, at the top of the image, the first bright band is the water/tissue interface of the epithelium. The next bright band is the boundary between the epithelium and the stroma. Next comes a large region of speckle that represents the stroma. At the bottom of the image is a bright band indicating the endothelial layer, which is thinner than the resolution of this system in this case. (Depending on biological variation, some endothelia are thick enough that two bright bands appear representing the anterior and posterior of this layer.) Above the surface of the epithelium and below the posterior of the endothelium are volumes of anechoic fluid. Signals from these volumes and their resulting strains are due to either electronic noise or edge artifact.
Vertical strain ranges from −5% (blue) to +5% (red). Positive values are for expansional strain. Negative values are for compressional strain. Vertical strain in the epithelium is generally green, indicating little deformation in this layer. Strain stroma begins strongly compressional in the anterior and gradually shifts to strongly expansional in the posterior. The endothelium generally is blue-green, possibly indicating a slight expansional strain, but because there is poor resolution here, skepticism is warranted. As seen in Figure 4, an image plane from the center of the volume data confirms that this behavior is typical throughout the volume. The layers seem even more discernible in this image. There is a jump from the green of the epithelium to the red of the anterior stroma and another jump from the blue of the posterior stroma to the blue-green of the endothelium.
Fig. 4.
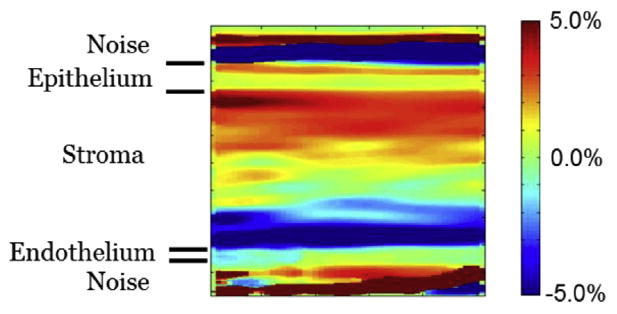
Two-dimensional slice of vertical strain in the horizontal/vertical plane at the midpoint of the transverse dimension. This is from the same data illustrated in Figure 3. There is low strain in the epithelium and a transition from positive to negative strain in the stroma. This image confirms that the behavior illustrated in Figure 3 is consistent throughout the volume.
Figure 5 illustrates the horizontal strain results. The range is slightly smaller in this figure, extending from −4% (blue) to +4% (red). Positive values indicate compressional deformation in the horizontal direction. Negative strain values indicate expansional deformation. The most dramatic feature of this result is the horizontal-vertical plane presenting positive strain along the left side, negative strain along the right and a band of zero strain running vertically through the middle. As indicated in Figure 6, a plane from the middle of the volume indicates that this bipolar strain exists throughout the volume. In the horizontal strain, there is no distinction of the layers. The endothelium, stroma and epithelium all seem to behave the same mechanically.
Fig. 5.
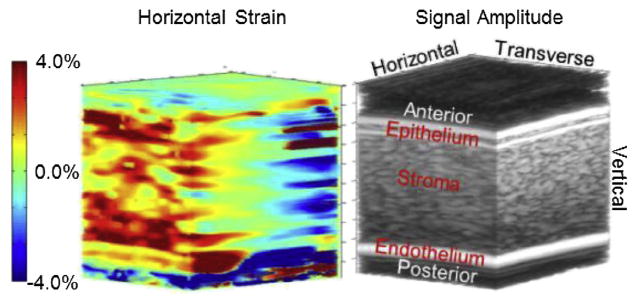
Three-dimensional image of horizontal strain (left) with a conventional B-mode volume image (right) to highlight corneal anatomy. The B-mode image is the same as shown in Figure 3. Note that the strain range is slightly smaller than for vertical strain. Positive strain is occurring in half the volume and negative strain in the other half.
Fig. 6.
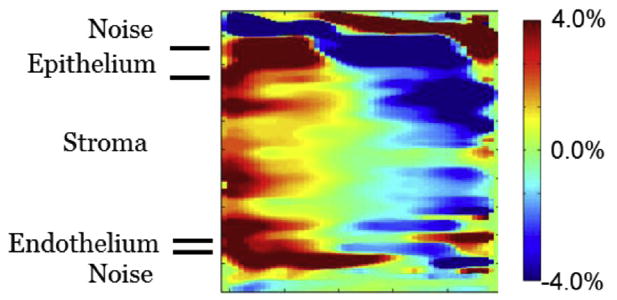
Two-dimensional slice of horizontal strain in the horizontal/vertical plane at the midpoint of the transverse dimension. This is from the same data illustrated in Figure 5. This image confirms the behavior illustrated in Figure 5. It also indicates more clearly that the behavior occurs in all three corneal layers: epithelium, stroma and endothelium.
In contrast to the two previous strains, Figures 7 and 8 are distinctively lacking in obvious features. This is even more apparent considering these images are displayed over the smallest range of any of the strains, from −3% (blue) to +3% (red). The smaller range amplifies noise and other random artifacts. A central plane in Figure 8 confirms the general mechanical behavior throughout the volume. Positive strain in these figures indicates compressional deformation in the transverse direction. Negative strain is expansional deformation along the same direction.
Fig.7.
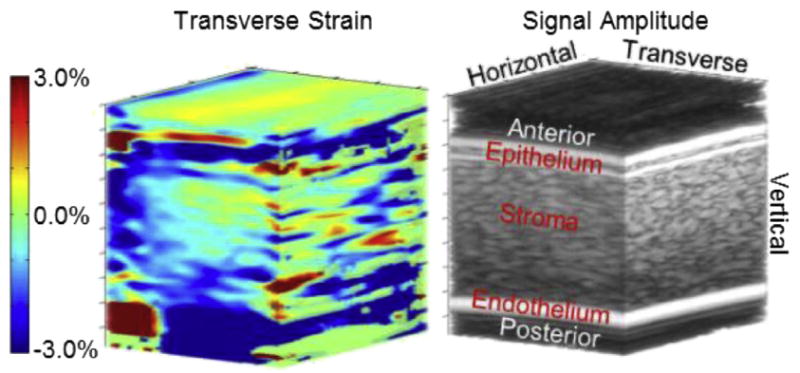
Three-dimensional image of transverse strain (left) with a conventional B-mode volume image (right) to highlight corneal anatomy. The B-mode image is the same as illustrated in Figure 3. Note that the strain range is the smallest of the three strain types. Strain is generally uniform, and average strain in the tissue is even smaller than the range although it is hard to compare because vertical and horizontal strains are bipolar. Except for some possible artifacts on the horizontal/vertical face, there is no general trend and no features that stand out.
DISCUSSION
To understand these results, the mechanical environment of slit deformations must first be understood. Fortunately, slit deformation has been studied since the first versions of the elasticity microscope were investigated (Cohn et al. 1997, 2000). These earlier versions could image in only two dimensions. This was a problem because deformations occurred in three dimensions. It was not possible to track deformation resulting from motion out of the imaging plane. The solution to this problem was to mechanically limit the out-of-plane motion, and slit deformation did precisely this. Figure 9 illustrates how a slit reduces deformation along the slit length (the transverse direction for this article). Arrows illustrate general tissue movement.
Fig. 9.
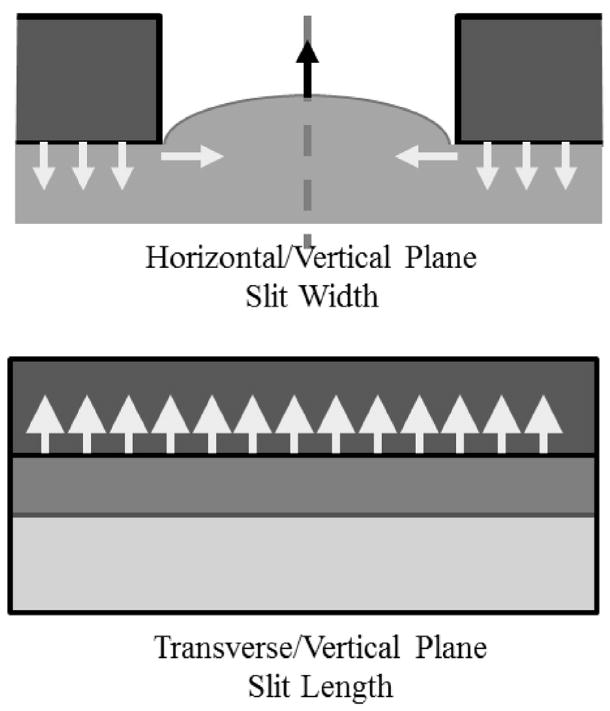
Diagram of soft tissue mechanical behavior under the influence of a slit plate. Deformation is exaggerated to represent behavior. Arrows indicate the general direction of expected deformation. At the (Top) Tissue deformation in the horizontal/vertical plane. Where the plate contacts the tissue it presses downward. Constraints on the tissue convert this downward force into tissue bulging into the slit so that deformation has both vertical and horizontal components there. (Bottom) Transverse/vertical plane along the center of the slit, that is, halfway between the edges. Without transverse slit edges, bulging is uniform in this direction, and so adjacent tissue limits transverse deformation.
In previous original measurements (Cohn et al. 1997, 2000), a small section of prepared tissue was placed in a holder, with its bottom constrained by the water tank. Tissue sides were also constrained, which created a general constraint of volume. Therefore, the only unconstrained surface was the area of the slit. Because tissue is mostly water and, therefore, mostly incompressible, it had no other choice but to bulge into the slit as the deformation plate pressed into the specimen. Because of constraints, downward deformation from the plate was converted to upward deformation in the tissue in the slit, especially in the slit midpoint. In this situation, strain should be mostly expansional near the slit middle.
In the horizontal-vertical plane, there are shearing forces near the edge of the slit that convert into some horizontal strain. The discontinuity of the slit edge creates horizontal strain away from the edge and toward the slit center.
As also illustrated in Figure 9, tissue behaves differently along the slit length in the transverse-vertical plane. In this plane, deformation occurs far from any slit edge. The tissue still bulges up, but it bulges up uniformly, so that neighboring tissue constrains transverse deformation. This constraint limits out-of-plane motion when 2-D imaging is done in the plane orthogonal to the transverse direction. Although 3-D elasticity imaging does not need to limit out-of-plane motion, the slit setup is appealing because its general mechanics are familiar based on published and unpublished previous research.
A cornea still attached to an eye globe provides a couple of complications for the mechanical environment of the deformation plate with slit. First, unlike prepared tissue specimens, the corneal endothelium is only partially constrained by fluid in the aqueous humor, instead of completely constrained by the tank bottom. Also, although prepared tissues are rectangular prisms, the cornea is a partial spheroid. Therefore, when deformed, the cornea applanates. With less constraint by the aqueous humor and applanation, instead of purely expansional deformation as with prepared specimens, the cornea undergoes bipolar strain, both compression and expansion, as revealed by the vertical strain in Figures 3 and 4.
Also note that these results are from deformation occurring just after initial contact between the deformation plate and the cornea. In setting up the measurements, the signal from a single position near the center of the slit is monitored while the deformation plate is moved into contact with the cornea. Initial contact is determined by when the monitored signal starts to move. After initial contact, the plate is moved a few steps more to ensure good contact is made. These conditions could yield mechanical behavior different from that occurring when the cornea is nearly completely applanated. In the latter condition, the specimen should behave similarly to a flat, layered material. The transition from sphere to plate might be another explanation for the expansional deformation seen near the endothelium, which would not be expected from the compression of a flat material. More investigation, especially mathematical modeling, is needed to determine if this is the case.
The general amplitude of the horizontal strain behaves in accordance with slit mechanics. It is less than vertical strain amplitude, but greater than transverse strain amplitude. Vertical strain should be maximum because it is in the direction of deformation from the plate. Transverse strain should be minimum because deformation in this direction is limited by adjoining tissue. The general pattern of the horizontal strain is more complicated. The most probable explanation is a slight misalignment between the slit and the axis of the spheroidal cornea. In such a case, one edge of the slit would come in contact with the cornea before the other edge. There would be compression near the contact edge while the tissue expands near the non-contact edge. This slight misalignment should not be a problem for future phases of the study because the goal is to use a flat plate without a slit, especially for clinical experiments.
Transverse strains seem to behave according to slit mechanics and do not appear to be as affected by the differences between the cornea and the prepared specimens.
Unfortunately, current 3-D strain results are not fully comparable to 2-D corneal strain reported previously (Hollman et al. 2002). This difficulty occurs because tissue in that previous study was being deformed both externally by a deformation plate and internally by edema. (In addition, only axial strain was evaluated. There are no comparable non-axial strains.)
The corneal endothelium continuously pumps fluid out of the stroma. In ex vivo eye globes, this function of the endothelium gradually ceases within a day or two of extraction. Without a functioning endothelium, the stroma quickly undergoes edema, internally swelling by absorbing fluids. As mentioned in the Methods section, the present study compensates for the non-functioning endothelium by using hygroscopic chemicals in the ultrasonic coupling fluid. The previous study simply used de-ionized water.
Results from the previous study are consistent with edema by the stroma. Those results show compression in the epithelium and expansion in the stroma. Swelling caused by stromal edema can contribute to expansional strain in this layer. Because the stroma pulls fluid from it and the epithelium is not susceptible to edema, this layer shows compressional strain. It may be interesting to revisit those experiments as a way of understanding the mechanical effects of edema, although that work is beyond the scope of this present study.
CONCLUSIONS
Behavior of vertical strain is what we expect from a deformation whose greatest component is vertical. Vertical strain amplitude is the largest of the major strains, as expected. Also, there is little strain in the epithelial and endothelial layers. There is an interesting pattern in the stroma that may indicate a depth dependence of mechanical properties from anterior to posterior.
The relative amplitude of the horizontal strain is in agreement with the mechanics of the slit plate, although its strain pattern indicates a possible slight misalignment between the specimen and the slit. The behavior of transverse strain is in general agreement with expected mechanics. We expect the smallest-amplitude strain in this direction and that is what we measured. On the other hand, although transverse strain results are small, they are not necessarily negligible. Also, the 3-D strain measurements indicate the capability of tracking out-of-plane motion in more complicated mechanical environments where transverse strain is not small. These results also give confidence to 2-D studies done with earlier versions of this elasticity microscope.
All three conventional normal strains mostly conform to expectations of the mechanical environment of the slit deformation on a cornea as part of an eye globe. As a result, these strain volume images can be confidently used to re-create volume distributions of the elastic properties, a future goal of this project. Measurement of corneal elastic properties can be used to better understand keratoconus, better avoid LASIK ectasia and lead to better LASIK outcomes.
Acknowledgments
We thank the NIH Resource Center for Medical Ultrasonic Transducer Technology at the University of Southern California for designing and building the high-frequency transducer used in this study. This work was supported in part by a grant from the National Institutes of Health, EY018727, and a NIH Center Core (P30) grant, EY007003.
References
- Chen X, Xie H, Erkamp R, Kim K, Jia C, Rubin JM, O’Donnell M. 3-D correlation-based speckle tracking. Ultrason Imaging. 2005;27:21–36. doi: 10.1177/016173460502700102. [DOI] [PubMed] [Google Scholar]
- Cohn NA, Emelianov SY, Lubinski MA, O’Donnell M. An elasticity microscope. Part I: Methods. IEEE Trans Ultrason Ferroelectr Frequency Control. 1997;44:1304–1319. [Google Scholar]
- Cohn NA, Kim BS, Erkamp RQ, Mooney DJ, Emelianov SY, Skovoroda AR, O’Donnell M. High-resolution elasticity imaging for tissue engineering. IEEE Trans Ultrason Ferroelectr Frequency Control. 2000;47:956–966. doi: 10.1109/58.852079. [DOI] [PubMed] [Google Scholar]
- Guirao A. Theoretical elastic response of the cornea to refractive surgery: Risk factors for keratectasia. J Refract Surg. 2005;21:176–185. doi: 10.3928/1081-597X-20050301-14. [DOI] [PubMed] [Google Scholar]
- Hollman KW. Time progression and depth dependence of high frequency AIBS in ex-vivo porcine corneas. Proceedings of the 2010 IEEE International Ultrasonics Symposium; San Diego, CA. [Google Scholar]
- Hollman KW, Emelianov SY, Neiss JH, Jotyan G, Spooner GJR, Juhasz T, Kurtz RM, O’Donnell M. Strain imaging of corneal tissue with an ultrasound elasticity microscope. Cornea. 2002;21:68–73. doi: 10.1097/00003226-200201000-00015. [DOI] [PubMed] [Google Scholar]
- Jaycock PD, Lobo L, Ibrahim J, Tyrer J, Marshall J. Interferometric technique to measure biomechanical changes in the cornea induced by refractive surgery. J Cataract Refract Surg. 2005a;31:175–184. doi: 10.1016/j.jcrs.2004.10.038. [DOI] [PubMed] [Google Scholar]
- Jaycock PD, O’Brart DP, Rajan MS, Marshall J. 5-year follow-up of LASIK for hyperopia. Ophthalmology. 2005b;112:191–199. doi: 10.1016/j.ophtha.2004.09.017. [DOI] [PubMed] [Google Scholar]
- Kennedy RH, Bourne WM, Dyer JA. A 48-year clinical and epidemiologic study of keratoconus. Am J Ophthalmol. 1986;101:267–273. doi: 10.1016/0002-9394(86)90817-2. [DOI] [PubMed] [Google Scholar]
- Mazzotta C, Balestrazzi A, Traversi C, Baiocchi S, Caporossi T, Tommasi C, Caporossi A. Treatment of progressive keratoconus by riboflavin-UVA-induced cross-linking of corneal collagen: Ultra-structural analysis by Heidelberg Retinal Tomograph II in vivo confocal microscopy in humans. Cornea. 2007;26:390–397. doi: 10.1097/ICO.0b013e318030df5a. [DOI] [PubMed] [Google Scholar]
- Mencucci R, Mazzotta C, Rossi F, Ponchietti C, Pini R, Baiocchi S, Caporossi A, Menchini U. Riboflavin and ultraviolet A collagen crosslinking: In vivo thermographic analysis of the corneal surface. J Cataract Refract Surg. 2007;33:1005–1008. doi: 10.1016/j.jcrs.2007.03.021. [DOI] [PubMed] [Google Scholar]
- Rabinowitz YS. Keratoconus. Surv Ophthalmol. 1998;42:297–319. doi: 10.1016/s0039-6257(97)00119-7. [DOI] [PubMed] [Google Scholar]
- Wollensak G. Crosslinking treatment of progressive keratoconus: New hope. Curr Opin Ophthalmol. 2006;17:356–360. doi: 10.1097/01.icu.0000233954.86723.25. [DOI] [PubMed] [Google Scholar]


