

Abstract
The study objective was to develop a formulation of elacridar to overcome its dissolution-rate limited bioavailability. Elacridar is a P-gp and BCRP inhibitor that has been used to improve the brain distribution of drugs that are substrates of P-gp and BCRP. The chronic use of elacridar is restricted due to poor solubility leading to poor oral bioavailability. A microemulsion formulation using Cremophor EL, Carbitol and Captex 355 (6:3:1) was developed. The elacridar microemulsion was effective in the inhibition of P-gp and Bcrp in MDCKII-transfected cells. FVBn mice were used to determine the bioavailability of elacridar after a 10 mg/kg dose of elacridar in the microemulsion, intraperitoneally and orally; and the absolute bioavailability was determined to be 1.3 and 0.47, respectively. Co-administration of elacridar microemulsion intraperitoneally with oral erlotinib in FVBn mice improved the erlotinib brain penetration three-fold. The current study shows that a microemulsion formulation of elacridar is effective in improving the bioavailability of elacridar and is an effective inhibitor of P-gp and Bcrp; in-vitro and in-vivo. It offers an alternative to the suspension and allows a decrease in the dose required to achieve a significant inhibitory effect at the blood-brain barrier.
Keywords: elacridar, GF120918, bioavailability, microemulsion
Introduction
One of the major hurdles that has to be overcome for effective treatment of brain disorders is the blood-brain barrier (BBB). Efflux transporters such as P-glycoprotein (P-gp) and breast cancer resistance protein (BCRP), work at the level of the BBB to actively efflux drugs from the brain, thus limiting distribution to their target site. Pharmacological inhibition of these efflux transporters may overcome this inadequate delivery of drug therapy to the brain. Elacridar (GF 120918) was initially developed as a multi-drug resistance reversal agent to restore sensitivity of tumor cells to chemotherapeutics such as doxorubicin 1. It is a potent inhibitor of P-gp and BCRP 2,3. This inhibitory effect has been also used to improve the oral bioavailability of drugs that are substrates for P-gp and BCRP in humans, such as topotecan and paclitaxel, by limiting the efflux of substrate drugs into the intestinal lumen4–6. Elacridar has also been used to study the influence of P-gp and Bcrp in preclinical models on the brain distribution of substrate drugs such as morphine, amprenavir and several tyrosine kinase inhibitors 7–11. These studies have shown that inhibition of these efflux proteins at the BBB using elacridar is an effective way to enhance the brain distribution of drugs that are substrates for P-gp and BCRP. This strategy could result in improved efficacy of several drugs that have a site of action in the brain, but have CNS distribution limited by the BBB. Therefore, the use of elacridar as a drug delivery adjuvant has the potential to enhance efficacy of these drugs by improving their distribution to target sites within the CNS.
Co-administration of elacridar as an adjuvant treatment presents several challenges, in both preclinical and clinical applications. The bioavailability of elacridar in the mouse after an oral or intraperitoneal dose is only about 22% and 1%, respectively12. Unfavorable physicochemical properties, such as poor solubility and high lipophilicity, result in dissolution-rate limited absorption from the gut lumen 13. Therefore, remarkably large doses of elacridar, as much as 100 mg/kg to 500 mg/kg, have been administered orally in preclinical species to achieve plasma concentrations that can be effective for inhibition of P-gp and Bcrp 7,14. Moreover, given the magnitude of these doses, chronic multi-dose regimens are problematic. The poor solubility of elacridar also limits its development as an injectable. These are major obstacles in the practical use of elacridar in both preclinical animal models and in clinical applications. Since the oral absorption of elacridar is dissolution-rate limited 13, improving the dissolution rate would be an important strategy to overcome this limitation Several approaches could be used to improve the dissolution rate of elacridar, including: the preparation of a microemulsion, a solid dispersion, a water soluble prodrug, as well as the use of surfactants, cyclodextrins or lipids.
Given the success of some microemulsions in increasing bioavailability, and reducing variability in absorption15, we chose the microemulsion approach to improve the absorption of elacridar. Microemulsions are thermodynamically stable, transparent or translucent, optically isotropic colloidal dispersions, with low viscosity and fine droplet size (<100 nm). Microemulsions could be generated using self microemulsifying drug delivery systems (SMEDDS), which are comprised of a mixture of surfactant, co-surfactant and lipid, that upon agitation with water, form microemulsions16. Microemulsions improve the absorption of drugs by improving dissolution 17,18. SMEDDS and microemulsions have been widely used to improve the bioavailability of poorly soluble drugs. Neoral (cyclosporine A), Fortovase (saquinavir), and Norvir (ritonavir) are examples of commercially available SMEDDS, which have been employed to improve bioavailability of these poorly soluble drugs.
Given its high lipophilicity and poor bioavailability, elacridar is a good candidate for a microemulsion formulation. The objective of this study was to develop and characterize a microemulsion formulation of elacridar, assess its systemic bioavailability, and determine its pharmacokinetics in plasma and brain. An improvement in the bioavailability of elacridar may result in a practical multiple dosing regimen, one that will allow chronic inhibition of the transporters at the BBB.
Materials and Methods
Chemicals and reagents
Elacridar ( GF 120918 ) [N-(4-(2-(1,2,3,4-tetrahydro-6,7-dimethoxy-2-isoquinolinyl)ethyl)phenyl)-9,10-dihydro-5-methoxy-9-oxo-4-acridine carboxamide] of molecular weight 563.64 g/mole was purchased from Toronto Research Chemicals ( Ontario, Canada). Cremophor EL, Cremophor RH40, Solutol HS, Captex 355, Captex 300 were obtained from Abitech (Janesville, WI). Carbitol [2-(2-Ethoxyethoxy) ethanol] was purchased from Sigma-Aldrich (St. Louis, MO). Erlotinib was purchased from LC Laboratories (Woburn, MA, USA). [14C]-dasatinib was a kind gift sample from Bristol-Myers Squibb. All other chemicals used were reagent grade or HPLC grade from Sigma-Aldrich (St. Louis, MO).
Solubility
The solubility of elacridar in various components was determined as follows: a small quantity of elacridar (~ 1 mg) was added to a 100 ul of vehicle in a closed microcentrifuge tube. The tubes were shaken on an orbital shaker at 37 ºC at 200 rpm for 24 hours to allow for equilibration. At the end of 24 hours, the tubes were removed from the shaker and centrifuged at 10,000 rpm for 5 min to separate the solubilized fraction from the un-dissolved material. The supernatant was pipetted, diluted and concentration of elacridar was determined by LCMS-MS.
Construction of phase diagrams
A series of mixtures was prepared with various ratios of Solutol HS and Cremophor EL. The phase behavior of the system was studied at surfactant to co-surfactant ratios of 8:1, 4:1 and 2:1. Aliquots of each surfactant:co-surfactant mixtures were mixed with oil and then purified water. Mixtures were mixed by vortexing at room temperature. The samples were assessed visually and determined to be either coarse emulsions, gels or clear and transparent microemulsions. The microemulsion region was plotted on a ternary phase diagram. The microemulsion region represents clear and optically isotropic systems. The non-microemulsion region represents the dispersed and turbid systems. These were identified by visual inspection.
Emulsion droplet size analysis
The droplet size of the microemulsion was measured by the dynamic light scattering technique using a Delsa™Nano C (Beckman Coulter, Inc, Chaska, MN). The microemulsion formulation was diluted 50-fold in purified water prior to droplet size measurements.
In vitro studies
Cellular accumulation studies were conducted in epithelial Madin-Darby canine kidney II (MDCKII) cells over expressing either murine BCRP (MDCKII-Bcrp1) or human P-gp (MDCKII- MDR1) and were obtained from Dr. Piet Borst and Dr. Alfred H. Schinkel (The Netherlands Cancer Institute). Cells were cultured in Dulbecco’s modified Eagle’s medium (DMEM) supplemented with 10% fetal bovine serum, penicillin (100 U/ml), streptomycin (100 μg/ml), and amphotericin B (250 ng/ml) (all Sigma-Aldrich) and maintained at 37°C with 5% CO2 under humidifying conditions.
In vitro efficacy of elacridar microemulsion
Intracellular accumulation of radiolabelled dasatinib in presence of the optimized elacridar microemulsion as well as elacridar as a solution [DMSO diluted with cell assay buffer, (122 mM NaCl, 25 mM NaHCO3, 10 mM glucose, 10 mM HEPES, 3 mM KCl, 2.5 mM MgSO4, 1.8 mM CaCl2, and 0.4 mM K2HPO4)]was examined in wild-type and MDCKII MDR1 and Bcrp1 transfected cells using 24-well polystyrene plates (Thermo Fisher Scientific, Waltham, MA). We choose dasatinib as a model compound since we have shown in our previous studies that it is a dual substrate for both P-gp and Bcrp10. Cells were seeded at a density of 1× 10⁵ cells per well. Fresh media was supplied every two days to the cells until a confluent monolayer was obtained. Prior to starting the experiment, the nutrient media was aspirated and cells were washed with pre-warmed cell assay buffer.
To study the effect of elacridar microemulsion on radiolabelled dasatinib cellular accumulation, cells were preincubated for 30 minutes with one milliliter of treatment buffer, including elacridar solution (5 uM), elacridar microemulsion (1 uM), as well as equal volume of blank microemulsion components. One milliliter of tracer solution, 14C dasatinib added to the elacridar solution, was added to the cells and the plates were incubated for 1 hour in an orbital shaker at 37 ºC. At the end of the incubation period, the radiolabelled drug solution was aspirated from the wells and the cells were washed with ice-cold phosphate buffered saline. 500 μl of 1 % Triton X solution was added to the wells to solubilize the cells. The BCA protein assay (Thermo Fisher Scientific, Rockford, IL) was used to determine the protein concentrations in the solubilized cell fractions. Radioactivity in each 100 μl sample was determined by liquid scintillation counting (LS-6500; Beckman Coulter, Fullerton, CA). The radioactivity in the cell fractions was normalized to the protein concentrations in each well. The drug accumulation in the cells was expressed as amount of radioactivity (dpm) per microgram of protein.
Effect of increasing concentration of elacridar in microemulsion on cellular accumulation of radiolabeled dasatinib
The intracellular accumulation of radiolabelled dasatinib with increasing concentrations of elacridar as the microemulsion formulation was examined in MDCKII-WT, MDR1, and Bcrp1 cells. The cells were pre-incubated for 30 minutes with one milliliter of increasing concentrations of elacridar microemulsion. A control experiment was carried out with blank microemulsion, using an equivalent volume of microemulsion components that was used in the treatment groups.. One milliliter of tracer solution of 14C dasatinib in the elacridar solution was added to the cells and the plates were incubated for 1 hour in an orbital shaker at 37 ºC. At the end of the incubation period, the radiolabelled drug solution was aspirated from the wells and the cells were washed with ice-cold phosphate buffered saline. The rest of the experiment was carried out as described above. The accumulation of radiolabeled dasatinib in the cells was expressed as a percent accumulation when elacridar microemulsion is absent, where the dpm of radiolabeled dasatinib is normalized to cell protein.
Animals
In vivo studies were conducted in FVB wild-type mice (Taconic Farms, Germantown, NY). All animals were 8–10 weeks old at the time of the experiment. All mice were maintained under a 12-hour light/dark cycle, had unlimited access to food and water, and were maintained in a temperature-controlled environment. All studies were approved by the Institutional Animal Care and Use Committee of the University of Minnesota.
Determination of bioavailability
The dosing solution was prepared by dissolving elacridar in a mixture of the surfactants and oil at a ratio that would allow a 3 mg/ml solution. This solution was then diluted with saline to obtain a 1 mg/ml microemulsion. Mice were given a 10 mg/kg dose either by oral gavage or by intraperitoneal injection. Mice were also administered elacridar microemulsion intravenously at dose of 2 mg/kg by tail vein injection. Animals were sacrificed at predetermined time points (n=4 at each time point) by carbon dioxide euthanasia. Plasma and brain were collected at 30 min, 1, 2, 4, 8 and 12 hours post-dose. Blood was collected by cardiac puncture and transferred to heparinized tubes. Plasma was obtained by centrifugation of blood at 7000 rpm for 10 min. Whole brain was isolated from skull and rinsed with ice-cold saline and then flash frozen with liquid nitrogen. Both plasma and brain specimens were stored at −80 ºC before analysis by LCMS-MS.
Influence of elacridar microemulsion formulation on brain penetration of erlotinib
To determine whether the elacridar microemulsion improves the brain distribution of substrate drugs, we selected erlotinib as a model P-gp and Bcrp substrate. The elacridar microemulsion formulation was prepared as described above. Erlotinib dosing formulation was prepared by suspending erlotinib in 1% Tween 80 to obtain a 2 mg/ml suspension. Mice were administered 5 mg/kg of elacridar microemulsion by intraperitoneal injection 30 min prior to erlotinib oral administration. As a positive control, a 10 mg/kg dose of elacridar in solution (40 % DMSO, 40% propylene glycol, 20% water) was administered to another group of mice, 30 min prior to erlotinib administration. All mice were administered 10 mg/kg erlotinib by oral gavage. Animals were sacrificed at 1 hour post-dose of erlotinib by CO2 euthanasia. Blood and brains were collected as described above. The concentrations of elacridar and erlotinib were measured in plasma and brain by LCMS-MS.
Analysis of elacridar and erlotinib by LCMS-MS
The concentrations of elacridar and erlotinib in mouse plasma and brain were determined by HPLC coupled with mass spectrometry. Brain samples were thawed and homogenized with three volumes of 5% bovine serum albumin using a tissue homogenizer (Thermo Fisher Scientific, Rockford IL). Twenty nanograms of internal standard, tyrphostin (AG1478) was added to 50 ul of plasma and 100 ul of brain homogenate along with 100 ul of pH 11 buffer. Liquid-liquid extraction was carried out by adding 1ml of ethyl acetate and vortexing the mixture, followed by centrifugation at 7500 rpm for 15 min at 4 ºC. 600 ul of the organic phase supernatant was dried under nitrogen, and reconstituted in 100 ul of mobile phase and transferred to autosampler vials. A 5 μl volume was injected into the HPLC using a temperature-controlled auto sampler maintained at 10ºC. A method to simultaneously detect elacridar and erlotinib was developed. The column used for chromatographic separation, purchased from Agilent Technologies (Santa Clara, CA), was an Eclipse XDB-C18 RRHT threaded column (4.6 mm id × 12.5 mm, 5 u). The mobile phase was composed of acetonitrile:20 mM ammonium formate (with 0.1 % formic acid) (42:58 v/v) with a flow rate of 0.25 ml/min. A Thermo Finnigan TSQ Quantum 1.5 detector (Thermo Fisher Scientific) was used to analyze the eluent. The instrument was equipped with an electrospray interface. The samples were ionized by the electrospray probe and analyzed in the positive ionization mode operating at a spray voltage of 4500 V for elacridar, erlotinib and the internal standard. The spectrometer was programmed to allow the [MH]+ ion of elacridar at m/z 564.6, m/z of 395.18 for erlotinib and 316.67 for the internal standard to pass through the first quadrupole (Q1) and into the collision cells (Q2). The collision energy was set at 39 V for elacridar and erlotinib, 9V for tryphostin. The product ions for elacridar (m/z 252.9), erlotinib (m/z 278.9 and 336.9) and internal standard (m/z 300.9) were monitored through quadrupole 3(Q3). The scan width and scan time for monitoring the two product ions was 1.5 m/z and 0.5 s, respectively. The assay was sensitive and linear over a range of 2.5 ng/ml to 1000 ng/ml.
Pharmacokinetic Analysis
Pharmacokinetic parameters obtained from the concentration-time profiles in plasma and brain were calculated by non-compartmental analysis using Phoenix WinNonlin 6.1 (Mountain View, CA). The area under the concentration-time curve for plasma and brain were calculated using the trapezoidal method. The AUCextrapolated (AUC from last measured time point) was estimated by dividing the last measured concentration by the terminal rate constant. For calculating the AUCplasma after an intravenous dose, a concentration at time zero that was extrapolated from the first few data points was used for determining concentration at time zero. In our previous study12 we have calculated the AUCplasma after intravenous administration of elacridar solution [in a vehicle containing DMSO: propylene glycol, and saline at 2:2:1 (v/v/v)] in FVB wild-type mice, and we used these data to calculate the absolute bioavailability. The absolute bioavailability (F) was calculated as the ratio of dose-normalized AUCplasma after oral or intraperitoneal microemulsion administration to dose-normalized AUCplasma after intravenous dosing of elacridar solution which was calculated in a previously published study 12.
The brain-to-plasma partition coefficient of elacridar (Kp,brain) was calculated as the ratio of AUCs (AUCbrain/AUCplasma)
Statistical Analysis
Comparison between groups were made using SigmaStat, version 3.1 (Systat Software, Inc., San Jose, CA). Statistical difference between two groups was tested by using the two-sample t-test, and significance was declared at p < 0.05. Multiple groups were compared by one-way analysis of variance with the Holm-Sidak post hoc test for multiple comparisons at a significance level of p < 0.05.
Results
Solubility studies
The components evaluated for the microemulsion were first examined for their capability to dissolve elacridar. The results are listed in Table 1. The components selected for further development of the formulation were chosen on the basis of solubility of elacridar in those components. Cremophor EL provided the best solubilization capacity and was therefore chosen for use in the microemulsion. Cremophor itself is an inhibitor of P-gp19; therefore appropriate controls have been used in all experiments.
Table 1.
Equilibrium solubility of elacridar at 37 º C in various components after 24 hours.
| Solvent | Solubility (mg/ml) |
|---|---|
| Water | 12.3 ± 5.8 × 10⁻⁵ mg/ml |
| Captex 355 (oil) | 0.3 ± 0.001 mg/ml |
| Captex 300 (oil) | 0.3 ± 0.001 mg/ml |
| Carbitol (co-surfactant) | 1.31 ± 0.05 mg/ml |
| Solutol (surfactant) | 0.85 ± 0.06 mg/ml |
| Solutol microemulsion system | 0.84 ± 0.03 mg/ml |
| Cremophor EL (surfactant) | 4.27 ± 0.31 mg/ml |
| Cremophor EL microemulsion system | 4.2 ± 0.2 mg/ml |
Pseudoternary phase diagrams and droplet size
Pseudoternary phase diagrams of oil, surfactant, co-surfactant and water were developed by preparing a number of mixtures at room temperature. Phase behavior of the system was studied using several surfactant to co-surfactant ratios (Smix = 2:1, 4:1, 8:1, where the Smix denotes the mixture of surfactant to co-surfactant).
The microemulsion region was found to be present at high surfactant concentration and low oil concentrations at all Smix ratios. The microemulsion region was larger at Smix ratio 8:1 as compared to 4:1 and 2:1. The surfactant: co-surfactant ratio of 2:1 was chosen since the final viscosity of the microemulsion was better suitable for injectable formulations. The formulation chosen was Cremophor EL: Carbitol: Captex in 6:3:1 ratio. A 3 mg/ml solution of elacridar was prepared in the microemulsion components in the absence of water. For the in vitro and in vivo studies, the 3 mg/ml solution was diluted with purified water or saline. To examine the droplet size of the microemulsion, a 1 mg/ml elacridar microemulsion was diluted 20-fold. The droplet size for the microemulsion without the drug was found to be 16.8 ± 0.8 nm. When the drug was present in the microemulsion, the droplet size was slightly larger, 19.1 ± 0.3 nm. A similar increase in droplet size with addition of drug was observed in a previously published study with Cremophor EL and cyclosporine20.
In vitro efficacy of elacridar microemulsion
This study was carried out to determine if the microemulsion formulation of elacridar is as effective in inhibiting P-gp and Bcrp in an in vitro model as the conventional solution formulation. The efficacy of elacridar microemulsion in inhibiting P-gp and Bcrp was measured using MDCKII cells that over-express P-gp and Bcrp and wild-type cells were used as a control. Radiolabeled dasatinib was used in tracer quantities as a model substrate for P-gp and BCRP 10. The accumulation of dasatinib in MDR1-overexpressing cells increased several fold upon treatment with elacridar microemulsion (Figure 1A). There is a similar increase accumulation of radiolabeled dasatinib in Bcrp1-transfected cells on treatment with elacridar microemulsion (Figure 1B). A solution of elacridar in DMSO was used as a control. The increase in radiolabeled dasatinib accumulation shows that the microemulsion formulation of elacridar is effective in inhibiting P-gp and Bcrp in vitro at an elacridar concentration of 1 uM. Microemulsion components without any added elacridar were used a control group because Cremophor EL has been shown to be an inhibitor of P-gp 19,21. However, the microemulsion components did not show any inhibitory effect on the P-gp and Bcrp over-expressing cell lines. This would indicate that the Cremophor EL is present at a concentration that is well below its IC50 for inhibition of either transport system.
Figure 1.

Effect of elacridar microemulsion (1 uM) on accumulation of radiolabelled dasatinib in MDCKII wild type, MDCKII MDR1 and Bcrp1 transfected cells with elacridar solution (5 uM) and equivalent volume of microemulsion components as control. Elacridar microemulsion was effective in increasing the accumulation of radiolabeled dasatinib in the MDR1- transfected cell line (A), as well as Bcrp1-transfected cells (B) as compared to control.
Effect of increasing concentrations of elacridar as a microemulsion on cellular accumulation of radiolabeled dasatinib
The percent accumulation of radiolabeled dasatinib in MDCKII MDR1 and Bcrp1 cells showed unexpected results when the concentration of elacridar microemulsion was increased. The percent accumulation of radiolabeled dasatinib first showed an increase followed by a decrease in both sets of transfected cells (Figure 2). This was unexpected since previous experiments indicated that increase in elacridar concentrations result in a non-linear increase in the cellular accumulation of radiolabeled dasatinib (submitted). The control groups also showed a decrease in the accumulation from 100% to about 16% in both MDCKII MDR1 and Bcrp1 transfected cells. This phenomenon suggests that the Cremophor EL contributed by the microemulsion system is well below a concentration that can inhibit P-gp. One could hypothesize that the decrease in the cellular accumulation may occur due to a micellar trapping effect. At higher concentrations of the microemulsion components, the surfactant mixture can create micelles that can entrap the radiolabeled drug. This phenomenon has been previously observed with a number of different monomeric surfactants including Pluronic 85 22. This unexpected phenomenon raises the possibility that greater concentrations of the microemulsion and its components may adversely affect the cellular accumulation of drugs due to the micellar effect in vivo.
Figure 2.
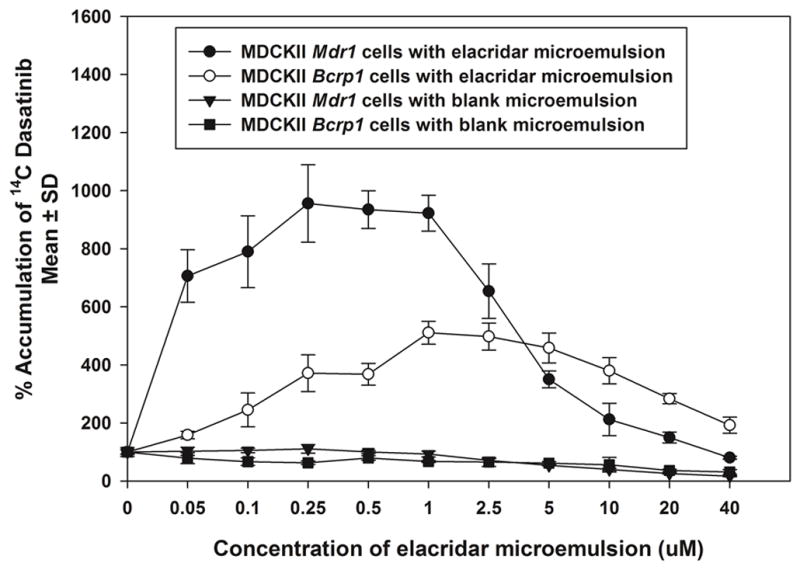
Effect of increasing concentrations of elacridar microemulsion on accumulation of radiolabelled dasatinib in MDCKII wild type, MDCKII MDR1 cells and MDCKII Bcrp1 cells. The cellular accumulation of dasatinib increases in both sets of transfected cells and then decreases with increasing concentrations of elacridar microemulsion. In the control group, the cellular accumulation shows a decline with increase in the volume of microemulsion components (in the absence of elacridar), suggesting that the decrease in the cellular accumulation is a function of the microemulsion components.
Intraperitoneal and oral administration of elacridar microemulsion
The pharmacokinetics of elacridar microemulsion in plasma and brain were studied when the microemulsion was administered intraperitoneally and orally. The bioavailability of elacridar was calculated using equation 1, using the area under the concentration time curve for plasma (AUCplasma) calculated after an intravenous dose of elacridar solution at 2.5 mg/kg from a previously published study 12.
A 10 mg/kg dose of elacridar microemulsion was administered intraperitoneally to FVB mice. The plasma concentrations of elacridar showed a maximal concentration of 6.8 ± 0.7 μg/ml at 1 hour post dose (Figure 3A). The brain concentrations showed slower rate of increase, with very low concentrations at the initial times, and the peak concentration of elacridar was reached at about 4 hours post dose. The brain-to-plasma concentration ratios of elacridar are very low at initial time points and then show an increase to 2.3 ± 0.6 at 4 hours post dose. The total exposure of elacridar achieved in the plasma and the brain are much higher than those seen after a 100 mg/kg dose administered as a suspension12 [at 100 mg/kg elacridar as suspension: AUCplasma = (63.5 ± 6.6), AUCbrain = (19.9 ± 4.7) μg.min/ml; at 10 mg/kg elacridar as microemulsion : AUCplasma = (840 ± 45), AUCbrain = (843 ± 27.6) μg.min/ml]. These results suggest that an intraperitoneal administration of elacridar in the microemulsion formulation could be a more efficient mode of administration of elacridar in a chronic dosage regimen for studies in preclinical models of cancer.
Figure 3.

Plasma and brain concentrations of elacridar after a 10 mg/kg intraperitoneal dose of elacridar microemulsion (A). The plasma concentrations reach a maximal concentration at 1 hour post dose, while the brain concentrations reach a maximum at 4 hours post dose. The brain-to-plasma concentration ratio (B), following a 10 mg/kg IP dose of elacridar microemulsion, shows a slow increase to a maximum value followed by a decrease as a function of time.
A 10 mg/kg oral dose of elacridar microemulsion was administered to mice via oral gavage. The plasma concentrations reached a maximum at 1 hour post-dose, followed by a sharp decline in plasma concentrations (Figure 4A). The plasma concentrations reached a maximum of 1.3 ± 0.1 μg/ml, at 1 hour post-dose. Brain concentrations show a much slower increase to maxima and reach a peak only at 8 hours post dose. The brain-to-plasma ratio shows an increase followed by a slow decline (Figure 4B). The brain concentrations show a lag time, reaching a maximum of 0.3 ± 0.1 μg/ml, at 4 hours post-dose. The brain-to-plasma concentration ratios reach a maximum of 1.1 ± 0.2 at 4 hours and show a slight decline at 12 hours. The brain and plasma concentrations, when normalized to the dose, were higher than the dose normalized concentrations after an oral administration of conventional suspension at a dose of 100 mg/kg 12, e.g., at 100 mg/kg oral dose of elacridar suspension, Cmax in plasma = 0.7 ± 0.1 μg/ml; Cmax in brain = 4.34 ± 0.1 μg/ml.
Figure 4.

Brain and plasma concentrations of elacridar after a 10 mg/kg oral dose of elacridar microemulsion (A). The plasma concentrations reach a peak at 1 hour post dose, while the brain concentrations reach a peak only at 8 hours post dose. The brain-to-plasma concentration ratios of elacridar after a 10 mg/kg oral dose of elacridar microemulsion (B), show an increase to a maximum value, followed by a decrease.
The half-life of elacridar when administered as an intraperitoneal injection was 3.2 hours, as compared to 10.5 hours when administered orally (Table 2). Interestingly, when elacridar was administered orally as a suspension, the half-life was also found to be ~4 hours for intraperitoneal administration and ~10 hours for oral administration 12.
Table 2.
Pharmacokinetic parameters of elacridar in plasma and brain when administered as a microemulsion formulation in FVB mice, as a 10 mg/kg dose intraperitoneally and orally and 2 mg/kg intravenously.
| Tmax (min) | Cmax (ug/ml) | Half-life (hr) | AUC0-tlast (ug*min/ml) | AUC0-inf (ug*min/ml) | Kp | ||
|---|---|---|---|---|---|---|---|
| Intraperitoneal administration ( 10 mg/kg) | plasma | 60 | 6.8 ± 0.7 | 3.2 | 840 ± 45 | 962 | 0.95 |
| brain | 240 | 2.2 ± 0.1 | 2.8 | 843 ± 27.6 | 916 | ||
| Oral administration (10 mg/kg) | plasma | 60 | 1.3 ± 0.1 | 10.4 | 163 ± 9 | 270 | 0.53 |
| brain | 240 | 0.3 ± 0.1 | 4.1 | 116 ± 33 | 142 | ||
| Intravenous administration (2.5 mg/kg) | plasma | 30 | 0.4 ± 0.1 | 2.2 | 74.5 ± 4.2 | 90.9 | 2.5 |
| brain | 30 | 2 ± 0.2 | 1.5 | 217 ± 13.7 | 226 |
The AUCplasma (0-inf) after an oral microemulsion dose was found to be 270.5 min*μg/ml. This is lower as compared to the AUCplasma(0-inf) calculated after intraperitoneal administration of the same dose (962.41 min*μg/ml) (Table 2). This could arise due to the differences in the pH and the area available for absorption in the GIT versus the peritoneal cavity.
The brain-to-plasma partition coefficient (Kp) was calculated by obtaining a ratio of AUCbrain to AUCplasma. The Kp was very different for the two routes of administration. This could be an effect of the relative AUCplasma obtained post intraperitoneal and oral administration, which may lead to saturation of the efflux from the brain.
Intravenous administration of elacridar microemulsion
Elacridar microemulsion was administered to FVB wild type mice at a dose of 2.5 mg/kg to study the distribution of elacridar when it is administered as the microemulsion formulation as an intravenous dose. The plasma concentrations show a mono-exponential decline (Figure 5A). The brain concentrations at each time-point were found to be higher than the corresponding plasma concentrations. The brain-to-plasma concentration ratios are greater than one at all time-points, and show a peak at 30 mins (Figure 5B).
Figure 5.

The brain and plasma concentrations of elacridar after an intravenous dose of 2 mg/kg elacridar microemulsion (A). The brain concentrations of elacridar are higher than plasma at all time-points. The brain-to-plasma concentration ratios of elacridar after an intravenous dose of 2mg/kg elacridar microemulsion (B) are higher than one at all measured time-points. The brain-to-plasma ratios show an increase to a maximum value followed by a decrease.
The AUCplasma(0-inf) (90.9 ug*min/ml) was found to be lower than AUCbrain(0-inf) (226.8 ug*min/ml) (Table 2). The Kp was calculated to be 2.5 indicating that when administered intravenously the elacridar microemulsion has greater partition into the brain. The half-life in plasma (2.16 hours) was longer than compared to the half-life in the brain, 1.5 hours (Table 2).
Bioavailability of elacridar microemulsion
The absolute bioavailability of elacridar microemulsion was calculated with respect to the area under the curve calculated after an intravenous injection of elacridar solution at 2.5 mg/kg from a previously published study12. The absolute bioavailability after an intraperitoneal injection of the microemulsion may be 100%, since the calculated value was 135%, a possible overestimation given the single measurement of AUC due to destructive sampling (Table 3). The oral bioavailability post microemulsion dosing was calculated to be 47%, which is a two-fold increase from administration of an oral suspension. Hence, the microemulsion formulation was found to improve the oral and intraperitoneal bioavailability of elacridar. Another advantage of using the microemulsion formulation is that the dose required to produce an effect may be reduced by several fold. This is important since elacridar could be potentially administered as an adjuvant to a chronic chemotherapeutic dosage regimen, and reduction in the daily dose administered could only help avoid potential adverse drug reactions.
Table 3.
Plasma pharmacokinetics of elacridar as microemulsion formulation and bioavailability of elacridar after intraperitoneal, oral and intravenous administration of elacridar (* F is calculated with using AUCplasma after elacridar solution as a control.)
| Route of administration | Dose | CL/F (ml/min) | Vd/F (ml) | F |
|---|---|---|---|---|
| Intraperitoneal | 10 mg/kg | 0.31 | 88.69 | 1.35 |
| Oral | 10 mg/kg | 1.13 | 1020.69 | 0.47 |
| Intravenous | 2.5 mg/kg | 0.70 | 0.14 |
Influence of elacridar microemulsion on brain penetration of erlotinib in FVBn mice
Erlotinib is a dual substrate for P-gp and BCRP23–25. The presence of P-gp and BCRP at the BBB limits the brain distribution of erlotinib 23. One of the aims of this study was to improve the brain distribution of erlotinib by co-administration of elacridar as a microemulsion formulation. Erlotinib was administered as a 20 mg/kg oral dose to FVB wild-type mice. The mice were pretreated with either intravenous elacridar in a conventional dosing solution (10 mg/kg, positive control) or an intraperitoneal injection of elacridar microemulsion (5 mg/kg). The plasma concentrations of erlotinib at one hour post dose were not significantly different across treatment groups (Figure 6A). The mean brain concentration of erlotinib in the control group that did not receive an inhibitor was found to be 76.4 ± 7.8 ng/ml. The co-administration of elacridar as a solution (positive control), increased the mean brain concentrations of erlotinib to 366 ± 299 ng/ml and there was considerable inter-individual variability observed. The administration of the elacridar microemulsion increased the mean erlotinib brain concentrations three fold to 253 ± 22.7 ng/ml (Figure 6A). The mean plasma elacridar concentrations achieved after an intravenous dose (2.5 mg/kg) of elacridar solution were found to be 560 ± 60 ng/ml, compared to 3200 ± 200 ng/ml after an intraperitoneal dose (5 mg/kg) of the microemulsion.
Figure 6.

The brain and plasma concentrations of erlotinib (A) at 1 hour post a 20 mg/kg oral dose. Pretreatment with elacridar solution (10 mg/kg intravenously) was used as a positive control. Elacridar microemulsion was administered intraperitoneally at 5 mg/kg. Administration of elacridar microemulsion improved the brain concentrations of erlotinib significantly (p<0.001). Pane B shows the brain-to-plasma ratios of erlotinib at one hour post-dose, with either elacridar solution (10 mg/kg intravenously) or elacridar microemulsion (5 mg/kg). The brain-to-plasma ratio of erlotinib increased with co-administration of elacridar microemulsion (*p<0.05).
The brain-to-plasma concentration ratios of erlotinib were calculated to normalize any effect due to difference in plasma concentrations of erlotinib across the groups. At 1 hour post-dose, the brain-to-plasma concentration ratio for the control group was calculated to be 0.07 ± 0.01, on co-administration of elacridar solution (positive control), the brain-to-plasma ratio increased to 0.37 ± 0.15 (Figure 6B). The treatment group that received elacridar microemulsion also showed a statistically significant increase in brain-to-plasma ratio of erlotinib to 0.2 ± 0.04. This experiment shows that the administration of elacridar as a microemulsion formulation can improve brain distribution of erlotinib and potentially other substrates across the BBB using a practical dose and more convenient route of administration for chronic preclinical studies.
Discussion
The use of elacridar in preclinical models, as well as in clinical settings, for chronic administration is limited by its poor oral absorption and lack of injectable formulations. The poor solubility of elacridar in aqueous solvents has been limiting in formulating an injectable dosage form. The use of surfactants and lipids can enhance the solubility and permeability of poorly soluble drugs26,27. This strategy has been used to improve the oral bioavailability of drugs such as antiviral compounds (marketed preparations of ritonavir, saquinavir), anesthetics (propofol), as well as chemotherapeutics (paclitaxel) 15,28,29. The objective of this study was to create a microemulsion formulation of elacridar that would improve its systemic bioavailability that also could be delivered on a chronic basis either orally or via injection into the peritoneal cavity (in preclinical studies). Many molecularly-targeted agents that are currently being developed for the treatment of glioblastoma are intended to be administered on a daily basis. Therefore, the long-term goal of the current study is to create a formulation that could be co-administered with these agents to improve their distribution across the BBB in the glioblastoma patient30.
The in vitro studies herein suggest that elacridar retains its inhibition of P-gp and Bcrp in the microemulsion formulation. Cremophor EL, the surfactant used in the microemulsion, is known to be also a weak inhibitor of P-gp19. The microemulsion vehicle was used as a control to ensure that this surfactant at the concentrations used in the formulation did not influence P-gp function. However, a higher concentration of the microemulsion vehicle seems to cause a decrease in cellular accumulation of substrate drugs, possibly due to a micellar-trapping mechanism. This phenomenon may have some implications in its future use in vivo. A micellar-trapping mechanism of Cremophor EL has been shown to result in preferential binding of paclitaxel to the surfactant versus erthyrocyte binding components at higher concentrations31.
The oral bioavailability of elacridar is purportedly dissolution-rate limited 13. In a previous study, we calculated that the absolute bioavailability of elacridar when administered as a suspension at 100 mg/kg dose to be approximately 22% 12. A phase I study carried out with elacridar and topotecan showed that systemic exposure (AUC) after oral administration exhibits high variability5. This limited bioavailability of elacridar post administration of a suspension at such a high dose; coupled with high variability, indicates the need to develop a more bioavailable and reliable formulation of elacridar, particularly for chronic dosing. Microemulsion formulations of other poorly soluble drugs, such as cyclosporine (Neoral), have been particularly successful in increasing the oral bioavailability, and reducing the variability in the bioavailability of these drugs. A microemulsion formulation of cyclosporine prepared with cremophor20 was used as a model composition to prepare a formulation of elacridar. When elacridar is administered as this microemulsion formulation at 10 mg/kg, the bioavailability increased two-fold to 47%. The plasma concentration time profile shows a peak at 1 hour postdose followed by a rapid decline (Figure 4A). It is possible that this could be a result of precipitation of elacridar from the microemulsion system due to the changes in pH through the GIT, or because of dilution and digestion of the dispersed excipients in the GIT 32. Microemulsion systems are known to be sensitive to changes in the pH, and rapid changes in the pH could lead to instability in the system causing a precipitation of elacridar 33. The slow absorption of the precipitated elacridar from the GIT may lead to flip-flop kinetics resulting in a longer than expected half-life of ~10 hours (seen after IV dosing 12). The longer than expected half-life is consistent with that seen post oral administration of a suspension of elacridar 12.
After an intraperitoneal administration of elacridar microemulsion, the oral bioavailability was calculated to be greater than 100% (Table 3). In a previously published study, the bioavailability of elacridar suspension after an intraperitoneal administration was only about 1% 12. As such, the plasma concentrations of elacridar achieved after an intraperitoneal administration of the microemulsion are much higher than those achieved after administration of a suspension 12. The plasma concentrations of elacridar after administration of the suspension could be lower due to poor dissolution of the suspension particles in the intraperitoneal fluid, leading to a slower absorption rate. When elacridar is administered as a microemulsion, it is already in a solubilized form, which allows it to be readily absorbed into the systemic circulation. This improves the dose-normalized area under the curve, leading to enhanced bioavailability.
An intravenous administration of elacridar microemulsion was carried out to examine the brain distribution of elacridar. The brain concentrations were much higher than plasma concentrations at all measured time points. The brain-to-plasma ratios showed an increase to a maximum value followed by a decrease. This pattern of the brain-to-plasma ratios has been observed earlier for elacridar, and could arise due to an active efflux of elacridar from the brain 12. The Kp observed post intravenous dose was much higher than intraperitoneal and oral administration of the microemulsion.
To determine whether elacridar microemulsion could improve the brain distribution of substrate drugs, we chose erlotinib, a dual P-gp and BCRP substrate, as a model compound. The co-administration of elacridar microemulsion (at 5 mg/kg intraperitoneal dose) successfully improved the brain penetration of erlotinib. Erlotinib is an EGFR inhibitor and a dual substrate for P-gp and BCRP and its brain distribution is known to be limited by the presence of these two transporters23,25,34. Erlotinib alone and in combination with temozolomide, has been examined for use in treatment of glioblastoma in several clinical trials 35–38. However, the results have been disappointing, and the lack of brain penetration of erlotinib has been cited as a possible cause36. Use of the elacridar microemulsion as an adjuvant to erlotinib therapy may help overcome poor water-solubility and the effect of transporters at the BBB, improve distribution to the brain, and thus may result in enhanced efficacy of chemotherapeutics through delivery enhancement both at the BBB and the tumor cell in the brain parenchyma. This hypothesis can only be tested if a practical formulation of elacridar is available for chronic use, either in preclinical models or eventually in the patient.
There are several advantages to developing a microemulsion formulation of elacridar. The novel formulation helps overcome the poor physicochemical properties of elacridar, such as poor solubility and high lipophilicity. The improvement in bioavailability allows a decrease in the dose required to achieve inhibition of efflux at the BBB. The microemulsion can also be administered easily, either orally or intraperitoneally, both modes of administration are typically suitable for chronic dosing in preclinical models of glioblastoma. The studies described herein indicate that a microemulsion formulation of elacridar can be developed for use as an adjuvant to therapy in the treatment of glioblastoma, particularly in preclinical models to improve delivery of molecularly-targeted agents that are subject to active efflux at the BBB by P-gp and BCRP and need to be administered on a chronic basis.
Acknowledgments
This work was supported by National Institutes of Health - National Cancer Institute [CA138437] (W.F.E.) and an AHC Faculty Development grant at the University of Minnesota (W.F.E.). Financial support for RS was provided by the Ronald J. Sawchuk Fellowship and Rowell Fellowship.
List of abbreviations
- BBB
blood-brain-barrier
- CNS
central nervous system
- P-gp
p-glycoprotein
- BCRP
breast cancer resistance protein
- FVB
Friend Leukemia Virus Strain B
- LC-MS/MS
liquid chromatography-tandem mass spectrometry
- AUC
area under the curve
- IV
intravenous
- IP
intraperitoneal
- PO
per os
Footnotes
Authorship Contributions
Participated in research design: Sane, Elmquist
Conducted experiments: Sane, Mittapalli
Contributed new reagents or analytic tools: Sane, Mittapalli, Elmquist
Performed data analysis: Sane, Elmquist
Wrote or contributed to the writing of the manuscript: Sane, Mittapalli, Elmquist
References
- 1.Hyafil F, Vergely C, Du Vignaud P, Grand-Perret T. In vitro and in vivo reversal of multidrug resistance by GF120918, an acridonecarboxamide derivative. Cancer Res. 1993;53(19):4595–4602. [PubMed] [Google Scholar]
- 2.Witherspoon SM, Emerson DL, Kerr BM, Lloyd TL, Dalton WS, Wissel PS. Flow cytometric assay of modulation of P-glycoprotein function in whole blood by the multidrug resistance inhibitor GG918. Clin Cancer Res. 1996;2(1):7–12. [PubMed] [Google Scholar]
- 3.Allen JD, Brinkhuis RF, Wijnholds J, Schinkel AH. The mouse Bcrp1/Mxr/Abcp gene: amplification and overexpression in cell lines selected for resistance to topotecan, mitoxantrone, or doxorubicin. Cancer Res. 1999;59(17):4237–4241. [PubMed] [Google Scholar]
- 4.Kruijtzer CM, Beijnen JH, Rosing H, ten Bokkel Huinink WW, Schot M, Jewell RC, Paul EM, Schellens JH. Increased oral bioavailability of topotecan in combination with the breast cancer resistance protein and P-glycoprotein inhibitor GF120918. J Clin Oncol. 2002;20(13):2943–2950. doi: 10.1200/JCO.2002.12.116. [DOI] [PubMed] [Google Scholar]
- 5.Kuppens IE, Witteveen EO, Jewell RC, Radema SA, Paul EM, Mangum SG, Beijnen JH, Voest EE, Schellens JH. A phase I, randomized, open-label, parallel-cohort, dose-finding study of elacridar (GF120918) and oral topotecan in cancer patients. Clin Cancer Res. 2007;13(11):3276–3285. doi: 10.1158/1078-0432.CCR-06-2414. [DOI] [PubMed] [Google Scholar]
- 6.Bardelmeijer HA, Ouwehand M, Beijnen JH, Schellens JH, van Tellingen O. Efficacy of novel P-glycoprotein inhibitors to increase the oral uptake of paclitaxel in mice. Invest New Drugs. 2004;22(3):219–229. doi: 10.1023/B:DRUG.0000026248.45084.21. [DOI] [PubMed] [Google Scholar]
- 7.Edwards JE, Brouwer KR, McNamara PJ. GF120918, a P-glycoprotein modulator, increases the concentration of unbound amprenavir in the central nervous system in rats. Antimicrob Agents Chemother. 2002;46(7):2284–2286. doi: 10.1128/AAC.46.7.2284-2286.2002. [DOI] [PMC free article] [PubMed] [Google Scholar]
- 8.Letrent SP, Pollack GM, Brouwer KR, Brouwer KL. Effect of GF120918, a potent P-glycoprotein inhibitor, on morphine pharmacokinetics and pharmacodynamics in the rat. Pharm Res. 1998;15(4):599–605. doi: 10.1023/a:1011938112599. [DOI] [PubMed] [Google Scholar]
- 9.Breedveld P, Pluim D, Cipriani G, Wielinga P, van Tellingen O, Schinkel AH, Schellens JH. The effect of Bcrp1 (Abcg2) on the in vivo pharmacokinetics and brain penetration of imatinib mesylate (Gleevec): implications for the use of breast cancer resistance protein and P-glycoprotein inhibitors to enable the brain penetration of imatinib in patients. Cancer Res. 2005;65(7):2577–2582. doi: 10.1158/0008-5472.CAN-04-2416. [DOI] [PubMed] [Google Scholar]
- 10.Chen Y, Agarwal S, Shaik NM, Chen C, Yang Z, Elmquist WF. P-glycoprotein and breast cancer resistance protein influence brain distribution of dasatinib. J Pharmacol Exp Ther. 2009;330(3):956–963. doi: 10.1124/jpet.109.154781. [DOI] [PubMed] [Google Scholar]
- 11.Agarwal S, Sane R, Gallardo JL, Ohlfest JR, Elmquist WF. Distribution of gefitinib to the brain is limited by P-glycoprotein (ABCB1) and breast cancer resistance protein (ABCG2)-mediated active efflux. J Pharmacol Exp Ther. 2010;334(1):147–155. doi: 10.1124/jpet.110.167601. [DOI] [PMC free article] [PubMed] [Google Scholar]
- 12.Sane R, Agarwal S, Elmquist WF. Brain Distribution and Bioavailability of Elacridar After Different Routes of Administration in the Mouse. Drug Metab Dispos. 2012 doi: 10.1124/dmd.112.045930. [DOI] [PMC free article] [PubMed] [Google Scholar]
- 13.Ward KW, Azzarano LM. Preclinical pharmacokinetic properties of the P-glycoprotein inhibitor GF120918A (HCl salt of GF120918, 9,10-dihydro-5-methoxy-9-oxo-N-[4-[2-(1,2,3,4-tetrahydro-6,7-dimethoxy-2-i soquinolinyl)ethyl]phenyl]-4-acridine-carboxamide) in the mouse, rat, dog, and monkey. J Pharmacol Exp Ther. 2004;310(2):703–709. doi: 10.1124/jpet.104.068288. [DOI] [PubMed] [Google Scholar]
- 14.Tang SC, Lagas JS, Lankheet NA, Poller B, Hillebrand MJ, Rosing H, Beijnen JH, Schinkel AH. Brain accumulation of sunitinib is restricted by P-glycoprotein (ABCB1) and breast cancer resistance protein (ABCG2) and can be enhanced by oral elacridar and sunitinib coadministration. Int J Cancer. 2012;130(1):223–233. doi: 10.1002/ijc.26000. [DOI] [PubMed] [Google Scholar]
- 15.Talegaonkar S, Azeem A, Ahmad FJ, Khar RK, Pathan SA, Khan ZI. Microemulsions: a novel approach to enhanced drug delivery. Recent Pat Drug Deliv Formul. 2008;2(3):238–257. doi: 10.2174/187221108786241679. [DOI] [PubMed] [Google Scholar]
- 16.Narang AS, Delmarre D, Gao D. Stable drug encapsulation in micelles and microemulsions. Int J Pharm. 2007;345(1–2):9–25. doi: 10.1016/j.ijpharm.2007.08.057. [DOI] [PubMed] [Google Scholar]
- 17.Bagwe RP, Kanicky JR, Palla BJ, Patanjali PK, Shah DO. Improved drug delivery using microemulsions: rationale, recent progress, and new horizons. Crit Rev Ther Drug Carrier Syst. 2001;18(1):77–140. [PubMed] [Google Scholar]
- 18.Lawrence MJ, Rees GD. Microemulsion-based media as novel drug delivery systems. Adv Drug Deliv Rev. 2000;45(1):89–121. doi: 10.1016/s0169-409x(00)00103-4. [DOI] [PubMed] [Google Scholar]
- 19.Regev R, Katzir H, Yeheskely-Hayon D, Eytan GD. Modulation of P-glycoprotein-mediated multidrug resistance by acceleration of passive drug permeation across the plasma membrane. FEBS J. 2007;274(23):6204–6214. doi: 10.1111/j.1742-4658.2007.06140.x. [DOI] [PubMed] [Google Scholar]
- 20.Gao Zhong-Gao H-GC, Shin Hee-Jong, Park Kyung-Mi, Lim Soo-Jeong, Hwang Ki-Jun, Kim Chong-Kook. Physicochemical characterization and evaluation of a microemulsion system for oral delivery of cyclosporin A. International Journal of Pharmaceutics. 1998;161(1):75–86. [Google Scholar]
- 21.Kemper EM, van Zandbergen AE, Cleypool C, Mos HA, Boogerd W, Beijnen JH, van Tellingen O. Increased penetration of paclitaxel into the brain by inhibition of P-Glycoprotein. Clin Cancer Res. 2003;9(7):2849–2855. [PubMed] [Google Scholar]
- 22.Shaik N, Giri N, Elmquist WF. Investigation of the micellar effect of pluronic P85 on P-glycoprotein inhibition: cell accumulation and equilibrium dialysis studies. J Pharm Sci. 2009;98(11):4170–4190. doi: 10.1002/jps.21723. [DOI] [PMC free article] [PubMed] [Google Scholar]
- 23.de Vries NA, Buckle T, Zhao J, Beijnen JH, Schellens JH, van Tellingen O. Restricted brain penetration of the tyrosine kinase inhibitor erlotinib due to the drug transporters P-gp and BCRP. Invest New Drugs. 2012;30(2):443–449. doi: 10.1007/s10637-010-9569-1. [DOI] [PubMed] [Google Scholar]
- 24.Elmeliegy MA, Carcaboso AM, Tagen M, Bai F, Stewart CF. Role of ATP-binding cassette and solute carrier transporters in erlotinib CNS penetration and intracellular accumulation. Clin Cancer Res. 2011;17(1):89–99. doi: 10.1158/1078-0432.CCR-10-1934. [DOI] [PMC free article] [PubMed] [Google Scholar]
- 25.Marchetti S, de Vries NA, Buckle T, Bolijn MJ, van Eijndhoven MA, Beijnen JH, Mazzanti R, van Tellingen O, Schellens JH. Effect of the ATP-binding cassette drug transporters ABCB1, ABCG2, and ABCC2 on erlotinib hydrochloride (Tarceva) disposition in in vitro and in vivo pharmacokinetic studies employing Bcrp1-/-/Mdr1a/1b-/- (triple-knockout) and wild-type mice. Mol Cancer Ther. 2008;7(8):2280–2287. doi: 10.1158/1535-7163.MCT-07-2250. [DOI] [PubMed] [Google Scholar]
- 26.Araya H, Nagao S, Tomita M, Hayashi M. The novel formulation design of self-emulsifying drug delivery systems (SEDDS) type O/W microemulsion I: enhancing effects on oral bioavailability of poorly water soluble compounds in rats and beagle dogs. Drug Metab Pharmacokinet. 2005;20(4):244–256. doi: 10.2133/dmpk.20.244. [DOI] [PubMed] [Google Scholar]
- 27.Scott Swenson E, Curatolo WJ. (C) Means to enhance penetration: (2) Intestinal permeability enhancement for proteins, peptides and other polar drugs: mechanisms and potential toxicity. Advanced Drug Delivery Reviews. 1992;8(1):39–92. [Google Scholar]
- 28.Morey TE, Modell JH, Shekhawat D, Grand T, Shah DO, Gravenstein N, McGorray SP, Dennis DM. Preparation and anesthetic properties of propofol microemulsions in rats. Anesthesiology. 2006;104(6):1184–1190. doi: 10.1097/00000542-200606000-00013. [DOI] [PMC free article] [PubMed] [Google Scholar]
- 29.Wang Y, Wu KC, Zhao BX, Zhao X, Wang X, Chen S, Nie SF, Pan WS, Zhang X, Zhang Q. A novel paclitaxel microemulsion containing a reduced amount of Cremophor EL: pharmacokinetics, biodistribution, and in vivo antitumor efficacy and safety. J Biomed Biotechnol. 2011;2011:854872. doi: 10.1155/2011/854872. [DOI] [PMC free article] [PubMed] [Google Scholar]
- 30.Agarwal S, Sane R, Oberoi R, Ohlfest JR, Elmquist WF. Delivery of molecularly targeted therapy to malignant glioma, a disease of the whole brain. Expert Rev Mol Med. 2011;13:e17. doi: 10.1017/S1462399411001888. [DOI] [PMC free article] [PubMed] [Google Scholar]
- 31.Sparreboom A, van Zuylen L, Brouwer E, Loos WJ, de Bruijn P, Gelderblom H, Pillay M, Nooter K, Stoter G, Verweij J. Cremophor EL-mediated alteration of paclitaxel distribution in human blood: clinical pharmacokinetic implications. Cancer Res. 1999;59(7):1454–1457. [PubMed] [Google Scholar]
- 32.Cuine JF, Charman WN, Pouton CW, Edwards GA, Porter CJ. Increasing the proportional content of surfactant (Cremophor EL) relative to lipid in self-emulsifying lipid-based formulations of danazol reduces oral bioavailability in beagle dogs. Pharm Res. 2007;24(4):748–757. doi: 10.1007/s11095-006-9194-z. [DOI] [PubMed] [Google Scholar]
- 33.Ovando-Medina VM, Mendizábal E, Peralta RD. Kinetics modeling of microemulsion copolymerization. Polymer Bulletin. 2005;54(1):129–140. [Google Scholar]
- 34.Agarwal S, Manchanda P, Vogelbaum MA, Ohlfest JR, Elmquist WF. Function of the blood-brain barrier and restriction of drug delivery to invasive glioma cells: findings in an orthotopic rat xenograft model of glioma. Drug Metab Dispos. 2012;41(1):33–39. doi: 10.1124/dmd.112.048322. [DOI] [PMC free article] [PubMed] [Google Scholar]
- 35.Kesavabhotla K, Schlaff CD, Shin B, Mubita L, Kaplan R, Tsiouris AJ, Pannullo SC, Christos P, Lavi E, Scheff R, Boockvar JA. Phase I/II study of oral erlotinib for treatment of relapsed/refractory glioblastoma multiforme and anaplastic astrocytoma. J Exp Ther Oncol. 2012;10(1):71–81. [PubMed] [Google Scholar]
- 36.Prados MD, Lamborn KR, Chang S, Burton E, Butowski N, Malec M, Kapadia A, Rabbitt J, Page MS, Fedoroff A, Xie D, Kelley SK. Phase 1 study of erlotinib HCl alone and combined with temozolomide in patients with stable or recurrent malignant glioma. Neuro Oncol. 2006;8(1):67–78. doi: 10.1215/S1522851705000451. [DOI] [PMC free article] [PubMed] [Google Scholar]
- 37.Raizer JJ, Abrey LE, Lassman AB, Chang SM, Lamborn KR, Kuhn JG, Yung WK, Gilbert MR, Aldape KA, Wen PY, Fine HA, Mehta M, Deangelis LM, Lieberman F, Cloughesy TF, Robins HI, Dancey J, Prados MD. A phase II trial of erlotinib in patients with recurrent malignant gliomas and nonprogressive glioblastoma multiforme postradiation therapy. Neuro Oncol. 2010;12(1):95–103. doi: 10.1093/neuonc/nop015. [DOI] [PMC free article] [PubMed] [Google Scholar]
- 38.Reardon DA, Desjardins A, Vredenburgh JJ, Gururangan S, Friedman AH, Herndon JE, 2nd, Marcello J, Norfleet JA, McLendon RE, Sampson JH, Friedman HS. Phase 2 trial of erlotinib plus sirolimus in adults with recurrent glioblastoma. J Neurooncol. 2010;96(2):219–230. doi: 10.1007/s11060-009-9950-0. [DOI] [PMC free article] [PubMed] [Google Scholar]