

Abstract
♦ Background and Objectives: There is a paucity of large longitudinal studies on the time course of peritoneal fluid transport. The aim of the present study was to longitudinally analyze changes in fluid transport and relevant solute transport parameters in patients treated with a conventional peritoneal dialysis (PD) fluid and, to mimic clinical reality, not selected for the presence or absence of ultrafiltration (UF) failure.
♦ Methods: This prospective single-center cohort study followed 138 consecutive incident PD patients from July 1994 until censoring in August 2004. The design was longitudinal, with repeated measures over time in each patient. Patients had undergone at least 1 and a maximum of 5 annual standard peritoneal permeability analyses (SPAs) using 3.86% glucose dialysate. A linear mixed model was used to analyze the longitudinal data.
♦ Results: No differences in patient characteristics were present at baseline in relation to the number of available SPAs. There were also no differences in patient withdrawal during the years of follow-up. A gradual decline in fluid transport, expressed as free water transport (FWT), small-pore fluid transport (SPFT), and transcapillary UF (TCUF), was observed with duration of PD. The decline was mainly attributable to patients who developed UF failure. The time courses for the determinants of fluid transport, such as the reflection coefficient (σ) and the UF coefficient (LpA), were not different. However, they were associated with an increase in the mass transfer area coefficient of creatinine, reflecting the peritoneal vascular surface area.
♦ Conclusions: Fluid profiles for FWT and SPFT during a dwell can be explained by current knowledge of the three-pore model. Fluid transport declines with the duration of PD because of an increase in the vascular surface area, leading to a rapid dissipation of glucose as the osmotic agent. The absence of a trend in the time course of osmotic conductance and its constituents—that is, LpA and σ—suggests that, in an unselected population, these parameters are affected only late in the time course of PD.
Keywords: Peritoneal fluid transport, free water transport: small-pore fluid transport, prospective longitudinal study, standard peritoneal permeability analysis, linear mixed model
The peritoneal capillary wall and its surrounding tissues serve as a biologic membrane for fluid and solute transport during peritoneal dialysis (PD) and are therefore the major determinants of peritoneal permeability to fluid and solutes (1). The peritoneum is a heterogenous membrane consisting of various structures: mesothelium, interstitial tissue, and endothelial cells of the microvascular wall. According to the three-pore theory, the endothelium is the most important structure for transport (2). In that theory, small interendothelial pores are assumed to be especially involved in small-solute transport by diffusion and transport of fluid together with dissolved solutes (“convection”). The number of large pores is so small that their contribution to fluid transport can be ignored, but those pores allow macromolecules to pass. Intra-endothelial aquaporins are so small that they allow only the passage of fluid: that is, solute-free water transport (FWT) (3,4), whose anatomic equivalent is aquaporin-1 (4). Together, FWT and small-pore fluid transport (SPFT) result in total transcapillary ultrafiltration (TCUF). A possible contribution of the peritoneal endothelial glycocalyx to these pathways is speculative (5).
The efficacy of glucose as an osmotic agent is determined by the osmotic reflection coefficient, σ. The resistance of the peritoneal membrane to glucose transport from the peritoneal cavity to the circulation determines the potency of glucose to maintain a crystalloid osmotic pressure gradient. When the σ of a solute to a membrane equals 1.0, the membrane can be considered semipermeable. Being a small molecule, glucose can pass the small pores rather easily. Therefore σ depends on the function of aquaporin-1.
The coefficient for ultrafiltration (UF) is also important. This coefficient, LpA, is the product of the hydraulic permeability to water (Lp) and the vascular surface area available for transport (A). Together, LpA and σ constitute the glucose-induced osmotic conductance (GOC).
Acquired loss of UF, as can develop in long-term PD, is an important reason to discontinue PD treatment (6). This loss can result both from non-membrane-related causes, such as subcutaneous leaks and catheter dislocation, and membrane-related causes. The long-term use of conventional PD solutions containing large amounts of glucose and glucose degradation products can induce peritoneal membrane abnormalities (7). Alterations of the peritoneal vessels—diabetiform neovascularization and vasculopathy (7,8)—can develop, in combination with submesothelial and overall fibrosis. It is therefore expected that alterations in fluid and solute transport might occur with duration of PD.
An increase in the number of perfused peritoneal microvessels is an important cause of UF failure and can lead to an augmentation of the peritoneal vascular surface area (8). That increase is associated with high transfer rates of small solutes such as glucose, resulting in a fast dissipation of the osmotic gradient. This phenomenon occurs during acute peritonitis and has until recently been considered the most important pathogenetic mechanism in long-term PD (9). However, the relationship between UF and small-solute transport changes with the duration of PD (10). That finding suggests that, in addition to an anatomic increase in peritoneal vessels, impaired GOC is important in UF failure during long-term PD. Indeed, our group found precisely that condition in long-term patients with UF failure (11). In those patients, a low GOC was more prominent than the presence of a large vascular surface area. Low GOC might be a result of a decreased σ for glucose, but decreased hydraulic permeability cannot be excluded. At present, the exact pathogenetic mechanism is unclear.
There is a paucity of large longitudinal studies on the time course of peritoneal fluid transport (10). The aim of the present study was therefore to longitudinally analyze changes in fluid transport and its determinants in patients treated with a conventional PD solution, who were not selected for the presence or absence of UF failure.
Methods
Design
This prospective single-center cohort study enrolled consecutive end-stage renal disease patients commencing renal replacement therapy with PD from July 1994 until August 2004, when conventional dialysis solutions were replaced by biocompatible ones. The patients were monitored from the start of PD until kidney transplantation, transfer to hemodialysis, or death. Data collection included baseline demographics, baseline comorbidity, primary kidney disease, and peritoneal function by means of standard peritoneal permeability analyses (SPAs). A SPA was performed in the first year of PD treatment and was repeated once annually thereafter. Primary kidney disease was classified according to the codes of the European Dialysis and Transplant Association-European Renal Association registry. Comorbidity was scored on the basis of the Davies comorbidity index (12), with the patients being classified as having no, intermediate, or severe comorbidity. The reason for PD discontinuation was also noted and classified according to Davies (12). Ultrafiltration failure was defined according to the International Society for Peritoneal Dialysis guidelines: that is, less than 400 mL net UF during a standardized 4-hour dwell using 3.86% or 4.25% glucose (13).
Patients
In the present analysis, only incident patients who started PD treatment with conventional PD fluids (Dianeal: Baxter Healthcare BV, Utrecht, Netherlands) for at least 3 months were included. To our knowledge, large studies of peritoneal transport analyses have been performed only in patients treated with Dianeal. After 2004, Dianeal was no longer prescribed in our department for patients commencing PD. During follow-up, patients intentionally treated with Dianeal could switch to biocompatible PD solutions. The use of 1 amino-acid-based solution and 1 icodextrin exchange in addition to Dianeal was allowed.
Patients were at least 18 years old and could be of any ethnic origin. Patients using automated PD and continuous ambulatory PD were included. Recent studies show no survival benefit for either of those PD modalities (14,15). Furthermore, we showed that PD modality does not influence the time course of peritoneal transport (16). Patients who had previously received a renal graft were excluded, because transplantation may influence peritoneal function (17,18).
The start of PD was chosen as the baseline for patient characteristics. The first SPA was chosen as the baseline for transport characteristics. Follow-up continued until the 5th available SPA or the 5th year on PD. Only patients with a baseline SPA in the first year were included.
Procedure
The SPAs were performed using 4-hour dwells as previously described (9). Briefly, after a rinsing procedure, fresh 3.86% glucose-based dialysis solution (Dianeal) was instilled for the test dwell. Dialysate samples were taken at 0, 10, 20, 30, 60, 120, 180, and 240 minutes. Blood samples were taken at the beginning and end of the test. To calculate peritoneal fluid kinetics, 1 g/L dextran 70 (Hyskon: Medisan Pharmaceuticals, Uppsala, Sweden) was added to the dialysate. Dextran 1 (Promiten: NPBI International, Emmercompascuum, Netherlands) was given intravenously before instillation of the test solution to prevent potential anaphylactic reactions to dextran 70.
Measurements
All measurements were taken as previously described (19,20). High-performance liquid chromatography was used to determine the total dextran concentration in effluent. Ion selective electrodes were used to measure Na+. Creatinine, urea, and urate in plasma and effluent were measured by enzymatic methods (Hitachi analyzer: Boehringer Mannheim, Mannheim, Germany).
Calculations of Solute and Fluid Transport
Solute and fluid transport parameters were calculated as previously described (19,20). Small-solute transport was calculated as mass transfer area coefficients (MTACs). The MTACs were calculated according to the model of Waniewski et al. (21). Solute concentrations in serum were corrected for plasma water (22).
Calculation of FWT
Dissolved solutes are transported together with water, the so-called solvent drag effect (convective transport). Because, in vivo, Na+ has an Einstein-Stokes radius not exceeding 3 Å, its transport across the small pores should be unhindered, implying that SPFT is always associated with convective transport of Na+. According to the current understanding of the pore theory of transcapillary transport during PD, the dissociation in the transport of water induced by crystalloid osmotic pressure and in the transport of Na+ can only be caused by transcellular FWT. Therefore, FWT was calculated by subtracting TCUF-coupled Na+ transport (SPFT) from TCUF, as previously described (9,23). The contributions of FWT and SPFT were examined after 60 minutes and expressed both as absolute values and as a percentage of TCUF. Typically, the dialysate Na+ concentration before instillation is lower than the plasma Na+ concentration, resulting in some diffusion of Na+ from the extracellular volume. For that reason, a diffusion correction for Na+ sieving was performed using the MTAC of urate (24).
Calculations of GOC
The osmotic pressure gradient across the peritoneal membrane at 4 hours was calculated as the difference between the crystalloid osmotic pressure gradient and an estimation of the plasma colloid osmotic pressure. The former was calculated from the glucose and urea concentrations in plasma and dialysate. The plasma colloid osmotic pressure was assessed as previously described (11,25).
The UF induced by glucose probably comprises both convective transport through small interendothelial pores and transport through transcellular (water-only) pathways. The contribution of the large pores to osmosis-induced UF can be neglected because of the very small number and large size of those pores. The colloid osmotic pressure will be exerted almost exclusively across the small interendothelial pores because the ultrasmall pore system is especially involved when an osmolality gradient is present.
During a SPA, the hydrostatic pressure gradient (ΔP) was assumed to have a constant value of 9 mmHg because, at rest, capillary pressure is about 17 mmHg and intraperitoneal pressure is about 8 mmHg. The reflection coefficient σ can range from 1.0 (ideal semipermeable membrane) to 0 (no osmotic effect). According the Van ’t Hoff law, every milliosmole per liter exerts an osmotic pressure of 19.3 mmHg in an ideal semipermeable membrane, implying that the osmotic pressure generated by an osmotic agent is given by
 |
The σ of albumin is generally considered to approach 1.0.
The TCUF rate is determined by the product of the UF coefficient (LpA) and the pressure gradient. For the situation in PD, this equation applies:
 |
in which TCUFR0-1 min is the maximum TCUF rate (present during the first minute of the dwell), Lp is the hydraulic permeability of the peritoneum, A is the surface area, ΔP is the hydrostatic pressure gradient, ΔΠ is the colloid osmotic pressure gradient, and σ is the reflection coefficient. In every patient, the TCUFR0-1 min was calculated using a Lineweaver-Burk plot—that is, the linear regression between the reciprocal values of the TCUF obtained during the SPA and of time (26). For ΔP, a constant value of 9 mmHg was assumed (25). The colloid osmotic pressure gradient, ΔΠ, was calculated using the formula
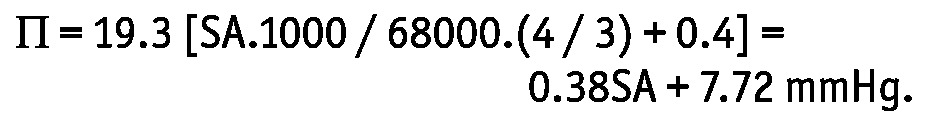 |
In this equation, SA represents serum albumin (in grams per liter), 68000 is the molecular weight of albumin, and the factor 1000 converts osmoles to milliosmoles. Of the total capillary colloid osmotic pressure, 75% was considered to be determined by the serum albumin concentration. The value 0.4 was added because of Gibbs-Donnan equilibrium (25). The crystalloid osmotic pressure gradient σΔO was calculated from the glucose and urea concentrations in plasma and dialysate. For each patient, the σ for glucose was calculated using the equation
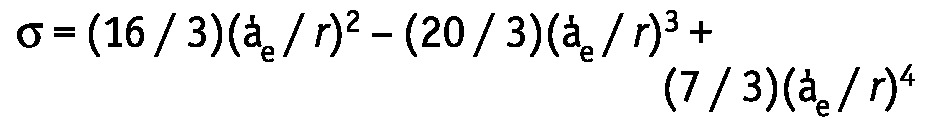 |
where a’e is the solute radius, and r is the pore radius. The solute radius of glucose was previously determined as 3.12 Å. The computer simulations described by Rippe et al. (2) were used to assess the pore radii. In our model, the pore sizes were varied to obtain the best fit between the estimated and measured solute MTACs. In contrast with our earlier studies, modeling of σ was not performed manually, but by a locally adjusted mathematical computer model, based on the equation used by Rippe et al. (2). The σ for glucose was separately calculated for each pore type. The overall σ then consists of the sum of the reflection coefficients for each pore set, weighted by their respective fractional UF coefficients, a’. The values reported by Rippe et al. were used for a’: 0.015 for the ultrasmall pores, 0.929 for the small pores, and 0.056 for the large pores. The individually determined values (TCUFR in the first minute of the dwell and the pressure gradient) permitted the calculation of LpA in every patient. The GOC was calculated as the product of LpA and σ.
Statistics
Means and standard deviations were calculated for continuous variables at baseline. Categorical variables are expressed as proportions. A Student t-test or chi-square test was used to analyze potential differences in patient demographics, primary kidney diseases, and comorbidity. A linear mixed model was used to analyze the time course of the fluid transport parameters and MTAC creatinine values repeatedly measured in each patient. A Student t-test or Wilcoxon rank sum test was used to compare the baseline differences and baseline peritoneal function differences for continuous measurements. For discrete variables, the Pearson chi-square test was used.
Results
Patients
Figure 1 shows a flowchart of patient selection for the study. Table 1 shows patient characteristics according to the number of available SPAs and for the entire cohort at the PD initiation. We observed no differences at baseline with respect to sex distribution, primary kidney disease, Davies comorbidity score, presence of diabetes or left ventricular failure, and use of angiotensin converting-enzyme inhibitors or angiotensin II receptor blockers at the start of PD. The presence of ischemic heart disease and left ventricular failure was higher when more SPAs were available.
Figure 1 —

Flowchart of patient selection. PD = peritoneal dialysis; SPA = standard peritoneal permeability analysis.
TABLE 1.
Baseline Patient Characteristics by Number of Available Standard Peritoneal Permeability Analyses (SPAs)

Figure 2 shows reasons for patient withdrawal from PD. We observed no differences in patient withdrawal during the years of follow-up.
Figure 2 —

The reasons for withdrawal from peritoneal dialysis. HD = hemodialysis; UFF = ultrafiltration failure.
Fluid Transport
Figure 3 shows the time courses for TCUF, SPFT, and FWT. A gradual decline occurred with duration of PD (p < 0.05) that was most pronounced after 4 years of follow-up. The decline was mainly attributable to the patients with UF failure (Figure 4), which increased with duration of PD. No significant trend in the time course was present for the relative contribution of both pathways (SPFT and FWT) to fluid transport (data not shown).
Figure 3 —
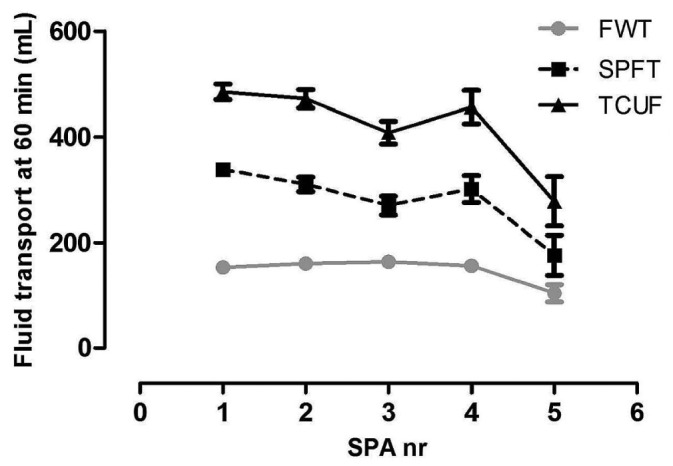
The time course of transcapillary ultrafiltration (TCUF), small-pore fluid transport (SPFT), and free water transport (FWT). A gradual decline occurred in all parameters (p < 0.05), being most prominent after 4 years of follow-up. SPA = standard peritoneal permeability analysis.
Figure 4 —

The number of patients with ultrafiltration (UF) failure according to the number of standard peritoneal permeability analyses (SPAs).
Determinants of Fluid Transport
Figure 5 shows FWT, SPFT, and both of their determinants—that is, σ and LpA—during follow-up, according to the number of available SPAs. For each parameter, the time course did not change significantly with the number of available SPAs.
Figure 5 —

Time course of free water transport (FWT), small-pore fluid transport (SPFT), reflection coefficient (sigma), and LpA (hydraulic permeability of peritoneal membrane multiplied by surface area) according to the number of standard peritoneal permeability analyses (SPAs). The number of SPAs did not influence these parameters.
Figure 6 shows the time courses of the determinants of fluid transport. Only the time course of the MTAC creatinine changed significantly during follow-up (p < 0.01); σ, LpA, and their product, the osmotic conductance, remained unchanged. Because LpA consists of the hydraulic permeability of the membrane (Lp) and its surface area (A), LpA was divided by the MTAC creatinine, which can be considered to represent the vascular surface area of the peritoneum. This approach to Lp is also shown in Figure 6. Although visual inspection suggests a slight decrease, the change was not statistically significant, probably because of the wide spread.
Figure 6 —

Time course of the determinants of fluid transport. Only the mass transfer-area coefficient (MTAC) of creatinine showed a significant increase with the duration of peritoneal dialysis (p < 0.01). LpA = hydraulic permeability of peritoneal membrane multiplied by surface area; SPA = standard peritoneal permeability analysis; sigma = reflection coefficient.
Discussion
In the present observational cohort study, we analyzed changes in fluid transport and their determinants in patients treated with a conventional PD fluid and not selected for the presence or absence of UF failure. Our cohort of 138 incident PD patients had not previously received renal replacement therapy and had undergone at least a baseline SPA (4-hour 3.86% glucose dwell) to mimic the clinical reality of incident PD patients.
First, patient characteristics were analyzed to judge the extent to which the time courses of fluid transport and its determinants could be attributed PD treatment and its duration. From a previous unpublished study in the same cohort of patients, we learned that baseline peritoneal small-solute transport can be associated with the level of comorbidity, which might influence outcome (12). Patient characteristics at baseline were therefore also analyzed according to the number of available SPAs. No differences were evident, other than the occurrence of more left ventricular failure and ischemic heart disease in the patients with the most available SPAs. That finding might point to some selection bias at the start and during dialysis: patients with a contraindication for hemodialysis, mainly of a cardiologic nature, typically start with PD (27). However, reasons for withdrawal from PD did not vary during the years on PD and resembled those recorded in another study (28). As judged from those findings, patients with different numbers of available SPAs were quite similar at baseline, justifying our approach of analyzing the time course in this group.
Fluid transport during PD occurs by TCUF, determined by hydrostatic and osmotic forces. It consists of SPFT and FWT, and thus without dissolved solutes, the latter occurring by the endothelial water channel aquaporin-1 (4). With glucose-based dialysis solutions, the effectiveness of crystalloid osmosis depends on the number of available perfused microvessels and the osmotic conductance of the peritoneal membrane to glucose. In clinical practice, the MTAC creatinine or the dialysate-to-plasma ratio of creatinine can be used as a representation of the vascular surface area. In general, a high value leads to a rapid decline in the crystalloid osmotic pressure gradient and, consequently, reduced TCUF, despite the larger number of pores available. It is now evident that osmotic conductance can be described as the mathematical product of the σ of the membrane (determined mainly by aquaporin-1 number or function, or both) and the product of the hydraulic permeability of the membrane (Lp) and its surface area (A).
We followed the time course of all three major parameters (MTAC creatinine, σ, and LpA) prospectively in an unselected cohort of incident PD patients, calculating those parameters in every individual patient. Kinetic modeling was used only for the estimation of σ; all other parameters were calculated directly from measured values. Modeling of the estimated values for σ used a locally adjusted mathematical computer model instead of manual calculation, making the estimations more accurate.
Using mixed linear modeling, we found, as expected, only a statistically significant increase in the MTAC creatinine and a decrease in TCUF. The latter consisted of similar declines in SPFT and FWT, without a change in their relative contributions. The individual determinants of osmotic UF—σ and LpA—showed no change over time, which accorded with the findings in previous studies by our group (6,11). The results of the present study suggest that, apart from neoangiogenesis, severe interstitial abnormalities influencing fluid transport are late complications of PD and require a follow-up of several years to be detectable.
Shortcomings of our study are that the results come from a relatively small cohort of patients with truly long-term follow-up. On the other hand, this longitudinal cohort is the first in whom peritoneal fluid transport has been described is such a detailed manner. Furthermore, because a single-center cohort was investigated, possible center bias is excluded.
Conclusions
In an unselected patient group, FWT and SPFT both decline with the duration of PD. This decline is largely attributable to an increase in the peritoneal vascular surface area, leading to rapid dissipation of glucose as the osmotic agent. In addition, the liquid permeability of the membrane may decrease to some extent. The absence of changes in the osmotic conductance and its constituents—that is, LpA and σ—suggests that, in an unselected population, those parameters are affected only late during the time course of PD.
Disclosures
AMC was funded by a research grant from the Dutch Kidney Foundation, and AP by a grant from Baxter Healthcare. The PD research program of RTK is supported by the Academic Medical Center, the Dutch Kidney Foundation, and Baxter Healthcare. No conflict of interest exists, because no funder was involved in the study set-up, its performance, or its presentation here.
Acknowledgments
We thank Joke Korevaar for statistical advice. We thank professor Bengt Rippe for interesting discussions preceding the writing of this manuscript and for the use of his three-pore model. Henk Pijls of the faculty of Mathematics, University of Amsterdam, is highly acknowledged for his efforts to make the three-pore model useful on a larger scale. This study was supported by a grant of The Dutch Kidney Foundation (C06.2186).
References
- 1. Krediet RT, Lindholm B, Rippe B. Pathophysiology of peritoneal membrane failure. Perit Dial Int 2000; 20(Suppl 4):S22–42 [PubMed] [Google Scholar]
- 2. Rippe B, Stelin G, Haraldsson B. Computer simulations of peritoneal fluid transport in CAPD. Kidney Int 1991; 40:315–25 [DOI] [PubMed] [Google Scholar]
- 3. Pannekeet MM, Mulder JB, Weening JJ, Struijk DG, Zweers MM, Krediet RT. Demonstration of aquaporin-CHIP in peritoneal tissue of uremic and CAPD patients. Perit Dial Int 1996; 19(Suppl 1):S54–57 [PubMed] [Google Scholar]
- 4. Ni J, Verbavatz JM, Rippe A, Boisdé I, Moulin P, Rippe B, et al. Aquaporin-1 plays an essential role in water permeability and ultrafiltration during peritoneal dialysis. Kidney Int 2006; 69:1518–25 [DOI] [PubMed] [Google Scholar]
- 5. Flessner M. Endothelial glycocalyx and the peritoneal barrier. Perit Dial Int 2008; 28:6–12 [PubMed] [Google Scholar]
- 6. Smit W, Schouten N, van den Berg N, Langedijk M, Struijk DG, Krediet RT. for the Netherlands Ultrafiltration Failure Study Group. Analysis of the prevalence and causes of ultrafiltration failure during long-term peritoneal dialysis: a cross sectional study. Perit Dial Int 2004; 24:562–70 [PubMed] [Google Scholar]
- 7. Williams JD, Craig KJ, Topley N, Von Ruhland C, Fallon M, Newman GR, et al. on behalf of the Peritoneal Biopsy Study Group. Morphological changes in the peritoneal membrane of patients with renal failure. J Am Soc Nephrol 2002; 13:470–9 [DOI] [PubMed] [Google Scholar]
- 8. Mateijsen MA, van der Wal AC, Hendriks PM, Zweers MM, Mulder J, Struijk DG, et al. Vascular and interstitial changes in the peritoneum of CAPD patients with peritoneal sclerosis. Perit Dial Int 1999; 19:517–25 [PubMed] [Google Scholar]
- 9. Smit W, van den Berg N, Schouten N, Aikens E, Struijk DG, Krediet RT. Free-water transport in fast transport status: a comparison between CAPD peritonitis and long-term PD. Kidney Int 2004; 65:298–303 [DOI] [PubMed] [Google Scholar]
- 10. Davies SJ. Longitudinal relationship between solute transport and ultrafiltration capacity in peritoneal dialysis patients. Kidney Int 2004; 66:2437–45 [DOI] [PubMed] [Google Scholar]
- 11. Parikova A, Smit W, Struijk DG, Krediet RT. Analysis of fluid transport pathways and their determinants in peritoneal dialysis patients with ultrafiltration failure. Kidney Int 2006; 70:1988–94 [DOI] [PubMed] [Google Scholar]
- 12. Davies SJ. Assessment of comorbidity in peritoneal dialysis patients. Contrib Nephrol 2003;:98–103 [DOI] [PubMed] [Google Scholar]
- 13. Mujais S, Nolph K, Gokal R, Blake P, Burkart J, Coles G, et al. International Society for Peritoneal Dialysis Ad Hoc Committee on Ultrafiltration Management in Peritoneal Dialysis. Perit Dial Int 2000; 20(Suppl 4):S3–4 [PubMed] [Google Scholar]
- 14. Michels WM, Verduijn M, Boeschoten EW, Dekker FW, Krediet RT. on behalf of the NECOSAD Study Group. Similar survival on automated peritoneal dialysis and continuous ambulatory peritoneal dialysis in a large prospective cohort. Clin J Am Soc Nephrol 2009; 4:943–9 [DOI] [PMC free article] [PubMed] [Google Scholar]
- 15. Cnossen TT, Usvyat L, Kotanko P, van der Sande FM, Kooman JP, Carter M, et al. Comparison of outcomes on continuous ambulatory peritoneal dialysis versus automated peritoneal dialysis: results from a USA database. Perit Dial Int 2011; 31:679–84 [DOI] [PubMed] [Google Scholar]
- 16. Michels WM, Verduijn M, Parikova A, Boeschoten EW, Struijk DG, Dekker FW, et al. Time course of peritoneal function in automated and continuous peritoneal dialysis. Perit Dial Int 2012; 32:605–11 [DOI] [PMC free article] [PubMed] [Google Scholar]
- 17. Korte MR, Yo M, Betjes MG, Fieren MW, van Saase JC, Boer WH, et al. Increasing incidence of severe encapsulating peritoneal sclerosis after kidney transplantation. Nephrol Dial Transplant 2007; 22:2412–14 [DOI] [PubMed] [Google Scholar]
- 18. Fieren MW, Betjes MG, Korte MR, Boer WH. Posttransplant encapsulating peritoneal sclerosis: a worrying new trend? Perit Dial Int 2007; 27:619–24 [PubMed] [Google Scholar]
- 19. Pannekeet MM, Imholz AL, Struijk DG, Koomen GC, Langedijk MJ, Schouten N, et al. The standard peritoneal permeability analysis: a tool for the assessment of peritoneal permeability characteristics in CAPD patients. Kidney Int 1995; 48:866–75 [DOI] [PubMed] [Google Scholar]
- 20. Smit W, van Dijk P, Langedijk MJ, Schouten N, van den Berg N, Struijk DG, et al. Peritoneal function and assessment of reference values using a 3.86% glucose solution. Perit Dial Int 2003; 23:440–9 [PubMed] [Google Scholar]
- 21. Waniewski J, Werynski A, Heimbürger O, Lindholm B. Simple models for description of small solute transport in peritoneal dialysis. Blood Purif 1991; 9:129–41 [DOI] [PubMed] [Google Scholar]
- 22. Waniewski J, Heimbürger A, Werynski A, Lindholm B. Aqueous solute concentrations and evaluation of mass transfer area coefficients in peritoneal dialysis. Nephrol Dial Transplant 1992; 7:50–6 [PubMed] [Google Scholar]
- 23. La Milia V, Di Filippo S, Crepaldi M, Del Vecchio L, Dell’Oro C, Andrulli S, et al. Mini-peritoneal equilibration test: a simple and fast method to assess free water and small solute transport across the peritoneal membrane. Kidney Int 2005; 68:840–6 [DOI] [PubMed] [Google Scholar]
- 24. Zweers MM, Imholz AL, Struijk DG, Krediet RT. Correction of sodium sieving for diffusion from the circulation. Adv Perit Dial 1999; 15:65–72 [PubMed] [Google Scholar]
- 25. Ho-dac-Pannekeet MM, Schouten N, Langendijk MJ, Hiralall JK, de Waart DR, Struijk DG, et al. Peritoneal transport characteristics with glucose polymer based dialysate. Kidney Int 1996; 50:979–86 [DOI] [PubMed] [Google Scholar]
- 26. Krediet RT, Struijk DG, Koomen GC, Arisz L. Peritoneal fluid kinetics during CAPD measured with intraperitoneal dextran 70. ASAIO Trans 1991; 37:662–7 [PubMed] [Google Scholar]
- 27. Jager KJ, Korevaar JC, Dekker FW, Krediet RT, Boeschoten EW. on behalf of the Netherlands Cooperative Study on the Adequacy of Dialysis (NECOSAD) Study Group. The effect of contraindications and patient preference on dialysis modality selection in ESRD patients in the Netherlands. Am J Kidney Dis 2004; 43:891–9 [DOI] [PubMed] [Google Scholar]
- 28. Kolesnyk I, Dekker FW, Boeschoten EW, Krediet RT. Time-dependent reasons for peritoneal dialysis technique failure and mortality. Perit Dial Int 2010; 30:170–7 [DOI] [PubMed] [Google Scholar]