

Abstract
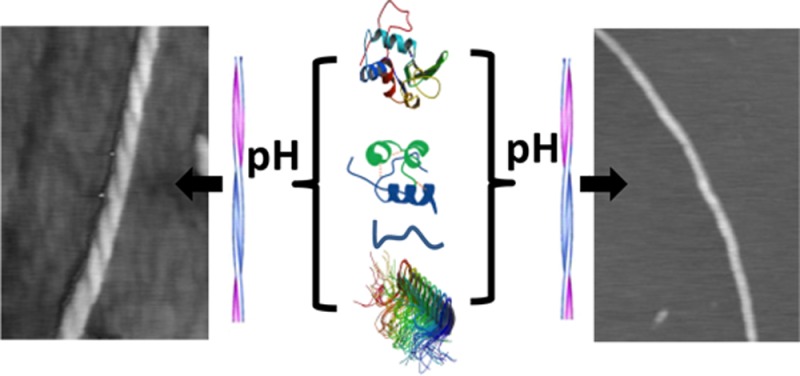
The unique enhanced sensitivity of vibrational circular dichroism (VCD) to the formation and development of amyloid fibrils in solution is extended to four additional fibril-forming proteins or peptides where it is shown that the sign of the fibril VCD pattern correlates with the sense of supramolecular filament chirality and, without exception, to the dominant fibril morphology as observed in AFM or SEM images. Previously for insulin, it has been demonstrated that the sign of the VCD band pattern from filament chirality can be controlled by adjusting the pH of the incubating solution, above pH 2 for “normal” left-hand-helical filaments and below pH 2 for “reversed” right-hand-helical filaments. From AFM or SEM images, left-helical filaments form multifilament braids of left-twisted fibrils while the right-helical filaments form parallel filament rows of fibrils with a flat tape-like morphology, the two major classes of fibril morphology that from deep UV resonance Raman scattering exhibit the same cross-β-core secondary structure. Here we investigate whether fibril supramolecular chirality is the underlying cause of the major morphology differences in all amyloid fibrils by showing that the morphology (twisted versus flat) of fibrils of lysozyme, apo-α-lactalbumin, HET-s (218–289) prion, and a short polypeptide fragment of transthyretin, TTR (105–115), directly correlates to their supramolecular chirality as revealed by VCD. The result is strong evidence that the chiral supramolecular organization of filaments is the principal underlying cause of the morphological heterogeneity of amyloid fibrils. Because fibril morphology is linked to cell toxicity, the chirality of amyloid aggregates should be explored in the widely used in vitro models of amyloid-associated diseases.
Introduction
Specific fibril aggregation of more than 20 proteins has been linked to a pathogenesis of many amyloid-associated diseases such as Alzheimer’s disease, Parkinson’s disease, Huntington’s diseases, and prion diseases.1−3 Moreover, a formation of amyloid-like fibrils takes place in other maladies associated with protein misfolding, including diabetes type II, prolactoma, primary amyloidosis, etc.4,5 Striking evidence has recently accumulated suggesting that the ability to form amyloid fibrils is not a peculiarity of this small group of disease-related proteins but, rather, the ability to form amyloid is a generic property of the polypeptide chain.6 Amyloid fibrils are β-sheet rich protein aggregates with different morphologies that constitute a phenomenon known as fibril polymorphism.7,8In vitro aggregation of various amyloid associated proteins, such as calcitonin,9 amylin,10 insulin,8 transthyretin,11 and mouse prion,12 commonly leads to the formation of two distinct fibril morphologies: tape-like and helical-twisted. Microscopic examination of post-mortem extracted amyloids from brains of patients who were diagnosed with Alzheimer’s disease also revealed both of these fibril polymorphs.13,14 It has also been demonstrated that fibril morphology directly correlates with cell toxicity.12,15 Thus, a controllable formation of one fibril polymorph versus another could possibly slow down fibril development and progression of various amyloid associated disorders. At the same time, the factors leading to one fibril polymorph or another are not currently known. It has also been observed that, with protein aggregation, many physical and chemical factors, such as ionic strength,16 temperature, or pressure,7 determine the fibril structure and morphology. For example, Makarava and Baskakov found that hamster cellular isoform of mammalian prion protein forms variable fibril polymorphs under different aggregation conditions.2 Separately, Petkova et al. observed that agitation of Aβ peptide solution results in the formation of structurally and morphologically different fibril polymorphs compared to the fibrils formed without agitation.17 These fibril polymorphs of Aβ had different cell toxicity. A few years ago, Dzwolak demonstrated that vortexing of insulin solutions during protein aggregation at 60 °C causes the formation of fibril superstructures exhibiting negative induced circular dichroism (−ICD) upon binding the achiral dye, thioflavin T (ThT).18 If, however, the same fibrillation was carried out at a temperature, below 50 °C, randomly two differing supramolecular structures were obtained that showed opposite ICD (−ICD and +ICD polymorphs).19,20 Insulin fibrils that were not agitated, while being formed, did not exhibit any ICD signal. Interestingly, the morphologies of the two observed chiral polymorphs although similar showed a tendency for more lateral alignment of filaments for the +ICD polymorph compared to the −ICD polymorph.19,20 This discovery emphasized the importance of utilizing alternative methods beyond classical microscopy, such as AFM (atomic force microscopy) and SEM (scanning electron microscopy), that are capable of distinguishing chiral fibril polymorphs that otherwise appear identical.
Recently, it was discovered that VCD21 is a unique tool that can directly probe supramolecular fibril chirality in solution as well as in dried films.22 Studies of insulin fibrils indicated that enhanced VCD sensitivity arises directly from the long-range supramolecular chirality of fibril structures at all hierarchical levels. It was shown that VCD probes deeper levels of fibril supramolecular chiral organization that are not apparent using existing forms of microscopy. In particular, we found that insulin aggregation at pH 2.4 and higher results in the formation of fibrils that show a strong VCD spectrum with peaks near 1554, 1593, 1627, 1647, 1670 cm–1, which have a sign pattern (+ + – + +).22,23 We named this sign pattern and its associated chiral polymorph “normal”. Microscopic examination of these fibrils indicated that a majority of them have a left-handed helical twist.24 However, if the pH of the aggregation solution is lower than 2.4, the distribution of fibrils shifts to increasingly flat, tape-like, or binary fibrils as the incubation pH continues to be lowered that under microscopic examination show no noticeable chirality or twist on their surface. Nevertheless, these fibrils show a strong, but often somewhat smaller, VCD with a sign pattern (− – + – −) that is nearly the mirror-image of “normal” VCD fibril spectrum and is referred to as the “reversed” polymorph. The fact that flat tape-like fibrils show a strong reversed VCD signal indicates that they must be composed of right-handed filaments, the chirality of which lies below the limit of AFM or SEM detection. Our combined VCD-microscopic studies showed that pH determines not only the net handedness of the filaments, precursors of mature fibrils, but also controls their association pathways.24 Left-handed filaments intertwine, forming left-handed proto-fibrils and mature fibrils that have normal VCD. On the other hand, right-handed filaments associate side-by-side, forming flat, tape-like, or binary fibrils. Thus, pH most likely alters protein–solvent interactions or causes protonation of some amino acid side chains, which are lying on the surface of the filaments. These changes cause variations in the way these filaments bind together to form mature fibrils that either twist together to form braids or align side-by-side without braiding. In addition, it was discovered that that pH not only determines insulin fibril morphology and net chirality at the stage of the protein aggregation, but also may dramatically change the morphology of mature fibrils and overturn their initial chirality.25
The key question we answer in this paper is whether the supramolecular chirality of the filaments is the underlying cause of morphological differences only for insulin fibrils, or whether it is a more general phenomenon that determines the polymorphism of other amyloidogenic proteins and peptides. A related question is whether the supramolecular chirality of all fibril filaments can be controlled by pH. To address these questions we studied aggregation as a function of incubation pH for hen-egg lysozyme, bovine apo-α-lactalbumin, HET-s (218–289) prion-forming domain from fungus Podospora anserina, and a short 11-residue peptide fragment of human transthyretin (TTR (105–115)). The intrinsic supramolecular chirality of these fibrils was measured by VCD, and in parallel, fibril morphology was characterized by atomic force microscopy (AFM), scanning electron microscopy (SEM), and cryo-SEM. In addition the secondary structure of each of these amyloid fibrils was determined by Fourier transform infrared (FTIR) and deep UV resonance Raman (DUVRR) spectroscopy.
Results
Lysozyme
Lysozyme, like insulin, forms opposite chiral polymorph depending on the incubation pH. Hen-egg lysozyme is a widely used model protein for amyloidogenic studies that aggregates at low pH and high temperatures, forming rod-like fibrils.26−28 Previously, it was reported that lysozyme forms fibrils that show enhanced “normal” VCD.22 Here, hen-egg lysozyme (60 mg/mL) was incubated at 65 °C for 3 days at different pH values. Protein aggregation was terminated by reducing the sample to room temperature. The solution was centrifuged at 10 000 rpm for 20 min, and the resulting gelatinous solution, dominated by mature fibrils, was analyzed by IR and VCD (Figure 1).
Figure 1.
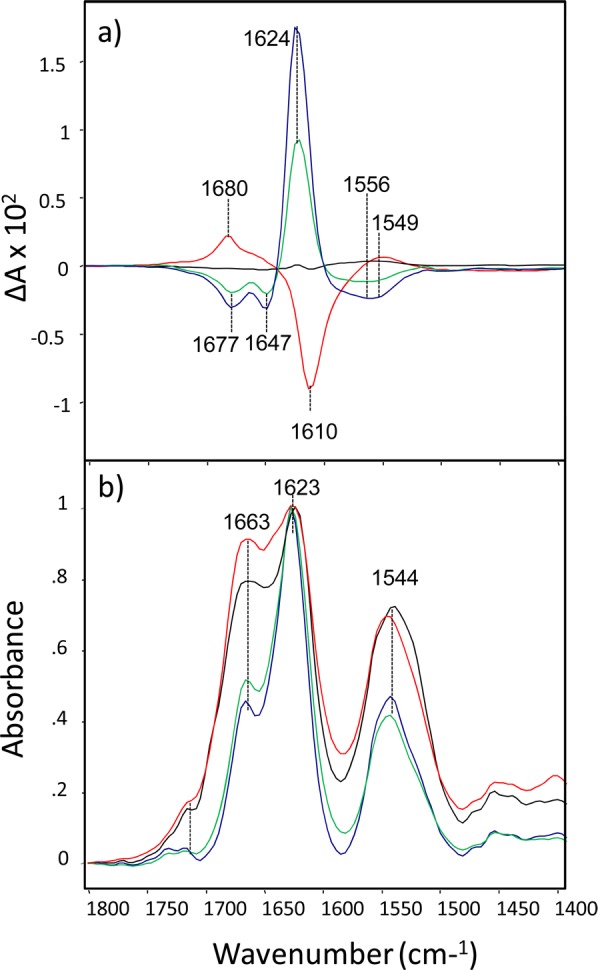
VCD (a) and IR (b) spectra of lysozyme fibrils grown at pH 1.0 (blue), 1.5 (green), 2.3 (black), and 2.7 (red) for 3 days at 65 °C.
The strong peak at 1623 cm–1 in the IR spectra of all studied samples indicates a dominance of β-sheet structure (Figure 1, bottom).29 The peak at 1663 cm–1 that increases in intensity with increasing pH is associated with nonordered or loop structure,30 and may be related to the rate of fibril formation during the specified incubation conditions.
We found that relatively small variations in the pH of the aggregation solution cause dramatic changes in the VCD spectra of lysozyme fibrils, the largest of which is almost 10 times more intense than the corresponding intense VCD spectra observed for insulin fibrils grown under the same pH values.23 As is evident from the VCD spectra, lysozyme fibrils show normal VCD at pH 2.7 (Figure 1) and higher (data not shown). Fibrils that were grown at low pH (1.0–1.5), on the other hand, show reversed VCD with intensity comparable in magnitude but roughly opposite in sign compared to normal VCD. Fibrils that were grown at pH 2.3 have very weak VCD intensity, with small residual VCD peaks for both normal (negative, 1610 cm–1) and reversed (positive, 1624 cm–1) fibrils present. One therefore concludes that pH 2.3 is close to an equilibrium balance point in the distribution of normal and reversed lysozyme fibrils. Similar VCD spectral patterns were obtained for insulin fibrils grown at the same pH values.23
We also investigated whether prolonged aggregation at elevated temperature causes any changes in lysozyme fibrils. Solutions with pH from 1.0 to 2.7 (60 mg/mL) were incubated at 65 °C for 5 days, and their VCD and IR spectra were recorded (Supporting Information Figure S1). We found that VCD intensity of all fibril solutions, except the very small VCD intensity from fibrils incubated at pH 2.3, decreased compared to fibrils grown for 3 days at 65 °C. In addition to the decrease of VCD intensity we found that the position of a negative peak changed: lysozyme fibrils that were grown at pH 2.7 had a negative peak at 1610 cm–1 (3 days of incubation) and at 1616 cm–1 (5 days of incubation). The same band minimum shifted from 1610 cm–1 to 1623 cm–1 for lysozyme fibrils grown at pH 2.3. These changes will be considered further in the Discussion section.
Fluid-cell AFM and SEM were utilized to investigate morphological differences between normal and reversed lysozyme fibrils. Both AFM and SEM (but not TEM) microscopy can provide information about the sense, or handedness, of fibril helical chirality.30
AFM and SEM are complementary microscopic methods for the determination of accurate species dimensions: AFM provides accurate height data, while width dimensions may be larger due to a finite tip-width convolution error. SEM, on the other hand, may not be utilized for height determination, but does provides accurate width data. Images of reversed and normal lysozyme fibrils are shown in Figure 2. We found that lysozyme fibrils that exhibit reversed VCD have a flat tape-like morphology without a noticeable twist. They have a height between 2.5 and 3.0 nm and a width in the range of 25 nm. Some of these fibrils are composed of two side-to-side associated fibrils (Figure 2, b). Lara et al. reported that these tape-like lysozyme fibrils consist of as many as 17 laterally assembled filaments.31 According to our data, binary lysozyme fibrils have the same height as the discussed tape-like fibrils, while their width is significantly larger (∼45 nm). Lysozyme fibrils that exhibit normal VCD have cylindrical shapes. Some of these fibrils exhibit a well-defined left-handed twist (Figure 2, c; identified by yellow arrows). They have a height between 6 and 8 nm and a width between 18 and 20 nm. As with insulin,23,24 lysozyme fibrils exhibiting normal and reversed VCD have cylindrical left-twisted and flat tape-like fibril morphologies, respectively.
Figure 2.
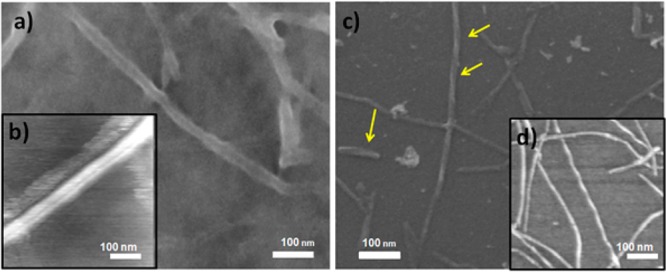
SEM (a, c) and fluid-cell AFM (b, d) images of reversed VCD (a, b) and normal VCD (c and d) lysozyme fibrils grown at 65 °C for 3 days. Helical twisted fibrils (all left-handed) are indicated by yellow arrows. Scale bars are 100 nm.
It is interesting that neither for insulin nor lysozyme fibrils exhibiting reversed VCD is there any evidence of right-handed twist on their surface. One might suspect that fibril dehydration after fixation on copper grids for SEM imaging could result in significant deformations of fibril topology. As a result, it is possible that a right-twist of reversed VCD fibrils may become distorted and therefore not apparent on SEM images. In order to show that reversed VCD fibrils do not have a right-handed twist on their surface we utilized one of the most preservative microscopic tools: cryo-SEM.32 Cryo-SEM shows that reversed VCD lysozyme fibrils have flat-like topology without a right-handed twist. In fact applications of cryo-SEM for studies of insulin reversed VCD fibrils showed similar results, while at the same time this method confirmed the left-handed twist of normal VCD insulin fibrils (Supporting Information Figure S2).
Deep UV resonance Raman (DUVRR) spectroscopy has proven to be an efficient technique for characterizing protein structural rearrangements at all stages of fibrillation.26,33−37 In particular, DUVRR spectroscopy, together with hydrogen–deuterium exchange, has been found to be a powerful method for the determination of fibril cross-β-core structure.38−40 Previously, using DUVRR spectroscopy we found that both normal and reversed insulin fibrils have the same spectrum and hence the same cross-β-core structure, while they have different environments for tyrosine (Tyr) amino acid residues.23 In the present study we used DUVRR spectroscopy to demonstrate the same similarity of cross-β-sheet structures of normal and reversed VCD lysozyme fibrils with small differences for the aromatic side-chains between normal and reversed fibrils (Supporting Information Figure S3).
Apo-α-lactalbumin Aggregation
Apo-α-lactalbumin aggregation results in the formation of only reversed VCD fibrils at 37 °C. The protein α-lactalbumin is a small (∼14 kDa) metal binding protein present in the whey milk of most mammal species as a regulatory subunit of lactose synthase.41 α-Lactalbumin consists of 123 amino acid residues arranged into two domains, designated α and β. The two domains are divided by a cleft, where a calcium ion is located. Reduction of two of four disulfide bonds in α-lactalbumin results in its adopting a molten globule conformation.42 The molten globule state of α-lactalbumin is a well-studied structure that has native-like secondary structure with an absence of specific tertiary packing interactions of amino acid side chains.43,44
Apo-α-lactalbumin is of particular interest since it is homologous to lysozyme, albeit with different aggregating and denaturing properties.41 Aggregates of apo-α-lactalbumin form long unbranched fibrils under low pH and high ionic strength (Supporting Information Figure S4).45 Previously the secondary structure of apo-α-lactalbumin fibrils has been extensively characterized in our group.46,47 In the current study we investigate the effect of pH on the formation of different VCD chiral polymorphs. Apo-α-lactalbumin (5 mg/mL) was incubated at different values of pH in the presence of 150 mM NaCl at 37 °C for 3 days. After fibril formation was terminated by centrifugation and temperature reduction, the VCD and IR spectra of the sample were measured. We found that fibrils grown at different pH values show reversed VCD, with a positive peak near 1624 cm–1 and a negative peak near 1639 cm–1 (Figure 3).
Figure 3.
VCD (top) and IR (bottom) spectra of apo-α-lactalbumin fibrils grown at pH 1.5 (blue), 2.5 (green), 3.0 (black), and 4.0 (red) for 3 days at 37 °C.
As depicted, apo-α-lactalbumin aggregation at this concentration over the pH range from 1.5 to 4.0 at 37 °C results in an excess of only one chiral polymorph that has reversed VCD supramolecular chirality. Fibrils that were grown at pH (2.5) have the highest intensity of a peak at 1617 cm–1. Fibrils that were grown at pH 1.5 have relatively smaller intensity at 1617 cm–1, while the intensity of a negative peak at 1666 cm–1 is almost the same as for pH 2.5 fibrils. Fibrils that were grown at pH 3.0 have smaller intensity for all VCD bands relative to pH 1.5 and 2.5 fibrils centered at 1624 cm–1. Finally, fibrils grown at pH 4.0 have the smallest VCD intensity, and the peak previously observed at 1617 cm–1 for pH 1.5 and 2.5 is shifted to 1612 cm–1.
AFM was used to image fibrils of apo-α-lactalbumin that were deposited onto a freshly cleaved mica surface. The AFM images revealed both tape-like and left-twisted fibrils at all pH values. Tape-like fibrils had ∼26 nm width and ∼5 nm height, while left-twisted fibrils had the same width but were over twice as high (∼12 nm). Examples are shown in Figure 4.
Figure 4.

Fluid-cell AFM images of left-twisted (a) and tape-like (b) fibrils of apo-α-lactalbumin grown for 3 days at 37 °C.
The amount of left-twisted fibrils decreased with an increase of aggregation pH (Supporting Information Figure S5). Specifically, they were abundant in a fibril solution that was grown at pH 1.5, while less frequently observed at pH 2.5. Finally, in the fibril solutions grown at pH 3.0 and 4.0 left-twisted fibrils were extremely rare (Supporting Information Figure S5). At the same time, the tape-like morphology was commonly observed for fibrils grown at all pH values.
HET-s (218–289) Peptide Fragment
HET-s (218–289) peptide fragment of prion protein forms opposite chiral polymorphs at different pH values. HET-s is a prion protein of the fungus Podospora anserina. It was previously shown that at low pH its C-terminal fragment (HET-s 218–289) slowly aggregates forming amyloid-like fibrils.48 Several independent studies have shown that (HET-s 218–289) aggregation at pH 2.0 leads to a formation of thick left-twisted cables composed of 3–6 filaments.48−50 At the same time, its aggregation at pH above 3.0 causes formation of thin fibrils without a noticeable twist.48 Mizuno et al. proposed that these thin fibrils ought to have a left-handed twist, while no repeatable twist on the cryo-EM provided pictures was evident.49 These thin fibrils were proposed to form a β solenoid (β-roll) with a triangular hydrophobic core.51 It is also of interest to note that these two (HET-s 218–289) fibril polymorphs have different infectivity: fibrils at pH 2.0 showed very little if any infectivity, while fibrils formed at pH above 3.0 were found to be highly infectious.48,52,53 On the basis of electronic circular dichroism (ECD) and IR spectroscopy, thick left-twisted cables and thin fibrils were found to have different secondary structure.48 It was also shown that these two polymorphs have different assembly kinetics, resistance to denaturants, and intrinsic fluorescence.48
In our study we investigated supramolecular chirality of HET-s (218–289) prion fibrils grown at pH 2.0, 3.3, and 3.9 (Figure 6). It appears that pH 2.0 fibrils, which have a left-handed twist (Figure 6), exhibited very intense normal VCD. Thin fibrils grown at pH 3.3 and 3.9 (Figure 5) showed VCD spectra of the opposite sign with 1–2 orders of magnitude lower intensity. The normal sign patterns for pH 2.0 fibrils are 1557 (+), 1578 (+), 1614 (−), 1640 (+), and 1666 (+) cm–1, while the reversed sign pattern for pH 3.3 is 1560 (−), 1611 (+), 1636 (−) cm–1. HET-s (218–289) prion fibrils grown at pH 3.9 exhibit the same reversed sign pattern but have some differing VCD band frequencies: 1557 (+), 1614 (+), and 1660 (−) cm–1.
Figure 6.

AFM images of HET-s (218–289) prion fibrils grown in pH 2.0 (a) and 3.9 (b).
Figure 5.
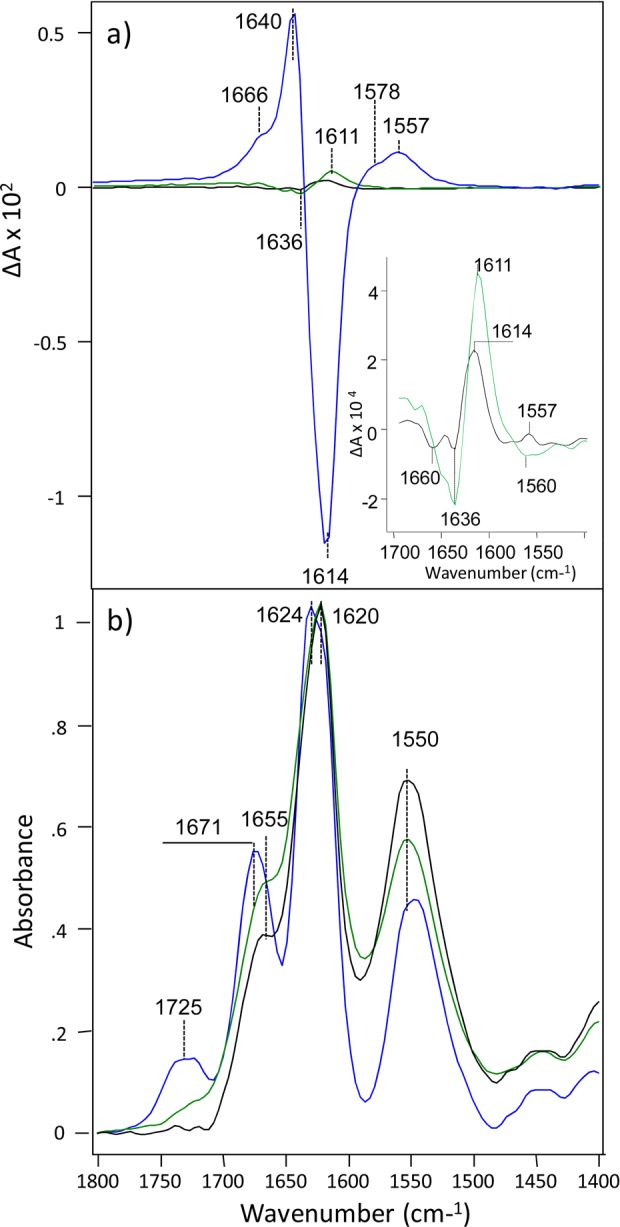
VCD (a) and IR (b) spectra of HET-s (218–289) fibrils grown at pH 2.0 (blue), 3.3 (green), and 3.9 (black) for 2 months at room temperature. For better visualization of band positions and intensities the insert shows VCD spectra of only pH 3.3 (green) and pH 3.9 (black) fibrils.
The IR spectra of all studied samples exhibit a peak around 1620 cm–1, indicating a predominance of β-sheet structure (Figure 5b).29 It was found that that the position of this peak is slightly shifted in the spectrum of fibrils grown at pH 2.0 (1624 cm–1) compared to the corresponding IR band for fibrils grown at pH 3.3 and 3.9 fibrils (1620 cm–1). Moreover, the IR at pH 2.0 has higher intensity for peaks at 1725 and 1671 cm–1compared to those of fibrils grown at pH 3.3 and 3.9. These differences indicate structural deviations of normal and reversed VCD chiral polymorphs of HET-s fibrils. For more detailed structural characterization of their secondary structure we applied DUVRR (Supporting Information Figure S6). The positions of amide I, II bands and Cα-H band are nearly identical in the spectra of both chiral polymorphs, which indicates a high level of similarity of secondary structure for all three fibril pH values. At the same time, we found that HET-s fibrils that were grown at pH 3.9 have substantially higher amount of unordered structure (a peak ∼1268 cm–1) compared to the pH 2.0 fibrils.54
AFM was utilized to reveal morphological organization of the analyzed HET-s (218–289) prion fibrils. We found that fibrils grown at pH 2.0 have a well-defined left-handed twist, 40 nm in width and around 3 nm in height (Figure 7). At the same time, fibrils that were grown at pH 3.9 (reversed VCD) exhibited no twist on their surface. They had a shape of flat tapes that have 25 nm in width and ∼2 nm in height.
Figure 7.
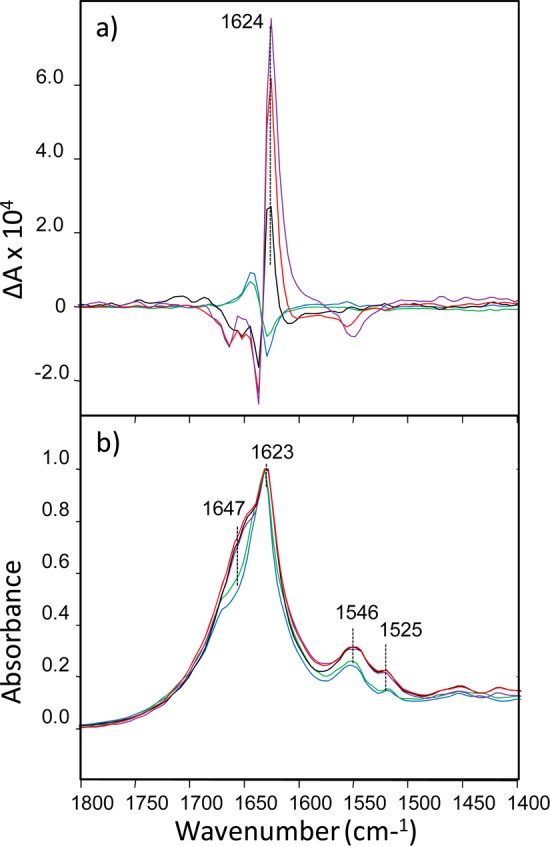
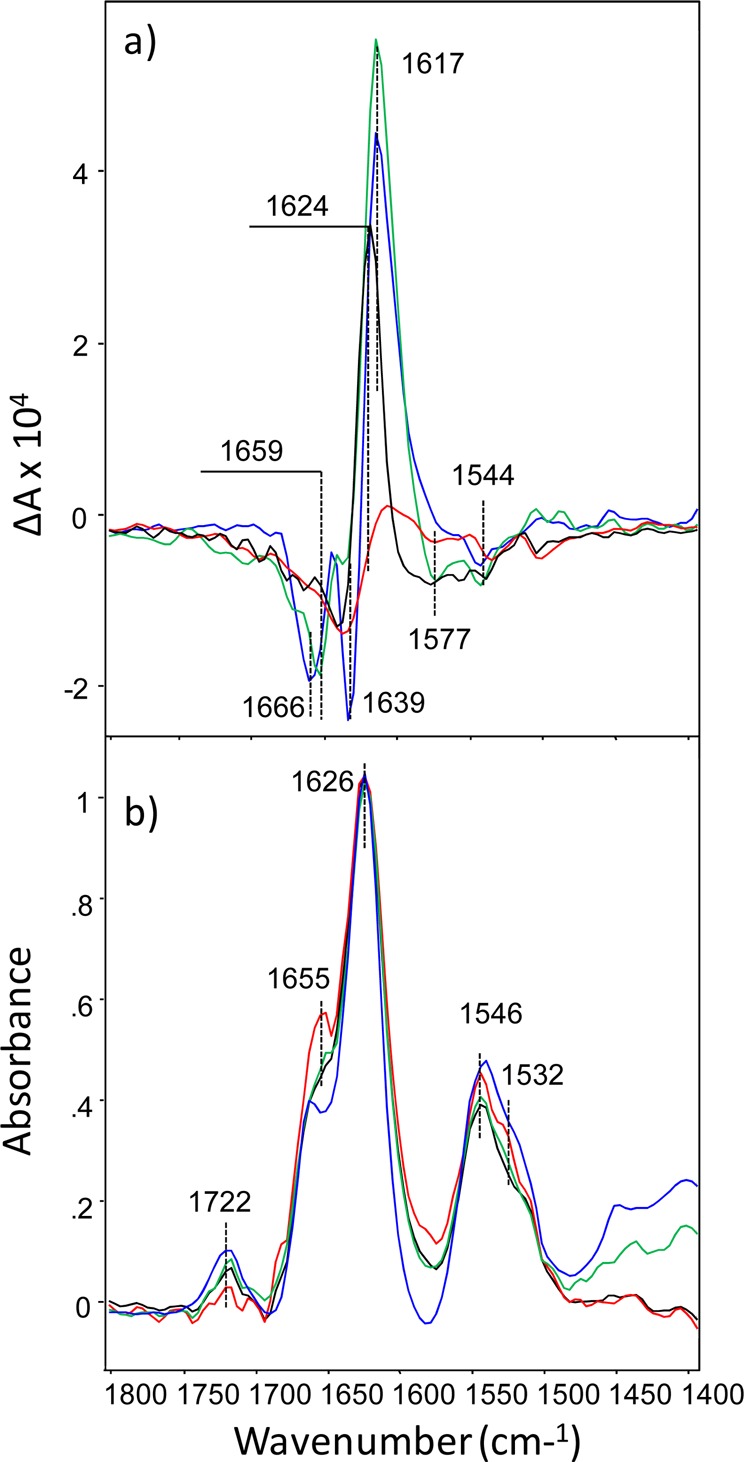
VCD (top) and IR (bottom) spectra of TTR (105–115) fibrils grown at pH 1.0 (blue), 1.5 (green), 2.0 (black), 2.5 (red), and 3.0 (violet) for 2 days at 37 °C followed by 14 days at room temperature.
TRR (105–115) Peptide Fragment
Opposite chiral polymorphs are observed for fibrils formed from a small peptide of human transthyretin. TTR (105–115) is a peptide fragment of transthyretin, a 55 kDa protein involved in the transport pathway of thyroxine and retinol in plasma.55 Although this peptide is itself not implicated in any human disease, fibrillization of the full-length protein has been linked to familial amyloid polyneuropathy (FAP) and senile systemic amyloidosis (SSA).56 Transthyretin has a β-sheet rich structure and can form amyloid-like aggregates in vivo. Previously, it was demonstrated that TTR (105–115) is able to aggregate in vitro, forming amyloid-like fibrils.57 We grew TTR (105–115) fibrils as described previously,57 at different pH values for 2 days at 37 °C followed by 14 days at room temperature.
As shown in Figure 7, the IR spectra of TTR (105–115) feature a strong band at 1623 cm–1 that is characteristic of β-sheet structure. As with insulin, lysozyme, and HET-s prion fibrils described above, the VCD sign of TTR (105–115) reverses as a function of small changes in pH during protein aggregation. TTR (105–115) fibrils formed at pH 2.0 and above show strong reversed VCD, and the intensity of the positive 1624 cm–1 VCD band increases within increase of aggregation pH. Similar to HET-s fibrils, and opposite insulin and lysozyme, higher pH favors formation of the reversed VCD for TTR (105–115) fibrils. The magnitude of reversed VCD intensities observed for these fibrils is nearly the same as those previously observed for reversed VCD insulin fibrils (formed at low pH). By contrast, TTR (105–115) fibrils grown at pH values 1.5 and 1.0 show normal VCD with their VCD intensities in the range 2–6 times smaller than the VCD intensities of reversed TTR (105–115) fibrils.
AFM was applied to characterize morphologies of normal and reversed VCD TTR (105–115) fibrils (Figure 8). We found that normal and reversed VCD AFM images of TTR (105–115) display different morphologies. TTR (105–115) fibrils that were grown at pH 1.5 are long and have cylindrical shapes. Together with long rod-like fibrils we observed large amounts of small spherical species, which may be fibril precursors (Figure 8a). TTR (105–115) fibrils grown at higher pH (pH 2.5) are significantly shorter than fibrils grown at pH 1.5. Their length almost never exceeds 100 nm. In addition to the diverse morphologies fibrils with normal and reversed VCD, TTR (105–115) fibril polymorphs have different heights: normal (pH 1.5) VCD fibrils are around 5 nm, while reversed VCD (pH 2.0) fibrils are around 9 nm.
Figure 8.

AFM images of TTR (105–115) fibrils grown at (a) pH 1.5 and (b) pH 2.5. Scale bar is 100 nm.
More detailed surface analysis of TTR (105–115) fibrils grown at pH 2.5 (Figure 8b) indicates that some of them are composed of several side-by-side associated proto-fibrils. We did not observe any twist either on the surface of this chiral polymorph or on the surface of fibrils grown at pH 1.5. Flat-like topology of TTR (105–115) fibrils grown at pH 2.0, 37 °C (here reversed VCD) was previously confirmed by Jaroniec et al.58 It was shown that these fibrils are composed of several side-by-side associated proto-fibrils. However, no measurement of the VCD of these fibrils was previously reported.
The application of DUVRR spectroscopy allowed us to elucidate the secondary structure organization of both normal and reversed VCD of TTR (105–115) fibrils (Supporting Information Figure S7). Both chiral polymorphs of TTR (105–115) fibrils have narrow and intense amide I, II, and III bands, which indicate that they share the same cross-β core structure. We found that the intensity of the Tyr band is also identical in both normal and reversed VCD TTR (105–115) fibrils, indicating high similarities in Tyr local environment of both polymorphs.
Discussion
With the results presented here, VCD intensity, enhanced by more than 1 order of magnitude over isolated protein levels, has been observed for three additional amyloid fibrils, namely apo-α-lactalbumin, the HET-s (218–289) prion-forming domain, and TTR (105–115) peptide fragment from transthyretin. In a separate publication, similarly enhanced VCD has also been reported for a number of polyglutamine (polyQ) fibrils from Q15 to Q45.59
Also with this paper, control of the sense of amyloid fibril chirality, normal versus reversed, by incubation under relatively small variations in pH, previously reported only for insulin,23 has been extended to lysozyme as well as apo-α-lactalbumin, HET-s (218–289), and TTR (105–115). As with insulin, the sign pattern, defined above, for enhanced VCD intensity is (+ + – + +) for normal fibrils, and the nearly mirror-image relative intensity pattern with signs (− – + – −) for reversed fibrils reflects an underlying level of fibril chirality. Of these signed bands, the band near 1620 cm–1, corresponding to the principal IR marker band for fibril protein structure, is the most intense and is the primary marker band for VCD fibril chirality.
The principal focus of this paper is to correlate fibril supramolecular chirality, based on the sign pattern of enhanced VCD, to the two major classes of fibril morphology, either left-twisted or flat tape-like, as revealed by AFM or SEM imaging. The details of this correlation from results described in the previous section, as well as the earlier reported results for insulin,23−25 are summarized in Table 1 for ease of comparison. For the proteins and peptide fragments reported here, each has a different sensitivity to pH although the sensitivity of lysozyme is similar to that of insulin: normal VCD is observed above approximately pH 2.2 and reversed VCD below that pH.
Table 1. Dependence of the Fibril Morphology and VCD on the Aggregation pH for Insulin, Lysozyme, apo-α-Lactalbumin, HET-s (218-289), and TTR (105-115) Fibrils.
| protein, incubation conditions | pH region | morphology | VCD sign pattern | ΔA/A ∼1620 cm-1 |
|---|---|---|---|---|
| insulin, 24 h at 70 °C | 1.3–2.1 | flat tape-like | reversed | 0.15 × 10⁻⁴ to 0.18 × 10⁻⁴ |
| 2.4–3.1 | left-twisted | normal | –1 x10⁻⁴ to –3.5 × 10⁻⁴ | |
| lysozyme, 3 days at 65 °C | 1.0–1.9 | flat tape-like | reversed | 0.9 × 10⁻² to 1.7 × 10⁻² |
| 2.3 | flat tape-like, left-twisted | normal, reversed | –2 × 10⁻⁴ | |
| 2.7 | left-twisted | normal | –8 × 10⁻³ | |
| apo-α-lactalbumin, 3 days at 37 °C | 1.5–2.5 | left-twisted > flat tape-like | reversed | 4.2 × 10⁻⁴ to 5.1 × 10⁻⁴ |
| 3.0 | flat tape-like | reversed | 3.3 × 10⁻⁴ | |
| 4.0 | flat tape-like | reversed | 0.25 × 10⁻⁴ | |
| HET-s (218–298), 2 months at room temp | 2.0 | left-twisted | normal | –1.2 × 10⁻² |
| 3.3–3.9 | flat tape-like | reversed | 2.5 × 10⁻⁴ to 4.7 × 10⁻⁴ | |
| TTR (105–115), 2 days at 37 °C followed by 14 days at room temp | 1.0–1.5 | cylindrical, presumably left-twisted | normal | –0.5 × 10⁻⁴ to −1 × 10⁻⁴ |
| 2.0–3.0 | flat tape-like | reversed | 2.5 × 10⁻⁴ to 7 × 10⁻⁴ |
Apo-α-lactalbumin also shows reversed VCD at low pH. For this protein though, no point of VCD sign reversal is reached between pH 1.5 and 4.0. If it were to reverse sign pattern, it is predicted to do so only below pH 1.5 when the population of left-twisted fibrils becomes sufficiently dominant relative to flat tape-like, as reasoned further in the next paragraph. We have found that, at pH 1.5, the relative populations of reversed tape-like fibrils and normal left-twisted fibrils marginally favor the left-twisted fibrils (see Table 1 and Supporting Information Figure S5); however, the VCD spectrum indicates in Figure 3 that reversed tape-like fibrils are more influential, perhaps because reversed fibrils in this region have intrinsically higher VCD intensity. At pH 2.5, the reversed VCD increases, as the population of normal left-twisted fibrils decreases, in agreement with the idea that these two morphologies have opposite VCD and reduction of left-twisted fibrils permits an overall increase in the observed, net-reversed VCD spectrum. As the pH is increased to 3.0 and then to 4.0, the population of left-twisted fibrils becomes close to zero, but unexpectedly the observed reversed VCD decreases dramatically from pH 2.5 to 3.0 and then to a relative small value for pH 4.0. This reduction must solely be due to a reduction in the long-range chirality of the flat tape-like fibrils. From Supporting Information Figure S5 the observed height distribution of the flat tape-like fibrils narrows considerably to near 6 nm with increasing pH. One possible explanation for these observations is that as the pH increases beyond pH 2.5, the stability of the aggregation of right-handed (reversed) filaments that form multifilament tape-like fibrils decreases until at pH 4 only the lowest level of fibril structure remains, possibly only individual filaments having no lateral associations of filaments. Beyond pH 4, not even the simplest fibril filament structures are stable, and fibrillation of any kind no longer occurs. Thus, although the pH dependence of apo-α-lactalbumin differs substantially from that of insulin and lysozyme, our understanding of the VCD and AFM imaging for this protein still supports the evidence that the sign pattern for VCD correlates without exception to the morphology of the observed microscopic images of the fibrils grown at various pH values.
The two peptide fragments, HET-s (218–289) and TTR (105–115), show the opposite VCD sign behavior compared with insulin and lysozyme, with normal fibrils appearing at low pH and reversed fibrils at high pH, although in these two cases the level of VCD enhancement differs dramatically. For the HET-s (218–289) peptide, the low-pH normal VCD is extremely large with high-pH reversed VCD significantly smaller, whereas for the TTR (105–115) peptide the low-pH normal VCD is small and the high-pH reversed VCD is much larger.
One possible influence beyond the value of pH was explored by introducing differing amounts of sodium chloride and thereby changing the ionic strength at a given pH value. Experiments to date have shown no such influence of ionic strength (Supporting Information Figure S8). Another variable partially explored is the effect of incubation temperature, duration of incubation, and time after incubation. Here variations in VCD intensity have been observed from which one concludes, as is well-known from many previous studies, that fibril formation, development, and stability can depend significantly on these variables.
While studying the dependence of lysozyme fibril supramolecular chirality on incubation conditions we found that prolonged fibril exposure at the elevated temperature results in a decrease of VCD intensity. As previously demonstrated, fibril formation and development is associated with the continuous increase in the VCD intensity of the analyzed solution.22 Since fibril fragmentation is the opposite process, it should be associated with a decrease in VCD intensity.22 Therefore, one would expect that the observed decrease of fibril VCD intensity for lysozyme is indicative of fibril fragmentation during extended development. In fact, this propensity of fibrils has been extensively studied and proposed to be an intrinsic mechanism of fibril self-propagation, since each individual fibril fragment may act as a seed and give a birth to a new full-length fibril.60,61
In the Results section, we noted on several occasions that the sign of the major VCD peak appears to shift from the region of 1620 cm–1 to near 1610 cm–1. However, there is no corresponding shift in the peak maxima of the corresponding IR bands near 1620 cm–1. A highly likely explanation for the large frequency shift away from the vicinity of 1620 cm–1 is that two opposite-signed VCD bands, with peak maxima only a few wavenumbers apart, interfere and give rise to a couplet of opposite signed VCD bands reduced in intensity but separated by a frequency difference related with the widths of the individual opposite signed VCD bands. Such interference and splitting for peak maxima do not occur for the parent IR bands since their intensity contributions reinforce rather than partially cancel.
Combining these VCD observations with correlated AFM images as summarized in Table 1 reveals a correlation, without exception, of the normal VCD sign pattern with fibrils displaying a predominantly rounded left-twisted helical morphology and the reversed VCD sign pattern with fibrils having a flat tape-like morphology. For the flat tape-like fibrils there is no indication of fibril chirality in their AFM or SEM images. In the case of insulin, this correlation led us to propose that the enhanced, opposite-signed, mirror-image-like intensity pattern of VCD must have its origins at a deeper level of fibril structure than that visible for fibril morphology using AFM or SEM imaging.24 Further, we proposed that opposite VCD sign patterns for normal and reversed fibrils originated at the level of individual fibril filaments, the simplest level of fibril cross-β core structure, with filament axial helical twists of opposite sense, left-handed for normal fibrils and right-handed for reversed fibrils.24 It follows from this proposition that left-twisted filaments form braids of multiple-filament left-twisted fibrils with observable left-twisted morphology, while right-twisted fibrils do not braid and instead adopt a flat tape-like morphology consisting of parallel side-by-side filaments. To our knowledge, imaging the chirality of individual filaments has not been conclusively observed, and consequently,8,63 VCD to date is the only known structure probe of fibril chirality at the level of individual filaments.24 This point is reinforced by the fact that VCD can follow fibril formation as intensity enhancement from the earliest stages of filament formation,22,24 and that the enhanced VCD intensity grows without a substantial change in the relative intensity pattern as filaments first form, then associate and develop into mature fibrils. Further in the case of insulin, on the basis of the observation that reversed fibrils spontaneously convert to normal fibrils upon raising the pH into the normal fibril pH range whereas normal fibrils do not convert to reversed fibrils when the pH is correspondingly reduced to the reversed fibril pH range, we have concluded that normal left-twisted mature fibrils are more thermodynamically stable, at least for insulin, than flat tape-like fibrils.25 This correlates with the idea that left-twisted filament-braided mature fibrils are in deeper thermodynamic sinks from which reversal or decomposition requires extremes of temperature or pH.
We have also considered whether there is any correlation between the pH dependence of filament chirality and pI values for the protein/peptide and found that there appears to be little or no correlation between protein pI and pH dependence of filament chirality. For example, the pI for insulin is 5.30–5.35, while for lysozyme the pI is 10.6–10.9. Nevertheless, both of these proteins exhibit nearly the same pH dependent fibril chirality. At the same time, the pI of HET-s (218–289) is 9.19, while it exhibits the opposite pH chirality dependence of lysozyme (pI 10.6–10.9). For apo-α-lactalbumin the pI (4.2–4.5)41 is very close to the pI of insulin (5.30–5.35); however, we observed formation of only one chiral polymorph for apo-α-lactalbumin. Finally, HET-s (218–289) and TTR (105–115) exhibit similar pH dependence of fibril chirality (normal at low pH and reversed at high pH). Nevertheless, their pIs are substantially different: 9.19 for HET-s (218–289) and 6.09 for TTR (105–115). The only correlation might be that the substantial difference in pI’s of apo-α-lactalbumin (4.2–4.5) and lysozyme (pI 10.6–10.9) might be related to the difference in pH chirality dependence for these two isostructural proteins in their native states. The pI values provided here were determined as described in Supporting Information.
Although the focus here is to relate the sign pattern of the enhanced VCD to the major classes of fibril morphology, inspection of the IR absorption spectra for fibrils described in Figures 1, 3, 5, and 7 reveals variations in a band in the 1650–1670 region that also shows intensity differences that correlate with VCD sign and fibril morphology. Not as dramatic as the VCD sign pattern, there is likely interesting information about the differences between left-twisted and flat tape-like fibrils associated with these IR bands. In the Results section for lysozyme we attributed this band to nonordered or loop structure. An open question to be pursued in future studies is whether this band is associated with a fully formed fibril filament (cross-β-core) or with partially unfolded proteins yet to be incorporated into the filament or fibril structure. At least for lysozyme and insulin (not shown here), this band may be associated with parts of the protein structure not in the cross-β-core for which there would be more residues than for the shorter peptides from HET-s and TTR.
Finally, examination of the structural organization of the opposite chiral polymorphs using DUVRR and IR spectroscopy shows that insulin, lysozyme, and TTR (105–115) fibril polymorphs have the same secondary structure. At the same time, we have found that normal and reversed VCD chiral polymorphs of HET-s (218–289) fibrils have small differences secondary structure distributions with the same cross-β-core structure.
Theoretical Considerations
Although the primary findings of this paper are drawn from new experimental results, namely VCD spectra and AFM/SEM images as a function of incubation pH for four protein molecules beyond our previously published findings for insulin, we offer in this section our views of the theoretical, molecular-level implications for what the experimental evidence suggests.
Filament Chirality
The theoretical model of Schweitzer-Stenner62 is the first and simplest computational model of enhanced VCD in fibrils, first observed by Ma et al.22 The model is based on exciton coupling among amide I transition dipoles arrayed as dual, stacked β-sheet ribbons corresponding to the simplest representation of the structure of a single cross-beta core filament. The strands in this model, only two peptide units long, run perpendicular to the filament axis direction. In order to generate enhanced VCD, a twist of 2° was introduced between the strands yielding a long-range gradual helical twist to the filament structure with a one full-turn distance of 180 strands. It was found that such a structure yields enhanced VCD that corresponds to what is referred to as normal VCD (negative VCD near 1620 cm–1 with positive VCD to higher wavenumber frequencies) for a left-hand helical fibril twist. A corresponding 2° intrastrand helical twist in the opposite direction, corresponding to a right-hand helical filament, reversed the sign of the enhanced VCD couplet and corresponds to our reversed VCD. Filament chirality is therefore a very delicate, subtle level of protein chirality that is apparently sensitive to incubation pH. Most likely, the sensitivity of amino-acid side chains to the aqueous solvent is responsible for this pH sensitivity, and apparently, differing arrays of constituent side-chains, exposed or not to the solvent, results in different pH sensitivity (high versus low) for the sense of filament chirality observed. This is a long-range fibril property that likely cannot be predicted, even qualitatively, without a realistic model of protein side chain influence on the sense of helical chirality as a function of pH. As far as we are aware, the chirality of individual fibril filaments lies below the sensitivity of AFM or SEM imaging, but can be observed with VCD at the initial and subsequent stages of fibril formation.22−25
Fibril Chirality and Morphology
It is known from AFM and SEM images that fibril filaments form higher levels of structure subsequent to the formation of individual filaments. It has been demonstrated, for example by kinetic studies,22 that the degree of enhancement of VCD is sensitive to the degree of filament association as fibrils mature and develop. This is particularly true for the left-twisted morphologies composed of multifilament chiral braids of left-helical filaments and to a lesser degree for the flat morphologies of side-by-side associations of right-helical filaments. An important unanswered question is why only left-helical filaments form braids corresponding to the left-twisted fibril morphology as illustrated diagrammatically in Figure 9. The answer most likely is that left- and right-helical filaments are not mirror-image structures as both consist of l-amino acid residues. A model calculation of this property, the appearance of left-twisted braids and nonappearance of right-twisted braids of helical filaments, again involves consideration of the structure and influence of amino acid side chains. The model of Schweitzer-Stenner applies only to the filament level of structure and does not include any side chain chirality (l- or d-amino acid residues) or filament–filament interactions or braiding. Answering the question of why only left-twisted fibril images and VCD are observed is two levels beyond the Schweitzer-Stenner (S-S) model of enhanced VCD. One first needs a more realistic model of cross-β-core filament structure that includes side chain detail, and second, one needs to extend such a model to a new, higher level of fibril chirality, namely the chiral braiding of multiple-filament fibril structure.
Figure 9.
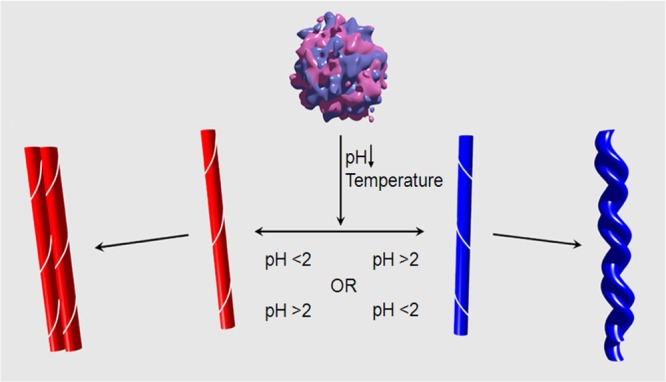
Diagram illustrating the progression from folded protein to individual straight filament with chirality below the senstivity of AFM/SEM and on to mature multifilament fibrils with right helical filaments forming flat tape-like fibrils of straight filaments and left helical filaments forming, possibly more stable, left twisted braids of filaments. The pH dependence may vary between proteins/peptides but not the VCD intensity patterns (normal left helical filaments versus reversed for right helical filaments).
A step in this direction has just been published by Welch, Kubelka, and Keiderling (WKK).64,65 They employ modeling at the level of a full DFT calculation with transfer of parameters from smaller peptides to build large β-sheet structures. Their model is quite different in dimension from the (S-S) model although both use stacked β-sheets to simulate the cross-β-core structure. The WKK model involves strands that are 10 residues instead of 2 residues wide, but the fibril axis is only 5 strands long rather than in the 100-strand range. To induce enhanced VCD, they introduce a twist along the strand direction, not the fibril axis direction, of 15° between residues. They also explore a rotation of the stacked sheets relative to each of 45°, again a chiral departure from an initial achiral cross-β core structure. These two degrees of chiral freedom may be important as filaments aggregate and braid about a common axis. The point needs to be explored as the models move beyond individual filament models and on to multifilament simulations of more mature fibrils. Nevertheless, it seems reasonable that chirality along the filament axis, as emphasized in this paper (see Figure 9), as opposed to the more local strand or intersheet twist chirality,64,65 is the form of filament chirality that can be extended most easily to the supramolecular level of filament structure and hence to VCD enhanced by up to 2 orders of magnitude relative to the isolated-protein VCD intensity level.
At this stage, even with the recent work of WKK, there are no structural models of interfilament association leading to the formation of different fibril morphologies. It is our view that the realization of a model, even at the course grain level, that is capable of rationalizing the correlation of left-helical filaments to left-twisted fibril morphology and right-helical filaments to flat fibril morphology, is beyond the reach of near-term possibilities and must await further advances in our understanding of the unusual sensitivity of VCD to filament and mature fibril chirality as well as the many chiral degrees of freedom that may influence fibril morphology.
Two further observations relevant to this discussion have been established previously for insulin and remain to be confirmed more systematically for the new fibril results presented here. As fibrils grow by adding filaments and becoming thicker, the VCD grows from initially observed levels, whereas the IR intensity does not grow in overall magnitude.22−25 This is more dramatically true for the braided left-twisted morphology where an additional order of magnitude of VCD may be observed compared to the initial enhanced VCD of newly formed filaments. This strongly implies a second level of chirality beyond the filament level that is IR intensity neutral. Second, the left twisted morphology is more stable than the flat tape-like morphology.25 Thus, the interfilament interactions of the left-twisted braided fibril consisting of left-helical filaments are stronger than the corresponding side-by-side interactions of the flat tape-like fibrils composed of right-helical filaments. A successful model of fibril morphology and associated VCD intensity should reflect this difference in thermodynamic stability.
Conclusions
The results of the present study, and the absence of any observable chirality by AFM for flat tape-like fibrils, extends, beyond the case of insulin, the correlation of the sign of VCD intensity pattern with the two major classes of amyloid fibril morphology, round left-twisted and flat tape-like. Also extended by this study (to fibrils of four new protein or peptide fragments) is the hypothesis that the near mirror-like opposite-signed VCD patterns associated with these two morphologies arise from the opposite sense of helical twist of individual fibril filaments that comprise observed multifilament, more-fully developed fibrils. Further, for all five analyzed amyloid fibrils documented in Table 1, filament chirality appears to lie below the level of direct detection of AFM or SEM imaging. Finally, there is wide variability in the pH dependence of filament chirality, being one sense (reversed, right-handed at lower pH and normal, left-handed at higher pH) for the proteins insulin, lysozyme, and apo-α-lactalbumin, and the opposite sense (normal, left-handed at lower pH and reversed right-handed at higher pH) for the peptide fragments HET-s (218–289) from prion protein, and TTR (105–115) from transthyretin. We have investigated whether there is any correlation between pH dependence of filament chirality and the pI of the protein/peptide and found no direct correlation. Thus, we have shown extensive new evidence that supports an affirmative answer to the question posed in the title of this paper. Namely, yes, the chirality of individual amyloid fibril filaments does indeed appear to be the underlying cause of the major morphological differences (round twisted versus flat tape-like) in all amyloid fibrils explored to date by VCD. Nevertheless, the protein/peptide fibrils sampled for morphology and VCD is so far limited to five, albeit somewhat diverse, cases, and there well could be surprises and exceptions in future studies. A final understanding of the correlations reported here must await sufficiently realistic and accurate modeling of filament and fibril chirality together with the calculation of the associated VCD spectra.
Acknowledgments
We are grateful to Jonas Baltrusaitis from University of Iowa for performing cryo-SEM imaging and Dr. Alexander V. Zabula for valuable graphical assistance. This work was supported by National Institute on Aging, National Institute of Health, Grant R01AG033719 (I.K.L.); National Institutes of Health Grants AG002132 (G.S.) and F31-AG040947 (G.S.); and the National Science Foundation (SBIR phase II Grant IIP-0945484 to R.K.D., L.A.N., and X.L.).
Supporting Information Available
Detailed experimental procedure, materials, and methods. Figures S1–S8. This material is available free of charge via the Internet at http://pubs.acs.org.
The authors declare no competing financial interest.
Funding Statement
National Institutes of Health, United States
Supplementary Material
References
- Dobson C. M. Nature 2003, 426, 884–890. [DOI] [PubMed] [Google Scholar]
- Makarava N.; Baskakov I. V. J. Biol. Chem. 2008, 283, 15988–15996. [DOI] [PMC free article] [PubMed] [Google Scholar]
- Goldsbury C. S.; Wirtz S.; Muller S. A.; Sunderji S.; Wicki P.; Aebi U.; Frey P. J. Struct. Biol. 2000, 130, 217–231. [DOI] [PubMed] [Google Scholar]
- Dische F. E.; Wernstedt C.; Westermark G. T.; Westermark P.; Pepys M. B.; Rennie J. A.; Gilbey S. G.; Watkins P. J. Diabetologia 1988, 31, 158–161. [DOI] [PubMed] [Google Scholar]
- Chiti F.; Dobson C. M. Annu. Rev. Biochem. 2006, 75, 333–366. [DOI] [PubMed] [Google Scholar]
- Dobson C. M. Trends Biochem. Sci. 1999, 24, 329–332. [DOI] [PubMed] [Google Scholar]
- Jansen R.; Grudzielanek S.; Dzwolak W.; Winter R. J. Mol. Biol. 2004, 338, 203–206. [DOI] [PubMed] [Google Scholar]
- Jimenez J. L.; Nettleton E. J.; Bouchard M.; Robinson C. V.; Dobson C. M.; Saibil H. R. Proc. Natl. Acad. Sci. U.S.A. 2002, 99, 9196–9201. [DOI] [PMC free article] [PubMed] [Google Scholar]
- Bauer H. H.; Aebi U.; Haner M.; Hermann R.; Muller M.; Merkle H. P. J. Struct. Biol. 1995, 115, 1–15. [DOI] [PubMed] [Google Scholar]
- Goldsbury C. S.; Cooper G. J.; Goldie K. N.; Muller S. A.; Saafi E. L.; Gruijters W. T.; Misur M. P.; Engel A.; Aebi U.; Kistler J. J. Struct. Biol. 1997, 119, 17–27. [DOI] [PubMed] [Google Scholar]
- Cardoso I.; Goldsbury C. S.; Muller S. A.; Olivieri V.; Wirtz S.; Damas A. M.; Aebi U.; Saraiva M. J. J. Mol. Biol. 2002, 317, 683–695. [DOI] [PubMed] [Google Scholar]
- Anderson M.; Bocharova O. V.; Makarava N.; Breydo L.; Salnikov V. V.; Baskakov I. V. J. Mol. Biol. 2006, 358, 580–596. [DOI] [PubMed] [Google Scholar]
- Paravastu A. K.; Leapman R. D.; Yau W. M.; Tycko R. Proc. Natl. Acad. Sci. U.S.A. 2008, 105, 18349–18354. [DOI] [PMC free article] [PubMed] [Google Scholar]
- Wischik C. M.; Novak M.; Thogersen H. C.; Edwards P. C.; Runswick M. J.; Jakes R.; Walker J. E.; Milstein C.; Roth M.; Klug A. Proc. Natl. Acad. Sci. U.S.A. 1988, 85, 4506–4510. [DOI] [PMC free article] [PubMed] [Google Scholar]
- Luhrs T.; Ritter C.; Adrian M.; Riek-Loher D.; Bohrmann B.; Dobeli H.; Schubert D.; Riek R. Proc. Natl. Acad. Sci. U.S.A. 2005, 102, 17342–17347. [DOI] [PMC free article] [PubMed] [Google Scholar]
- Adamcik J.; Mezzenga R. Soft Matter 2011, 7, 5437–5443. [Google Scholar]
- Petkova A. T.; Leapman R. D.; Guo Z.; Yau W.-M.; Mattson M. P.; Tycko R. Science 2005, 307, 262–265. [DOI] [PubMed] [Google Scholar]
- Dzwolak W.; Pecul M. FEBS Lett. 2005, 579, 6601–6603. [DOI] [PubMed] [Google Scholar]
- Dzwolak W.; Loksztejn A.; Galinska-Rakoczy A.; Adachi R.; Goto Y.; Rupnicki L. J. Am. Chem. Soc. 2007, 129, 7517–7522. [DOI] [PubMed] [Google Scholar]
- Loksztejn A.; Dzwolak W. J. Mol. Biol. 2008, 379, 9–16. [DOI] [PubMed] [Google Scholar]
- Nafie L. A.Vibrational Optical Activity: Principles and Applications; Wiley: Chichester, U.K., 2011. [Google Scholar]
- Ma S.; Cao X.; Mak M.; Sadik A.; Walkner C.; Freedman T. B.; Lednev I. K.; Dukor R. K.; Nafie L. A. J. Am. Chem. Soc. 2007, 129, 12364–12365. [DOI] [PubMed] [Google Scholar]
- Kurouski D.; Lombardi R. A.; Dukor R. K.; Lednev I. K.; Nafie L. A. Chem. Commun. 2010, 46, 7154–7156. [DOI] [PubMed] [Google Scholar]
- Kurouski D.; Dukor R.; Lu X.; Nafie L. A.; Lednev I. K. Biophys. J. 2012, 103, 522–531. [DOI] [PMC free article] [PubMed] [Google Scholar]
- Kurouski D.; Dukor R. K.; Lu X.; Nafie L. A.; Lednev I. K. Chem. Commun. 2012, 48, 2837–2839. [DOI] [PMC free article] [PubMed] [Google Scholar]
- Shashilov V.; Xu M.; Ermolenkov V. V.; Fredriksen L.; Lednev I. K. J. Am. Chem. Soc. 2007, 129, 6972–6973. [DOI] [PubMed] [Google Scholar]
- Xu M.; Ermolenkov V. V.; He W.; Uversky V. N.; Fredriksen L.; Lednev I. K. Biopolymers 2005, 79, 58–61. [DOI] [PubMed] [Google Scholar]
- Xu M.; Ermolenkov V. V.; Uversky V. N.; Lednev I. K. J. Biophotonics 2008, 1, 215–229. [DOI] [PubMed] [Google Scholar]
- Jackson M.; Mantsch H. H. Crit. Rev. Biochem. Mol. Biol. 1995, 30, 95–120. [DOI] [PubMed] [Google Scholar]
- Rubin N.; Perugia E.; Goldschmidt M.; Fridkin M.; Addadi L. J. Am. Chem. Soc. 2008, 130, 4602–4603. [DOI] [PubMed] [Google Scholar]
- Lara C.; Adamcik J.; Jordens S.; Mezzenga R. Biomacromolecules 2011, 12, 1868–1875. [DOI] [PubMed] [Google Scholar]
- Rubin N.; Perugia E.; Wolf S. G.; Klein E.; Fridkin M.; Addadi L. J. Am. Chem. Soc. 2010, 132, 4242–4248. [DOI] [PubMed] [Google Scholar]
- Lednev I. K. In Protein Structures, Methods in Protein Structures and Stability Analysis; Uversky V. N., Permyakov E. A., Eds.; Nova Sci.: New York, 2007; pp 1–26. [Google Scholar]
- Arnaud C. Chem. Eng. News 2009, 87, 10–14. [Google Scholar]
- Xu M.; Shashilov V.; Lednev I. K. J. Am. Chem. Soc. 2007, 129, 11002–11003. [DOI] [PubMed] [Google Scholar]
- Shashilov V. A.; Lednev I. K. J. Am. Chem. Soc. 2008, 130, 309–317. [DOI] [PubMed] [Google Scholar]
- Sikirzhytski V.; Topilina N. I.; Higashiya S.; Welch J. T.; Lednev I. K. J. Am. Chem. Soc. 2008, 130, 5852–5853. [DOI] [PubMed] [Google Scholar]
- Olapedo S. A..; Xiong K.; Hong Z.; Asher S. A.; Handen J.; Lednev I. K. Chem. Rev. 2012, 112, 2604–2628. [DOI] [PMC free article] [PubMed] [Google Scholar]
- Shashilov V. A.; Sikirzhytski V.; Popova L. A.; Lednev I. K. Methods 2010, 52, 23–37. [DOI] [PubMed] [Google Scholar]
- Shashilov V. A.; Lednev I. K. Chem. Rev. 2010, 110, 5692–5713. [DOI] [PubMed] [Google Scholar]
- Permyakov E. A.Alpha-lactalbumin; Nova Sci., New York, 2005. [Google Scholar]
- Redfield C.; Schulman B. A.; Milhollen M. A.; Kim P. S.; Dobson C. M. Nat. Struct. Biol. 1999, 6, 948–952. [DOI] [PubMed] [Google Scholar]
- Kataoka M.; Kuwajima K.; Tokunaga F.; Goto Y. Protein Sci. 1997, 6, 422–430. [DOI] [PMC free article] [PubMed] [Google Scholar]
- Kuwajima K. FASEB J. 1996, 10, 102–109. [DOI] [PubMed] [Google Scholar]
- Goers J.; Permyakov S. E.; Permyakov E. A.; Uversky V. N.; Fink A. L. Biochemistry 2002, 41, 12546–12551. [DOI] [PubMed] [Google Scholar]
- Kurouski D.; Lauro W.; Lednev I. K. Chem. Commun. 2010, 46, 4249–4251. [DOI] [PubMed] [Google Scholar]
- Kurouski D.; Lednev I. K. Int. J. Biomed. Nanosci. Nanotechnol. 2011, 2, 167–176. [DOI] [PMC free article] [PubMed] [Google Scholar]
- Sabate R.; Baxa U.; Benkemoun L.; Sanchez de Groot N.; Coulary-Salin B.; Maddelein M. L.; Malato L.; Ventura S.; Steven A. C.; Saupe S. J. J. Mol. Biol. 2007, 370, 768–783. [DOI] [PubMed] [Google Scholar]
- Mizuno N.; Baxa U.; Steven A. C. Proc. Natl. Acad. Sci. U.S.A. 2011, 108, 3252–3257. [DOI] [PMC free article] [PubMed] [Google Scholar]
- Sen A.; Baxa U.; Simon M. N.; Wall J. S.; Sabate R.; Saupe S. J.; Steven A. C. J. Biol. Chem. 2007, 282, 5545–5550. [DOI] [PubMed] [Google Scholar]
- Wasmer C.; Lange A.; Van Melckebeke H.; Siemer A. B.; Riek R.; Meier B. H. Science 2008, 319, 1523–1526. [DOI] [PubMed] [Google Scholar]; Kajava A. V.; Seven A. C. Adv. Protein Sci. 2006, 73, 55–96. [DOI] [PubMed] [Google Scholar]
- Benkemoun L.; Sabate R.; Malato L.; Dos Reis S.; Dalstra H.; Saupe S. J.; Maddelein M. L. Methods 2006, 39, 61–67. [DOI] [PubMed] [Google Scholar]
- Nazabal A.; Maddelein M. L.; Bonneu M.; Saupe S. J.; Schmitter J. M. J. Biol. Chem. 2005, 280, 13220–13228. [DOI] [PubMed] [Google Scholar]
- Lednev I. K.; Ermolenkov V. V.; Higashiya S.; Popova L. A.; Topilina N. I.; Welch J. T. Biophys. J. 2006, 91, 3805–3818. [DOI] [PMC free article] [PubMed] [Google Scholar]
- Damas A. M.; Saraiva M. J. J. Struct. Biol. 2000, 130, 290–299. [DOI] [PubMed] [Google Scholar]
- Gustavsson A.; Engstrom U.; Westermark P. Biochem. Biophys. Res. Commun. 1991, 175, 1159–1164. [DOI] [PubMed] [Google Scholar]
- Jaroniec C. P.; MacPhee C. E.; Bajaj V. S.; McMahon M. T.; Dobson C. M.; Griffin R. G. Proc. Natl. Acad. Sci. U.S.A. 2004, 101, 711–716. [DOI] [PMC free article] [PubMed] [Google Scholar]
- Jaroniec C. P.; MacPhee C. E.; Astrof N. S.; Dobson C. M.; Griffin R. G. Proc. Natl. Acad. Sci. U.S.A. 2002, 99, 16748–16753. [DOI] [PMC free article] [PubMed] [Google Scholar]
- Kurouski D.; Kar K.; Wetzel R.; Dukor R. K.; Lednev I. K.; Nafie L. A. FEBS Lett. 2013, 587, 1638–1643. [DOI] [PMC free article] [PubMed] [Google Scholar]
- Smith J. F.; Knowles T. P.; Dobson C. M.; Macphee C. E.; Welland M. E. Proc. Natl. Acad. Sci. U.S.A. 2006, 103, 15806–15811. [DOI] [PMC free article] [PubMed] [Google Scholar]
- Sun Y.; Makarava N.; Lee C. I.; Laksanalamai P.; Robb F. T.; Baskakov I. V. J. Mol. Biol. 2008, 376, 1155–1167. [DOI] [PMC free article] [PubMed] [Google Scholar]
- Khurana R.; Ionescu-Zanetti C.; Pope M.; Li J.; Nielson L.; Ramirez-Alvarado M.; Regan L.; Fink A. L.; Carter S. A. Biophys. J. 2003, 85, 1135–1144. [DOI] [PMC free article] [PubMed] [Google Scholar]
- Measey T. J.; Schweitzer-Stenner R. J. Am. Chem. Soc. 2010, 133, 1066–1076. [DOI] [PubMed] [Google Scholar]
- Welch W. R. W.; Kubelka J.; Keiderling T. A. J. Phys. Chem. B 2013, 117, 10343–10358. [DOI] [PubMed] [Google Scholar]
- Welch W. R. W.; Kubelka J.; Keiderling T. A. J. Phys. Chem. B 2013, 117, 10359–10369. [DOI] [PubMed] [Google Scholar]
Associated Data
This section collects any data citations, data availability statements, or supplementary materials included in this article.