Abstract
Objective
This study investigated whether plasma adropin concentrations are influenced by sleep restriction and correlate with dietary preferences.
Design and Methods
Plasma adropin concentrations were measured by ELISA using samples from a study that investigated feeding behavior in sleep deprived lean (body mass index 22–26 kg/m2) men and women aged 30–45 y. Sleep (habitual or restricted to 4h/night) and diet were controlled during a 4-day inpatient period. On day 5, food was self-selected (FS). Adropin was measured on day 4 in samples collected throughout the day, and then after an overnight fast at 0730 on days 5 (Pre-FS) and 6 (Post-FS).
Results
Plasma adropin concentrations were not affected by sleep restriction. However, circulating adropin concentrations correlated with food selection preferences in women, irrespective of sleep status. Pre-FS adropin correlated positively with fat intake (total fat, r=0.867, P<0.05; saturated fat, r=0.959, P<0.01) and negatively with carbohydrate intake (r=−0.894, P<0.05) as a percent total energy. Post-FS adropin correlated with total (r=0.797, P<0.05) and saturated fat intake (r=0.945, P<0.01), and negative with total carbohydrate intake (r=−0.929, P<0.01). Pre-FS adropin also correlated with fat intake in kcal adjusted for body size (total fat, r=0.852, P<0.05; saturated fat, r=0.927, P<0.01).
Conclusions
Plasma adropin concentrations correlate with fat consumption in women.
Key terms: Dietary fat, dietary intake, energy balance, endocrinology, hormones
Introduction
Adropin is a peptide hormone whose coding sequence is highly conserved in the genomes of eutheria, the mammalian clade that includes primates and other species with the true placenta (1, 2). While the exact functions of this hormone are not known, recent analysis of the concentration of adropin in human plasma suggests roles related to metabolic homeostasis and cardiovascular function (2–7). We reported a decline in the concentration of adropin in plasma with aging, while also observing a negative correlation between plasma adropin concentrations and fasting triglycerides (5). In that study we also observed higher adropin concentrations in males relative to females, and that the concentration of adropin in plasma of males exhibits a negative relationship with BMI. Another laboratory has observed low plasma adropin concentrations in women diagnosed with gestational diabetes mellitus (3). The same laboratory reported a correlation between low plasma adropin concentrations and cardiac syndrome X (angina with decreased blood flow to the heart) in middle-aged men and woman (4). Plasma adropin concentrations may also provide an indication of vascular injury and endothelial dysfunction in children with obstructive sleep apnea (8).
Results from studies using mouse models are consistent with the functions of adropin being important for metabolic homeostasis and endothelial function. Adropin therapy improves endothelial function in a mouse model of ischemia (7). Reduced plasma adropin concentrations are associated with insulin resistance, impaired fasting glucose, impaired glucose tolerance and dyslipidemia (1, 2).Circulating adropin concentrations in mice are regulated by food intake and dietary macronutrients, further suggesting functios related to metabolic homeostasis. Specifically, fasting suppresses while feeding rapidly increases adropin concentration in the circulation; this pattern of regulation is also observed for the expression of the adropin transcript in the liver which is thought to be the primary source of circulating adropin (1, 2). In mice fed ad libitum, a high-fat diet has a more pronounced stimulatory effect on expression when compared to a diet with low-fat and high carbohydrate content (1, 2).
Here we report the outcomes of an investigation of plasma adropin concentrations in frozen samples collected from individuals subjected to sleep restriction (9, 10). Sleep restriction alters the circulating concentration of hormones involved in appetite regulation and metabolic homeostasis (9, 11–13), while reduced sleep has been reported to increase food intake (10, 14–16). In some studies, sleep deprivation rapidly induced a state of insulin resistance (12, 17). These and other observations suggest that sleep deprivation is a risk factor for weight gain, a response possibly involving changes in the hormonal milieu that governs appetite and metabolic homeostasis. The original objectives of the experiment from which plasma samples were obtained was to investigate whether short term sleep restriction alters energy balance (10) and hormones and metabolites (9). The main study outcomes originally reported were increased energy consumption, primarily due to intake of fat with sleep restriction (10) and sex-specific change on gut hormones known to regulate ingestive behaviors (9). The use of these samples thus allowed us to investigate whether plasma adropin concentrations are altered by sleep restricted, a stressor that may increase the risk of obesity through effecting changes in caloric intake. As energy intake and food preferences were also measured in this study (10), we were also able to investigate whether plasma adropin concentrations correlate with or are affected by energy intake and the intake of dietary macronutrients. We find that sleep restriction has no significant effects on plasma adropin concentrations. However, we report finding a significant correlation between plasma adropin concentrations and fat consumption, and saturated fat intake in particular.
METHODS AND PROCEDURES
Sleep restriction
The original study from which these samples were taken has been published (9, 10). The study involving 15 men and women aged between 30 and 45 years and with a body mass index (BMI) of 22 to 26 kg/m2 was approved by the Institutional Review Boards of St Luke’s/Roosevelt Hospital Center and Columbia University. For this study, fresh never thawed samples were available for 11 men and 12 women.
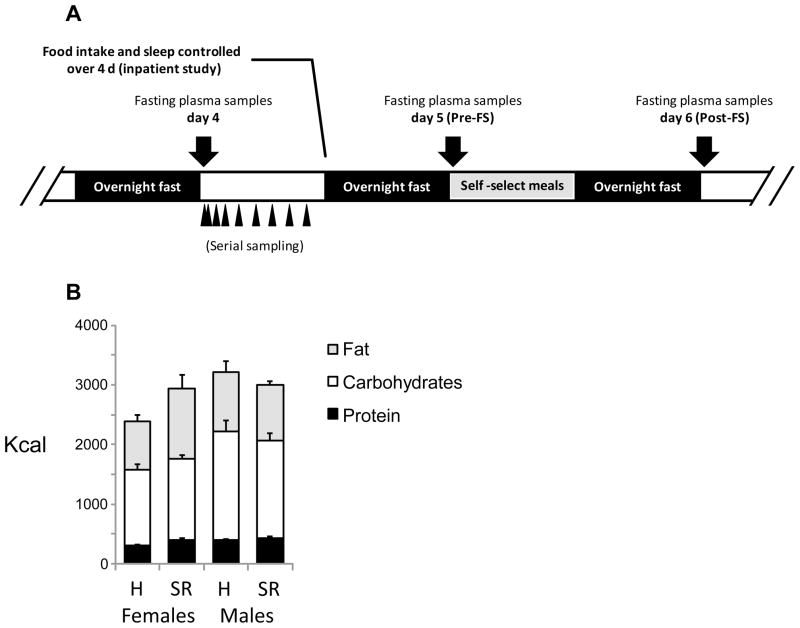
A schematic of the study design is shown in Fig. 1A. The study involved a randomized cross-over inpatient design with two phases. The inpatient nature of the study allowed for the control of food intake and sleep. Food intake was initially controlled during the first 4 days of each inpatient phase, during which the participants were allowed to sleep between 2200 h and 0700 h (habitual sleep), or between 0100 and 0500 h (sleep restriction). Each study phase was separated by 28 days. All participants had been screened prior to enrollment with selection for habitual sleep duration of 7–9 h/night. This was verified over a 2-week period with the use of actigraphy and sleep diaries. During the controlled feeding portion of the study, meals were provided at 08:00, 12:00 and 19:00 h; each meal provided 30% of estimated daily energy requirements. The other 10% was provided as a snack at 1600h. The diet contained 30% energy from fat, 55% from carbohydrates and 15% from protein and was designed to maintain energy balance. On day 4, EDTA-plasma samples were collected at 0800, 0815, 830, 0900 and every 2 h thereafter from 1000 until 0730 the next morning.
Figure 1.
Schematic of the experimental protocol (A) and food intake data during habitual (H) or sleep restriction (SR) (B). The volunteers participated in a 4 day inpatient study where diet, sleep and food intake were controlled. Serial sampling of plasma occurred on day 4. Fasting samples were collected on morning of day 5 prior to individuals given the opportunity of food selection (Pre-FS) and on day 6 (Post-FS). The impact of sleep was assessed using a randomized crossover design; in the following panels short sleep data is shown with open symbols while habitual sleep data is shown with grey-shaded symbols. Also shown are the intakes of energy in the form of protein, carbohydrates or fat expressed as kcal (B) during habitual and sleep deprivation.
On day 5, fasting blood samples were drawn at 07:30 and participants were then allowed to self-select their food intake. Food was available at the research center. In addition, the study participants were also provided a $25 allowance to purchase foods of their liking from a local grocery store. The macronutrient composition of the meals selected by each individual was analyzed using Diet Analysis Plus Software version 8.0 (Wadsworth, Florence, KY). Another fasting blood sample was drawn at 0730 on day 6. Details of energy expenditure measurements using doubly-labeled water and results of food intake and energy expenditure data were described previously (10).
Plasma measurements
Descriptions of the validation of this assay for measurement of adropin concentrations in human plasma, including an analysis of inter and intra-assay coefficients of variation, were published previously (2, 5). The current study used fresh (never thawed) plasma samples. Plasma adropin concentrations were measured in the samples collected serially on day 4 in women (n=12), and in samples collected at 0730 on the morning after an overnight fast on day 5 (Pre-FS) and day 6 (Post-FS) in men (n=11) and women (n=12). Within each arm of the study (i.e., in samples collected after restricted or habitual sleep), it was sometimes not possible to use samples from the same individuals. Plasma adropin concentrations were measured using a commercially available ELISA (Peninsula Laboratories, Bachem, San Carlos, CA).
Statistical analysis
Statistical analysis used IBM SPSS version 21. The effects of sleep restriction were assessed using analysis of variance with adropin concentrations adjusted using BMI and age as covariates. To examine correlations between circulating adropin concentrations and diet self selection we performed a partial correlation that adjusted for sleep condition, body weight and race. We then repeated the analysis for each sex. With the randomized cross-over design of the original study, some data were from the same individual in restricted or habitual sleep conditions. Unless stated otherwise, data presented in the text, tables and figures are mean ± SEM. Statistical significance was defined as P<0.05
RESULTS
Physical characteristics and food intake
The physical characteristics (weight, BMI, age and race) of the participants for whom fresh plasma samples were available (11 men, 12 women) are shown in Table 1. Energy intake in kcal on the test day after 4 nights of habitual or sleep restriction are also shown in Fig. 1B. Note that the food intake data shown in Fig. 1B are from the subset of participants from the previous study for whom sufficient plasma was available for measurement of adropin concentration. In the published analysis using all participants (10), sleep restriction was associated with a trend for an increase in fat consumption, with a larger effect in women (by 39%) compared to men (by 10%). Intake of saturated fat was increased by 62% in women and 10% in men following sleep restriction. For the participants used in this study, sleep restriction was associated with increases in total energy intake (24%), fat consumption (44%) and saturated fat consumption (78%) in women (Fig. 1B and data not shown), with no differences observed in men.
Table 1.
Physical characteristics (mean ± SD) of the study participants.
| Males (n=11) | Females (n=12) | |
|---|---|---|
|
| ||
| Weight (lb) | 168 ± 21 | 138 ± 12 ** |
| BMI (kg/m2) | 24.4 ± 1.5 | 23.1 ± 1.3 * |
| Age (y) | 37.3 ± 5.6 | 34.2 ± 4.2 |
| Race | 6 white, 2 hispanic, 3 black | 5 white, 4 hispanic, 2 black, 1 other |
Significant effect of gender,
P<0.05;
P<0.001
Sleep restriction has no effect on plasma adropin concentrations
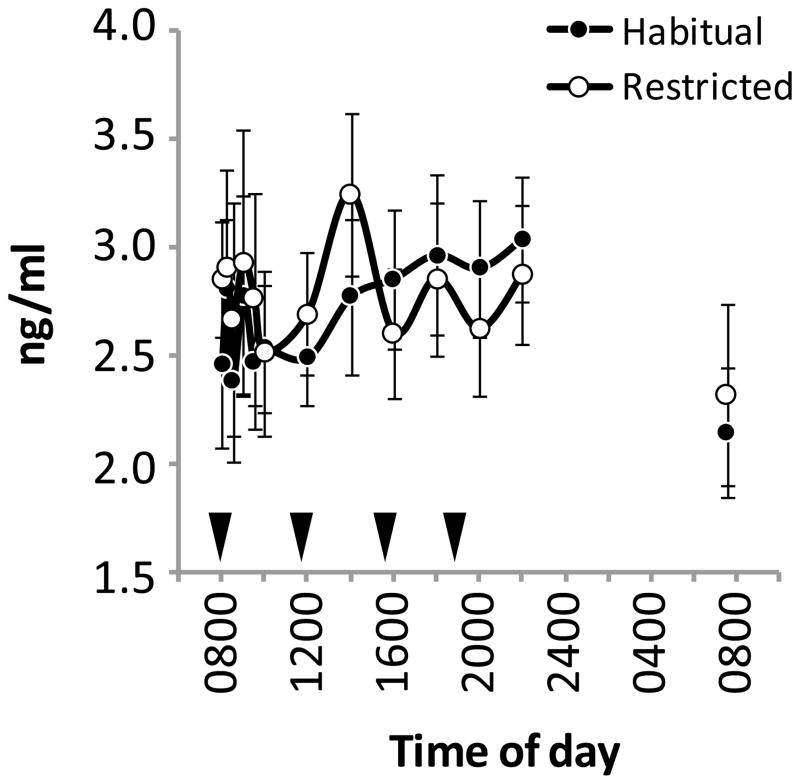
Sleep restriction had no significant effect on the concentrations of plasma adropin measured in samples collected from females on day 4 (Figure 2). Fasting plasma adropin concentrations on days 5 and 6 in men and women were also not significantly affected by sleep restriction (Table 2).
Figure 2.
Plasma adropin concentrations on day 4 of the inpatient study. Plasma adropin concentrations were measured in samples collected serially over a twenty-four hour period. These samples were from females subjected to restricted sleep or allowed to adhere to normal (habitual) sleep patterns. The black triangles indicate meal times (breakfast at 0800, lunch at 1200, afternoon snack at 1600, and dinner and 1800 h).
Table 2.
Fasting plasma adropin concentrations (mean ± SE) on days 5 and 6.
| Day | Habitual | Sleep restricted | |
|---|---|---|---|
|
| |||
| Males | 5 | 1.6 ± 0.3 | 1.3 ± 0.2 |
| 6 | 1.9 ± 0.2 | 2.0 ± 0.2 | |
|
| |||
| Females | 5 | 2.0 ± 0.3 | 2.1 ± 0.3 |
| 6 | 1.9 ± 0.2 | 1.4 ± 0.3 | |
Plasma adropin concentrations correlate with fat intake
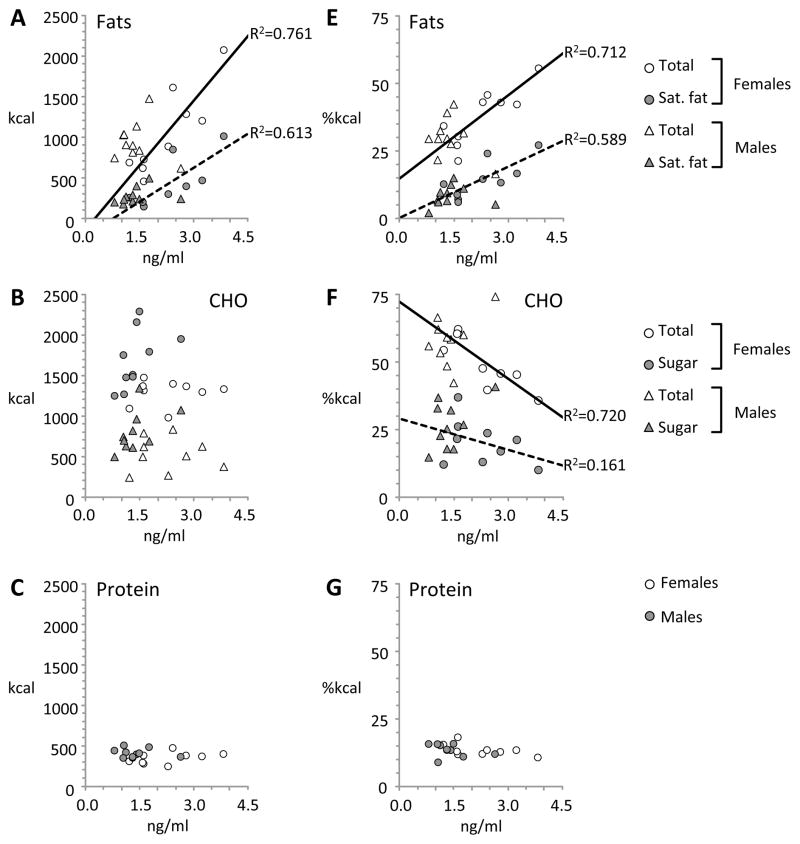
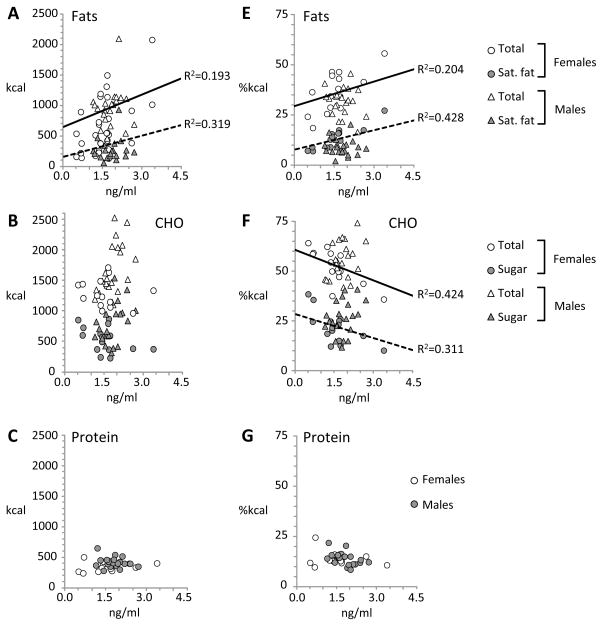
The assess whether diet influences the concentration of adropin in plasma, we performed a partial correlation analysis controlling for race, sleep and body weight that compared Pre-FS and Post-FS adropin concentrations with the macronutrient composition of the self-selected diet on day 5 (Table 3). Our initial hypothesis was that adropin concentrations in plasma on the day after self-selection (Post-FS, or day 6 of the study) would correlate with fat intake measured on day 5. However, we observed significant correlations between plasma adropin concentrations measured on day 5 (Pre-FS) and day 6 (Post-FS) and fat intake (Table 3, Fig. 3A, 4A) in women, but not in men. There was no significant correlation between plasma adropin concentrations on either day with intake of carbohydrate (total or sugar, Fig. 3B, 4B) or protein (Fig. 3C, 4C).
Table 3.
Correlations (r) between plasma adropin concentrations and food preferences controlling for race and sleep status. The analysis of kcal intake also controlled for body weight.
| As kcal (controlling for body weight, race and sleep) | As % of total energy intake (controlling for race and sleep) | ||||||||||
|---|---|---|---|---|---|---|---|---|---|---|---|
| Prot. | Carb. | Sugar | Fat | Sat. Fat | Total | Prot. | Carb. | Sugar | Fat | Sat. fat | |
| Males and Females | |||||||||||
| Pre-FS (day 5) | 0.246 | −0.030 | 0.251 | 0.852* | 0.927** | 0.680 | −0.269 | −0.894** | −0417 | 0.867* | 0.959** |
| Post-FS (day 6) | 0.441 | −0.266 | 0.034 | 0.715 | 0.842* | 0.519 | −0.024 | −0.929** | −0.629 | 0.797* | 0.945** |
| Females | |||||||||||
| Pre-FS (day 5) | 0.246 | −0.030 | 0.251 | 0.852* | 0.927** | 0.680 | −0.269 | −0.894** | −0.417 | 0.867* | 0.959** |
| Post-FS (day 6) | 0.441 | −0.266 | 0.034 | 0.715 | 0.842* | 0.519 | −0.024 | −0.929** | −0.629 | 0.797* | 0.945** |
| Males | |||||||||||
| Pre-FS (day 5) | 0.427 | −0.039 | 0.171 | 0.186 | 0.290 | 0.149 | 0.141 | 0.051 | 0.050 | −0.081 | 0.131 |
| Post-FS (day 6) | −0.098 | 0.462 | 0.447 | 0.410 | 0.392 | 0.486 | −0.425 | 0.195 | 0.247 | −0.040 | 0.191 |
P<0.05;
P<0.01.
Figure 3.
Scatterplots showing correlations between fasting plasma adropin concentrations on day 5 (Pre-FS) and food intake. The values on the x-axis are fasting plasma adropin concentrations measured in samples collected at 0730 on day 5. The values on the Y-axis indicate intakes of fat (A,E), carbohydrate (CHO) (B,F) and protein (C, G) expressed as calories (A–C) or percent of total energy (E–G). Food preference data was collected on day 5 in habitual or sleep restricted conditions.
Figure 4.
Scatterplots showing correlations between fasting plasma adropin concentrations on day 6 (Post-FS) with day 5 intakes of fat (A,E), carbohydrate (CHO) (B,F) and protein (C, G) as calories (A–C) or percent of total energy (E–G). Food intake data was collected on day 5 in habitual or sleep restricted conditions.
We next assessed whether plasma adropin concentrations would correlate with macronutrient selection expressed as a percent of total energy intake. Significant correlations were observed between Pre- and Post-FS adropin concentrations and fat intake in women, but not in men (Table 3, Fig. 3E, 4E). Perhaps resulting from the increased intake of fat calories, there was a significant negative correlation between Pre- and Post-FS adropin and carbohydrate intake as a percent of total energy (Fig. 3F, 4F). Protein intake as a percent of total energy did not correlate with plasma adropin concentrations on either day (Fig. 3G, 4G).
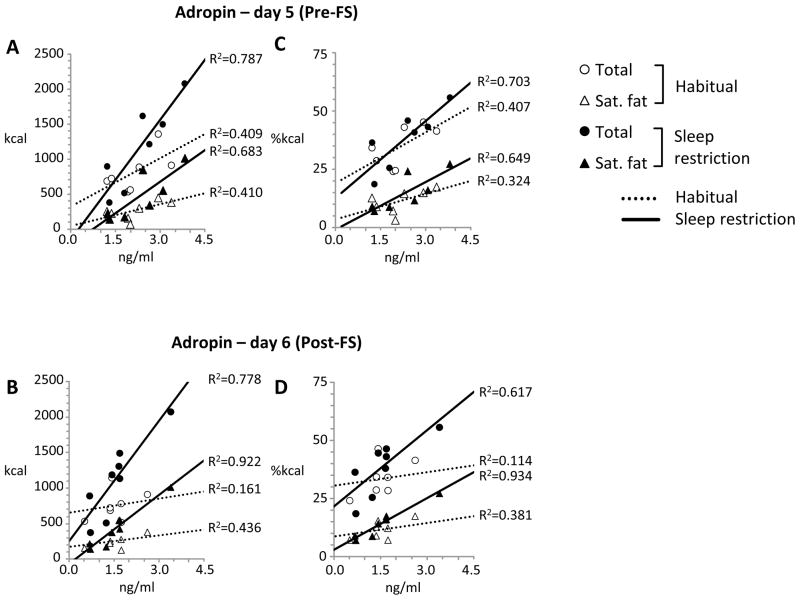
Sleep restriction may have influenced food preferences and energy intake in women (10) (Fig. 1B). We therefore repeated the analysis in women, examining the associations between plasma adropin concentrations and macronutrient selection during habitual or sleep restriction separately. Significant correlations between plasma adropin concentrations on days 5 and 6 and fat intake (total and saturated) were observed in both situations in females (Fig. 5). While there was a positive correlation between plasma adropin concentrations and total energy intake, this did not achieve statistical significance (Table 3).
Figure 5.
Scatterplots showing the correlations in women between fasting plasma adropin concentrations on day 5 (A, C) and day 6 (B, D) with measures of fat intake on day 5 during habitual (open symbols, solid trendlines ) or after sleep restriction (black symbols, broken trendlines). The data shown are for total fat intake (circles) or saturated fat (triangles) in kcal (A,B) or as a percent of total energy (C, D).
DISCUSSION
This study had two primary objectives. The initial objective was to investigate whether sleep restriction, an intervention previously shown to produce changes in ingestive behaviors conducive to obesity, would also produce changes in plasma adropin concentrations. Sleep restriction had been previously reported in this group of volunteers to alter feeding behavior, increasing energy intake primarily through the consumption of more fat calories (10). A change in the profile of endocrine hormones known to regulate metabolism was also observed, with gender-specific effects of sleep restriction on the plasma concentrations of total ghrelin (increased in men but not women) and glucagon-like peptide-1 (reduced in women but not men) (9). While other studies observed that sleep restriction caused insulin resistance, this outcome was not observed in the present study from which these samples were taken (9). Sleep restriction did not significantly affect plasma adropin concentrations, suggesting that reduced sleep per se does not produce changes in adropin concentrations in plasma.
Whether plasma adropin concentrations would have exhibited changes in situations where an intervention such as sleep restriction causes insulin resistance is not clear. However, it is worth noting that a recent study reported a reduction in plasma adropin concentrations in children with sleep apnea that was reversed by tonsillectomy (8), while we have observed an increase in plasma adropin concentrations following Roux-en-Y gastric bypass in severely obese subjects (5). The results from these studies suggest that plasma adropin concentrations can change in response to interventions that alter vascular and metabolic control.
The second objective was to investigate whether food selection preferences measured as part of the original study would correlate with plasma adropin concentrations. This approach was possible due to the collection of food-self selection data on day 5 of the study (10). We observed that plasma adropin concentrations correlated with self-selection of foods with a high fat content, and particularly in saturated fat. The correlations were robust; the relationship was evident in plasma samples taken prior to (i.e., on the morning of day 5 when food self-selection data was collected) or on morning of day 6, which was the day after food self-selection was recorded. While sleep restriction may strengthen or augment the association in women (cf. Fig 5), significant correlations were nevertheless observed when data collected during habitual and sleep restricted phases of the study executed weeks apart were analyzed separately. While further studies using larger cohorts are required, this is a significant finding as it suggests a link between the concentrations of adropin in the circulation with fat consumption.
It is important to note that, in this study, the participants were in slight negative energy balance during the 4 days of controlled feeding and lost a small amount of weight (approximately 2 lbs) (9). It is therefore possible that the combination of negative energy balance and sleep restriction altered dietary preferences. Moreover, the increased consumption of energy-dense diets with high fat content might have been an attempt to restore energy balance. However, sleep restriction did not affect energy expenditure per se in this group (10).
Previous studies examining the regulation of metabolic homeostasis by adropin in mice using pharmacological and genetic interventions found no evidence for the regulation of food intake by adropin (1, 2). Synthetic adropin does not affect food intake in male mice when administered peripherally or centrally ((1); Rossi J and Butler AA unpublished data). Male and female transgenic mice over expressing adropin did not exhibit increased food intake when fed a high fat diet, and in fact resisted diet-induced obesity (1). However, diet effects on plasma adropin concentrations have been observed in male mice. Specifically, studies comparing adropin expression and circulating concentrations in male mice fed diets with high fat/low carbohydrate or low fat/high carbohydrate content observed higher concentrations in the former (1, 2). Collectively, these observations are not consistent with adropin concentrations regulating food preferences. However, they are consistent with circulating adropin concentrations correlating with fat intake. Moreover, they suggest that adropin may have an as yet to be defined role in maintaining metabolic homeostasis in situations where fat intake in increased. Indeed, adropin knockout mice exhibit a more pronounced impaired glucose homeostasis (impaired fasting glucose, hyperinsulinemia, impaired glucose tolerance) when challenged with high fat diets (2).
When analyzed separately, significant correlations between adropin concentrations and food preferences were limited to women. However, it may be premature to rule out a similar a correlation existing between circulating adropin concentrations and food choices in men. Inclusion of men in the analysis did not weaken the associations. Moreover, the range of adropin values in the male participants of this study was low (0.8 to 2.6 ng/ml versus 1.2 to 3.8 ng/ml for females) when compared to previous measurements. We have observed that circulating adropin concentrations are higher in men when compared to women, with values as high as 10 ng/ml (5). Future studies comparing food preference in lean healthy men with a wide range of circulating adropin are needed to determine whether similar associations occur.
One caveat to concluding that food preferences are influencing plasma adropin concentrations, and not vice versa, is that food intake was controlled during the inpatient study. Thus the participants had consumed the same foods in the four days prior to the measurements of plasma adropin and food preference. It may be that plasma adropin concentrations are not influenced by short term diet effects. However, it is not possible at this time to state that plasma adropin concentrations are not influencing food choices. Further studies are needed to investigate whether changes in the diet can influence plasma adropin concentrations.
In summary, the results of this study suggest a link between plasma adropin concentrations and intake of fat calories in humans. Further studies analyzing the interaction between dietary macronutrients and plasma adropin concentrations are warranted to investigate whether adropin regulates orosensory perception of dietary macronutrient content, or is regulated by signals of macronutrient consumption.
What is already known about the subject?
Adropin is a peptide hormone linked to metabolic homeostasis and cardiovascular function
Studies in mice indicates regulation by dietary macronutrients
What this study adds
In humans, plasma adropin concentrations correlate with total fat intake (kJ) and with intake of saturated fat in females
When expressed as % of total energy, plasma adropin concentrations correlated positively with fat and negatively with carbohydrate intake in females
Plasma adropin concentrations may correlate with fat intake in females
Acknowledgments
MPSO and AAB conceived the experiment, performed the analysis and wrote/reviewed/edited the manuscript. AR, JS, SG and NHR contributed to data collection. CST performed some of the assays, analyzed data and contributed to manuscript preparation. JS and SG reviewed the manuscript. ER participated in study design, discussions of data interpretation and provided materials. AAB coordinated activity between research sites and had the primary responsibility for writing the manuscript.
We acknowledge the contributions of Amy Roberts, the Clinical Coordinator for this study, and the efforts of Zalak Trivedi, Jennifer Ahn, Andrew McReynolds, and Michael Kelleman.
This research was supported by a Proof of Principle award from The Novo Nordisk Diabetes Innovation Award Program (to AAB) and R01 DK060412 (ER). MPSO acknowledges the support of National Institutes of Health grants #1R01HL091352-01A1, 1R01HL091352-01S1, 1 UL1 RR024156-03, and P30 DK-26687.
Footnotes
Conflicts of interest
Competing interests: the authors have no competing interests.
References
- 1.Kumar KG, Trevaskis JL, Lam DD, et al. Identification of adropin as a secreted factor linking dietary macronutrient intake with energy homeostasis and lipid metabolism. Cell Metab. 2008;8:468–81. doi: 10.1016/j.cmet.2008.10.011. [DOI] [PMC free article] [PubMed] [Google Scholar]
- 2.Ganesh Kumar K, Zhang J, Gao S, et al. Adropin deficiency is associated with increased adiposity and insulin resistance. Obesity (Silver Spring) 2012;20:1394–402. doi: 10.1038/oby.2012.31. [DOI] [PMC free article] [PubMed] [Google Scholar]
- 3.Celik E, Yilmaz E, Celik O, et al. Maternal and fetal adropin levels in gestational diabetes mellitus. Journal of perinatal medicine. 2013:1–6. doi: 10.1515/jpm-2012-0227. [DOI] [PubMed] [Google Scholar]
- 4.Celik A, Balin M, Kobat MA, et al. Deficiency of a New Protein Associated with Cardiac Syndrome X; Called Adropin. Cardiovasc Ther. 2013 doi: 10.1111/1755-5922.12025. [DOI] [PubMed] [Google Scholar]
- 5.Butler AA, Tam CS, Stanhope KL, et al. Low circulating adropin concentrations with obesity and aging correlate with risk factors for metabolic disease and increase after gastric bypass surgery in humans. J Clin Endocrinol Metab. 2012;97:3783–91. doi: 10.1210/jc.2012-2194. [DOI] [PMC free article] [PubMed] [Google Scholar]
- 6.Lian W, Gu X, Qin Y, Zheng X. Elevated plasma levels of adropin in heart failure patients. Intern Med. 2011;50:1523–7. doi: 10.2169/internalmedicine.50.5163. [DOI] [PubMed] [Google Scholar]
- 7.Lovren F, Pan Y, Quan A, et al. Adropin is a novel regulator of endothelial function. Circulation. 2010;122:S185–92. doi: 10.1161/CIRCULATIONAHA.109.931782. [DOI] [PubMed] [Google Scholar]
- 8.Gozal D, Kheirandish-Gozal L, Bhattacharjee R, Molero-Ramirez H, Tan HL, Bandla HP. Circulating Adropin Concentrations in Pediatric Obstructive Sleep Apnea: Potential Relevance to Endothelial Function. J Pediatr. 2013 doi: 10.1016/j.jpeds.2013.05.040. [DOI] [PMC free article] [PubMed] [Google Scholar]
- 9.St-Onge MP, O’Keeffe M, Roberts AL, RoyChoudhury A, Laferrere B. Short sleep duration, glucose dysregulation and hormonal regulation of appetite in men and women. Sleep. 2012;35:1503–10. doi: 10.5665/sleep.2198. [DOI] [PMC free article] [PubMed] [Google Scholar]
- 10.St-Onge MP, Roberts AL, Chen J, et al. Short sleep duration increases energy intakes but does not change energy expenditure in normal-weight individuals. Am J Clin Nutr. 2011;94:410–6. doi: 10.3945/ajcn.111.013904. [DOI] [PMC free article] [PubMed] [Google Scholar]
- 11.Spiegel K, Tasali E, Penev P, Van Cauter E. Brief communication: Sleep curtailment in healthy young men is associated with decreased leptin levels, elevated ghrelin levels, and increased hunger and appetite. Ann Intern Med. 2004;141:846–50. doi: 10.7326/0003-4819-141-11-200412070-00008. [DOI] [PubMed] [Google Scholar]
- 12.Spiegel K, Leproult R, L’Hermite-Baleriaux M, Copinschi G, Penev PD, Van Cauter E. Leptin levels are dependent on sleep duration: relationships with sympathovagal balance, carbohydrate regulation, cortisol, and thyrotropin. J Clin Endocrinol Metab. 2004;89:5762–71. doi: 10.1210/jc.2004-1003. [DOI] [PubMed] [Google Scholar]
- 13.Schmid SM, Hallschmid M, Jauch-Chara K, Born J, Schultes B. A single night of sleep deprivation increases ghrelin levels and feelings of hunger in normal-weight healthy men. Journal of sleep research. 2008;17:331–4. doi: 10.1111/j.1365-2869.2008.00662.x. [DOI] [PubMed] [Google Scholar]
- 14.Brondel L, Romer MA, Nougues PM, Touyarou P, Davenne D. Acute partial sleep deprivation increases food intake in healthy men. Am J Clin Nutr. 2010;91:1550–9. doi: 10.3945/ajcn.2009.28523. [DOI] [PubMed] [Google Scholar]
- 15.Nedeltcheva AV, Kilkus JM, Imperial J, Kasza K, Schoeller DA, Penev PD. Sleep curtailment is accompanied by increased intake of calories from snacks. Am J Clin Nutr. 2009;89:126–33. doi: 10.3945/ajcn.2008.26574. [DOI] [PMC free article] [PubMed] [Google Scholar]
- 16.Bosy-Westphal A, Hinrichs S, Jauch-Chara K, et al. Influence of partial sleep deprivation on energy balance and insulin sensitivity in healthy women. Obesity facts. 2008;1:266–73. doi: 10.1159/000158874. [DOI] [PMC free article] [PubMed] [Google Scholar]
- 17.Spiegel K, Leproult R, Van Cauter E. Impact of sleep debt on metabolic and endocrine function. Lancet. 1999;354:1435–9. doi: 10.1016/S0140-6736(99)01376-8. [DOI] [PubMed] [Google Scholar]


