

1. Introduction
Genetic information flows from DNA to RNA to protein. DNA is transcribed to yield messenger RNAs (the coding RNA), RNAs required for protein synthesis (ribosomal RNAs and transfer RNAs), and non-coding RNAs that often have regulatory functions (ncRNAs, including microRNAs, siRNAs, piRNAs,1 and others). Translation of messenger RNAs (mRNAs) produces the proteins that characterize the structures and functions of all organisms from bacteria to humans. At the core of the translation machinery is the ribosome, a macromolecular complex comprised of over 50 proteins and three ribosomal RNAs with a molecular weight of 2.5 MD for bacteria and 4.3 MD for humans.2 The ribosome cooperates with auxiliary species to ensure accurate and highly regulated translation. These species include initiation factors, elongation factors, transfer RNAs with attached amino acids, as well as release and recycling factors.3,4
In this review we will describe the application of single-molecule approaches to study the translation of mRNA by single ribosomes, focusing on mechanical manipulation with optical tweezers. Single-molecule methods have distinct advantages over traditional ensemble (or bulk) experiments in identifying the molecular mechanisms underlying this complex biological process. This has particularly important implications for elucidating the kinetics of processive molecular machines, such as ribosomes. The kinetics contain abundant information about how molecular machines act in a coordinated fashion to accomplish a complicated task, such as deciphering a nucleic acid sequence and synthesizing the encoded protein. However, kinetics are governed by stochastic processes; thus, each molecule in a reaction takes a different amount of time to react. It is impossible to maintain synchronicity over several steps of a sequential reaction. At any time in an ensemble reaction of many molecules, there will be reactants, products, and all the intermediates. For a large number of ribosomes that start translating a particular mRNA at the same time, some will be decoding the first codon while others are reading the second, third, fourth, etc. In contrast, at any time in a single-molecule reaction there is only one species. The characteristics of each single species can be determined.
Optical tweezers have been used to study translation by a single ribosome on one mRNA. In the first published study, constant force was applied to the 3’- and 5’-ends of a harping RNA.5 As the ribosome translated the hairpin, double strand RNA was converted to single strands, thus increasing the end-to-end distance of the RNA molecule. The increase in distance directly measures the translocation of the ribosome. In a subsequent set of experiments, force is applied to either the 3’- or 5-end of the RNA while holding on to the ribosome. This geometry allows studying the ribosome as a motor under assisting force or opposing force as it moves along its track (the mRNA). A third geometry has been developed in which force is applied across the nascent polypeptide. This experimental setup will allow synthesis of the translation product to be monitored.
1.1 The Machinery of Translation
High resolution structures of the ribosomal subunits6-12 as well as the 70S ribosome13 have been obtained by X-ray diffraction around the year 2000. A thorough review (with over 80 references) of the structural aspects of the functions of the ribosome is given at the Nobel Prize 2009 website (http://www.nobelprize.org/nobel_prizes/chemistry/laureates/2009/advanced.html). Further details are described by each Nobelist in their published Nobel lectures.14-16 The structures of bacterial ribosomes complexed with mRNAs, tRNAs, initiation, elongation, and release factors, and antibiotics are presented. More recent atomic resolution structures include a 3.0 Å structure of a yeast eukaryotic ribosome,17-19 the human and Drosophila 80S ribosome 20, release factor 2 and 3 bound to a bacterial ribosome,21-23 and EF-G bound to the ribosome.24-27
Cryo-electron microscopy, cryo-EM, provides further information about different states of the ribosome and its interactions with external factors.28-31 Structural information of many of the auxiliary species, free and bound to the ribosome are now available: initiation factors, eIF1;32 elongation factors, EF-G,33,34 EF-Tu,35-39, as well as release and recycling factors.40-43
1.2 The Mechanism of Translation
In this review, we will concentrate on translation by bacterial ribosomes. While initiation and termination of translation differ considerably between eukaryotes and bacteria, the elongation phase of translation seems to be very similar across all kingdoms. It involves decoding of the message, mediated by aminoacylated tRNAs and EF-Tu (eEF-1 in eukaryotes), forming the peptide bond between the new amino acid and the nascent peptide, followed by translocation along the mRNA template, catalyzed by EF-G (eEF-2 in eukaryotes). A messenger RNA is read in units of three nucleotides—one codon—at a time, beginning at the AUG start codon and ending at one of three stop codons (UAA, UAG, UGA). Transfer RNAs (tRNAs)—adapter molecules that interpret the three-nucleotide codons as amino acids—contain an anticodon loop complementary to the codon, and the cognate amino acid attached to its 3’-end. The correct coupling of the tRNA containing a particular anticodon loop with the proper amino acid is achieved by aminoacyl tRNA synthetases with remarkable specificity, providing the basis for translational fidelity.44 Errors in translation occur mainly because of mispairing between the tRNA anticodon and the mRNA codon.
A bacterial ribosome is composed of two subunits, 30S and 50S; a high-resolution structure with bound transfer RNAs is shown in Figure 1 (see reference 45). mRNA binding and codon-anticodon base pairing takes place in the small, 30S, subunit. The large subunit, 50S, is the site of the peptidyl transferase center where the peptide bonds in the protein are made. One of the fundamental insights gained from the high-resolution structure of the ribosome was the confirmation that this reaction is catalyzed by the ribosomal RNA and thus, that the ribosome is a ribozyme, whose catalytic activity is mainly the property of the ribosomal RNA, not the ribosomal proteins.
Figure 1. Structure of the 70 ribosome.
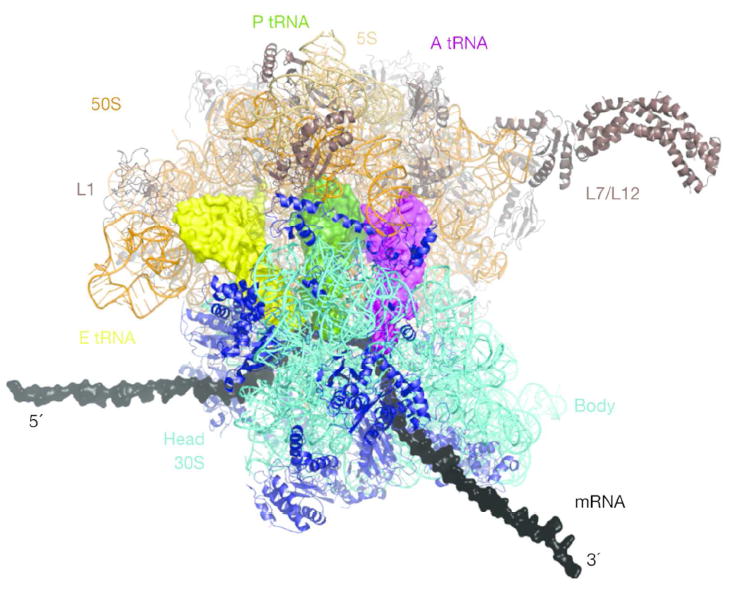
‘Top’ view of the ribosome. Ribosomal RNA and proteins are shown in ribbon representation, A-, P- and E-site tRNAs are in surface representation (in purple, green and yellow, respectively). The mRNA (grey) is elongated by modeling, the L7/L12 stalk was fit onto the 70S structure. Figure from Schmeing and Ramakrishnan (Reprinted with permission from ref. 45)
The ribosome has three binding sites for the tRNAs: in the A site, the tRNA carrying the next amino acid is selected as determined by the mRNA codon; the P site harbors the peptidyl tRNA, i.e. the translation product covalently bound to the tRNA; the E site is the exit site for the deacylated tRNA after transfer of the nascent polypeptide to the next tRNA. Two elongation factors, proteins that are not integral components of the ribosome, are required for efficient translation. They are both GTPases whose catalytic activity is controlled by the ribosome. Elongation factor EF-Tu binds an aminoacylated tRNA (aa-tRNA) and GTP to form the ternary complex, which can bind to the ribosome A site. If the anticodon of the tRNA is complementary to the mRNA codon at the site, GTP is hydrolyzed and the aa-tRNA is accommodated in the A site. The peptide of length N on the P-site tRNA is rapidly transferred to the aa-tRNA to form an N+1 length peptide catalyzed by the peptidyl transferase center of the ribosome. The next step is the translocation of the tRNAs and mRNA by three nucleotides relative to the ribosome. The deacylated tRNA at the P site moves to the E site and exits. The A site tRNA carrying the nascent protein moves to the P site, leaving the A site ready for the next tRNA to interpret the codon now at this site. Translocation is catalyzed by elongation factor G (EF-G). Binding of EF-G to the ribosome is followed by hydrolysis of its bound GTP, then release of GDP, inorganic phosphate, and EF-G. At the end of this cycle, two molecules of GTPs have been hydrolyzed, the ribosome has synthesized a peptide bond, it has advanced on the mRNA by one codon, and is ready for the next elongation cycle.
The source of energy for translation has not been conclusively identified. Aminoacyl tRNAs can be accommodated in the A site without EF-Tu, and translocation can occur, although very slowly, without EF-G. The free energy release on formation of the peptide bond itself is also a possible source of energy that drives elongation. The reaction is shown in Figure 2; the net result is that one peptide bond (in the nascent protein) has been formed, and one ester bond (to the 3’-hydroxyl of a ribose) has been broken. A very rough estimate of the net change in Gibbs free energy for this reaction at pH 7, 25°C yields ΔG° = -3.7 ± 1.2 kcal/mol.46 The value was obtained by comparing data on the hydrolysis of amino acid esters and amides.47
Figure 2. Peptide bond formation.
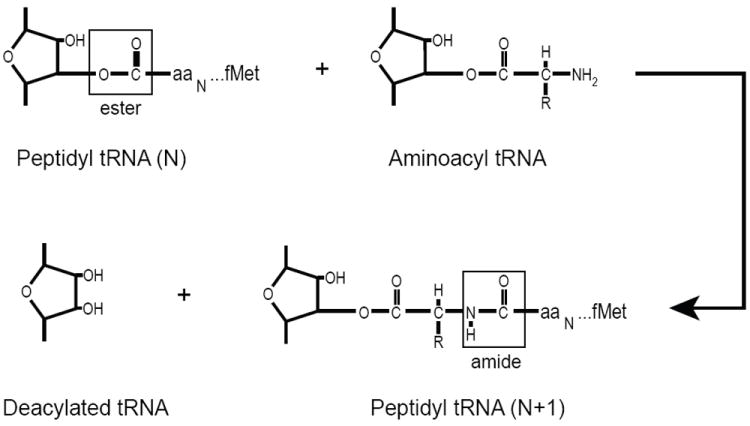
A nascent chain of N amino acids attached via an ester bond to the tRNA in the ribosome P site is transferred to the amino-terminal of the A site tRNA. A peptide bond is formed increasing the length of the nascent chain to N + 1, and leaving a deacylated tRNA. The net reaction is thus breaking an ester bond and forming a peptide bond.
It is difficult to rationalize how the chemical energy release caused by GTP hydrolysis in EF-Tu, or the free energy difference between a peptide and an ester bond, could be stored in the ribosome and used later to catalyze translocation. However, each step in translation involves intra-subunit, or inter-subunit conformational changes. In principal, any of theses changes could store energy that is released at a following step, providing a conceivable mechanism of harnessing the energy released by peptide bond formation for translocation. A more direct coupling between GTP hydrolysis and mechanical motion could occur during catalysis of translocation by EF-G.
Sixty-one codons including AUG designate twenty amino acids: arginine and leucine use six codons each, methionine and tryptophan only one each. Classical biochemical experiments over many years have provided the reaction paths of elongation, including their thermodynamics and kinetics.48-57 However, bulk experiments can not determine a complete step-by-step mechanism by which the ribosome synthesizes a protein. In order to learn the positions and interactions of the ribosome, the mRNA, the tRNAs, and the many factors, during each step of translation, single-molecule methods are necessary. We will describe here how single-molecule force spectroscopy methods have been (and will be) used to better understand translation. Fluorescence-based single-molecule methods have the same advantages over bulk methods as force methods. Single-molecule fluorescence resonance energy transfer, smFRET, in particular has revealed very valuable information about translation. However, we will limit our in-depth review to applications of force and refer the reader to several recent reviews that comprehensively cover this topic.58-61
2. Single-Molecule Methods
Several books describing single-molecule methods applied to biological molecules with a wide range of functions, in vitro and in vivo, are available.62-65 The great advantage of studying a single molecule at a time is that molecular characteristics are not lost by averaging over the properties of more than 1010 molecules. We study biological molecules in solution, so when we observe one molecule, it is interacting with water, ions, and other solutes. Interactions that are fast compared to the resolution time of the measurement (such as binding of ions) are averaged, but slower binding events will show the property of the molecule switching between ligand-bound and ligand-free. Similarly, conformational changes will be seen as an average conformation, or as a hopping between two conformations dependent on the kinetics. For reactions with many components and many steps, such as translation, single-molecule methods have tremendous advantages over ensemble averages. They allow observation of a single step in a succession of steps in the reaction. Because kinetics are stochastic; we can not know when a reaction will occur. This means that in a reaction of many identical molecules the single step we want to study will occur at a different time for each molecule.
For example, we can measure the dwell time that a ribosome spends at a specific codon. If we repeat the experiment 200 times under identical conditions, we will get a distribution of dwell times that may look as shown in Figure 3a (containing simulated data), if we assume that the dwell times depend on one rate-determining step. A wide range of dwell times are measured from less than 0.2 s to 5 s. The histogram is fit well by a single exponential; the probability density, P(τ) is
| (Eq. 1) |
with a mean dwell time <τ> = 1.08 s, and thus an ensemble rate constant of k = 1/< τ > = 0.924 s-1 for a specific codon in a messenger RNA. In an ensemble of ribosomes we could not measure the dwell time at a particular codon unless it was the first one in the process. The ribosomes could be synchronized to start together, but they would rapidly lose coherence because each ribosome would spend a different time at the first codon. The effect of rapidly losing synchronicity over repeated steps that are each governed by single-exponential kinetics is illustrated in Figure 3b. Elongation rates along a given mRNA are not uniform, but each codon is translated at a particular rate that depends on the abundance of the available cognate tRNA and on the sequence context. A codon speed profile for a hypothetical mRNA is displayed in the histogram in Figure 3b, containing two regions of slowly translated codons (highlighted by red arrows). If we were able to watch a single ribosome translocate along this mRNA, we would clearly observe longer dwell times (pauses) in these regions. If we were simultaneously watching a hundred individual ribosomes that begin translation at the same time (blue traces), the ensemble average (black line) would perhaps reflect the first “slow” region, but not the second one, because synchronicity is lost at this point.
Figure 3. Stochasticity of elongation kinetics.
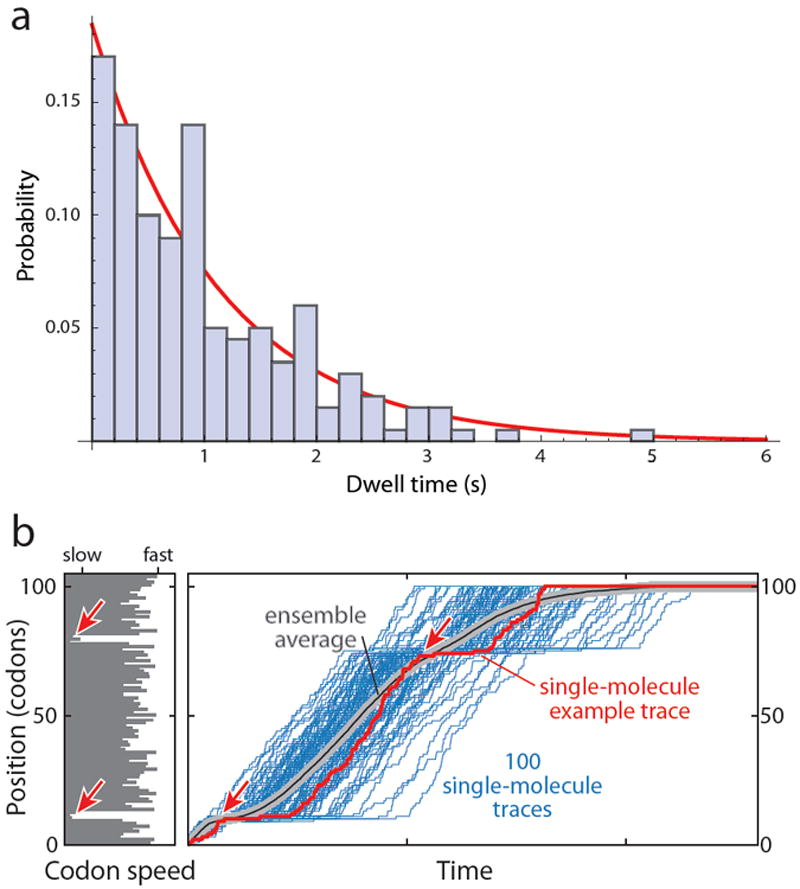
a. Histogram of the probability density of a simulated exponential distribution of 200 dwell times calculated for a mean dwell time of 1.0 s. The probability density is the fraction of dwell times in each bin divided by the width of the bin, here 0.2 s. The calculated mean was 1.03 s and the mean from the exponential fit (red line) was 1.08 s. The distribution exhibits a large range of dwell times around the mean, ranging from less than 0.2 s to 5 s. b. Loss of synchronicity in an ensemble. The left panel shows the codon speed profile of a hypothetical mRNA in the form of a bar diagram: The length of each bar represents the mean dwell time at each codon, which could be determined by the abundance of the cognate tRNA as well as the sequence context. The red arrows highlight two regions of slowly translated codons with long dwell times. The right panel displays simulated traces (blue) that would result from the observation of 100 individual ribosomes stepping along this mRNA (with one trace highlighted in red). Long pauses are observed in the region of slowly translated codons (red arrows). However, because each dwell time is drawn from an exponential distribution around the mean dwell time at the respective codon, synchronicity among the 100 ribosomes is rapidly lost, and the pause around codon position 80 is not apparent in the ensemble average (grey/black line). Therefore, even if it was possible to perfectly synchronize and subsequently observe an ensemble of just 100 molecules, the differences in elongation rate along a given mRNA cannot be resolved. Single-molecule measurements provide this capability.
Even with the first codon we learn much more from single-molecule measurements. The shape of the dwell time distribution is much more informative than a single ensemble rate constant. If there are several steps with identical rate constants that characterize the dwell times, the distribution, a Poisson distribution, is no longer exponential 5; it is not maximum at zero time.
| (Eq. 2) |
Here n is an integer that indicates the number of rate determining states and Г(n)—equal (n-1) factorial for integer n—is the Gamma function. For n = 1, Eq. (2) reduces to Eq. (1). The probability density distributions have the following properties:
| (Eq. 3) |
The mean dwell time, <τ>, obtained from fitting the measured dwell times to an exponential or general Poisson equation, should be compared with the mean of the dwell times. For the data in Figure 3a the mean of the 200 dwell times was 1.03 s, consistent with the exponential fit of 1.08 s. If there are two or more rate determining steps with different rate constants, more complicated equations can be derived.5,66
Another example of the unique information obtained by single-molecule methods is illustrated in Figure 4. We show a simulated single-molecule trajectory for the folding of a protein or RNA measured by observing the motion of micron-sized beads attached to the molecule. This method was used in following the folding of a nascent T4 lysozyme attached to a ribosome.67,68 A similar trajectory would be seen if fluorophores were attached to the molecule and fluorescence resonance energy transfer (FRET) was measured. We assume that the mechanism involves an equilibrium between the unfolded state, U, and an intermediate, I, followed by an irreversible step to the native state, N (Figure 4a):
The three rate constants are obtained from the mean life times of U and I, and the branching ratio, r, for species I (r = the number of times I goes to U divided by the number of times it goes to N).
| (Eq. 4a) |
| (Eq. 4b) |
| (Eq. 4c) |
Figure 4. Stochasticity of folding.
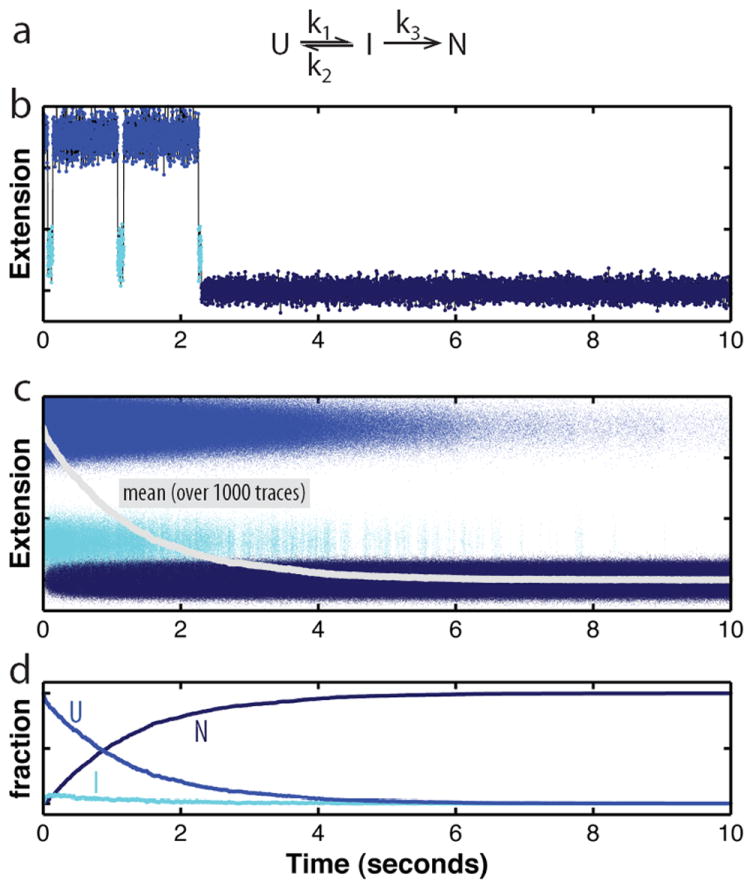
a. Kinetic scheme for a folding reaction consisting of the reversible population of a folding intermediate (I) from the unfolded state (U) prior to folding to the native state (N). I is an obligate, on-pathway intermediate in this scheme. b. Simulated folding trajectory based on the kinetic mechanism in panel a. A molecule hops between the unfolded and an intermediate state before irreversibly folding to the native state, governed by the rate constants indicated in the kinetic scheme. The changes in molecular extension, which can be measured with optical tweezers, reflect transitions between the states. In this single trace, the population of the folding intermediate is easily discernible. Because the dwell times in the individual states are exponentially distributed around the mean (which equals 1/k), the number of transitions between U and I are variable, as is the time required to reach the native state. c. Overlay of 1000 folding trajectories simulated based on the kinetic scheme given in panel a (parameters : k1 = 2.5 s-1, k2 = 20 s-1, k3 = 10 s-1). Even though folding proceeds according to the same rate constants and is initiated at the same time for all traces, the time for folding to the native state varies greatly among the traces. The average (grey line) was reconstructed from the individual traces, but the features of the individual traces cannot be recovered from the average. d. Evolution of the three folding states over time. The plot shows the relative amounts of U, I, and N over time, calculated from the data in panel c.
An ensemble study would have all three species present during the reaction making it difficult to follow the intermediate, and to obtain the rate constants. However, if we followed a single protein molecule that folds through the pathway described above, we would observe it to populate a transient intermediate (Figure 4b). Because of the stochasticity inherent to the folding kinetics, the intermediate is difficult to detect in the ensemble average over just 1000 molecules (black line in Figure 4c), even if we could perfectly synchronize all molecules to begin folding at the same time. Thus, the evolution of the individual species (Figure 4d) can be reconstructed from 1000 individual traces (shown overlaid in Figure 4c), but not from the average.
These examples highlight the usefulness of single-molecule methods in providing information not obtainable otherwise. In principle, every intermediate in a complex reaction can be identified and characterized, as long as it produces a change in signal along the reaction coordinate imposed by the experimental geometry. Rare species in mixtures can be observed. The limitations in detecting rare species or intermediates are the spatial and temporal resolutions of the measurements. Presently, spatial resolution is about 0.1 nm for laser tweezers and temporal resolution is 0.1-1 ms,68 fluorescence measurements can reach a temporal resolution in the μs regime.60
The disadvantages of single-molecule methods mainly stem from the necessity of studying one molecule at a time. The throughput is low; the statistics are poor. It may be difficult to distinguish between intrinsic stochastic variation (for example in lifetimes) from experimental variation. Measurements are difficult and require high, and usually expensive, technology. Mechanical, thermal, and electronic stability of the equipment is important. However, in the near future single-molecule instrumentation should become commercially available, and measurements will be routine. Observations of single molecules in solutions or biological cells have moved from science fiction to reality in a few years.
2.1 Laser Tweezers and Force
In 1970 Arthur Ashkin at the IBM research center in Holmdel, New Jersey, discovered that a focused laser beam could manipulate micron-sized beads in aqueous solution 69. Two counter propagating beams focused at a spot could trap a bead at the center of the spot. Each refracted and scattered beam of light produces a force on the bead toward the center of the beam and in the direction of propagation of the beam. Newton’s second law tells us that the force, F, on the bead is equal and opposite to the change of momentum, p, with time, t, of the light incident on the bead,
| (Eq. 5) |
With counter-propagating beams the force becomes zero at their common focus. The trapped bead acts as if was attached by a Hooke’s law spring to the center of the trap. The restoring force on the bead toward the center of the trap is
| (Eq. 6) |
where x is the distance from the center of the trap and the force constant, κ, is proportional to the beam intensity, the size of the bead, and the difference in refractive indices between the bead and its surrounding. A typical trap stiffness used in studying macromolecules is 0.1 pN/nm;70 this means that forces of less than 0.1 pN can be measured.
Steven Chu, also at IBM, was told by Arthur Ashkin about the ability of trapping neutral particles, including bacteria, by light.71 Chu’s group began manipulating DNA molecules by attaching a bead to the ends of the molecule.72 One of the first application of laser tweezers was measuring the elastic polymer properties of double-stranded B-form DNA.72,73
The construction and calibration of laser tweezers have been described. The first machines held one bead in a laser trap from counterpropagating beams and one bead on a pipette;74 more recently, instrument designs have been developed in which the two beads are held in dual laser traps from one laser to reduce noise.68,75,76 Figure 5 shows different configurations of the instrumentation, including the combination of force and fluorescence in one instrument (Figure 5c) which has recently been achieved.77 Our focus will be on applications of the technology to problems of biological interest, rather than on the technology itself.
Figure 5. Overview of various optical tweezers instruments and their possible applications to studying translational elongation.
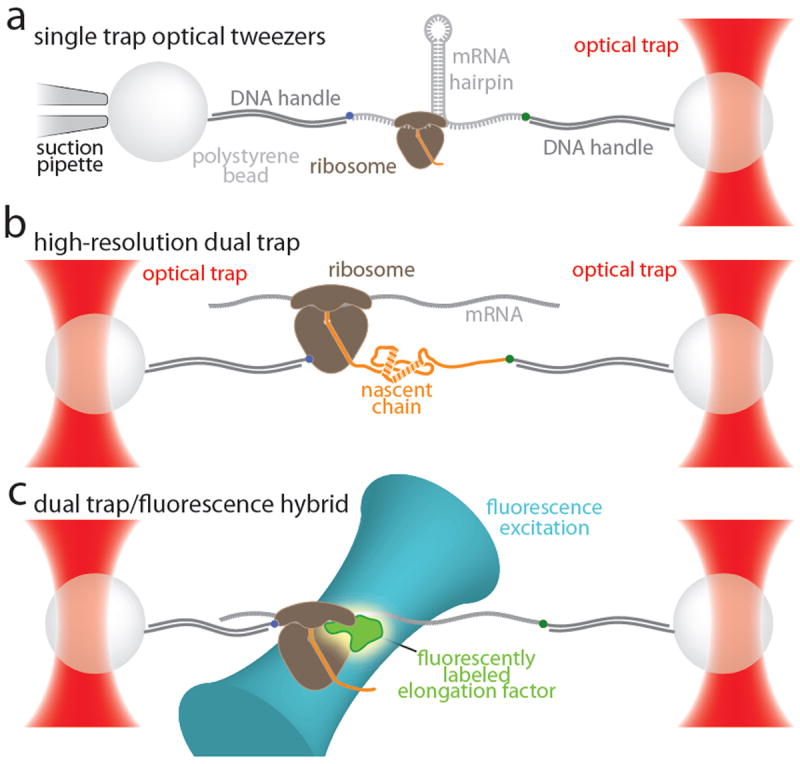
a. Single trap design. The sample is immobilized between two beads. One is held in an optical trap, the other is immobilized on a micro-pipette by suction. In the example shown here, an RNA hairpin is translated by the ribosome. Translocation of the ribosome by one codon results in opening of three base pairs of the hairpin, increasing the length of the RNA by six nucleotides, providing two-fold signal amplification that is intrinsic to this geometry. This geometry has successfully been used to study translation.5,99 Mechanical coupling of the experiment to the environment through the micro-pipette limits the spatial resolution and, perhaps more significantly, the drift stability of this geometry. b. Dual trap design. Both beads are held by optical traps. The traps can be formed by splitting a single laser beam, limiting the effects of fluctuations in laser power. In addition, the experiment is mechanically decoupled from the environment, resulting in superior drift stability. An ultra-stable instrument based on this design 112 can possibly be used to follow elongation of the nascent protein as depicted in the geometry shown here. The resulting signal would be a convolution of nascent chain elongation and folding. b. Hybrid instrument combining mechanical manipulation with single-molecule fluorescence detection. The design for a dual trap instrument that is capable of detecting the fluorescence of a single immobilized molecule between the two beads has recently been published.77 In the geometry suggested in this panel, the ribosome and the 3’-end of the mRNA are attached to beads. Translocation is observed as a stepwise decrease of the molecular extension; binding of exogenously labeled accessory factors is detected by fluorescence emission. This instrument may enable simultaneous measurements of translocation and binding of elongation factors and tRNAs.
2.2 Measurement of Thermodynamics and Kinetics
Force has been shown to be an effective tool for tilting the energy landscapes. Mechanical manipulations with optical tweezers therefore enable perturbations of processes such as the movement of molecular motors or folding of macromolecules, which is very useful for studying both the thermodynamics and the kinetics of the underlying transitions.78,79 In the following sections, we will describe how thermodynamic and kinetic information can be extracted from single-molecule force spectroscopy measurements.
2.2.1 Thermodynamics
Any process that involves a change in distance will be influenced by a force that aids or hinders the change in distance. The mechanical work done by the process is the product of the force and the change in distance.
| (Eq. 7) |
Obviously, if the force remains constant throughout the process,
| (Eq. 7a) |
Force and distance are vectors, therefore we must use the component of force along the direction of the distance change. In any measurable process there will always be some dissipation of energy, for example due to friction. The work of unfolding an RNA 80 or a protein 81 is obtained by attaching beads to the molecule and measuring force and distance between the beads as the beads are pulled apart. The work measured depends on how rapidly we pull the beads. The faster we pull, the more energy is lost to moving the solvent and to other dissipative processes in addition to unfolding the macromolecule. Similarly, the work done by molecular motors, such as a ribosome,82 a helicase,83 or a DNA packaging motor on a phage 84 is measured by applying an opposing force to the direction of motion of the motor. The maximum work the motor can do is determined from the stall force—the force that stops the motor. The efficiency of converting chemical free energy into mechanical energy (work) can be determined.85
Changes in thermodynamic variables of state, such as energy, entropy, enthalpy, and free energy depend only on the initial and final states but not on the path used to get from one state to the other. This is what makes them so useful. We know that we will get the same amount of energy whether we oxidize glucose in a calorimeter or in a bacterium, as long reactants and products are the same in both reactions. The Gibbs free energy change for a process (a reaction) is particularly useful, because it tells us the useful work that can be obtained from the reaction. For example, if the reaction occurs in an electrochemical cell, the Gibbs free energy at constant temperature and pressure tells us the maximum electrical work we can obtain. In an actual electrochemical cell the electrical work will be less because of current flow; the Gibbs free energy is an upper limit of the work.
Standard physical chemistry textbooks86 derive the equation between the Gibbs free energy, ΔG, and work as:
Therefore by measuring the reversible work we obtain ΔG, the Gibbs free energy change. The actual work will always be smaller. In principle, to measure reversible mechanical work, Fdx, the independent variable, x, must be varied infinitely slowly so that the dependent variable, F, stays always in equilibrium. In practice, the variables are changed slowly enough that kinetics do not limit the response. For example, in an unfolding reaction, the distance between attached beads is increased linearly with time and the force is monitored. The speed of pulling is decreased, and when the force vs. distance trajectory is independent of the pulling rate, the integral of force times distance is assumed to be the reversible work. For many reactions the kinetics are so slow that it becomes impractical to keep the reaction at equilibrium during the process. However, novel methods have been derived to obtain equilibrium results from non-equilibrium measurements.
Classical thermodynamics was derived originally for bulk systems, so reversible work was assumed to be measured on a macroscopic system. However, in small systems, such as single molecules, fluctuations in energy and work become important. The second Law of thermodynamics tells us that the average work that can be done by a reaction is equal to, or is less than, the Gibbs free energy change. However, fluctuations in the reaction path can cause the measured work to sometimes, rarely, exceed the free energy change. Jarzynski 87 proved that by repeating the process many times under identical non-equilibrium conditions (such as pulling speed), the value of ΔG can be obtained. He proved that the Boltzmann average of the irreversible work at constant temperature and pressure provides the Gibbs free energy, ΔG.
| (Eq. 8) |
Here w is the measured non-equilibrium work, kB is the Boltzmann constant and T is the absolute temperature. The brackets < > mean average over, in principle, an infinite number of repetitions.88,89 Experimentally, the number of repetitions depends on how far from equilibrium the reaction is done, and useful results can be obtained with an accessible number of repetitions90,91 Another method to obtain ΔG from non-reversible experiments was deduced by Crooks.92,93 The irreversible experiments are done for the forward as well as backward reaction, and histograms are made of the work values. The work value where the histograms for the forward and reverse reactions overlap, or are extrapolated to overlap, is the reversible work. This more intuitive result requires fewer repetitions to obtain the Gibbs free energy,94 but it does require that both forward and reverse reactions be measurable.
2.2.2 Kinetics
The ability to measure kinetics by laser tweezers is limited by how fast the beads attached to the molecule can move. The response of a bead to a perturbation can be characterized by the frequency dependence of motion of the bead. The response of the bead decreases with increasing frequency.95
| (Eq. 9) |
R(f) is the response at frequency f and R0 is the zero-frequency response. The corner frequency or cutoff frequency, fC, is the frequency at which the response is half that at zero frequency. The corner frequency is directly proportional to the trap stiffness, and inversely proportional the bead radius and viscosity of the solvent. A 1 μm radius bead in water in a laser trap of stiffness 0.1 pN/nm has a corner frequency of about 5 kHz.96 The response time of the bead, τB, is (2πfC)-1. This means that lifetimes of the order of 0.1 ms can be measured.
When a single-molecule system is at equilibrium between two states, unless the reactions are too fast or the change in distance between beads too small, we can see hopping back and forth between the two states at constant force. We can obtain the rates of the reactions and the equilibrium constant. An example is shown in Figure 4.
The rate constants are the reciprocals of the mean life times of the states. The equilibrium constant between the two states, K, is
| (Eq. 10) |
where [B]/[A] is the ratio of probabilities that the molecule is in state B or A; it is equal to the ratio of rate constants for the forward and reverse reactions, k1/k2, and ratio of mean lifetimes of the two states, <τB>/<τA>. Thus the equilibrium constant can be determined from the mean lifetime of each state. The difference in distance between states allows us to detect the states; this means that the force applied to the beads must perturb the equilibrium. Increasing force favors the longer molecule. The quantitative expression is
| (Eq. 11) |
K(F) is the equilibrium constant at force F; K(0) is the equilibrium constant at zero force. The value of Δx, the change in distance due to the reaction, which can be positive or negative, depends on where the beads are attached. For nucleic acids the attachment sites are usually the 3’- and 5’-ends; for proteins attachment at the N-terminal and C-terminal are common, but attachment can be at any location. As both force and Δx are vectors, the product FΔx must be taken as their scalar product.
To obtain the standard free energy change for a reaction at zero force, ΔG°(F = 0) from a measured equilibrium constant at force F we use a thermodynamic cycle to obtain:
with kB equal to Boltzmann’s constant and ΔG(x stretch) is the difference in reversible work necessary to stretch molecules B and A to force F.
| (Eq. 12) |
If we choose the force, F1/2, where the equilibrium constant K(F) = 1, the equation simplifies to
| (Eq. 13) |
The effect of force on the rate constants has the same form as Eq. 11.
| (Eq. 14) |
The distance to the transition state is x‡, which can be positive or negative. Thus increasing force speeds the forward reaction going to longer molecules and slows the reverse reaction. The equilibrium distance between states is equal to the difference in transition states for the forward and reverse reactions.
| (Eq. 15) |
The slope of a ln(K) vs. force plot equals Δx/kBT; the plot is linear if Δx is independent of force. Extrapolation to zero force provides the equilibrium constant at zero force. Good agreement has been found between the bulk measured equilibrium constant and the value extrapolated as a function of force for unfolding of an RNA hairpin.70 This agreement is expected, as the equilibrium constant and the free energy difference between two states is independent of path. It does not matter if force is used to reach the equilibrium or not; as long as the same initial and final states are attained, the thermodynamic values are the same. The kinetic data give similar results. The slope of a ln(k) vs. force plot equals x‡/kBT; the plot is linear if x‡ is independent of force. However, extrapolation to zero force does not give the rate constant at zero force. The mechanism for the kinetic reaction is very different in the presence and absence of force. The ratio of extrapolated rate constants can equal the measured bulk equilibrium constant, but the individual rate constants can be very different from the bulk measured rate constants.
2.2.3 Molecular Motors
Molecular motors convert chemical energy into mechanical motion. In general there is a series of steps involving binding of substrates, cofactors, energy sources, etc., and a movement along a track, such as DNA for polymerases and messenger RNA for ribosomes.97 As for any reaction we want to know the complete mechanism; for molecular motors the added question is how the chemical reaction steps are coupled to the motion. A general linear reaction mechanism with four steps can be written as
For a molecular motor, or any single-molecule reaction, the letters represent the probabilities of each species; they are obtained by solving a coupled set of linear differential equations.98 Each step is first order (k has units of s-1), or is pseudo-first order if binding of a ligand is involved in the step (k•concentration has units of s-1 and the concentration of ligand is constant). Some steps are irreversible if the rate constant for the reverse reaction is negligible.
It is convenient to think of each reaction step as having components along a chemical axis and a motion axis.85 A step can be purely chemical, or purely mechanical, or involve both a chemical reaction and a coupled motion. A step that involves motion is identified by its force dependence. Its rate constant will be decreased by an opposing force and increased by an assisting force along the direction of motion. The distance to the transition state for that step is obtained from the slope of ln k vs. force. If an equilibrium constant, K, can be measured for the step, the step size, Δx, is obtained from ln K vs. force. Purely chemical steps are independent of force. An example of a molecular motor that has been thoroughly studied is the motor that packages DNA into the bacteriophage ϕ29 capsid.84
The coupling between chemistry and motion has been characterized as either a power stroke or a Brownian ratchet.85 In a power stroke the chemical reaction directly leads to the motion. The chemical reaction lowers the free energy of the forward state relative to the previous state; a fraction of the Gibbs free energy of the reaction drives the motion. In a Brownian ratchet the motion has a low activation barrier of the order of thermal energy (~0.6 kcal/mol) so the motion is reversible and rapid. The subsequent chemical reaction rectifies the motion; it prevents the motion from going backwards.
The ideal analysis of any single-molecule mechanochemical process would provide the chemical identity and spatial coordinates of each species as a function of time. The process would also be characterized by a potential energy function in a two-dimensional reaction path. One reaction coordinate would be the usual chemical reaction coordinate, the other would be the spatial reaction coordinate specifying the motion of the motor.
3. Translation
Translation encompasses three core phases: initiation, elongation, and termination. In bacteria, initiation starts when initiation factors target formylmethionine-tRNA to an AUG start codon at the ribosome P site. The position of the initiator AUG codon, about eight or nine nucleotides towards the 3’-end from the Shine-Dalgarno sequence, specifies the start of translation. The Shine-Dalgarno sequence, AGGAGG, is complementary to a sequence in the 16S rRNA, the anti-Shine Dalgarno sequence. Base-pairing between the Shine Dalgarno and anti-Shine Dalgarno sequences help to position the ribosome for proper initiation. Elongation starts when elongation factor EF-Tu brings in the next aminoacyl tRNA and GTP (as a ternary complex), and leaves the cognate tRNA at the A site when GTP hydrolysis occurs. The formylmethionine is transferred to the A-site tRNA to form a new peptide bond catalyzed by the ribosomal RNA. Binding of EF-G•GTP catalyzes the translocation of the mRNA and its attached tRNAs by one codon, three nucleotides. The deacylated P-site tRNA moves to the E site, the A-site tRNA moves to the P site, and the A site is available for the next tRNA. This process continues until a stop codon (UAA, UAG, UGA) is reached. Termination occurs when a release factor binds to the stop codon and hydrolyzes the peptide from the P-site tRNA.
3.1 Translation of double-stranded hairpin mRNAs
The motion of the ribosome as it translates an mRNA can be studied by attaching beads to the ends of a hairpin RNA. Pulling on the beads, that is applying force, will unfold the hairpin, producing an abrupt increase in the end-to-end distance of the mRNA when a critical force is reached.70 If the hairpin is held at a force below the critical force, the equilibrium favors the folded form and the hairpin will remain mainly folded. However, as a ribosome translates the RNA, it unfolds the hairpin and increases the end-to-end distance as double strands are converted to a single strand. A hairpin construct was used in the first single-molecule study of translation using laser tweezers.
Wen et al. 5 translated hairpins containing either a mixture of many amino acids, or only valine and glutamic acid. The mRNA was connected to micron-sized polystyrene beads by kbp-long DNA handles containing either biotin or digoxigenin at their ends; one bead had streptavidin attached, the other had antidigoxigenin (Figure 6a). After initiation and the start of elongation in the presence of buffer containing elongation factors, aminoacyl tRNAs, and GTP, the ribosome was stalled on the mRNA by omitting the next aminoacyl tRNA. Once a single stalled complex is held between the two beads, the missing tRNAs are added. Translation is seen as a step-pause-step trajectory (Figure 6b) with the pause occurring while the elongation factor EF-Tu adds the next amino acid, the peptide bond is formed, and EF-G binds. The step identifies the abrupt motion of the ribosome as translocation occurs. The pause times and the translocation times are stochastic as expected; there clearly is a wide range of pause times in the trajectory shown. The size of the steps, however, is constant. This is most easily demonstrated by taking the pairwise distribution of points along all trajectories. A histogram of the distances between each point and every other point is shown in Figure 6c. Peaks are seen corresponding to the distances between pauses; we see peaks at multiples of 2.7 nm. The length per nucleotide for single-stranded RNA depends on the force applied to the ends of the RNA. As the force approaches zero the end-to-end distance of the RNA is very small and the length per nucleotide approaches zero. As the force increases, the end-to-end distance approaches the contour length of the RNA, about 0.59 nm per nucleotide. The trajectory shown was obtained with 20 pN applied to the RNA, this produces 0.45 nm per nucleotide. Thus, each step corresponds to a forward motion of 6 nucleotides; the ribosome translates 3 nucleotides (one codon) and releases 3 other nucleotides from the complementary strand of the hairpin. The entire force vs. end-to-end distance curve for RNA is approximated well by the worm-like-chain model.73
Figure 6. Translation of a hairpin.
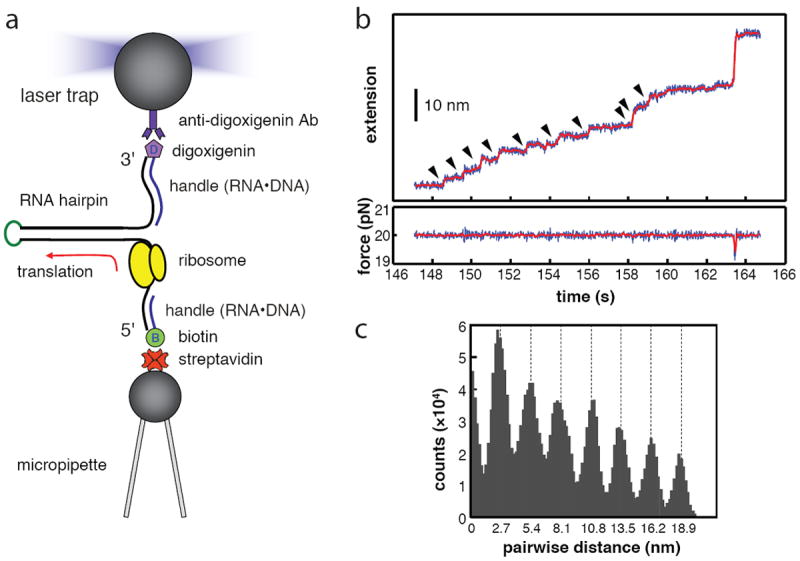
a. A hairpin mRNA is held between two beads. As the ribosomes translates the hairpin the end-to-end distance increases. b. A trajectory of the end-to-end distance (extension) as a function of time at constant force applied to the ends of the mRNA. Discrete steps are seen corresponding to translocation at each codon. c. A histogram of the pairwise distribution of points on the trajectory; the distance between every two points is plotted. The maxima in multiples of 2.7 nm indicate that the step sizes are all equal, and correspond to translocation of the three nucleotides—one codon. The figure contains parts of Figure 1 and 2 from Reference 5. (Adapted with permission from ref. 5. Copyright 2008 Nature Publishing Group)
A significant advantage of single-molecule experiments is their ability to characterize the behavior of a ribosome at each individual codon. The mean dwell time at a given codon will depend on the concentration of the ternary complex containing the cognate tRNA. It can also depend on sequences that are either downstream or upstream of the codon, as we will see shortly. The distribution of dwell times is very informative; it characterizes the number of rate-determining steps that control the pause at each codon. For the valine codons studied by Wen et al. 5 the distribution is not an exponential; it shows that two or more steps are rate determining for the pause at each codon. We know that the biochemistry of the reactions occurs during the pauses in a translation trajectory; two elongation factors are bound, GTP is hydrolyzed, and a peptide bond is formed as a new amino acid is attached to the nascent peptide chain. Not surprisingly, the distribution depends on the concentrations of the soluble species; one of the elongation factors can be made the sole rate limiting factor.66,99
The mean dwell time for a codon at the decoding site on the ribosome depends on the mRNA structure at the entrance tunnel of the ribosome.99 A G•C rich hairpin increases the dwell times more than an A•U rich duplex, because the double strand must be unwound before translation can continue. Similarly, an internal Shine-Dalgarno sequence on the mRNA binds to the 16S ribosomal RNA and slows translation. These barriers to translocation not only modulate the rate of synthesis of proteins, they have a profound effect on the fidelity of translation, particularly frameshifting.100
The measured dwell times for the pauses are in the range of seconds, whereas the translocation times are in the millisecond range. The distribution of translocation times is a single exponential 99 indicating one rate-determining step; the claim that the distribution corresponded to three steps 5 was apparently an artifact of insufficient time resolution in the original experiments. The mean translocation time is independent of concentrations of elongation factors and tRNAs. It seems as if the biochemical steps prepare the ribosome to translocate. This may take several seconds and depends on the kinetics of binding and dissociation of the ligands. However, the actual movement of the ribosome occurs in a single step of a few milliseconds.
Translation of a hairpin mRNA attached to beads and using purified components is slow compared to in vivo translation. The average dwell time on each codon (~2 s) measured by Wen et al. 5 is more than ten times longer than the one based on estimated maximum translation rates in E. coli cells. In vitro bulk studies with soluble components from bacteria (S100 fraction) are also slower, but not as slow as in single-molecule studies. Obviously, many factors control the rate of translation, including ionic composition and concentrations, and the effective concentrations of elongation factors and tRNAs. These conditions have not yet been optimized for speed of translation in the optical tweezers experiments, perhaps explaining the relatively long dwell times observed
3.2 The ribosome as a helicase
Naturally occurring messenger RNAs have extensive double-stranded regions usually in the form of hairpins, typically ten or fewer base pairs in length; pseudoknots of hairpins with connected stems and loops are also present. There do not appear to be external helicases that specifically act on mRNAs, so the ribosome must be able to unwind double strands in order to translate the message. Initiation of translation occurs when the two subunits of the ribosome bind to the mRNA and initiator tRNA, with the help of initiation factors. For translation to occur the mRNA is pulled through a tunnel in the ribosome that is only large enough to accommodate a single strand. Proteins S3, S4, and S5 at the entrance of this tunnel contribute to the helicase activity.101 However, secondary structure in the mRNA slows translation and modulates the rate of synthesis of the encoded protein.102 In the published laser tweezers studies of translation the mRNA is completely double-stranded, so the ribosome must continually act as a helicase in order to translate the message. The force applied to the ends of the hairpin mRNA acts like an equivalent helicase, because it destabilizes the hairpin; as a consequence, increasing force increases the rate of translation. In the studies of Wen et al. 5 on a 274 bp hairpin, translation would sometimes pause for minutes. However increasing the force could restart translation that continued to the end of the double strand. The pauses correlated with the presence of internal Shine Dalgarno sequences in the mRNA. It appears that the combination of the 16S-mRNA double strand of the Shine Dalgarno and the hairpin provided a barrier that the ribosome could not surmount. Weakening the hairpin by force allowed the ribosome to continue translation.
A quantitative study of the helicase abilities of the ribosome was done by Qu et al. 99 The rates of translation of valine residues were measured as a function of force applied to the ends of a hairpin. As shown in Figure 7 the force dependence is sigmoidal with plateaus at low and high force. At low force the ribosome must unwind the double-stranded hairpin stem; the rate is labeled vds. At the high force nearly equal to the critical force where the hairpin unwinds spontaneously, the rate is labeled vss for single strand translation. Two hairpins were studied (Figure 7). The same sequence valine strands were translated, but the hairpin stem was either ~50% G•C or 100% G•C. Unwinding the higher G•C stem decreased the vds rate at low force, but reached the same vss single-strand rate at high force. The experimental translation rates vs. force were fit well by a simple equation.
| (Eq. 15) |
Figure 7. The ribosome as a helicase.
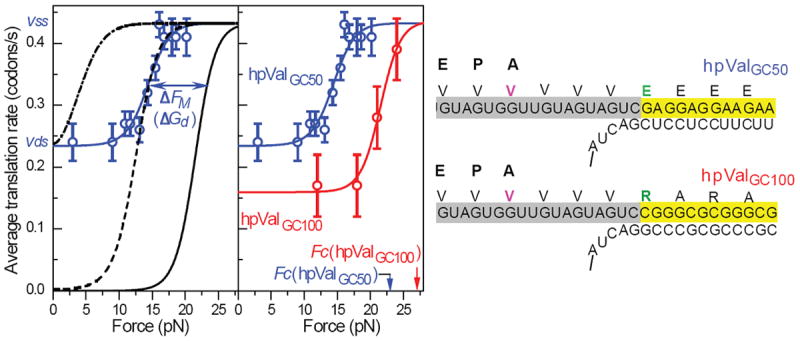
Two mRNAs with identical sequences coding for valine are translated; they differ in the base composition of the double strand that the ribosome must unwind during translation. The rate of translation of each hairpin is measured as a function of force on the ends of the hairpins. At low force the ribosome is unwinding double strands (translation rate = Vds) at a critical force, Fc, the double-stranded helix becomes single-stranded and the rate of translation corresponds to a single strand, (Vss). The solid lines are a fit to Eq. 15. The figure is a modified form of Figure 2 from Reference 99. (Adapted with permission from ref. 99. Copyright 2011 Nature Publishing Group)
The probability that the junction of the stem at the entrance to the ribosome is open is fopen. It depends on force, the free energy needed to break each base pair, and the number of base pairs opened—here three. The translation rates are νss = ν(fopen = 1) for a single strand and νds = ν(fopen = 0) for a double strand. The probability, fopen, was calculated from the following expression:
| (Eq. 16) |
The free energy values are ΔGbp, the free energy of breaking the base pairs, ΔGF, the free energy contribution of the force to opening the duplex, and ΔGD, the destabilization of the duplex by the ribosome. The nearest-neighbor approximation for base pair free energies 103 was used for ΔGbp. The worm-like chain model 73 provided the effect of force on unwinding the duplex, ΔGF. The values of three variables (ΔGD, νss, and νds) were chosen to give the best least squares fit to the two force-dependent curves. The fit is good and provides a helix destabilization value for the ribosome of ΔGD = 0.9 kcal/mol. This is within the range found for other helicases, such as HIV-1 reverse transcriptase and T7 DNA helicase. However, the ribosome is different from these helicases in that it uses two paths to move forward on the mRNA. It can wait for the double-stranded junction to open, or it can directly open the junction. The two paths are characterized by νss and νds.
3.3 The ribosome as a molecular motor
Molecular motors such as the ribosome can be helped or hindered by force applied along the direction of motion. By attaching one bead to the ribosome and one bead to the 3’-end of an mRNA, the force dependence of the elongation rate was measured in a “tug of war” geometry under opposing force.46 The rate decreased exponentially with force and was essentially zero at an applied force of 13 pN. This stall force represents the maximum force the ribosome can exert while moving along the mRNA. The maximum (mechanical) work exerted by the ribosome is given as the product of the stall force and the step size, which is three nucleotides (1.7 nm), yielding 13 pN · 1.7 nm = 22.1 pN nm, equal to 3.2 kcal/mol of work. This maximum work done must be less than the decrease in Gibbs free energy available from the chemical processes in the reaction. Intriguingly, the free energy difference between peptide bond hydrolysis (in the translation product) and ester bond hydrolysis (in the aminoacyl-tRNA) is estimated to be ~-3.7 kcal/mol under the experimental conditions, providing enough chemical energy to fuel translocation, if the ribosome is 80% efficient as a molecular motor. Thus, translocation might be driven by transpeptidation as the sole energy source. However, as described above, it is difficult to envisage how the energy released in forming the peptide bond could be stored, and used in translocation. A more direct source of free energy is the hydrolysis of GTP by ribosome-bound EF-G, as EF-G interacts with the A site and actively favors translocation.104
A similar geometry has been used to probe the mechanical stability of the ribosome-mRNA complex during the initial rounds of elongation.105 Interactions of the anti-Shine Dalgarno sequence of the 16S ribosomal RNA with the Shine Dalgarno sequence on the mRNA just upstream of the start codon increases the stability of the ribosome-mRNA complex, as demonstrated by experiments with mRNA devoid of the Shine Dalgarno sequence. Furthermore, the resistance of the complex to mechanical force depended on the occupancy of the ribosomal A- and P-sites: Without tRNAs, the complexes ruptured at a mean force of 10.6 pN. The rupture force increased to 15.2 pN when a deacylated tRNA was present in the P-site, and further to 26.5 pN when, in addition, Phe-tRNAPhe was present in the A-site. Omission of the Shine Dalgarno sequence on the mRNA reduced these forces by ~10 pN. Interestingly, peptide bond formation appeared to decrease the mechanical stability of the complex, as indicated by measurements using N-acetyl-Phe-tRNAPhe instead of Phe-tRNAPhe. This finding could indicate a coupling between the two ribosomal subunits: Peptide bond formation in the 50S subunit may result in reduced stability of the 30S-tRNA-mRNA complex. In the context of initiation, this could provide a mechanism to permit elongation only after formation of the initial peptide bonds.
3.4 Following and Manipulating Nascent Protein Elongation and Folding
Holding the ribosome and one end of the mRNA in optical tweezers experiments results in the application of force that is aligned with the movement of the ribosome along the mRNA track. The force is opposing when it is applied to the 3’-end of the mRNA, or aiding when it is applied to the 5’-end. It has indeed been observed that the rate with which the ribosome steps along the mRNA decreases as a function of the applied force to the 3’-end (see above). Applying force to the nascent protein (N-terminal) as it emerges from the ribosome allows the simultaneous measurement of polypeptide elongation and polypeptide folding. Measurements based on such a geometry have not been reported yet. It is expected that force applied to the nascent polypeptide will be transduced ultimately to the peptidyl-transferase center of the ribosome, where the nascent polypeptide is anchored. This may lead to distortions of the catalytic site, providing exciting opportunities for studying the mechanochemistry of peptide bond synthesis with a reaction coordinate that does not directly bias movement of the ribosome during translocation.
While single-molecule experiments monitoring continuous elongation of a nascent polypeptide chain have not been reported, a study with a nascent chain stalled at defined positions has shed light on its folding in the environment of the ribosome. Why is it worthwhile to study folding in the context of synthesis? The ribosome is a highly processive molecular machine: During elongation, single amino acids are added to the C-terminus of the growing nascent polypeptide, and the translation product is released only when a stop in the message is reached, indicating that the full-length protein has been synthesized. Folding is generally faster than translational elongation: With maximum elongation rates estimated to be around 20 amino acids per second, it takes at least five seconds to complete the synthesis of a small protein of 100 amino acids. Folding—either to the native structure or to metastable folding intermediates—often occurs in the millisecond to second regime and is usually highly cooperative, involving most residues within the folding unit. Two immediate consequences resulting from these basic parameters of cellular protein production are (i) that the initial folding occurs prior to completion of synthesis, while the growing nascent chain is held in close proximity to the ribosome; and (ii) that not all of the sequence becomes available at once to participate in folding, but rather it emerges gradually. How is this vectorial nature of protein synthesis then reconciled with cooperative folding? And how does the ribosomal environment affect these early folding transitions?
The ability of optical tweezers to mechanically manipulate single molecules and measure changes in their extension provides an approach for studying protein folding in complex environments such as the ribosome. Force acts as a denaturant for proteins: Applying an external force tilts the energy landscape of folding, biasing the protein toward unfolding.97 Optical tweezers enable the application of force to specific points in the molecular assembly, making it possible to selective destabilize a defined portion of the molecule or complex under study. This approach has been successfully exploited to unfold individual subdomains within T4 lysozyme and to study how the folding of individual subdomains is coupled within the full-length protein.106 Similarly, it should be possible to unfold just the nascent polypeptide in a ribosome-nascent chain complex to study its folding while leaving the macromolecular assembly intact.
Optical tweezers experiments using the geometry depicted in Figure 8a revealed that the ribosome markedly slowed folding of T4 lysozyme.67 These experiments made use of engineered ribosomes harboring an attachment site within the large subunit (Figure 8b). Nascent polypeptides were synthesized by these ribosomes in vitro using mRNA templates that lacked stop codons. When the ribosome reaches the 3’ end of such a stop codon-less mRNA, it stalls. In the resulting ribosome nascent chain complex, the translation product remains covalently bound to the P-site tRNA and thus accumulates as a peptidyl tRNA species. With appropriately designed mRNAs, this approach was used to produce nascent chains stalled at a specific site within the T4 lysozyme sequence. Introducing a flexible linker sequence at the C-terminus allowed the T4 lysozyme polypeptide to emerge completely from the ribosomal exit tunnel and fold into its native structure. In this molecular arrangement, the nascent chain can then be unfolded by applying force with optical tweezers and refolded upon reducing the force, allowing the observation of folding transitions in real time and hence the determination of folding kinetics. When the nascent chain is kept in close proximity to the ribosomal surface by a linker sequence of 41 amino acids that spans the ribosomal exit tunnel, a 100-fold deceleration in the overall folding rate is observed (compared to folding in the absence of the ribosome). Extending the linker sequence to 60 amino acids provides additional separation between the ribosome and the folding protein and leads to a partial recovery of the folding rate (Figure 8c).
Figure 8. Modulation of nascent protein folding by the ribosome.
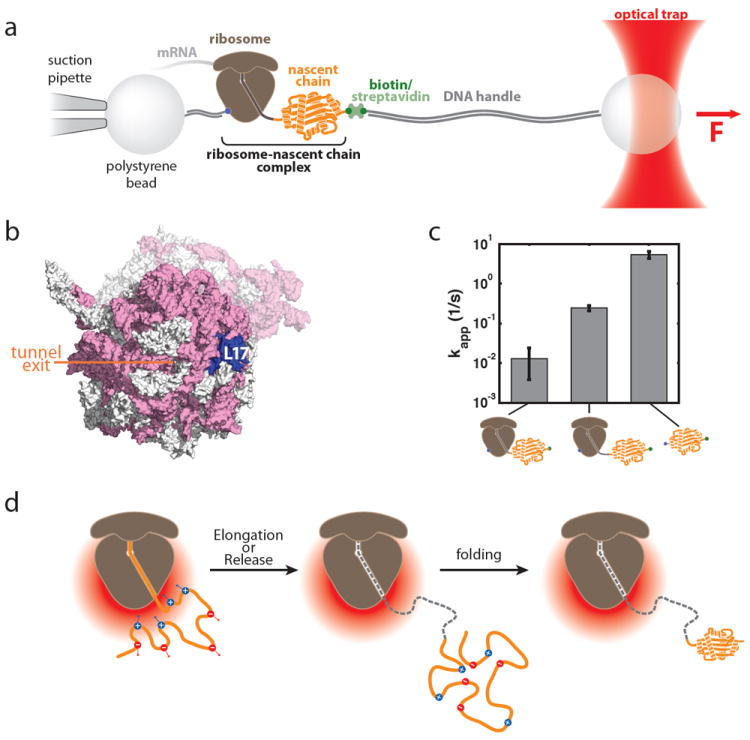
a. Optical tweezers geometry for measuring nascent chain folding. A single stalled ribosome-nascent chain complex is immobilized between polystyrene beads in a single-trap optical tweezers instrument. b. View of the area around the ribosomal exit tunnel. rRNA is shown in pink, ribosomal proteins in grey in this surface representation of the 70S ribosome (based on pdb coordinates 2aw4 and 2avy; ref. 107). L17, which was chosen as the attachment point on the ribosome, is shown in blue, the opening of the ribosomal exit tunnel is indicated. c. Apparent folding rate of T4 lysozyme bound to the ribosome (by linkers of 41 and 60 amino acids in length) and in the absence of the ribosome (from left to right). The ribosome reduces the apparent folding rate in a distance dependent fashion (see Reference 67 for details). d. Possible model for modulation of folding rates in an electrostatic potential. The negative electrostatic potential around the ribosome (red gradient) attracts positively charged residues within the nascent polypeptide and repels negatively charged ones. This leads to a structural bias that might affect the conformational search, which could make it energetically more difficult (or easier) to reach the transition state and thus result in a deceleration (or acceleration) of folding rates. Once the folding unit leaves the immediate environment around the ribosome (middle panel), the effect decays and folding proceeds in an unimpaired fashion (right panel). A, B and C: modified from Reference 67 (Adapted with permission from ref. 67. Copyright 2011 American Association for the Advancement of Sciences)
The effect of the ribosome on the folding rate was found to be sensitive to the ionic strength of the buffer, indicating that electrostatic interactions of charged residues in the nascent polypeptide with the strong negative electrostatic potential around the ribosome are—at least in part—responsible for the observed effect. Figure 8d illustrates a possible rationalization of this phenomenon: The attraction and repulsion forces on charged residues in the nascent polypeptide within the electrostatic potential around the ribosome may result in a conformational bias in the unfolded or partially folded state of the nascent chain. This bias may favor or disfavor certain conformations, which may then accelerate or decelerate the acquisition of the structure corresponding to the transition state of folding. Consistent with this model, a kinetic analysis of the folding trajectories using a Bayesian extension of Hidden Markov Model (BHMM) analysis showed that, rather than having a global effect on all folding rates, the ribosome affects a specific step along the folding pathway: T4 lysozyme was found to fold through a pathway similar to the one shown in Figure 4a. BHMM analysis demonstrated that the reversible formation of a transient folding intermediate is unaffected by the ribosome, whereas the final step toward the native state is decelerated. N-terminal fragments of T4 lysozyme were found to aggregate in solution and to misfold in single-molecule measurements.67 Misfolding was prevented by the ribosome, presumably through the kinetic mechanism described above, indicating that deceleration of specific folding steps by the ribosome may contribute to maintaining the growing nascent polypeptide in a folding-competent conformation until sufficient sequence has been synthesized for the protein to fold productively. These experiments demonstrate the power of single-molecule manipulation and detection and will serve as the basis for future studies of translational elongation and folding on the ribosome.
4. Conclusions and outlook
The experiments and techniques outlined above illustrate the power of single-molecule approaches using optical tweezers to study the complex biological process of protein synthesis. It is difficult to think of similarly suitable alternative experimental approaches to study the motor properties of the ribosome, the function of the ribosome as a helicase, and the modulation of nascent protein folding by the ribosomal environment. Optical tweezers provide the unique capability of not only observing, but actually manipulating single macromolecular complexes. This allows the experimenter to favor or disfavor transitions and to drive transitions between states, as exemplified by the measurements of nascent protein folding on the ribosome.
The optical tweezers studies discussed above have begun to shed light on processes related to translation, but in our view are just the tip of the iceberg of what will be possible with this powerful experimental approach. Improvements in instrumentation and biochemical sample preparation have lowered the barriers for studying highly complex biological processes with optical tweezers. We anticipate that a robust single-molecule translation assay will be invaluable for answering questions pertaining to translational dynamics and regulation: What are the local variations in elongation rates caused by secondary and tertiary structures along mRNA templates? What are the determinants of these modulations? And how does this punctuation of synthesis affect the structure and function of the translation product? How does it contribute to the programmed frameshifting that is exploited to regulate protein function?
The combination of mechanical manipulation and fluorescence detection of single molecules will further expand the range of questions that can be addressed by adding an independent reaction coordinate. It will permit the temporal correlation of ribosome translocation with elongation factor binding and – through the choice of suitable FRET pairs – with the conformational rearrangements within the elongation factors and within the ribosomal subunit, e.g. head swiveling.107 Similarly, inter-subunit rotation, a functionally important part of the ribosomal that has been studied with single-molecule FRET approaches,108-111 could be observed simultaneously with translocation. Since both head swiveling and inter-subunit rotation are essentially mechanical processes, it should be possible to ultimately not only observe, but manipulate them to learn how they contribute to the highly complex process of translational elongation.
Acknowledgments
The work was supported by National Institutes of Health grant GM10840 to I. T.
Biographies

Ignacio Tinoco was educated at the University of New Mexico (1948-51), the University of Wisconsin (1951-54), and Yale University (1954-56). He was then hired as an Instructor in the Chemistry Department at the University of California, Berkeley, where he has remained ever since. His graduate work at Wisconsin was on the conversion of fibrinogen to fibrin, but at Berkeley his research shifted to nucleic acids, particularly RNA. His group measured optical properties, including absorption, circular dichroism, fluorescence-detected circular dichroism, and circular intensity differential scattering. They also derived the theories relating the measurements to the structures of the biopolymers. Thermodynamics and kinetics of secondary structure—double-strand—formation in RNA was measured. The nearest-neighbor hypothesis for RNA folding was proposed, and tested by determining structures of RNA by NMR. At present the group’s research is focused on single-molecules studies of translation using force and fluorescence.
Christian Kaiser studied biochemistry at the Leibniz University in Hannover, Germany, graduating in 2001. He then moved to the Max Planck Institute of Biochemistry in Martinsried to do his graduate studies with F. Ulrich Hartl, applying fluorescence spectroscopy methods to a reconstituted translation system to study the dynamics of the chaperone-ribosome interactions during nascent polypeptide elongation. He received his Ph.D. from the Ludwig Maximilian University in Munich, Germany, in 2006. He performed postdoctoral studies at the University of Texas Medical Branch at Galveston, working with Henry F. Epstein and Andres F. Oberhauser on the characterization of a myosin-specific chaperone with single-molecule force spectroscopy. He continued his postdoctoral studies in the laboratory of Carlos Bustamante at the University of California Berkeley. He developed an experimental system to study the folding of nascent polypeptides in the context of the ribosome using optical tweezers. In 2013, he moved to the Biology Department at Johns Hopkins University to start his own group, which is focusing on single-molecule studies of the cellular protein biogenesis machinery.
References
- 1.Leslie M. Science. 2013;339:25. doi: 10.1126/science.339.6115.25. [DOI] [PubMed] [Google Scholar]
- 2.Melnikov S, Ben-Shem A, Garreau de Loubresse N, Jenner L, Yusupova G, Yusupov M. Nat Struct Mol Biol. 2012;19:560. doi: 10.1038/nsmb.2313. [DOI] [PubMed] [Google Scholar]
- 3.Spirin AS. Ribosomes. Springer; New York: 2000. [Google Scholar]
- 4.Liljas A. Structural Aspects of Protein Synthesis. World Scientific Publishing Co.; Singapore: 2004. [Google Scholar]
- 5.Wen JD, Lancaster L, Hodges C, Zeri AC, Yoshimura SH, Noller HF, Bustamante C, Tinoco I. Nature. 2008;452:598. doi: 10.1038/nature06716. [DOI] [PMC free article] [PubMed] [Google Scholar]
- 6.Ban N, Nissen P, Hansen J, Moore PB, Steitz TA. Science. 2000;289:905. doi: 10.1126/science.289.5481.905. [DOI] [PubMed] [Google Scholar]
- 7.Nissen P, Hansen J, Ban N, Moore PB, Steitz TA. Science. 2000;289:920. doi: 10.1126/science.289.5481.920. [DOI] [PubMed] [Google Scholar]
- 8.Schluenzen F, Tocilj A, Zarivach R, Harms J, Gluehmann M, Janell D, Bashan A, Bartels H, Agmon I, Franceschi F, Yonath A. Cell. 2000;102:615. doi: 10.1016/s0092-8674(00)00084-2. [DOI] [PubMed] [Google Scholar]
- 9.Harms J, Schluenzen F, Zarivach R, Bashan A, Gat S, Agmon I, Bartels H, Franceschi F, Yonath A. Cell. 2001;107:679. doi: 10.1016/s0092-8674(01)00546-3. [DOI] [PubMed] [Google Scholar]
- 10.Brodersen DE, Clemons WM, Jr, Carter AP, Morgan-Warren RJ, Wimberly BT, Ramakrishnan V. Cell. 2000;103:1143. doi: 10.1016/s0092-8674(00)00216-6. [DOI] [PubMed] [Google Scholar]
- 11.Carter AP, Clemons WM, Brodersen DE, Morgan-Warren RJ, Wimberly BT, Ramakrishnan V. Nature. 2000;407:340. doi: 10.1038/35030019. [DOI] [PubMed] [Google Scholar]
- 12.Wimberly BT, Brodersen DE, Clemons WM, Jr, Morgan-Warren RJ, Carter AP, Vonrhein C, Hartsch T, Ramakrishnan V. Nature. 2000;407:327. doi: 10.1038/35030006. [DOI] [PubMed] [Google Scholar]
- 13.Yusupov MM, Yusupova GZ, Baucom A, Lieberman K, Earnest TN, Cate JH, Noller HF. Science. 2001;292:883. doi: 10.1126/science.1060089. [DOI] [PubMed] [Google Scholar]
- 14.Ramakrishnan V. Angew Chemie, Int Ed. 2010;49:4355. doi: 10.1002/anie.201001436. [DOI] [PubMed] [Google Scholar]
- 15.Steitz TA. Angew Chemie, Int Ed. 2010;49:4381. doi: 10.1002/anie.201000708. [DOI] [PubMed] [Google Scholar]
- 16.Yonath A. Angew Chemie, Int Ed. 2010;49:4341. doi: 10.1002/anie.201001297. [DOI] [PubMed] [Google Scholar]
- 17.Ben-Shem A, Garreau de Loubresse N, Melnikov S, Jenner L, Yusupova G, Yusupov M. Science. 2011;334:1524. doi: 10.1126/science.1212642. [DOI] [PubMed] [Google Scholar]
- 18.Jenner L, Melnikov S, de Loubresse NG, Ben-Shem A, Iskakova M, Urzhumtsev A, Meskauskas A, Dinman J, Yusupova G, Yusupov M. Curr Opin Struct Biol. 2012;22:759. doi: 10.1016/j.sbi.2012.07.013. [DOI] [PubMed] [Google Scholar]
- 19.Wilson DN, Doudna Cate JH. Cold Spring Harbor perspectives in biology. 2012;4 doi: 10.1101/cshperspect.a011536. [DOI] [PMC free article] [PubMed] [Google Scholar]
- 20.Anger AM, Armache JP, Berninghausen O, Habeck M, Subklewe M, Wilson DN, Beckmann R. Nature. 2013;497:80. doi: 10.1038/nature12104. [DOI] [PubMed] [Google Scholar]
- 21.Jin H, Kelley AC, Loakes D, Ramakrishnan V. Proc Natl Acad Sci U S A. 2010;107:8593. doi: 10.1073/pnas.1003995107. [DOI] [PMC free article] [PubMed] [Google Scholar]
- 22.Jin H, Kelley AC, Ramakrishnan V. Proc Natl Acad Sci U S A. 2011;108:15798. doi: 10.1073/pnas.1112185108. [DOI] [PMC free article] [PubMed] [Google Scholar]
- 23.Zhou J, Lancaster L, Trakhanov S, Noller HF. RNA. 2012;18:230. doi: 10.1261/rna.031187.111. [DOI] [PMC free article] [PubMed] [Google Scholar]
- 24.Chen Y, Feng S, Kumar V, Ero R, Gao YG. Nat Struct Mol Biol. 2013;20:1077. doi: 10.1038/nsmb.2645. [DOI] [PubMed] [Google Scholar]
- 25.Pulk A, Cate JH. Science. 2013;340:1235970. doi: 10.1126/science.1235970. [DOI] [PMC free article] [PubMed] [Google Scholar]
- 26.Tourigny DS, Fernandez IS, Kelley AC, Ramakrishnan V. Science. 2013;340:1235490. doi: 10.1126/science.1235490. [DOI] [PMC free article] [PubMed] [Google Scholar]
- 27.Zhou J, Lancaster L, Donohue JP, Noller HF. Science. 2013;340:1236086. doi: 10.1126/science.1236086. [DOI] [PMC free article] [PubMed] [Google Scholar]
- 28.Connell SR, Takemoto C, Wilson DN, Wang H, Murayama K, Terada T, Shirouzu M, Rost M, Schuler M, Giesebrecht J, Dabrowski M, Mielke T, Fucini P, Yokoyama S, Spahn CM. Mol Cell. 2007;25:751. doi: 10.1016/j.molcel.2007.01.027. [DOI] [PubMed] [Google Scholar]
- 29.Frank J. Biopolymers. 2003;68:223. doi: 10.1002/bip.10210. [DOI] [PubMed] [Google Scholar]
- 30.Julian P, Konevega AL, Scheres SH, Lazaro M, Gil D, Wintermeyer W, Rodnina MV, Valle M. Proc Natl Acad Sci U S A. 2008;105:16924. doi: 10.1073/pnas.0809587105. [DOI] [PMC free article] [PubMed] [Google Scholar]
- 31.Fischer N, Konevega AL, Wintermeyer W, Rodnina MV, Stark H. Nature. 2010;466:329. doi: 10.1038/nature09206. [DOI] [PubMed] [Google Scholar]
- 32.Passmore LA, Schmeing TM, Maag D, Applefield DJ, Acker MG, Algire MA, Lorsch JR, Ramakrishnan V. Mol Cell. 2007;26:41. doi: 10.1016/j.molcel.2007.03.018. [DOI] [PubMed] [Google Scholar]
- 33.Gao N, Zavialov AV, Ehrenberg M, Frank J. J Mol Biol. 2007;374:1345. doi: 10.1016/j.jmb.2007.10.021. [DOI] [PMC free article] [PubMed] [Google Scholar]
- 34.Gao YG, Selmer M, Dunham CM, Weixlbaumer A, Kelley AC, Ramakrishnan V. Science. 2009;326:694. doi: 10.1126/science.1179709. [DOI] [PMC free article] [PubMed] [Google Scholar]
- 35.Andersen GR, Thirup S, Spremulli LL, Nyborg J. J Mol Biol. 2000;297:421. doi: 10.1006/jmbi.2000.3564. [DOI] [PubMed] [Google Scholar]
- 36.Kawashima T, Berthet-Colominas C, Wulff M, Cusack S, Leberman R. Nature. 1996;379:511. doi: 10.1038/379511a0. [DOI] [PubMed] [Google Scholar]
- 37.Kjeldgaard M, Nissen P, Thirup S, Nyborg J. Structure. 1993;1:35. doi: 10.1016/0969-2126(93)90007-4. [DOI] [PubMed] [Google Scholar]
- 38.Nissen P, Kjeldgaard M, Thirup S, Polekhina G, Reshetnikova L, Clark BF, Nyborg J. Science. 1995;270:1464. doi: 10.1126/science.270.5241.1464. [DOI] [PubMed] [Google Scholar]
- 39.Schmeing TM, Voorhees RM, Kelley AC, Gao YG, Murphy FVt, Weir JR, Ramakrishnan V. Science. 2009;326:688. doi: 10.1126/science.1179700. [DOI] [PMC free article] [PubMed] [Google Scholar]
- 40.Rawat U, Gao H, Zavialov A, Gursky R, Ehrenberg M, Frank J. J Mol Biol. 2006;357:1144. doi: 10.1016/j.jmb.2006.01.038. [DOI] [PubMed] [Google Scholar]
- 41.Weixlbaumer A, Jin H, Neubauer C, Voorhees RM, Petry S, Kelley AC, Ramakrishnan V. Science. 2008;322:953. doi: 10.1126/science.1164840. [DOI] [PMC free article] [PubMed] [Google Scholar]
- 42.Weixlbaumer A, Petry S, Dunham CM, Selmer M, Kelley AC, Ramakrishnan V. Nat Struct Mol Biol. 2007;14:733. doi: 10.1038/nsmb1282. [DOI] [PubMed] [Google Scholar]
- 43.Gao H, Zhou Z, Rawat U, Huang C, Bouakaz L, Wang C, Cheng Z, Liu Y, Zavialov A, Gursky R, Sanyal S, Ehrenberg M, Frank J, Song H. Cell. 2007;129:929. doi: 10.1016/j.cell.2007.03.050. [DOI] [PubMed] [Google Scholar]
- 44.Schimmel PR, Soll D. Annu Rev Biochem. 1979;48:601. doi: 10.1146/annurev.bi.48.070179.003125. [DOI] [PubMed] [Google Scholar]
- 45.Schmeing TM, Ramakrishnan V. Nature. 2009;461:1234. doi: 10.1038/nature08403. [DOI] [PubMed] [Google Scholar]
- 46.Liu T, Kaplan A, Wickersham CE, Wen J-D, Lancaster L, Fredrick K, Noller HF, Tinoco I, J, Bustamante C. 2013 submitted. [Google Scholar]
- 47.Jencks WP. In: Handbook of biochemistry and molecular biology : nucleic acids. Fasman GD, editor. Vol. 1 CRC Press; Cleveland: 1975. [Google Scholar]
- 48.Rodnina MV, Beringer M, Wintermeyer W. Trends Biochem Sci. 2007;32:20. doi: 10.1016/j.tibs.2006.11.007. [DOI] [PubMed] [Google Scholar]
- 49.Rodnina MV, Wintermeyer W. Curr Opin Cell Biol. 2009;21:435. doi: 10.1016/j.ceb.2009.01.023. [DOI] [PubMed] [Google Scholar]
- 50.Savelsbergh A, Katunin VI, Mohr D, Peske F, Rodnina MV, Wintermeyer W. Mol Cell. 2003;11:1517. doi: 10.1016/s1097-2765(03)00230-2. [DOI] [PubMed] [Google Scholar]
- 51.Semenkov YP, Rodnina MV, Wintermeyer W. Nat Struct Biol. 2000;7:1027. doi: 10.1038/80938. [DOI] [PubMed] [Google Scholar]
- 52.Wilden B, Savelsbergh A, Rodnina MV, Wintermeyer W. Proc Natl Acad Sci U S A. 2006;103:13670. doi: 10.1073/pnas.0606099103. [DOI] [PMC free article] [PubMed] [Google Scholar]
- 53.Wintermeyer W, Peske F, Beringer M, Gromadski KB, Savelsbergh A, Rodnina MV. Biochem Soc Trans. 2004;32:733. doi: 10.1042/BST0320733. [DOI] [PubMed] [Google Scholar]
- 54.Noller HF. Biochimie. 2006;88:935. doi: 10.1016/j.biochi.2006.04.006. [DOI] [PubMed] [Google Scholar]
- 55.Spiegel PC, Ermolenko DN, Noller HF. RNA. 2007;13:1473. doi: 10.1261/rna.601507. [DOI] [PMC free article] [PubMed] [Google Scholar]
- 56.Rodnina MV, Beringer M, Wintermeyer W. Q Rev Biophys. 2006;39:203. doi: 10.1017/S003358350600429X. [DOI] [PubMed] [Google Scholar]
- 57.Pape T, Wintermeyer W, Rodnina MV. EMBO J. 1998;17:7490. doi: 10.1093/emboj/17.24.7490. [DOI] [PMC free article] [PubMed] [Google Scholar]
- 58.Petrov A, Chen J, O’Leary S, Tsai A, Puglisi JD. Cold Spring Harb Perspect Biol. 2012 doi: 10.1101/cshperspect.a011551. [DOI] [PMC free article] [PubMed] [Google Scholar]
- 59.Petrov A, Kornberg G, O’Leary S, Tsai A, Uemura S, Puglisi JD. Curr Opin Struct Biol. 2011;21:137. doi: 10.1016/j.sbi.2010.11.007. [DOI] [PMC free article] [PubMed] [Google Scholar]
- 60.Tinoco I, Jr, Gonzalez RL., Jr Genes Dev. 2011;25:1205. doi: 10.1101/gad.2050011. [DOI] [PMC free article] [PubMed] [Google Scholar]
- 61.Perez CE, Gonzalez RL., Jr Curr Opin Chem Biol. 2011;15:853. doi: 10.1016/j.cbpa.2011.11.002. [DOI] [PMC free article] [PubMed] [Google Scholar]
- 62.Selvin PR, Ha T. Single-Molecule Techniques, A Laboratory Manual. Cold Spring Harbor Laboratory Press; Cold Spring Harbor, NY: 2008. [Google Scholar]
- 63.Gell C, Brockwell D, Smith A. Handbook of Single Molecule Fluorescence Spectroscopy. Oxford University Press; Oxford, UK: 2006. [Google Scholar]
- 64.Hinterdorfer P, van Oijen A. Handbook of Single-Molecule Biophysics. Springer; New York, NY: 2009. [Google Scholar]
- 65.Leake MC. Single-Molecule Cellular Biophysics. Cambridge University Press; Cambridge, UK: 2013. [Google Scholar]
- 66.Tinoco I, Jr, Wen J-D. Physical Biology. 2009;6:025006. doi: 10.1088/1478-3975/6/2/025006. [DOI] [PubMed] [Google Scholar]
- 67.Kaiser CM, Goldman DH, Chodera JD, Tinoco I, Jr, Bustamante C. Science. 2011;334:1723. doi: 10.1126/science.1209740. [DOI] [PMC free article] [PubMed] [Google Scholar]
- 68.Moffitt JR, Chemla YR, Smith SB, Bustamante C. Annu Rev Biochem. 2008;77:205. doi: 10.1146/annurev.biochem.77.043007.090225. [DOI] [PubMed] [Google Scholar]
- 69.Ashkin A. Phys Rev Lett. 1970;24:156. [Google Scholar]
- 70.Liphardt J, Onoa B, Smith SB, Tinoco I, Jr, Bustamante C. Science. 2001;292:733. doi: 10.1126/science.1058498. [DOI] [PubMed] [Google Scholar]
- 71.Chu S. In: Nobel Lectures, Physics, 1996-2000. Ekspong G, editor. World Scientific Press; Singapore: 2002. [Google Scholar]
- 72.Perkins TT, Quake SR, Smith DE, Chu S. Science. 1994;264:822. doi: 10.1126/science.8171336. [DOI] [PubMed] [Google Scholar]
- 73.Bustamante C, Marko JF, Siggia ED, Smith S. Science. 1994;265:1599. doi: 10.1126/science.8079175. [DOI] [PubMed] [Google Scholar]
- 74.Smith S, Cui Y, Bustamante C. Methods in Enzymology. 2003;361:134. doi: 10.1016/s0076-6879(03)61009-8. [DOI] [PubMed] [Google Scholar]
- 75.Abbondanzieri EA, Greenleaf WJ, Shaevitz JW, Landick R, Block SM. Nature. 2005;438:460. doi: 10.1038/nature04268. [DOI] [PMC free article] [PubMed] [Google Scholar]
- 76.Lang M, Block S. American Journal of Physics. 2002;71:201. doi: 10.1119/1.1532323. [DOI] [PMC free article] [PubMed] [Google Scholar]
- 77.Comstock MJ, Ha T, Chemla YR. Nat Methods. 2011;8:335. doi: 10.1038/nmeth.1574. [DOI] [PMC free article] [PubMed] [Google Scholar]
- 78.Tinoco I, Jr, Bustamante C. Biophys Chem. 2002;101-102:513. doi: 10.1016/s0301-4622(02)00177-1. [DOI] [PubMed] [Google Scholar]
- 79.Tinoco I, Jr, Collin D, Li PT. Biochem Soc Trans. 2004;32:757. doi: 10.1042/BST0320757. [DOI] [PMC free article] [PubMed] [Google Scholar]
- 80.Li PTX, Vieregg J, Tinoco I., Jr Ann Rev Biochem. 2008;77:77. doi: 10.1146/annurev.biochem.77.061206.174353. [DOI] [PubMed] [Google Scholar]
- 81.Cecconi C, Shank EA, Bustamante C, Marqusee S. Science. 2005;309:2057. doi: 10.1126/science.1116702. [DOI] [PubMed] [Google Scholar]
- 82.Liu T, Kaplan A, Wickersham CE, Wen J-D, Lancaster L, Fredrick K, Noller HF, Tinoco I, J, Bustamante C. submitted. [Google Scholar]
- 83.Johnson DS, Bai L, Smith BY, Patel SS, Wang MD. Cell. 2007;129:1299. doi: 10.1016/j.cell.2007.04.038. [DOI] [PMC free article] [PubMed] [Google Scholar]
- 84.Chistol G, Liu S, Hetherington CL, Moffitt JR, Grimes S, Jardine PJ, Bustamante C. Cell. 2012;151:1017. doi: 10.1016/j.cell.2012.10.031. [DOI] [PMC free article] [PubMed] [Google Scholar]
- 85.Bustamante C, Keller D, Oster G. Acc Chem Res. 2001;34:412. doi: 10.1021/ar0001719. [DOI] [PubMed] [Google Scholar]
- 86.Tinoco I, Jr, Sauer K, Wang JC, Puglisi JD, Harbison G, Rovnyak D. Physical Chemistry: Applications to Biological Sciences. Prentice Hall; Upper Saddle River, NJ: 2013. [Google Scholar]
- 87.Jarzynski C. Phys Rev E. 1997;56:5018. [Google Scholar]
- 88.Jarzynski C. Proc Natl Acad Sci U S A. 2001;98:3636. doi: 10.1073/pnas.081074598. [DOI] [PMC free article] [PubMed] [Google Scholar]
- 89.Hummer G, Szabo A. Proc Natl Acad Sci U S A. 2001;98:3658. doi: 10.1073/pnas.071034098. [DOI] [PMC free article] [PubMed] [Google Scholar]
- 90.Liphardt J, Dumont S, Smith SB, Tinoco I, Jr, Bustamante C. Science. 2002;296:1832. doi: 10.1126/science.1071152. [DOI] [PubMed] [Google Scholar]
- 91.Ritort F, Bustamante C, Tinoco I., Jr Proc Natl Acad Sci U S A. 2002;99:13544. doi: 10.1073/pnas.172525099. [DOI] [PMC free article] [PubMed] [Google Scholar]
- 92.Crooks GE. Journal of Statistical Physics. 1998;90:1481. [Google Scholar]
- 93.Crooks GE. Phys Rev E. 1999;60:2721. doi: 10.1103/physreve.60.2721. [DOI] [PubMed] [Google Scholar]
- 94.Collin D, Ritort F, Jarzynski C, Smith SB, Tinoco I, Jr, Bustamante C. Nature. 2005;437:231. doi: 10.1038/nature04061. [DOI] [PMC free article] [PubMed] [Google Scholar]
- 95.Lionnet T, Allemand J-F, Revyakin A, Strick TR, Saleh OA, Bensimon D, Croquette V. In: Single-Molecule Techniques, A Laboratory Manual. Selvin PR, Ha T, editors. Cold Spring Harbor Laboratory Press; Cold Spring Harbor, NY: 2008. [Google Scholar]
- 96.Tinoco I, Jr, Li PTX, Bustamante C. Q Rev Biophys. 2006;39:325. doi: 10.1017/S0033583506004446. [DOI] [PMC free article] [PubMed] [Google Scholar]
- 97.Bustamante C, Chemla YR, Forde NR, Izhaky D. Annu Rev Biochem. 2004;73:705. doi: 10.1146/annurev.biochem.72.121801.161542. [DOI] [PubMed] [Google Scholar]
- 98.Chemla YR, Moffitt JR, Bustamante C. J Phys Chem B. 2008;112:6025. doi: 10.1021/jp076153r. [DOI] [PubMed] [Google Scholar]
- 99.Qu X, Wen JD, Lancaster L, Noller HF, Bustamante C, Tinoco I., Jr Nature. 2011;475:118. doi: 10.1038/nature10126. [DOI] [PMC free article] [PubMed] [Google Scholar]
- 100.Farabaugh PJ. Microbiol Rev. 1996;60:103. doi: 10.1128/mr.60.1.103-134.1996. [DOI] [PMC free article] [PubMed] [Google Scholar]
- 101.Takyar S, Hickerson RP, Noller HF. Cell. 2005;120:49. doi: 10.1016/j.cell.2004.11.042. [DOI] [PubMed] [Google Scholar]
- 102.Watts JM, Dang KK, Gorelick RJ, Leonard CW, Bess JW, Jr, Swanstrom R, Burch CL, Weeks KM. Nature. 2009;460:711. doi: 10.1038/nature08237. [DOI] [PMC free article] [PubMed] [Google Scholar]
- 103.Zuker M. Nucleic Acids Res. 2003;31:3406. doi: 10.1093/nar/gkg595. [DOI] [PMC free article] [PubMed] [Google Scholar]
- 104.Rodnina MV. Science. 2013;340:1534. doi: 10.1126/science.1240090. [DOI] [PubMed] [Google Scholar]
- 105.Uemura S, Dorywalska M, Lee TH, Kim HD, Puglisi JD, Chu S. Nature. 2007;446:454. doi: 10.1038/nature05625. [DOI] [PubMed] [Google Scholar]
- 106.Shank EA, Cecconi C, Dill JW, Marqusee S, Bustamante C. Nature. 2010;465:637. doi: 10.1038/nature09021. [DOI] [PMC free article] [PubMed] [Google Scholar]
- 107.Schuwirth BS, Borovinskaya MA, Hau CW, Zhang W, Vila-Sanjurjo A, Holton JM, Cate JH. Science. 2005;310:827. doi: 10.1126/science.1117230. [DOI] [PubMed] [Google Scholar]
- 108.Cornish PV, Ermolenko DN, Noller HF, Ha T. Mol Cell. 2008;30:578. doi: 10.1016/j.molcel.2008.05.004. [DOI] [PMC free article] [PubMed] [Google Scholar]
- 109.Marshall RA, Dorywalska M, Puglisi JD. Proc Natl Acad Sci U S A. 2008;105:15364. doi: 10.1073/pnas.0805299105. [DOI] [PMC free article] [PubMed] [Google Scholar]
- 110.Munro JB, Altman RB, Tung CS, Cate JH, Sanbonmatsu KY, Blanchard SC. Proc Natl Acad Sci U S A. 2010;107:709. doi: 10.1073/pnas.0908597107. [DOI] [PMC free article] [PubMed] [Google Scholar]
- 111.Fei J, Kosuri P, MacDougall DD, Gonzalez RL., Jr Mol Cell. 2008;30:348. doi: 10.1016/j.molcel.2008.03.012. [DOI] [PubMed] [Google Scholar]
- 112.Moffitt JR, Chemla YR, Izhaky D, Bustamante C. Proc Natl Acad Sci U S A. 2006;103:9006. doi: 10.1073/pnas.0603342103. [DOI] [PMC free article] [PubMed] [Google Scholar]