

Abstract
An understanding of the molecular mechanisms by which androgens drive spermatogenesis has been thwarted by the fact that few consistent androgen receptor (AR) target genes have been identified. Here, we addressed this issue using next-generation sequencing coupled with the RiboTag approach, which purifies translated mRNAs expressed in cells that express cyclic recombinase (CRE). Using RiboTag mice expressing CRE in Sertoli cells (SCs), we identified genes expressed specifically in SCs in both prepubertal and adult mice. Unexpectedly, this analysis revealed that the SC-specific gene program is already largely defined at the initiation of spermatogenesis despite the subsequent dramatic maturational changes known to occur in SCs. To identify AR-regulated genes, we generated triple-mutant mice in which the SCs express the RiboTag but lack ARs. RNA sequencing analysis revealed hundreds of SC-expressed AR-regulated genes that had previously gone unnoticed, including suppressed genes involved in ovarian development. Comparison of the SC-enriched dataset with that from the whole testes allowed us to classify genes in terms of their degree of expression in SCs. This revealed that a greater fraction of AR–up-regulated genes than AR–down-regulated genes were expressed predominantly in SCs. Our results also revealed that AR signaling in SCs causes a large number of genes not detectably expressed in SCs to undergo altered expression, thereby providing genome-wide evidence for wide-scale communication between SCs and other cells. Taken together, our results identified novel classes of genes expressed in a hormone-dependent manner in different testicular cell subsets and highlight a new approach to analyze cell type–specific gene regulation.
In mammals, androgens and FSH are the primary hormones controlling spermatogenesis and male fertility. Testosterone, the main androgenic hormone, is crucial for the initiation and maintenance of spermatogenesis (1–3), because it is able to restore spermatogenesis under experimental conditions in which endogenous FSH and testosterone are virtually absent (4). The effect of androgens on spermatogenesis are mediated through the somatic cell types in the testis, including Sertoli cells (SCs), Leydig cells (LCs), and peritubular myoid cells (PTMs), because germ cells (GCs) themselves do not express the androgen receptor (AR) (5). Several lines of evidence have indicated that SCs are particularly important for AR signaling events crucial for spermatogenesis. For example, several groups have used conditional knockout mice lacking ARs specifically in SCs to demonstrate the critical importance of AR signaling in SCs in driving meiotic progression of the adjacent GCs (6–9).
To begin to understand the molecular mechanism of androgen action, several laboratories have attempted to identify AR-regulated genes by comparing testicular gene expression in mice before and after alteration of AR/androgen signaling at different ages using microarray analysis (10–14). Although these expression-profiling studies identified many candidate AR-regulated genes, several issues prevented a deeper understanding of androgen action. First, each study identified considerably different sets of genes dysregulated as a result of disruption of androgen signaling. In fact, to our knowledge, only 1 AR-regulated gene, the Rhox5 homeobox gene, was identified in more than one study (for review, see Ref. 15). Second, contributing to this deficit is the fact that microarrays, by necessity, only detect the expression of genes available on the chip used and often are subject to artifacts caused by mis-annotation of genes and the oligonucleotide sets used to detect them. Third, these expression-profiling studies were done on whole testes (10–14), and thus the testicular cell type(s) displaying differential gene expression could not be pinpointed. This is a crucial issue because distinguishing between responses occurring in SCs and non-SCs is absolutely necessary to elucidate the complex circuitry involved in AR action in the testis. Finally, many critical genes regulated by AR/androgen in specific cell types within the testis may have escaped detection in these past studies because their differential expression in such cell types is masked by their expression in other cell types.
In this article, we have taken a new approach to identify AR-regulated genes that overcomes these deficits in past studies. In particular, we chose to tackle this problem using the recently generated RiboTag mouse (16). The Rpl22 gene of the RiboTag mouse contains a duplicated exon 4 that is tagged with a hemagglutinin (HA) epitope. The original exon 4 is floxed, allowing it to be excised by cyclic recombinase (CRE) and replaced by its HA-tagged copy. Incorporation of the mutant Rpl22 into the ribosomes allows the isolation of such ribosomes, along with their bound mRNAs, by simple immunoprecipitation (IP) from a tissue lysate. Only cells that express CRE will have such tagged ribosomes, thus allowing purification of translated mRNAs only from those cells. Given the vast repertoire of Cre mouse lines with different expression patterns, this approach permits versatile purification of translated mRNAs in different cells types at specific developmental stages.
In our study, we crossed RiboTag mice with mice expressing CRE specifically in SCs to define the repertoire of SC-translated mRNAs. By isolating the ribosome-bound RNA fraction and subjecting it to next-generation sequencing, we obtained a genome-wide view of genes transcribed and translated in SCs, which we term the “SC translome.” We then introduced the RiboTag allele in mice selectively lacking a functional AR gene in SCs and compared SC translomes between mice with and without a SC-selective AR knockout. This analysis yielded several surprises, including a vast repertoire of previously undetected AR-regulated genes. Our study serves as a resource of information on mRNAs translated in SCs and non-SCs, and it provides a molecular foundation for understanding how AR functions in SCs during the onset of spermatogenesis.
Materials and Methods
Generation of mice strains
Mice with a floxed AR exon 2 (Artm1Verh) (6) were crossed with RiboTag mice (16) to generate a double-mutant strain homozygous for the floxed RiboTag allele and heterozygous/hemizygous for the Arfl allele on a 75% C57BL/6N background. Female Arfl/+; RiboTagfl/fl mice were then mated to AMHCre+/+ males (Plekha5Tg(AMH-cre)1Flor, C57BL/6N]) (17) to generate triple-mutant male offspring: AMHCre+/−;Ar+/Y;RiboTagfl/+ and AMHCre+/−;Arfl/Y;RiboTagfl/+ mice, which we named SCRIBO and SCARIBO, respectively (Figure 1A). In SCARIBO mice, Ar is inactivated and the RiboTag allele is activated in SCs as a result of CRE expression in these cells. In contrast, SCRIBO mice have only the RiboTag allele activated in SCs (Figure 1B). Genotyping was performed as described previously (6, 16). All mouse procedures were in agreement with protocols approved by the institutional animal care and use committee at the University of California, San Diego. All animals were housed under a 12:12-hour light/dark cycle and provided with food and water ad libitum.
Figure 1.
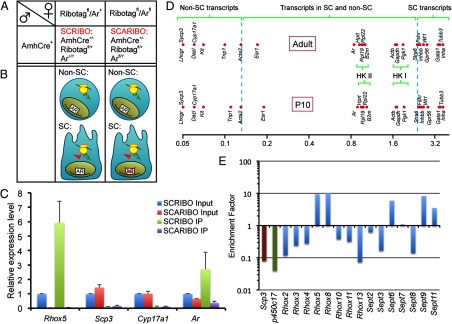
Generation and analysis of SCRIBO and SCARIBO mice and the enrichment factor principle. A, Parental and offspring mice genotypes used in this study. B, Cartoon representation of the mRNAs isolated by anti-HA IP in the mice strains shown. HA-tag, red flag. C, Proof of concept with known marker genes (Rhox5 for SCs, Sycp3 for GCs, Cyp17a1 for LCs, and Ar for SCs, LCs, and PTM) in P10 mice testes. Data were obtained by qPCR and are presented as mean ± SEM of 9 samples of each genotype relative to Rpl19. D, EF values for representative marker genes in P10 and adult SCRIBO samples. HK I, housekeeping category I; HK II, housekeeping category II; dashed lines indicate values of the “threshold” genes described in the text. E, Validation by qPCR of the EFadult value for selected members of the Rhox and Septin gene family. Sycp3, Cyp17a1, and Rhox5 served as controls. For the Rhox2, Rhox3, and Rhox4 paralogs, primers possessing 100% complementarity with all paralog family members were used.
Isolation of SC RNA
SC ribosome-associated RNA was isolated from SCARIBO and SCRIBO testes essentially as described in Sanz et al (16). In brief, flash-frozen testes were homogenized in IP buffer (800 μL for postnatal day 10 [P10] testes, 4 mL for day 55 SCRIBO testes, and 1 mL for day 55 SCARIBO testes) using a Dounce homogenizer. The lysate was then subjected to IP with Dynabeads (Invitrogen) to which anti-HA antibody (monoclonal antibody HA.11, 16B12; Covance) was bound. The beads were washed with 500 μL of high-salt buffer and eluted in 500 μL of RLT buffer (QIAGEN), and the RNA was isolated with an RNeasy mini kit (QIAGEN) to yield the IP sample. Input samples (50 μL) were taken from the original lysates, and RNA was also prepared using an RNeasy mini kit. The efficiency of AR knockout was confirmed by the absence of Rhox5 expression in input and IP samples of SCARIBO testes compared with those of SCRIBO testes (Figure 1C). Input and IP RNA samples of 10 P10 SCARIBO testes and 10 P10 SCRIBO testes (from paired littermates) were pooled and subjected to high-throughput sequencing.
RNA sequencing (RNA-seq)
The quality of the RNA samples obtained was verified using an Agilent Bioanalyzer. Only samples with a RNA integrity number >7 were used for library preparation with the TruSeq RNA Sample Prep Kit (Illumina), starting from 500 ng of RNA. The libraries we prepared were also checked with the Bioanalyzer to ensure the size and lack of adaptor dimers and were then sequenced with the HiSeq 2000 kit with the 51+7 cycle protocol (Illumina).
Analysis of RNA-seq data
Analysis of the data was performed with the Tuxedo Software suite (18). Reads were mapped to mouse Genome Build Mm9 with Tophat v1.4.0 using standard settings for single-ended reads. The sequencing yield ranged between 32 and 40 million reads per sample, and mapping efficiency was between 86.6% and 94.3% (see Supplemental Table 1). Transcript sets of 4 (P10) or 2 (adulthood) conditions were assembled using Cufflinks and then merged with Cuffmerge. Statistical differences were calculated with Cufflinks v.1.3.0 using q < .05 as a threshold for significance. Only transcripts covering annotated genes were analyzed. On this note, even though Rhox5 is a well-recognized androgen- and AR-regulated SC-expressed gene (19, 20), it was not annotated in Genome Build Mm9, and thus it is not considered in this analysis. MicroRNAs and small nucleolar RNAs were discarded for analysis, because they are generally not associated with ribosomes.
To determine SC-enriched transcripts in P10 and adult testes, enrichment factor (EF) values were calculated using transcript sets assembled from the SCRIBO input and IP fractions of the respective age (for exact description, see Results). Differentially expressed transcripts identified in the P10 IP fractions were matched to their corresponding EFP10 as follows: transcripts more highly expressed in the SCRIBO IP fraction than in the SCARIBO IP fraction were matched to the EFP10 calculated from the SCRIBO input and IP datasets. Likewise, transcripts behaving the other way around were matched to the EFP10 calculated from the SCARIBO input and IP datasets. The rationale behind this procedure was that a more accurate EFP10 value could be calculated from the genotype with the highest expression level of the transcript. Differentially expressed transcripts with EFP10 values lower than that of Acta2 in the respective dataset were considered background and eliminated from further analysis. As was reported by Sanz et al (21), we found that Spnb1 and Etl4 transcripts were highly enriched (21). Because these were described as artifacts, they were discarded from analysis.
Quantitative PCR (qPCR)
cDNA was prepared from 500 ng of RNA for input samples and 100 ng of RNA for IP samples, using an iScript RT kit, according to the manufacturer's protocol (Bio-Rad Laboratories). The PCR mix was made using iQ SYBR Green Supermix (Bio-Rad Laboratories), and PCR was performed using a iCycler real-time PCR machine, according to the manufacturer's protocol (Bio-Rad Laboratories). The production of the amplicon was measured by SYBR green fluorescence, and the threshold cycle (Ct) values were calculated. The Ct values obtained were normalized to that for the transcript encoding the ribosomal protein RPL19 (L19). All primers used are defined in Supplemental Table 2.
Results
Generation and phenotypic analysis of SCRIBO and SCARIBO mice
To obtain the specific RNA fractions needed for this study, we generated 2 transgenic mouse strains. The first is the SC RiboTag (SCRIBO) mouse, which has the RiboTag allele activated specifically in SCs (AMHCre+/−; Ar+/Y;RiboTagfl/+). The second model is the SC AR knockout RiboTag (SCARIBO) mouse, which we generated by introducing a floxed Ar allele into the SCRIBO model by mating (AMHCre+/−;Arfl/Y;RiboTagfl/+). The first mouse strain allows identification of the complete translome in SCs, whereas the second mouse strain allows identification of AR-regulated transcripts within the SC translome (Figure 1, A and B).
To determine whether the activated RiboTag allele had an unintended effect on the male reproductive tract, we bred RiboTag mice with mice harboring the different combinations of genetic mutations involved in this study and screened the progeny for reproductive abnormalities. Mice heterozygous for the RiboTag allele were previously reported to not have any defects, including reproductive defects (16), and thus we used them as controls. As shown in Supplemental Figure 1, male mice carrying the RiboTag allele alone or together with the floxed Ar allele or the anti-Müllerian hormone (AMH)-Cre transgene (ie, SCRIBO mice) did not show significant differences in body weight or reproductive organ weight. In contrast, SCARIBO mice, which lack ARs in SCs, exhibited significant reductions in testes weight (−66%) and epididymal weight (−35%), as expected given the crucial roles of ARs in spermatogenesis (6–9). Indeed, the phenotype of SCARIBO mice mirrors that of SCARKO mice (6). Because the introduction of the RiboTag allele did not cause measurable phenotypic effects, we used SCRIBO mice as the control mice for our studies below.
A blueprint of SC-specific gene expression
To determine the efficacy of the RiboTag approach, we examined genes with known cell type–specific expression patterns in the testis. If the approach works efficiently, IP of SCRIBO mice testes extracts with an anti-HA antibody should enrich for mRNAs specifically expressed in SCs but not for mRNAs expressed in other testicular cell types. To assess this, we tested the input and IP fractions from the testes of P10 SCRIBO mice for the expression of Rhox5, Cyp17a1, and Sycp3, which were previously shown to be specifically expressed in SCs, LCs, and GCs, respectively (19, 22, 23). We found that the level of Rhox5 mRNA was considerably higher in the IP fraction than in the input fraction, as expected for a SC-specific gene (Figure 1C). In contrast, Cyp17a1 and Sycp3 mRNA were almost undetectable in the IP fractions (Figure 1C). To further examine specificity, we tested the effect of loss of AR, which the Rhox5 gene requires for expression (19), and found that Rhox5 mRNA level was strongly down-regulated in the IP fraction of SCARIBO mice (Figure 1C). Finally, we examined the expression of Ar itself, which is expressed not only in SCs but also in LCs and PTMs in the testis (5). Consistent with Ar not being SC specific, we found that Ar mRNA was less enriched in the IP fraction of SCRIBO mice than was the SC gene Rhox5. Consistent with the SC-specific deletion of AR in SCARIBO mice, the level of Ar mRNA was dramatically decreased in the SCARIBO IP fraction relative to that in the SCRIBO IP fraction (Figure 1C).
To define the SC translome in mice, we compared the abundance of individual gene transcripts in the input and IP fractions of SCRIBO testes. Transcript levels were expressed as fragments per kilobase of exon per million fragments mapped (fpkm), which is a standard measure of transcript abundance for RNA-seq experiments. From these values, an EF for each transcript was calculated from the ratio of the abundance (ie, the fpkm value) of that transcript in the IP fraction relative to its abundance in the input fraction. Thus, the EF can be regarded as indicating the relative abundance of a given transcript on SC ribosomes compared with the abundance of that transcript in the total testicular RNA pool. The EF value also provides information on the spatial expression of a gene in the testis. Genes expressed (at both the transcription and translation level) exclusively in SCs will give rise to mRNAs bound to HA-tagged SC ribosomes and thus will be highly enriched in the IP fraction compared with input (ie, total testes) fraction. As a result, SC-specific genes will tend to have high EF values. In contrast, genes lowly expressed (at either the transcription or translation level) in SCs will give rise to few mRNAs in the IP fraction, compared with those in the input fraction and thus will have a low EF value. Finally, genes that are ubiquitously expressed (ie, expressed in both SCs and non-SCs) will have EF values that lie in between those described above. This principle is illustrated in Figure 1D, which shows EF values for well-characterized testicular genes and some housekeeping genes.
The adult SC translome
Among the genes with well-characterized SC-specific expression in the adult testis, we found that Stra6 had the lowest EF value (2.39). Thus, we chose this value as the lowest adult enrichment factor (EFadult) value for genes with predominant SC expression in the adult testis. Acta2, a PTM– and blood vessel smooth muscle cell–expressed gene, had the highest EFadult value (0.13) among genes known not to be expressed in SCs, and thus we used this value as the upper limit for non-SC–expressed genes (Figure 1D). Using these parameters, we defined 3 categories of genes: I, those with predominant expression in SCs (EFadult ≥2.39); II, those with predominant expression in testicular cells other than SCs (EFadult ≤0.13); and III, those expressed in both SCs and at least one other testicular cell type (2.39 > EFadult > 0.13). Using these thresholds, this analysis placed 508 transcripts in category I: the predominant SC category. The 50 most-enriched category I mRNAs are shown in Table 1 (for a full list, see Supplemental File 1). Among these genes were those whose expression in SCs uniquely was demonstrated previously (Cldn11, 2.69; Clu, 3.46; Cst12, 3.43; Fshr, 2.43; Gata1, 3.37; Inha, 3.64; Inhbb, 2.50; Tubb3, 3.49; and Wt1, 2.65); also included were some genes for which this was suggested or suspected, but not unequivocally demonstrated (Drd4, 2.47; Eppin, 2.49; Serpina5, 2.45; and Tsx, 2.42) (10, 24–26). Genes that were previously shown to be expressed in both SCs and other testicular cells exhibited intermediate EFadult values, providing validation of our assay. Examples include Ar (EFadult = 0.84; expressed in LCs, PTMs, and SCs [5]), Vim (EFadult = 1.86; expressed in adult SCs, PTMs, and endothelial cells of blood vessels [27]), and Cdkn1b (p27Kip1; EFadult = 1.25; expressed in SCs and LCs [28]). Interestingly, we found that housekeeping genes commonly used for normalization of gene expression exhibited significant differences in EFadult values, suggesting that their expression varies in different testicular cell types. We found that they could be divided into 2 groups: group I housekeeping genes were modestly SC enriched (Actb, EFadult = 1.67; Gapdh, EFadult = 1.71; and Pgk1, EFadult = 1.89), whereas group II housekeeping genes were less SC enriched (Hprt, EFadult = 0.92; B2m, EFadult = 1.01; and Rpl19, EFadult = 0.96).
Table 1.
mRNAs Predominantly Translated in SCs
| P10 |
Adult |
||||
|---|---|---|---|---|---|
| Gene Name | EFP10 | fpkm (IP) | Gene Name | EFadult | fpkm (IP) |
| Chchd10 | 4.36 | 565.1 | Chchd10 | 4.37 | 579.3 |
| Aard | 4.30 | 3293.8 | Aard | 4.20 | 3328.4 |
| Defb36 | 4.19 | 530.4 | Defb36 | 4.14 | 541.2 |
| Wfdc10 | 4.18 | 938.3 | Wfdc10 | 4.19 | 948.9 |
| 6030429G01Rik, Tnni3 | 4.03 | 462.2 | 6030429G01Rik, Tnni3 | 4.00 | 477.3 |
| Bex2 | 4.02 | 321.3 | Bex2 | 4.01 | 334.8 |
| Cldn26 | 3.73 | 349.9 | Cldn26 | 3.74 | 363.1 |
| Etd | 3.69 | 315.3 | Etd | 3.61 | 318.2 |
| Defb19 | 3.66 | 2108.1 | Defb19 | 3.55 | 2086.9 |
| Inha | 3.64 | 911.3 | Inha | 3.64 | 942.1 |
| Cpe | 3.64 | 1165.3 | Cpe | 3.56 | 1167.6 |
| Basp1 | 3.60 | 452.6 | Basp1 | 3.48 | 597.4 |
| Ldhb | 3.56 | 1015.9 | Ldhb | 3.54 | 1032.7 |
| Efhd2 | 3.54 | 321.7 | Efhd2 | 3.63 | 385.4 |
| Tubb3 | 3.49 | 272.6 | Tubb3 | 3.49 | 280.1 |
| Clu | 3.46 | 4238.5 | Clu | 3.46 | 4325.4 |
| Cst12 | 3.43 | 1738.5 | |||
| Gamt | 3.40 | 319.9 | Gamt | 3.36 | 325.7 |
| Gstm6 | 3.39 | 852.1 | Gstm6 | 3.36 | 869.6 |
| Amhr2 | 3.35 | 589.8 | |||
| Ctsl | 3.33 | 1770.3 | Ctsl | 3.26 | 1762.0 |
| Cited1 | 3.31 | 468.8 | Cited1 | 3.28 | 478.7 |
| Spint2 | 3.22 | 411.4 | Spint2 | 3.17 | 418.9 |
| Cst9 | 3.21 | 1812.3 | Cst9 | 3.20 | 1817.8 |
| Chchd2 | 3.15 | 840.2 | Chchd2 | 3.20 | 892.3 |
| Gstm1 | 3.14 | 1583.7 | Gstm1 | 3.10 | 1614.7 |
| Gstm7 | 3.02 | 452.7 | Gstm7 | 3.01 | 467.9 |
| Gatm | 2.99 | 1190.2 | Gatm | 2.92 | 1187.5 |
| Gsta4 | 2.93 | 548.6 | Gsta4 | 2.90 | 557.3 |
| Gstm2 | 2.92 | 1517.5 | Gstm2 | 2.88 | 1548.3 |
| Sin3b | 2.88 | 992.7 | Sin3b | 2.87 | 1023.2 |
| Fxyd6 | 2.87 | 446.0 | Fxyd6 | 2.86 | 453.2 |
| Tmem184a | 2.82 | 700.8 | Tmem184a | 2.80 | 715.6 |
| Mgst1 | 2.77 | 343.9 | Mgst1 | 2.73 | 345.0 |
| Cldn11 | 2.76 | 839.6 | Cldn11 | 2.70 | 838.8 |
| Pebp1 | 2.73 | 957.4 | Pebp1 | 2.70 | 971.5 |
| Itm2c | 2.70 | 350.5 | Itm2c | 2.67 | 356.9 |
| Ttyh1 | 2.69 | 270.5 | |||
| Tmsb4x | 2.68 | 1541.7 | Tmsb4x | 2.62 | 1550.8 |
| Aldoa | 2.66 | 571.5 | Aldoa | 2.64 | 584.2 |
| Prdx2 | 2.66 | 469.8 | Prdx2 | 2.61 | 468.3 |
| Ndfip1 | 2.61 | 694.1 | Ndfip1 | 2.60 | 688.1 |
| Abhd4 | 2.61 | 461.2 | Abhd4 | 2.58 | 468.3 |
| Atp1a1 | 2.60 | 434.5 | Atp1a1 | 2.55 | 440.1 |
| AU015836 | 2.59 | 273.0 | |||
| Etnk2 | 2.58 | 314.5 | Etnk2 | 2.80 | 297.5 |
| Daxx, Tapbp, Zbtb22 | 2.53 | 281.8 | |||
| Akr1b3 | 2.51 | 691.5 | Akr1b3 | 2.48 | 700.3 |
| Sdc4 | 2.47 | 375.7 | Sdc4 | 2.40 | 375.6 |
| Mro | 2.45 | 270.6 | Mro | 2.43 | 277.3 |
| 8030411F24Rik, Cst12 | 3.43 | 1876.8 | |||
| Amh | 4.75 | 412.9 | |||
| Amhr2, Sp1 | 2.98 | 622.6 | |||
| Anxa2 | 2.42 | 355.1 | |||
| Clic1, Ddah2 | 2.41 | 319.0 | |||
Listed are the 50 most abundant mRNAs detected by RNA-seq analysis in the IP fraction of P10 and adult SCRIBO testis, ordered by EFP10. Transcripts have been gene name matched to allow comparison.
To determine the veracity of the RNA-seq data, we performed qPCR analysis on selected members of 2 gene families that harbor several family members that are expressed in the adult testis: the Rhox gene cluster and the Septin genes (Figure 1E). Rhox5 had a high EFadult value, consistent with its known SC-specific expression pattern (19, 29). Rhox8 is also likely to be translated specifically in SCs, because its EFadult value slightly exceeded even that of Rhox5. All other Rhox genes tested had low EFadult values, including Rhox10 and Rhox13, which are known to be expressed exclusively in GCs (30, 31). Of the septin family, Sept6, Sept9, and, to a lesser extent, Sept11 were found to have high EFs and thus are probably expressed in an SC-specific fashion. The low EFadult values of Sept3 and Sept8 suggested that their expression is probably restricted to non-SCs, whereas Sept2 and Sept7 have intermediate EFadult values, suggesting that they are expressed in both SCs and non-SCs.
Prepubertal SC translome
To define the prepubertal (P10) SC translome, we calculated EF values (EFP10) in the same way that we calculated EFadult values. Category limits were set using the same approach as before, with Acta2 (EFP10 = 0.13) and Stra6 (EFP10 = 2.45) being the “threshold transcripts.” Category threshold values were set as follows: I, EFP10 = ≥2.45 (predominant expression in SCs); II, EFP10 = ≤0.13 (predominant expression in testicular cells other than SCs); and III, 2.45 = >EFP10>0.13 (expression in both SCs and at least one other testicular cell type). Using these thresholds, this analysis placed 501 genes in the predominant SC category. The 50 most-enriched mRNAs in this category are shown in Table 1 (the full list is in Supplemental File 1). Most of these mRNAs had EFP10 values very similar to their EFadult values. For example, most mRNAs with predominant SC EF values at adult age were also in the predominant SC category at P10 (eg, Fshr, 2.50; Tubb3, 3.49; Gata1, 3.42; Wt1, 2.65; Clu, 3.43; Eppin, 2.51; Cldn11, 2.76; Serpina5, 2.50; Drd4, 2.53; Cst12, 3.43; Gata6, 2.65; Inha, 3.64; Inhbb, 2.58 and Tsx, 2.45). Finally, like the adult translome, the postnatal translome had 2 categories of housekeeping mRNAs: group I, which were modestly SC enriched (Actb, EFP10 = 1.70; Gapdh, EFP10 = 1.71; and Pgk1, EFP10 = 1.92); and group II, which were more weakly SC enriched (Hprt, EFP10 = 0.95; B2m, EFP10 = 1.04; and Rpl19, EFP10 = 0.96).
Functional analysis of highly SC-enriched genes
To investigate whether particular cellular processes and/or pathways are enriched among SC-enriched genes, we performed gene ontology (GO) analysis using the DAVID functional annotation tool (32, 33). We found that the SC-enriched genes (with EF value greater than that for Stra6, as described above) expressed in both the postnatal and adult testes exhibited significant overrepresentation for glutathione metabolism, metabolism of xenobiotics by cytochrome P450, and general drug metabolism pathways (Supplemental Table 3). Consistent with these findings, the molecular functions overrepresented included glutathione transferase activity and enzymes transferring alkyl or aryl (other than methyl) groups. Examination of the particular genes in these categories revealed that a large number of glutathione S-transferase (GST) genes (Gsta1, Gsta2, Gsta3, Gsta4, Gstm1, Gstm2, Gstm3, Gstm6, Gstm7, Mgst1, and Gm10639) exhibit SC-enriched expression. Other molecular categories overrepresented at both ages included peptidase inhibitor activity, enzyme inhibitor activity, and endopeptidase inhibitor activity. At adult age, genes encoding for proteins with serine-type endopeptidase inhibitor activity were also overrepresented. Last, GO analysis revealed that transcripts encoding proteins expressed in the extracellular region are overrepresented in both the postnatal and adult SC-enriched genes (Supplemental Table 3). In the Discussion, we describe the possible significance of these results.
The SC fingerprint is defined early in development
SCs are known to undergo dramatic changes in their characteristics between P10 and adulthood, including a shift from a proliferative to a highly differentiated cell state (for a review, see Ref. 34). To examine whether this is accompanied by a shift in the SC transcription program, we compared the SC-enriched genes (EF > Stra6) at P10 with those in the adult. We were surprised to find a large degree of overlap between SC-enriched transcripts, which we term the “SC fingerprint,” at these 2 stages of development: 426 of the SC-enriched transcripts in P10 and adult testes were in common (85% and 84% of the total, respectively). This result suggests that the SC-specific gene expression program is largely set at the onset of spermatogenesis and that only a small proportion of highly SC-enriched genes contribute to SC maturation. Among these 426 common transcripts, 11 exhibited a >30% difference in expression level (fpkm value) between the P10 and adult stages. Those that increased in expression between P10 and the adult stage were Mybpc1 (×8.74), Basp1 (×3.26), Itgad (×1.92), Als2cr12 (×1.65), Jakmip3 (×1.57), Hrasls (×1.33), and Ntn4 (×1.31); those that decreased were Ak7 (×0.56), Mybph (×0.66), Sncb (×0.68), and E330021D16Rik (×0.68). We suggest that these differentially expressed transcripts are candidates to encode proteins involved in the switch between the prepubertal and adult SC program.
Identification of new AR-regulated genes using RNA-seq analysis
To identify AR-regulated genes, we compared the RNA-seq datasets from the SCRIBO mice described above with the RNA-seq datasets we generated from SCARIBO mice, which lack ARs in SCs. P10 testes were used for this analysis, because we previously established that loss of ARs in SCs at this early postnatal age does not cause detectable differences in cellular composition of the testis, thereby allowing unambiguous analysis of alterations in gene expression (10). A comparison of the RNA-seq datasets from total testicular RNA from these 2 mouse strains revealed that 938 transcripts (of 22 648 transcripts assessed) exhibited statistically significant (q < .05) differences in expression. The 50 most-regulated genes are shown in Table 2 (see Supplemental File 2 for the full gene list). Remarkably, only a relatively small number of these genes (244 [26%]) had been identified in a previous study that used microarray analysis to identify AR-regulated genes in testes from P10 mice of essentially the same genotype, ie, SCARKO (AMHCre+/−;Arfl/Y) (10). All 244 of these genes showed the same trend in expression (up or down) as in this previous study, confirming the veracity of our analysis.
Table 2.
AR-Regulated Transcripts in P10 Testes
| AR-Stimulated Transcripts |
AR-Repressed Transcripts |
||||
|---|---|---|---|---|---|
| Transcript Name | Log2 (SCARIBO/SCRIBO) | EFP10 | Transcript Name | Log2 (SCARIBO/SCRIBO) | EFP10 |
| Cck | −4.634 | 3.150 | Vkorc1l1 | 3.852 | 0.986 |
| Gja6 | −4.427 | 2.132 | Ky | 3.533 | 2.288 |
| 4930595M18Rik | −3.575 | 1.796 | Dcaf5 | 2.380 | 1.746 |
| 1700024P16Rik | −3.491 | 1.474 | Rnf26 | 2.360 | 0.241 |
| Defb45 | −3.415 | 3.435 | Gchfr | 2.300 | 1.518 |
| Gm648 | −3.398 | 2.670 | D630023F18Rik | 2.188 | 1.483 |
| Corin | −3.195 | 1.379 | Fhod3 | 2.107 | 2.127 |
| Eppin | −3.071 | 2.506 | Mob3b | 2.065 | 2.814 |
| Tsx | −2.982 | 2.459 | Crym | 2.023 | 4.532 |
| Tmem52 | −2.891 | 2.779 | Scin | 1.991 | 2.580 |
| Pde4dip | −2.791 | 0.285 | Gnmt | 1.954 | 0.349 |
| Drd4 | −2.441 | 2.535 | Thsd7b | 1.924 | 1.779 |
| Rab40c | −2.438 | 0.797 | Sema3d | 1.871 | 2.343 |
| Shc4 | −2.438 | 1.178 | Jakmip2 | 1.767 | 1.900 |
| Casc1 | −2.401 | 2.507 | Krt18 | 1.731 | 2.769 |
| Pde4dip | −2.209 | 1.858 | 4930486L24Rik | 1.682 | 3.970 |
| Ncrna00086 | −2.199 | 2.005 | 1810041L15Rik | 1.571 | 1.426 |
| Jakmip3 | −2.129 | 0.424 | Myl1 | 1.552 | 3.370 |
| 1700018G05Rik | −2.119 | 3.707 | Mki67 | 1.521 | ND |
| Susd3 | −2.069 | 2.797 | Fabp9 | 1.488 | 0.062 |
| Zcchc18 | −2.068 | 1.842 | 1110032F04Rik | 1.384 | 2.801 |
| Jakmip3 | −2.051 | 3.250 | Hepacam | 1.374 | 2.405 |
| Sept14 | −2.034 | 1.485 | Bhlhe40 | 1.372 | 1.704 |
| Expi | −2.019 | 4.143 | Nnmt | 1.360 | 3.561 |
| 5031414D18Rik | −2.017 | 1.790 | Dnahc10 | 1.343 | 0.149 |
| Usp24 | −1.916 | 0.364 | Gpr39 | 1.341 | 2.040 |
| Dlx4 | −1.910 | 0.066 | Clca2 | 1.302 | 2.394 |
| Nxf3 | −1.860 | 1.582 | Cttnbp2 | 1.300 | 0.810 |
| Mcf2 | −1.858 | 1.854 | Dsc2 | 1.278 | 2.468 |
| L3mbtl4 | −1.769 | 1.575 | Hrasls | 1.267 | 2.163 |
| Shc4 | −1.762 | 1.937 | Hsbp1l1 | 1.245 | 2.897 |
| Car7 | −1.630 | 2.086 | Cxadr | 1.234 | 0.924 |
| Gm4980 | −1.618 | 1.948 | Mdga1 | 1.224 | 1.826 |
| Mageb16 | −1.598 | 1.622 | Bhlhe22 | 1.213 | 3.144 |
| Slc9a2 | −1.578 | 1.208 | Kcnj3 | 1.167 | 1.601 |
| B4galnt1 | −1.562 | 2.192 | Adm | 1.131 | 1.106 |
| Car5b | −1.512 | 1.702 | Wwtr1 | 1.087 | 1.040 |
| Tmem117 | −1.500 | 1.834 | Bcan | 1.083 | 2.717 |
| Cdkn2b | −1.483 | 2.455 | 1700029M20Rik | 1.081 | 0.100 |
| Nags | −1.479 | 2.719 | Fgfbp3 | 1.080 | 0.721 |
| Pdzd7 | −1.472 | 1.283 | Sp5 | 1.053 | 3.458 |
| Dmrtc1b | −1.468 | 2.115 | Car13 | 1.048 | 1.530 |
| Arhgap31 | −1.467 | 1.105 | Rgs9bp | 1.046 | 1.609 |
| Tpd52l1 | −1.443 | 2.732 | 1520402A15Rik | 1.045 | 0.374 |
| Tbx22 | −1.439 | 1.194 | Kctd19 | 1.045 | 0.074 |
| Wfdc8 | −1.431 | 0.713 | Kcnq5 | 1.021 | 1.360 |
| Slc13a4 | −1.420 | 1.292 | Cyp2u1 | 1.016 | 1.304 |
| Zic3 | −1.419 | 1.533 | Heyl | 1.005 | 0.800 |
| Mageb16-ps1 | −1.402 | 1.360 | Fbln2 | 1.002 | 1.764 |
| Gm9112 | −1.393 | 3.596 | Fgf18 | 0.993 | 2.000 |
Abbreviation: ND, level too low for EF calculation. Listed are AR-stimulated and AR-repressed transcripts in P10 input fractions with an fpkm >1 in either SCRIBO or SCARIBO and their corresponding EFP10 value, ordered by decreasing fold regulation.
Of the 938 differentially expressed mRNAs that we defined by RNA-seq analysis, 497 were higher in SCRIBO than in SCARIBO testes (ie, stimulated by ARs) and 441 were higher in SCARIBO testes than in SCRIBO testes (down-regulated by AR) (Figure 2B). Approximately 20% of these were regulated more than 2-fold: 103 were stimulated by AR and 84 were down-regulated by AR. To determine the validity of these RNA-seq results, we performed qPCR analysis (Figure 2A). This confirmed the identity of both previously identified AR–up-regulated genes (Corin, Esyt3, and Mcf2) (10) and those identified as AR–up-regulated for the first time by our RNA-seq analysis herein (Drp2, Gja6, Nxf3, and Sept14). qPCR analysis also confirmed the regulation of 2 AR–down-regulated genes that we identified by RNA-seq analysis: Ky and Emilin3, the former of which had not previously been identified as an androgen-regulated gene. Finally, as a negative control, we tested genes that did not exhibit differential expression according to our RNA-seq analysis (Hic1, Nutf2, and Wfdc15a) and found that, indeed, they were not differentially expressed, as judged by qPCR analysis (Figure 2A).
Figure 2.
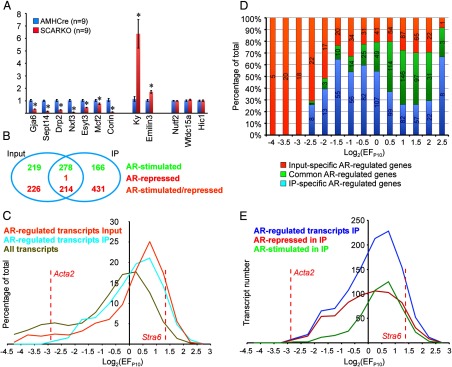
Androgen-regulated transcripts in the input and IP fractions. A, qPCR confirmation in P10 SCARKO and AMHCre (control) total testis RNA of AR-regulated transcripts identified from the input fraction in this study. Data are expressed relative to Rpl19 mRNA levels and are presented as mean ± SEM.*, P < .05. B, Transcripts up-regulated (green) and down-regulated (red) by AR, based on analysis of the input (n = 938) and IP fractions (n = 1090) from P10 SCRIBO and SCARIBO testes. Orange, up-regulated in IP but down-regulated in the input fraction. C, EF analysis of AR-regulated transcripts in input (n = 930) and IP (n = 1082) fractions, and the total testis transcriptome (total n = 14 598), displayed as a percentage of the total. D, EF analysis, performed as in panel C, of all identified AR-regulated transcripts displayed according to the fraction in which they were identified. The number of genes in each fraction is indicated in the respective bars. E, Transcripts up- and down-regulated by AR, based on analysis of the IP fraction from P10 SCRIBO and SCARIBO testes, plotted according to their EF value. Values are expressed as absolute gene numbers.
RiboTag technique unveils hidden androgen-regulated genes in SCs
One drawback of sampling gene expression changes in an entire organ is that this often cannot detect gene expression changes occurring in only one cell type within that organ. Even large changes in gene expression will be below the limits of detection if the cell population in question is only a minor constituent of the whole cell population. As described in the Introduction, the RiboTag technique allows one to circumvent these problems by preferentially isolating RNA from a specific population of cells out of an organ containing a complex mixture of cells. To identify genes specifically regulated by ARs in SCs, we compared the RNA-seq datasets from the P10 SCRIBO and SCARIBO IP fractions. This revealed that 1123 genes were significantly differentially expressed (q < .05) in SCs in response to loss of ARs. Table 3 contains the 50 most up- and down-regulated genes (the full gene list is in Supplemental File 2). When matched to their EFP10 factors (see Materials and Methods for explanation), 33 of these genes (2.9%) had EFs lower than the Acta2 threshold value, strongly suggesting they are not expressed in SCs. These genes, which included well-known GC-expressed genes such as Stra8, Sycp2, Sycp3, and Tex15, were consequently considered background and eliminated from our analysis, leaving 1090 transcripts as being significantly regulated in SCs. Inspection of the list of SC-translated mRNAs up-regulated by AR signaling revealed many not previously known to be downstream of AR signaling or involved in male reproduction (Table 3). Intriguingly, the SC-translated mRNA most down-regulated by AR signaling encodes FOXL2, a transcription factor that drives female gonad development (35), raising the possibility that ARs repress the female developmental program (see Discussion).
Table 3.
AR-Regulated Transcripts in P10 SCs
| AR-Stimulated Transcripts |
AR-Repressed Transcripts |
||||
|---|---|---|---|---|---|
| Transcript Name | Log2 (SCARIBO/SCRIBO) | EFP10 | Transcript Name | Log2 (SCARIBO/SCRIBO) | EFP10 |
| Drd4 | −7.137 | 2.535 | Foxl2 | 3.953 | 2.751 |
| Defb45 | −4.587 | 3.435 | Ccnd1 | 3.066 | 0.792 |
| Cck | −4.423 | 3.150 | Tmem132c | 2.928 | 1.031 |
| Gja6 | −4.246 | 2.132 | Myl1 | 2.806 | 3.370 |
| Tmem52 | −4.199 | 2.779 | Isg15 | 2.679 | 1.064 |
| Fam107a | −4.033 | 1.052 | Il1rn | 2.502 | 3.150 |
| Gm648 | −3.927 | 2.670 | Ky | 2.343 | 2.288 |
| 1700024P16Rik | −3.778 | 1.474 | Pdlim4 | 2.252 | 0.674 |
| Corin | −3.298 | 1.379 | Krt18 | 2.182 | 2.769 |
| 4930595M18Rik | −3.190 | 1.796 | D630023F18Rik | 2.135 | 1.483 |
| Eppin | −2.887 | 2.506 | Crym | 2.094 | 4.532 |
| Arhgap31 | −2.804 | 3.390 | Fhod3 | 1.992 | 2.127 |
| Cdkn2b | −2.770 | 2.455 | Wscd1 | 1.939 | 1.548 |
| Klf15 | −2.752 | 1.590 | Ptges | 1.876 | 2.180 |
| Mageb16 | −2.587 | 1.622 | Clca2 | 1.872 | 2.394 |
| Zcchc18 | −2.507 | 1.842 | Hs3st1 | 1.859 | 1.585 |
| Mycs | −2.476 | 2.908 | P2ry1 | 1.826 | 1.050 |
| Tsx | −2.428 | 2.459 | Scin | 1.824 | 2.580 |
| Clstn1 | −2.406 | 1.749 | Gm826 | 1.814 | 2.942 |
| Olfml3 | −2.381 | 0.280 | Gm5077 | 1.806 | 0.858 |
| Mageb16-ps1 | −2.342 | 1.360 | C1s | 1.773 | 0.982 |
| Ncrna00086 | −2.267 | 2.005 | Cyp2u1 | 1.751 | 1.304 |
| Fcer1g | −2.256 | 0.564 | Car13 | 1.741 | 1.530 |
| Mybpc1 | −2.241 | 2.592 | Tnmd | 1.740 | 1.801 |
| Susd3 | −2.239 | 2.797 | Anxa1 | 1.692 | 1.475 |
| Car7 | −2.232 | 2.086 | Sema3d | 1.689 | 2.343 |
| Arhgap31 | −2.080 | 1.105 | Dsg2 | 1.665 | 1.386 |
| 6030408B16Rik | −2.041 | 0.737 | Gm16701 | 1.659 | 1.192 |
| Lrrc4 | −1.976 | 0.878 | Tgfb2 | 1.636 | 0.512 |
| Nxf3 | −1.965 | 1.582 | Sertad4 | 1.628 | 1.639 |
| Pde4dip | −1.939 | 1.858 | Clic5 | 1.624 | 1.404 |
| Tmem117 | −1.884 | 1.834 | Cryab | 1.618 | 0.731 |
| 5031414D18Rik | −1.874 | 1.790 | Mfsd6 | 1.609 | 0.775 |
| Glul | −1.859 | 0.595 | Adcyap1r1 | 1.596 | 1.282 |
| Shc4 | −1.841 | 1.178 | Sntb1 | 1.594 | 0.894 |
| Dnm3 | −1.801 | 1.564 | Jakmip2 | 1.588 | 1.900 |
| Brsk1 | −1.784 | 1.011 | Slc4a8 | 1.577 | 0.701 |
| Shc4 | −1.775 | 1.937 | Sgms2 | 1.561 | 0.735 |
| Sept14 | −1.753 | 1.485 | Gchfr | 1.555 | 1.518 |
| Ar | −1.736 | 0.889 | Lass4 | 1.552 | 0.519 |
| Card10 | −1.706 | 0.662 | 4930486L24Rik | 1.549 | 3.970 |
| Slc38a5 | −1.704 | 1.872 | Clca1 | 1.530 | 0.326 |
| Lrp8 | −1.693 | 1.169 | Mdga1 | 1.528 | 1.826 |
| Lrrn4 | −1.665 | 1.087 | Lpar4 | 1.528 | 0.763 |
| Jakmip3 | −1.664 | 3.250 | Hepacam | 1.526 | 2.405 |
| Atp2b4 | −1.632 | 0.778 | Gas1 | 1.518 | 1.279 |
| Bbx | −1.631 | 1.787 | Nnmt | 1.518 | 3.561 |
| Mfsd4 | −1.625 | 0.343 | Gm98 | 1.511 | 0.530 |
| Aif1l | −1.557 | 0.326 | Efs | 1.486 | 1.016 |
| Tbc1d8 | −1.539 | 1.680 | Tcte2 | 1.472 | 1.060 |
Listed are AR-stimulated and AR-repressed transcripts in P10 IP fractions with fpkm >1 in either SCRIBO or SCARIBO and their corresponding EFP10 values, ordered by decreasing fold regulation.
GO analysis revealed that the proteins encoded by the full spectrum of SC-expressed AR-regulated genes are enriched for calcium ion binding, cytoskeletal protein binding, actin binding, and biological adhesion functions (Table 4). Proteins active at the plasma membrane and in cell-cell junction and anchoring junctions were also enriched, as well as proteins located at the stereocilium. A complete list of all overrepresented categories with corrected P < .05 is shown in Supplemental Table 6.
Table 4.
Categories Overrepresented in AR-Regulated Genes
| Function | Corrected P Value |
|---|---|
| Molecular function | |
| Calcium ion binding | 1.3e − 5 |
| Cytoskeletal protein binding | 3.2e − 5 |
| Actin binding | 4.2e − 4 |
| Biological process | |
| Biological adhesion | 8.1e − 3 |
| Cellular compound | |
| Plasma membrane | 3.5e − 5 |
| Plasma membrane part | 3.6e − 5 |
| Cell junction | 4.3e − 5 |
| Cell-cell junction | 9.4e − 5 |
| Anchoring junction | 1.0e − 3 |
| Stereocilium | 5.7e − 3 |
DAVID analysis of all 1090 transcripts significantly differentially expressed between IP samples from SCRIBO vs SCARIBO P10 testes. P values are corrected for multiple testing using the Benjamini technique (corrected P < .01)
To determine whether the RiboTag technique identified AR-regulated genes not detectable in whole testes, we compared the input and IP datasets from SCRIBO and SCARIBO mice. We found that more than half of the genes identified as significantly differentially expressed in response to loss of ARs in the IP (ie, SC-expressed) dataset (597 of 1090) were not identified as significantly differentially expressed in the input (ie, whole testes) datasets (Figure 2B). Thus, a very sizable fraction (55%) of AR-regulated genes in SCs escaped detection when whole testes were analyzed. The complete list of all AR-regulated genes in this dataset is shown in Supplemental File 2. GO analysis revealed a significant (corrected P < .05) overrepresentation of proteins with molecular functions involved in calcium ion binding, cytoskeleton protein binding, and actin binding.
We also assayed for genes that exhibited the converse expression pattern: differential expression in response to AR loss in the input dataset but not the IP dataset. Surprisingly, we found that a large proportion of genes displayed this expression pattern (445 of 938 [47%]) (Figure 2B; for the full gene list, see Supplemental File 2). This finding implies that a major class of genes responding to AR signaling in SCs consists of non–SC-expressed genes. GO analysis of this class of genes revealed a small number of categories enriched, all of which revolve around nucleotide binding (Supplemental Table 4). No specific biological functions were enriched. The discovery of a large class of mRNAs that appear to be significantly AR regulated in non-SCs as a result of AR signaling in SCs underscores the value of using the RiboTag approach in conjunction with conventional whole-tissue analysis.
Finally, we found that 493 genes were significantly AR-regulated in both the input and IP datasets. These are likely to be primarily (or exclusively) expressed in SCs and/or are dramatically regulated by ARs (for the full gene list, see Supplemental File 2). Validity was strongly suggested by our finding that all but 1 of these 493 genes were regulated in the same direction (up- vs down-regulated) regardless of whether they were assayed by RNA-seq analysis from the input or the IP fraction (Figure 2B). This gene set was enriched for those encoding proteins located at cell junctions, cell projections, the cytoskeleton, the stereocilium, and the cell membrane (for a full list, see Supplemental Table 5). Overrepresented molecular functions included NTP-regulator activity, (small) GTPase regulator activity, and transporter and channel activities (for the full list, see Supplemental Table 5).
To assess the distribution of expression patterns of AR-regulated genes, we plotted them according to their EF values. We found that both the input and IP datasets were enriched for transcripts with EFP10 values at the higher end of the spectrum (more SC-enriched) compared with the total testis transcriptome, consistent with the assumption that deletion of ARs in SCs would mainly cause changes in the expression of SC-enriched transcripts. Thus, 67% and 61% of AR-regulated genes defined in the IP and input fractions, respectively, had positive log2 (EFP10) values, compared with only 38% of the total transcript set (Figure 2C). The IP-defined AR-regulated gene set contained a higher percentage of transcripts with EFP10 values in the middle range [log2 (EFP10) values between −2 and 0.5] compared with the input. This finding indicates that the RiboTag approach has greater sensitivity than the total testis approach for identifying AR-regulated transcripts that are not specifically expressed in SCs, which is consistent with the ability of the RiboTag approach to enrich for SC-expressed genes and thereby largely exclude obfuscating gene regulation/expression in other testicular cell types.
As another approach to display the data, we stratified transcripts by different EFP10 values according to whether we defined them as being significantly AR regulated in the IP fraction, in the input, or in both (blue, orange, and green, respectively, in Figure 2D). This stratification profile clearly showed that AR-regulated genes only modestly enriched in SCs [log2 (EFP10] values between −1.5 and 0.5) are more likely to be detected in the IP fraction than in the input. It also showed that AR-regulated transcripts predominantly expressed in SCs [log2 (EFP10) values of >0.5] tend to be detected in both the IP and input fractions.
The RiboTag technique reveals distinct classes of AR–up-regulated and AR–down-regulated genes
Past studies defining AR-regulated genes in the testis have concluded that the AR tends to act as an activator of gene expression (10, 14). In agreement with this conclusion, our RNA-seq analysis of total testis samples showed that 497 genes (53%) were expressed significantly lower in mice lacking AR in SCs, whereas 441 (47%) had the converse expression pattern (RNAs in the “Input” circle in Figure 2B.). However, when we analyzed the genes significantly AR regulated in SCs (ie, defined by the RiboTag approach in SCARIBO mice), we found that more were up-regulated (645 [59%]) than down-regulated (445 [41%]) (RNAs in the “IP” circle in Figure 2B). This finding suggested that the AR acts mainly as a suppressor of gene expression in SCs. This notion was also supported when we only considered mRNAs regulated by ≥2-fold: 60% of the mRNAs (249) were significantly up-regulated and 40% of the mRNAs (163) were down-regulated in SCARIBO mice. An even more striking difference was observed for mRNAs displaying significantly altered expression in only the IP fraction not the input fraction: 72% (431) of those were significantly up-regulated in the SCARIBO mice and 28% (166) were significantly down-regulated in these mice (Figure 2B). Taken together, these data support the contention that AR signaling represses more genes than it up-regulates in SCs.
To address the underlying basis for why SC AR signaling tends to silence genes detected in the IP fraction (enriched in SCs) but tends to activate genes expressed in the input (in the testis as a whole), we plotted AR–up-regulated or AR–down-regulated transcripts according to their EFP10 values (Figure 2E). This analysis clearly showed that the nature of the regulation in response to SC AR signaling (up or down) depends on the degree of SC enrichment. Thus, AR-activated transcripts tended to be modestly enriched in SCs: ∼75% (329 of 441) of these transcripts had positive log2 (EFP10) values. In contrast, only 51% (330 of 641) of AR-suppressed transcripts belonged to this category. Moreover, the EF distribution pattern of AR–down-regulated genes had a clear shoulder toward negative log2 (EFP10) values, suggesting that a significant proportion of AR-suppressed SC-expressed transcripts are predominantly expressed (but not necessarily AR regulated) in non-SCs. In the Discussion, we expand on the possible interpretations of this unexpected finding. We conclude that AR signaling in SCs triggers up- and down-regulation of distinct classes of genes differing in their degree of SC enrichment.
Discussion
A number of pivotal changes observed at the onset of male puberty critically depend on androgens, including the development of secondary sex characteristics, the stimulation of male sexual behavior, and the initiation of spermatogenesis. Although the basic mechanisms by which androgens act are fairly well understood, major questions remain as to the cellular and molecular pathways by which they control the initiation and maintenance of male gametogenesis. Understanding how androgens influence spermatogenesis is important not only for our basic understanding of how this set of steroid hormones function but also for treating medical conditions ranging from infertility to prostate cancer. A major breakthrough has been the discovery that androgens do not act directly on GCs, which largely lack ARs, but rather exert their effects indirectly via somatic cells in the testis that express AR (36). Early studies using morphological and immunohistochemical techniques, combined with androgen withdrawal therapy, implicated the SC as the pivotal mediator of androgen action (1). Unambiguous proof for this hypothesis was presented by 4 laboratories demonstrating that selective inactivation of AR in SCs strongly abrogated at least 2 steps of spermatogenesis: meiotic progression and spermatid maturation (6–9). Although this was a major breakthrough with regard to their cellular site of action, it has remained unclear how androgen action in SCs drives these essential events in the neighboring GCs. A key factor to understanding such mechanisms is to define androgen-regulated genes in SCs. Efforts devoted to this goal have been thwarted by various setbacks. Studies on isolated and cultured SCs have yielded disappointing results (for review, see Ref. 1), in part, because such cells lose androgen responsiveness in culture (37). In vivo studies, although inherently more representative of SCs in their natural environment, have been hampered by a number of confounding factors such as the side effects of hormonal treatments (eg, activation of compensatory feedback mechanisms), the limitations of conventional approaches to identify SC-specific genes, the considerable variation in experimental systems used (wild-type or genetically modified animals), and variables that preclude direct comparisons between different studies (eg, age, species, and genetic background). In this communication, we circumvent most of these drawbacks by using an approach that couples the RiboTag model with RNA-seq analysis. We first use this two-prong approach to define the major mRNAs translated in SCs in both prepubertal and adult mice. Subsequently, we applied the same strategy to mice lacking ARs specifically in SCs to identify genes regulated by AR signaling in SCs. This analysis revealed hundreds of new AR-regulated genes and allowed us to define distinct classes of AR–up-regulated and AR–down-regulated genes according to their degree of enrichment in SCs. Taken together, the gene sets we identified are a valuable resource for understanding the development of SCs and the molecular pathways involved in SC-mediated control of spermatogenesis.
Several previous studies have attempted to identify the repertoire of genes expressed in SCs by using immortalized cell lines, freshly isolated and cultured SCs, or total testes. Many of these studies focused either on the hormonal control of testicular function (1, 12, 14, 38–40) or on fetal testicular development (41, 42). Our analysis introduces 3 further levels of sophistication. First, we used RNA-seq analysis rather than microarray analysis, which allowed us to identify novel genes not annotated by the latter. RNA-seq analysis has the additional advantage that it is considered to be a more quantitative approach than microarray analysis (43). Second, we coupled RNA-seq analysis with the RiboTag approach, which allowed us to focus only on SC-expressed mRNAs that are actively translated and thus most likely to be relevant to SC biology. An additional benefit of the RiboTag approach is that it allowed us to classify mRNAs in terms of their degree of enrichment in SC ribosomes, which in some cases revealed unexpected results, as elaborated on below. Finally, because the RiboTag approach does not depend on cell purification, it avoids contamination by unwanted cell types, an unavoidable complication of physical cell purification procedures. It also avoids alterations in gene expression that may occur during the process of cell purification. Whereas advantageous in many respects, we note that the specificity of the RiboTag approach depends on the nature of the promoter driving CRE recombinase. In the case of the Amh-Cre mice used for our study, CRE expression was previously convincingly shown to be restricted to SCs (6, 17).
GO analysis of the highly enriched SC genes (with EF values > EF[Stra6]), which we refer to as the “SC fingerprint,” revealed that many classes of proteins are clearly overrepresented, including both peptidase and endopeptidase inhibitors (Supplemental Table 3). A surprising finding was that genes encoding GST enzymes were highly overrepresented. As many as 11 of 26 known genes encoding proteins involved in glutathione metabolism are transcribed and translated in SCs. GSTs are phase II detoxification enzymes that are well known for their ability to protect cells from oxidative stress. They serve in this capacity by catalyzing the conjugation of electrophilic xenobiotics, such as carcinogens and mutagens, to the endogenous nucleophile glutathione. Direct evidence that GSTs provide protection against oxidative stress in the testis is that inhibition of GST activity leads to lipid peroxidation product accumulation and GC apoptosis (44). GSTs are also present at the extracellular side of the plasma membrane of male GCs, where they are critical for fertilization (45, 46). Intriguingly, GST enzymes were found to exhibit steroid binding activity and, as such, may also serve other roles in male reproductive function.
We note that Sanz et al (21) also recently used the RiboTag approach to identify SC-expressed genes in vivo. Unlike our study, they used microarray analysis and only analyzed SC-expressed genes in the adult testes. Perhaps because we used different approaches, only 17% of the SC-enriched transcripts that we identified were in the SC-enriched dataset from Sanz et al. Among the mRNAs identified by both studies as being enriched in SCs were those encoding GST enzymes and well-known SC-specific proteins such as FSHR, GATA1, INHA, and TUBB3.
Our analysis of the SC translome in both prepubertal (P10) and adult mice also allowed us to define the set of transcripts whose expression in the testis is highly restricted to SCs at these 2 developmental time points. Given that SCs are still proliferating at P10 and are considered to be relatively undifferentiated, we anticipated that this SC-enriched gene set would be dramatically different from that of adult SCs, which are postmitotic and highly differentiated (34). Thus, we were surprised to see the remarkable similarity of the 2 SC fingerprints: 84% to 85% of the SC-enriched genes in P10 and adult testes are the same. This finding has important implications because it suggests that the gene expression program that uniquely defines the SC is largely set at the very beginning of spermatogenesis. It also raises the possibility that most of the genes that define the SC fingerprint may be involved in general SC functions because such genes would be predicted to be expressed in both immature and mature SCs. For example, most genes expressed primarily in SCs could be involved in metabolism/detoxification or protease/antiprotease balance, as suggested by our GO analysis, rather than specifically in the regulation of spermatogenesis. A corollary of this is that the few genes that do differ in expression between undifferentiated (P10) and differentiated (adult) SCs may be important to define the mature postmitotic functions of SCs. A non–mutually exclusive possibility is that genes expressed in both the P10 and adult SC translome dictate the SC maturation program by undergoing alterations in their expression levels. In other words, quantitative changes in the level of key genes could promote and define the transition from an undifferentiated to a differentiated SC. In our dataset, although only 11 genes common to the P10 and adult SC-enriched datasets exhibited more than a 30% difference in expression level (fpkm value), some of these have properties consistent with their participating in SC maturation. Among them are the genes encoding the myosin-binding proteins, MYBPH and MYBPC1, which have known roles in actomyosin organization (47) and energy metabolism (48). Changes in the expression levels of these genes could either cause or reflect changes in SC maturation status. In addition, the genes encoding NTN4 and ITGAD, which are involved in integrin signaling, are differentially expressed between P10 and adult (49, 50). We suggest that such changes may elicit secondary changes in gene expression or activity as a result of modulation of integrin signaling.
The other major goal of our study was to identify and characterize AR-regulated genes. We chose to assess AR-dependent gene expression at P10, when androgen action is established in SCs (51) and when meiosis is initiated (52). Our RiboTag approach coupled with RNA-seq analysis identified 1217 new AR-regulated genes in the testis and/or SC that had previously escaped detection when whole testes were analyzed by microarray analysis (10). We identified some of these genes by comparing gene expression in total testes samples from mice lacking AR in SCs vs control mice (938 AR-regulated genes were identified in this manner, 694 of which had not been previously shown to be AR regulated when analyzed by microarray analysis). We identified other new AR-regulated genes in SC-enriched testes samples prepared using the RiboTag approach (1090 AR-regulated genes were identified in this manner, 853 of which had not been previously shown to be AR regulated). Part of our success in identifying new AR-regulated genes is attributable to using RNA-seq analysis, which has the potential to identify many genes not detectable by microarray analysis. In addition, by enriching for genes expressed in SCs, the RiboTag approach we used is a more sensitive strategy for identifying genes regulated in SCs. The RiboTag also reduces “noise” signals from non-SCs, thereby facilitating the detection of novel regulated genes. We note that the genes we identified as being regulated by AR almost certainly include both direct and indirect targets. Examples of indirect target genes are those regulated by AR-regulated SC-expressed transcription factors such as RHOX5 (53), as well as those regulated by AR-dependent changes in SC metabolism (54), maturation, barrier formation, and cytoskeletal development (55).
Among the previously unidentified AR-regulated genes were several previously shown to have roles in processes important for male fertility, including Tgfb2 which is involved in SC barrier formation and maintenance (56); Nr5a2, an activator of steroidogenic enzymes (57); Timp1, an inhibitor of matrix metalloproteinases; and Fst, an inhibitor of activin-mediated signaling pathways. Two other AR-regulated genes that we identified, Trf, which encodes an iron-binding glycoprotein important for iron transport to GCs, and Glul, which encodes the enzyme catalyzing the synthesis of glutamine, an important energy-yielding substrate in SCs, were found previously to be regulated by androgens in testis (58) and isolated SCs (59), respectively. Other AR-regulated genes we identified have known roles in vitamin D action (Vdr) and vitamin D metabolism (Cyp27a1), both of which have been a recent focus of attention with regard to testis biology (60). GO analysis of the entire set of AR-regulated SC genes revealed that there was an overrepresentation of genes encoding cytoskeletal protein-binding and actin-binding functions (Table 4). Together with an enrichment of NTPase and GTPase regulator activities (Supplemental Table 6), which are well-known regulators of the actin and microtubular cytoskeleton; the data are consistent with the idea that the AR acts as a regulator of SC cytoskeletal dynamics. We also observed an overrepresentation of genes involved in biological adhesion processes, including those encoding proteins located at cell-matrix, cell-cell, and anchoring junctions, as well as at cellular projections (Supplemental Table 5). This finding suggests that major targets of androgen signaling are genes important for SC interactions with the basal lamina, interactions between SCs at the basal ectoplasmic specialization, and interactions between SCs and GCs at the apical ectoplasmic specialization.
An unexpected finding was that loss of ARs in SCs leads to up-regulation of mRNAs encoding proteins known to promote female gonad development. Most prominent was the dramatic up-regulation (∼15-fold) of Foxl2 mRNA in response to loss of ARs (Table 3). Foxl2 encodes a transcription factor that, when lost, causes the transdifferentiation of an adult ovary into a testes, and thus FOXL2 is considered a key factor that actively maintains ovary identity (35). Together with our observation that one of FOXL2's downstream targets in the ovary (35), Fst, is also up-regulated in response to loss of AR (Supplemental File 2), this suggests that AR signaling may contribute to suppressing the “female expression program” during early postnatal testicular development. Female gonad development is also promoted by WNT signaling (61), and so we examined WNT signaling factors and found that loss of AR significantly up-regulated the levels of SC-expressed mRNAs encoding WNT components and targets (Camk2b, Ccnd1, Ccnd3, Fzd2, Fzd4, Fzd5, Jun, Nfatc1, Plcb3, Ppp2r5a, Sfrp4, Vangl1, and Wnt5a) and down-regulated the levels of mRNAs encoding WNT inhibitors (Porcn and Zic3) (Table 3 and Supplemental File 2). Taken together, these data raise the possibility that AR signaling suppresses WNT signaling and the female gonad differentiation program, but further experiments will be required to directly test these possibilities.
A unique power of the RiboTag approach is that it allows one to classify genes according to their degree of enrichment in the cell type of interest. In our case, we assigned each gene an EF value that reflects its expression in SCs relative to that in the total testes. We confirmed that the EF value reflects a gene's level of expression in SCs relative to that in other testicular cell types by showing that known SC-specific genes have high EF values, whereas genes exclusively expressed in non-SCs have very low EF values (Figure 1D). In addition, as predicted, we showed that ubiquitously expressed genes have intermediate EF values (Figure 1D). We note that it is also theoretically possible that a subset of genes expressed in SCs have low EF values because their encoded mRNAs are poorly translated. Regardless of the underlying mechanism, the EF value contains valuable information that provides an opportunity to analyze genome-wide expression patterns in a new way. To this end, we elected to independently analyze AR-regulated transcripts in the IP fraction and input by EF values (Figure 2D). This analysis allowed us to draw several conclusions, some of which confirmed our intuitive expectations. First, we found that the peak in the EF distribution of genes regulated by AR signaling in SCs (defined in both the IP fraction and input) shifts to the right; ie, toward the more SC-enriched genes (Figure 2D). This enrichment indicates that loss of the AR gene specifically in SCs leads to altered expression of many genes mainly expressed in SCs, at least at P10. Second, we found that the RiboTag approach was more effective than the whole testis approach in identifying AR-regulated genes encoding mRNAs only modestly enriched in SCs; ie, in the lower EF spectrum [log2 (EFP10) = < 0.5; Figure 2D], which was expected because the RiboTag approach would be predicted to cancel out the noise from gene expression in non-SCs. This observation underscores the superior power of this approach.
An unexpected observation of our EF analysis was that transcripts up- and down-regulated by AR in the IP fraction exhibited different EFP10 distributions. AR–up-regulated transcripts tended to cluster together in the higher SC-enrichment region, whereas AR–down-regulated transcripts exhibited a broader distribution (Figure 2C), with a significant subset of AR-repressed genes that have a more ubiquitous expression pattern. The biological explanation for this difference is, at present, unclear. Interestingly, among the more ubiquitously expressed genes repressed by AR are those encoding proteins with SC and/or reproductive functions: TGFB2 (EF = 0.51), a SC barrier disruptor and component (56); FST (EF = 1.00), an inhibitor of SC proliferation that is normally suppressed in the male gonad (62); and NR5A2 (EF = 0.85), an activator of steroidogenic enzymes in granulosa cells (57). Together, these data reveal an intricate pattern of gene regulation that differs from the original simplistic view, based simply on the relative proportion of up- and down-regulated transcripts detectable in the total testis, that AR acts mainly as an activator of transcription in SCs (Figure 2B) (10, 14). To our knowledge, our study is the first to define genome-wide cell type–specific gene regulation within a complex tissue according to the degree of enrichment in specific cell types in vivo.
As described above, the RiboTag approach allowed us to identify a large number of AR-regulated genes in SCs. By comparing our RiboTag dataset with our whole testes dataset, we also identified a surprisingly large number of genes that are AR regulated in non-SCs. Genes in this class were those whose expression was regulated by AR signaling in SCs in the whole testes (ie, the input), but not in the SC-enriched fraction (ie, the IP fraction). The existence of this class of genes, which we found consisted of at least 445 genes, implied that AR signaling in SCs commonly leads to cell-cell communication events that influence gene transcription in non-SCs. Although SC-GC communication has been well documented (63), we were surprised by the pervasiveness of this class of genes: they make up about half (53%) of the AR-regulated transcripts with log2 (EFP10) values of <−1.5 (Figure 2D). Furthermore, these genes accounted for 47% of the AR-regulated genes identified in the input, suggesting that, even at the early developmental time point that we examined (P10), AR signaling in SCs has widespread effects that dictate gene expression events in non-SCs. Overrepresented in this group of genes are those encoding proteins involved in binding to adenyl ribonucleotides, adenyl nucleotides, nucleosides, and ATP (Supplemental Table 4). The functional significance of this finding remains to be determined, but it suggests that androgen signaling in SCs leads them to instruct other testicular cells to alter their nucleic acid and energy metabolism.
In conclusion, our study has defined 2 classes of genes: those transcribed and translated in SCs in vivo and those regulated in response to SC AR signaling in vivo. A further sophistication of our analysis is that we defined, for each of the genes in both of these classes, their relative expression in SCs. We propose that these datasets will be extremely useful for future studies on the topics of hormone action, reproductive biology, and systems biology. They will also potentially shed a light on the underlying mechanisms by which androgens act in SCs because they reveal, for the first time, a genome-wide view of the cell type–specific gene responses to AR signaling in SCs.
Additional material
Supplementary data supplied by authors.
Acknowledgments
K.D.G. thanks Dr Wayne Pfeiffer for introducing him to the fascinating world of Unix, the San Diego Supercomputer, and bioinformatics in general. We thank Dr F. Guillou (Institut National de la Recherche Agronomique [INRA], Paris, France) for providing us with the Plekha5Tg(AMH-cre)1Flor mouse strain and Chih-Hong Lou (University of California, San Diego, San Diego, California) for useful discussion.
This work was supported by the National Institutes of Health (Grants HD045595 and HD053808 to M.F.W.). K.D.G. was supported by a postdoctoral research fellowship from the Fund for Scientific Research-Flanders.
Disclosure Summary: The authors have nothing to disclose.
Footnotes
- AMH
- Anti-Müllerian hormone
- AR
- androgen receptor
- CRE
- cyclic recombinase
- EF
- enrichment factor
- fpkm
- fragments per kilobase of exon per million fragments mapped
- GC
- germ cell
- GO
- Gene Ontology
- GST
- glutathione S-transferase
- HA
- hemagglutinin
- LC
- Leydig cell
- P10
- postnatal day 10
- PTM
- peritubular myoid cell
- qPCR
- quantitative PCR
- RNA-seq
- RNA sequencing
- SC
- Sertoli cell.
References
- 1. Sharpe RM. Regulation of spermatogenesis. In: Knobil E, Neill JD, eds. The Physiology of Reproduction. 2nd ed New York: Raven Press; 1994:1363–1434. [Google Scholar]
- 2. Weinbauer GF, Nieschlag E. Hormonal control of spermatogenesis. In: de Kretser DM, ed. Molecular Biology of the Male Reproductive System. 1st ed New York: Academic Press; 1993:99–142. [Google Scholar]
- 3. McLachlan RI, O'Donnell L, Meachem SJ, et al. Identification of specific sites of hormonal regulation in spermatogenesis in rats, monkeys, and man. Recent Prog Horm Res. 2002;57:149–179. [DOI] [PubMed] [Google Scholar]
- 4. Singh J, O'Neill C, Handelsman DJ. Induction of spermatogenesis by androgens in gonadotropin-deficient (hpg) mice. Endocrinology. 1995;136:5311–5321. [DOI] [PubMed] [Google Scholar]
- 5. Bremner WJ, Millar MR, Sharpe RM, Saunders PT. Immunohistochemical localization of androgen receptors in the rat testis: evidence for stage-dependent expression and regulation by androgens. Endocrinology. 1994;135:1227–1234. [DOI] [PubMed] [Google Scholar]
- 6. De Gendt K, Swinnen JV, Saunders PT, et al. A Sertoli cell-selective knockout of the androgen receptor causes spermatogenic arrest in meiosis. Proc Natl Acad Sci U S A. 2004;101:1327–1332. [DOI] [PMC free article] [PubMed] [Google Scholar]
- 7. Chang C, Chen YT, Yeh SD, et al. Infertility with defective spermatogenesis and hypotestosteronemia in male mice lacking the androgen receptor in Sertoli cells. Proc Natl Acad Sci U S A. 2004;101:6876–6881. [DOI] [PMC free article] [PubMed] [Google Scholar]
- 8. Holdcraft RW, Braun RE. Androgen receptor function is required in Sertoli cells for the terminal differentiation of haploid spermatids. Development. 2004;131:459–467. [DOI] [PubMed] [Google Scholar]
- 9. Lim P, Robson M, Spaliviero J, et al. Sertoli cell androgen receptor DNA binding domain is essential for the completion of spermatogenesis. Endocrinology. 2009;150:4755–4765. [DOI] [PubMed] [Google Scholar]
- 10. Denolet E, De Gendt K, Allemeersch J, et al. The effect of a Sertoli cell-selective knockout of the androgen receptor on testicular gene expression in prepubertal mice. Mol Endocrinol. 2006;20:321–334. [DOI] [PubMed] [Google Scholar]
- 11. Eacker SM, Shima JE, Connolly CM, et al. Transcriptional profiling of androgen receptor (AR) mutants suggests instructive and permissive roles of AR signaling in germ cell development. Mol Endocrinol. 2007;21:895–907. [DOI] [PubMed] [Google Scholar]
- 12. O'Shaughnessy PJ, Abel M, Charlton HM, Hu B, Johnston H, Baker PJ. Altered expression of genes involved in regulation of vitamin A metabolism, solute transportation, and cytoskeletal function in the androgen-insensitive tfm mouse testis. Endocrinology. 2007;148:2914–2924. [DOI] [PubMed] [Google Scholar]
- 13. Zhou Q, Shima JE, Nie R, Friel PJ, Griswold MD. Androgen-regulated transcripts in the neonatal mouse testis as determined through microarray analysis. Biol Reprod. 2005;72:1010–1019. [DOI] [PubMed] [Google Scholar]
- 14. Sadate-Ngatchou PI, Pouchnik DJ, Griswold MD. Identification of testosterone-regulated genes in testes of hypogonadal mice using oligonucleotide microarray. Mol Endocrinol. 2004;18:422–433. [DOI] [PubMed] [Google Scholar]
- 15. Verhoeven G, Denolet E, Swinnen J V, et al. Contribution of recent transgenic models and transcriptional profiling studies to our understanding of the mechanisms by which androgens control spermatogenesis. Immunol Endocr Metab Agents Med Chem. 2008;8:2–13. [Google Scholar]
- 16. Sanz E, Yang L, Su T, Morris DR, McKnight GS, Amieux PS. Cell-type-specific isolation of ribosome-associated mRNA from complex tissues. Proc Natl Acad Sci USA. 2009;106:13939–13944. [DOI] [PMC free article] [PubMed] [Google Scholar]
- 17. Lécureuil C, Fontaine I, Crepieux P, Guillou F. Sertoli and granulosa cell-specific Cre recombinase activity in transgenic mice. Genesis. 2002;33:114–118. [DOI] [PubMed] [Google Scholar]
- 18. Trapnell C, Roberts A, Goff L, et al. Differential gene and transcript expression analysis of RNA-seq experiments with TopHat and Cufflinks. Nat Protoc. 2012;7:562–578. [DOI] [PMC free article] [PubMed] [Google Scholar]
- 19. Lindsey JS, Wilkinson MF. Pem: a testosterone- and LH-regulated homeobox gene expressed in mouse Sertoli cells and epididymis. Dev Biol. 1996;179:471–484. [DOI] [PubMed] [Google Scholar]
- 20. Barbulescu K, Geserick C, Schüttke I, Schleuning WD, Haendler B. New androgen response elements in the murine pem promoter mediate selective transactivation. Mol Endocrinol. 2001;15:1803–1816. [DOI] [PubMed] [Google Scholar]
- 21. Sanz E, Evanoff R, Quintana A, et al. RiboTag analysis of actively translated mRNAs in Sertoli and Leydig cells in vivo. PLoS One. 2013;8:e66179. [DOI] [PMC free article] [PubMed] [Google Scholar]
- 22. Zhang P, Compagnone NA, Fiore C, et al. Developmental gonadal expression of the transcription factor SET and its target gene, P450c17 (17α-hydroxylase/c17,20 lyase). DNA Cell Biol. 2001;20:613–624. [DOI] [PubMed] [Google Scholar]
- 23. Lee J, Iwai T, Yokota T, Yamashita M. Temporally and spatially selective loss of Rec8 protein from meiotic chromosomes during mammalian meiosis. J Cell Sci. 2003;116(Pt 13):2781–2790. [DOI] [PubMed] [Google Scholar]
- 24. Cunningham DB, Segretain D, Arnaud D, Rogner UC, Avner P. The mouse Tsx gene is expressed in Sertoli cells of the adult testis and transiently in premeiotic germ cells during puberty. Dev Biol. 1998;204:345–360. [DOI] [PubMed] [Google Scholar]
- 25. Anway MD, Show MD, Zirkin BR. Protein C inhibitor expression by adult rat Sertoli cells: effects of testosterone withdrawal and replacement. J Androl. 2005;26:578–585. [DOI] [PubMed] [Google Scholar]
- 26. Silva EJ, Patrão MT, Tsuruta JK, O'Rand MG, Avellar MC. Epididymal protease inhibitor (EPPIN) is differentially expressed in the male rat reproductive tract and immunolocalized in maturing spermatozoa. Mol Reprod Dev. 2012;79:832–842. [DOI] [PubMed] [Google Scholar]
- 27. Kopecky M, Semecky V, Nachtigal P. Vimentin expression during altered spermatogenesis in rats. Acta Histochem. 2005;107:279–289. [DOI] [PubMed] [Google Scholar]
- 28. Beumer TL, Kiyokawa H, Roepers-Gajadien HL, et al. Regulatory role of p27kip1 in the mouse and human testis. Endocrinology. 1999;140:1834–1840. [DOI] [PubMed] [Google Scholar]
- 29. Tan KA, De Gendt K, Atanassova N, et al. The role of androgens in Sertoli cell proliferation and functional maturation: studies in mice with total or Sertoli cell-selective ablation of the androgen receptor. Endocrinology. 2005;146:2674–2683. [DOI] [PubMed] [Google Scholar]
- 30. Geyer CB, Eddy EM. Identification and characterization of Rhox13, a novel X-linked mouse homeobox gene. Gene. 2008;423:194–200. [DOI] [PMC free article] [PubMed] [Google Scholar]
- 31. Song HW, Dann CT, McCarrey JR, Meistrich ML, Cornwall GA, Wilkinson MF. Dynamic expression pattern and subcellular localization of the Rhox10 homeobox transcription factor during early germ cell development. Reproduction. 2012;143:611–624. [DOI] [PubMed] [Google Scholar]
- 32. Huang da W, Sherman BT, Lempicki RA. Systematic and integrative analysis of large gene lists using DAVID bioinformatics resources. Nat Protoc. 2009;4:44–57. [DOI] [PubMed] [Google Scholar]
- 33. Dennis G, Sherman BT, Hosack DA, et al. DAVID: Database for Annotation, Visualization, and Integrated Discovery. Genome Biol. 2003;4:P3. [PubMed] [Google Scholar]
- 34. Sharpe RM, McKinnell C, Kivlin C, Fisher JS. Proliferation and functional maturation of Sertoli cells, and their relevance to disorders of testis function in adulthood. Reproduction. 2003;125:769–784. [DOI] [PubMed] [Google Scholar]
- 35. Uhlenhaut NH, Jakob S, Anlag K, et al. Somatic sex reprogramming of adult ovaries to testes by FOXL2 ablation. Cell. 2009;139:1130–1142. [DOI] [PubMed] [Google Scholar]
- 36. Johnston DS, Russell LD, Friel PJ, Griswold MD. Murine germ cells do not require functional androgen receptors to complete spermatogenesis following spermatogonial stem cell transplantation. Endocrinology. 2001;142:2405–2408. [DOI] [PubMed] [Google Scholar]
- 37. Denolet E, Gendt KD, Swinnen JV, et al. Transfection with steroid-responsive reporter constructs shows glucocorticoid rather than androgen responsiveness in cultured Sertoli cells. J Steroid Biochem Mol Biol. 2006;98:164–173. [DOI] [PubMed] [Google Scholar]
- 38. Abel MH, Baban D, Lee S, Charlton HM, O'Shaughnessy PJ. Effects of FSH on testicular mRNA transcript levels in the hypogonadal mouse. J Mol Endocrinol. 2009;42:291–303. [DOI] [PMC free article] [PubMed] [Google Scholar]
- 39. Zhang QX, Zhang XY, Zhang ZM, et al. Identification of testosterone-/androgen receptor-regulated genes in mouse Sertoli cells. Asian J Androl. 2011;14:294–300. [DOI] [PMC free article] [PubMed] [Google Scholar]
- 40. Zhou W, Wang G, Small CL, et al. Gene expression alterations by conditional knockout of androgen receptor in adult Sertoli cells of Utp14bjsd/jsd (jsd) mice. Biol Reprod. 2010;84:400–408. [DOI] [PMC free article] [PubMed] [Google Scholar]
- 41. Beverdam A, Koopman P. Expression profiling of purified mouse gonadal somatic cells during the critical time window of sex determination reveals novel candidate genes for human sexual dysgenesis syndromes. Hum Mol Genet. 2006;15:417–431. [DOI] [PubMed] [Google Scholar]
- 42. Bouma GJ, Affourtit JP, Bult CJ, Eicher EM. Transcriptional profile of mouse pre-granulosa and Sertoli cells isolated from early-differentiated fetal gonads. Gene Expr Patterns. 2007;7:113–23. [DOI] [PubMed] [Google Scholar]
- 43. Wang Z, Gerstein M, Snyder M. RNA-Seq: a revolutionary tool for transcriptomics. Nat Rev Genet. 2009;10:57–63. [DOI] [PMC free article] [PubMed] [Google Scholar]
- 44. Rao AV, Shaha C. Role of glutathione S-transferases in oxidative stress-induced male germ cell apoptosis. Free Radic Biol Med. 2000;29:1015–1027. [DOI] [PubMed] [Google Scholar]
- 45. Aravinda S, Gopalakrishnan B, Dey CS, et al. A testicular protein important for fertility has glutathione S-transferase activity and is localized extracellularly in the seminiferous tubules. J Biol Chem. 1995;270:15675–15685. [DOI] [PubMed] [Google Scholar]
- 46. Rao AV, Shaha C. Multiple glutathione S-transferase isoforms are present on male germ cell plasma membrane. FEBS Lett. 2001;507:174–180. [DOI] [PubMed] [Google Scholar]
- 47. Hosono Y, Usukura J, Yamaguchi T, Yanagisawa K, Suzuki M, Takahashi T. MYBPH inhibits NM IIA assembly via direct interaction with NMHC IIA and reduces cell motility. Biochem Biophys Res Commun. 2012;428:173–178. [DOI] [PubMed] [Google Scholar]
- 48. Chen Z, Zhao TJ, Li J, et al. Slow skeletal muscle myosin-binding protein-C (MyBPC1) mediates recruitment of muscle-type creatine kinase (CK) to myosin. Biochem J. 2011;436:437–445. [DOI] [PubMed] [Google Scholar]
- 49. Yebra M, Diaferia GR, Montgomery AMP, et al. Endothelium-derived Netrin-4 supports pancreatic epithelial cell adhesion and differentiation through integrins α2β1 and α3β1. PLoS One. 2011;6:e22750. [DOI] [PMC free article] [PubMed] [Google Scholar]
- 50. Van der Vieren M, Crowe DT, Hoekstra D, et al. The leukocyte integrin αDβ2 binds VCAM-1: evidence for a binding interface between I domain and VCAM-1. J Immunol. 1999;163:1984–1990. [PubMed] [Google Scholar]
- 51. Willems A, De Gendt K, Allemeersch J, et al. Early effects of Sertoli cell-selective androgen receptor ablation on testicular gene expression. Int J Androl. 2010;33:507–517. [DOI] [PubMed] [Google Scholar]
- 52. Griswold MD, Hogarth CA, Bowles J, Koopman P. Initiating meiosis: the case for retinoic acid. Biol Reprod. 2012;86:35. [DOI] [PMC free article] [PubMed] [Google Scholar]
- 53. Hu Z, Dandekar D, O'Shaughnessy PJ, De Gendt K, Verhoeven G, Wilkinson MF. Androgen-induced Rhox homeobox genes modulate the expression of AR-regulated genes. Mol Endocrinol. 2010;24:60–75. [DOI] [PMC free article] [PubMed] [Google Scholar]
- 54. Rato L, Alves MG, Socorro S, Carvalho RA, Cavaco JE, Oliveira PF. Metabolic modulation induced by oestradiol and DHT in immature rat Sertoli cells cultured in vitro. Biosci Rep. 2012;32:61–69. [DOI] [PubMed] [Google Scholar]
- 55. Willems A, Batlouni SR, Esnal A, et al. Selective ablation of the androgen receptor in mouse Sertoli cells affects Sertoli cell maturation, barrier formation and cytoskeletal development. PLoS One. 2010;5:e14168. [DOI] [PMC free article] [PubMed] [Google Scholar]
- 56. Yan HH, Mruk DD, Lee WM, Cheng CY. Blood-testis barrier dynamics are regulated by testosterone and cytokines via their differential effects on the kinetics of protein endocytosis and recycling in Sertoli cells. FASEB J. 2008;22:1945–1959. [DOI] [PMC free article] [PubMed] [Google Scholar]
- 57. Sirianni R, Seely JB, Attia G, et al. Liver receptor homologue-1 is expressed in human steroidogenic tissues and activates transcription of genes encoding steroidogenic enzymes. J Endocrinol. 2002;174:R13–R17. [DOI] [PubMed] [Google Scholar]
- 58. Verhoeven G, Deboel L, Swinnen J, et al. Effect of androgens on the germ cell-depleted testes of prenatally irradiated rats. Int J Androl. 1995;18:23–34. [DOI] [PubMed] [Google Scholar]
- 59. Denolet E. Androgen Action in Sertoli Cells. Leuven, Belgium: Leuven University Press; 2007. [Google Scholar]
- 60. Blomberg Jensen M, Lieben L, Nielsen JE, et al. Characterization of the testicular, epididymal and endocrine phenotypes in the Leuven Vdr-deficient mouse model: Targeting estrogen signalling. Mol Cell Endocrinol. 2013;377:93–102. [DOI] [PubMed] [Google Scholar]
- 61. Vainio S, Heikkilä M, Kispert A, Chin N, McMahon AP. Female development in mammals is regulated by Wnt-4 signalling. Nature. 1999;397:405–409. [DOI] [PubMed] [Google Scholar]
- 62. Meehan T, Schlatt S, O'Bryan MK, de Kretser DM, Loveland KL. Regulation of germ cell and Sertoli cell development by activin, follistatin, and FSH. Dev Biol. 2000;220:225–237. [DOI] [PubMed] [Google Scholar]
- 63. Jégou B. The Sertoli-germ cell communication network in mammals. Int Rev Cytol. 1993;147:25–96. [PubMed] [Google Scholar]
Associated Data
This section collects any data citations, data availability statements, or supplementary materials included in this article.