

Abstract
Background
Yearly changes in active joint stiffness may help explain when neuromuscular sex differences emerge in adolescent athletes that may relate to increased anterior cruciate ligament injury risk in females.
Hypothesis
Pubertal males would demonstrate increases in knee stiffness while pubertal females would not. Second, postpubertal female athletes would have significantly lower knee joint stiffness than postpubertal male athletes.
Study Design
Cohort Study; Level of Evidence 2 and Cross-Sectional Study; Level of Evidence 3.
Methods
Two hundred sixty-five females and 50 males participated in 2 testing sessions approximately 1 year apart. The subjects were classified as either pubertal (n = 182, age 12.4 ± 0.9 years) or postpubertal (n = 133, age 14.5 ± 1.4 years) based on the modified Pubertal Maturational Observational Scale at each visit. Active joint stiffness of the ankle, knee, and hip was estimated during a drop vertical jump. Stiffness was calculated as the slope of the moment-angle curve from a least squares linear regression during the stance phase.
Results
All athletes showed increased active knee stiffness during the span of a year (P < 0.05). However, this increase was not different when stiffness was normalized to body mass. Only males demonstrated greater magnitudes of ankle and hip active stiffness (P < .05). Peak ankle and hip moments, but not knee moments, in postpubertal males were significantly greater than postpubertal females (P < .05). Females had a higher knee to hip moment ratio than males (P < .05).
Conclusion
Both males and females showed increased active knee stiffness during the span of a year; males demonstrated increased ankle and hip active stiffness as well. Differences in hip joint posture at initial contact (greater flexion in males) and external hip flexion moment (greater flexion magnitude in males) may indicate that males use a different hip recruitment strategy during drop vertical jumps than females.
Keywords: anterior cruciate ligament (ACL), knee injury prevention, sex, biomechanics
Female athletes suffer anterior cruciate ligament (ACL) injuries at a 2- to 10-fold greater rate than male athletes participating in the same high-risk sports.3,6,14,30,31,45 The combination of increased risk of injury and a 10-fold increase in the female sports population since the inception of Title IX, the US legislation that prohibited discrimination against anyone based on sex under any educational program or activity, has resulted in a dramatic increase in the number of ACL injuries in females.31 Inappropriate levels of active joint stiffness, either insufficient or excessive, have been purported to be a potential neuromuscular risk factor that may at least partially explain the sex bias in ACL injuries.19-21 Active joint stiffness is based on the formula of rotational stiffness (k = applied joint moment per angular displacement). This model takes advantage of the moment-angle relationship in which angular displacement is regulated by the external moment on the joint. Active joint stiffness is specifically calculated as the slope of the moment-angle curve.32,38 Active joint stiffness can be voluntarily controlled through muscular recruitment and may increase dynamic joint stability.19,20,46 Cocontraction of the flexor (hamstrings) and extensor (quadriceps) muscles may protect the knee against high injury risk movement patterns such as excessive knee abduction motion and torque.33 The knee flexor and extensor muscles are the most direct muscular knee joint stabilizers and are used during dynamic loading conditions to protect against an injury.37 Strength and activation deficits of the hamstrings may limit the potential for muscular cocontraction to protect ligaments. Similar mechanisms apply to muscular protection against torsional loading, in which sex differences have been identified.43 Decreased active stiffness in the leg and knee has been reported in females compared with that of males.19,25
Hamstra-Wright et al22 examined leg stiffness during the drop vertical jump (DVJ) in prepubertal subjects and found no sex differences in their cohort. The effect of age on stiffness has been examined in a group of 6-year-old children compared with 18-year-old subjects.29 As expected, increased stiffness at the ankle, knee, and hip was observed in the older group during countermovement vertical jumps.29 This study, however, did not include females. In addition, the large gap in mean age of the subject groups in this study likely led to multiple developmental, social, and psychological factors that may have influenced the observed differences in these age groups. Increased active joint stiffness may result in improved performance and possibly reduce the risk of ACL injury.2,19,20,32,38,43 However, it is important to realize that either extreme (insufficient or excessive) magnitude of joint stiffness likely results in poor performance or increased risk of excessive joint load and, ultimately, increased risk of joint injury.
Identification of the relative changes in active joint stiffness between sexes following a year of maturation could help to elucidate a potential contributing factor to increased ACL injury risk in female athletes. The purpose of this investigation was to determine if the neuromuscular risk factors related to knee stiffness diverge between the sexes during the adolescent growth spurt. The first hypothesis tested was that during rapid adolescent growth, pubertal males would demonstrate increases in knee stiffness while pubertal females would not. The second hypothesis was that postpubertal females would have significantly lower knee joint stiffness compared with postpubertal males.
Methods
Subjects
A nested cohort design (total sample female, n = 709; total sample male, n = 250) was used to select a subset of 315 subjects (female, n = 265; male, n = 50). Subjects (mean age 13.3 ± 1.5 years) were included if they had 2 consecutive years of testing and met the pubertal or postpubertal criteria described in the next paragraph. If the subject met the pubertal criteria during the first or second year of testing he or she was operationally defined as pubertal to include all subjects who were close to this maturational stage. Subjects were excluded from this study if they had a history of knee or ankle surgery.
Subjects classified as postpubertal had to meet the postpubertal criteria on the first year of testing. The subjects were classified as either pubertal (n = 182) or postpubertal (n = 133) at each visit based on the modified Pubertal Maturational Observational Scale (see online Appendix for this article at http://ajs.sagepub.com/supplemental/).35 The Pubertal Maturational Observational Scale is a reliable instrument that combines a parental questionnaire and investigator observations to classify subjects into the pubertal categories.9,10,23,34 Age, height, and mass of the subjects for 2 consecutive years are presented in Table 1. Each subject participated in the first testing session immediately before his or her basketball or soccer season. Two hundred sixty-one basketball players and 61 soccer players were included. The subjects were retested approximately 1 year after the initial testing session (mean, 365.7 ± 14.7 days).
Table 1. Subject Demographicsa.
| Pubertal | Postpubertal | ||||
|---|---|---|---|---|---|
|
|
|
||||
| Variable | Test Session | Female (n = 145) | Male (n = 37) | Female (n = 120) | Male (n = 13) |
| Age, y | Year 1 | 12.3 ± 0.8 | 13.0 ± 1.1 | 14.4 ± 1.4 | 15.1 ± 1.1 |
| Year 2 | 13.3 ± 0.8 | 14.0 ± 1.1 | 15.4 ± 1.4 | 16.1 ± 1.1 | |
| Height, cm | Year 1 | 155.9 ± 6.8 | 165.2 ± 10.2 | 164.4 ± 5.8 | 180.8 ± 7.9 |
| Year 2 | 160.7 ± 5.9 | 171.8 ± 9.2 | 165.2 ± 5.8 | 182.5 ± 7.6 | |
| Mass, kg | Year 1 | 47.8 ± 10.2 | 54.5 ± 10.2 | 59.0 ± 8.5 | 70.1 ± 8.4 |
| Year 2 | 52.7 ± 9.9 | 61.1 ± 10.0 | 60.9 ± 8.7 | 74.9 ± 7.6 | |
Values are given as mean ± standard deviation.
The data collection procedures were approved by the institutional review board. Each parent or guardian reviewed and signed the institutional review board-approved consent to participate form prior to data collection. Child assent was also obtained from each subject before study participation.
Procedures
Thirty-seven retroreflective markers were placed on each subject as previously described.18 A static trial was collected in which the subject was instructed to stand still in the anatomical position with foot placement standardized. Three trials of the DVJ were collected. The DVJ consisted of the subject starting on top of a 31-cm box with the feet positioned 35 cm apart. The subjects were instructed to drop directly down off the box and immediately perform a maximum vertical jump, raising both arms as if they were jumping for a basketball rebound.16 The DVJ trials were collected with EVaRT, version 4 (Motion Analysis Corporation, Santa Rosa, California) using a motion analysis system with 8 digital cameras (Eagle cameras, Motion Analysis CorporationA). The video data were collected at 240 Hz. The motion analysis system was calibrated based on manufacturer's recommendations. Two force platforms (AMTI, Watertown, Massachusetts) were embedded into the floor and positioned 8 cm apart so that each foot would contact a different platform during the stance phase of the DVJ. The force plate data were time-synchronized with the motion analysis system and collected at 1200 Hz.
Data Analysis
Three-dimensional (3D) marker trajectories were examined for accurate marker identification within EVaRT and exported to a coordinate 3D file format. The coordinate 3D files were then further analyzed in Visual3d (version 4.0, C-Motion, Inc, Germantown, Maryland). A pelvis and bilateral thigh, shank, and foot segments were created based on the reflective markers. The mass and inertial properties for each segment were based on sex-specific parameters from de Leva.12 The subject's height and mass were included in each model. Custom MATLAB code (The MathWorks, Natick, Massachusetts) was used to batch process each subject through the Visual3D pipeline. The code generated a text file that the Visual3D pipeline engine could read and process the subject-specific model and kinematic and kinetic analyses. The 3D marker trajectories from each trial were filtered at a cutoff frequency of 12 Hz (low-pass fourth order Butterworth filter). The 3D knee joint angles were calculated according to the Cardan rotation sequence.8 Kinematic data were combined with force data to calculate knee joint moments using inverse dynamics.1,41 The ground-reaction force was filtered through a low-pass fourth order Butterworth filter at a cutoff frequency of 12 Hz to minimize possible impact peak errors.4,39 Net external knee moments are described in this article and represent the external load on the joint. The kinematic and kinetic data were normalized to 101 points representing the stance phase of the DVJ. Data from initial contact (vertical ground-reaction force first exceeded 10 N) to toeoff (vertical ground-reaction force fell below 10 N) were operationally defined as the stance phase. The right side data were used for statistical analysis.
Sagittal plane ankle, knee, and hip angle and moments were used to calculate joint stiffness parameters.2,38 Joint stiffness was modeled based on a rotational spring for each joint. Rotational spring plots (joint moment as a function of joint angle) were calculated for each trial within MATLAB.11,38 Stiffness was calculated as the slope of the moment-angle curve from a least squares linear regression during the stance phase. Figure 1 shows an example of the variables calculated from the linear regression. In addition, the linearity of the curve was evaluated with the coefficient of determination (r2).2 Ankle dorsiflexion and knee and hip flexion were represented as positive values for consistent moment-angle curves. Initial contact and peak flexion angles were calculated for the ankle, knee, and hip during the stance phase of the DVJ. Peak external flexion moments were also calculated during the DVJ stance.
Figure 1.
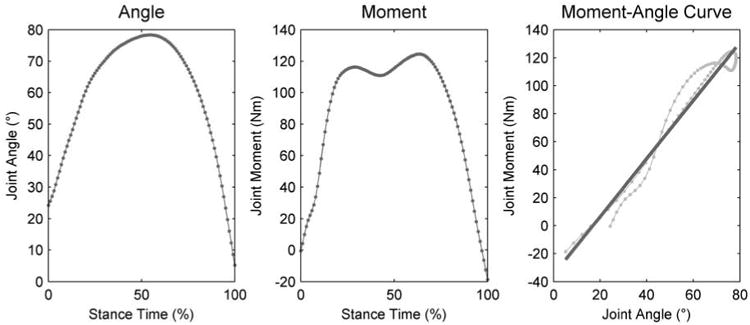
Calculation of knee stiffness based on moment-angle plot (note: knee flexion angle and moment are inversed to compare with ankle and hip variables). Note: the moment-angle plot starts at initial contact (IC) and finishes at toe off (TO). Linear regression equation (y = 2.1 · x − 35) for the moment-angle plot. The coefficient of determination (r2 = 0.95) represents the linear fit of the spring mass model. The slope (2.1 N·m/deg) and the intercept (−35 N·m) were also calculated.
Statistical Analysis
Two between-group independent variables of sex (female, male) and maturation level (pubertal, postpubertal) in addition to the within-subject independent variable (repeated measure) of 2 consecutive-year screening sessions were used in the statistical design. The dependent variables were ankle, knee, and hip stiffness. A 2 × 2 × 2 analysis of variance (maturation, sex, session) was used to test each hypothesis. Post hoc analyses were used if significant interactions were found between factors. A level of α ≤ .05 was used to indicate statistical significance. Analyses were conducted using SPSS version 16.0 (SPSS Inc., Chicago, Illinois).
Results
Longitudinal Comparisons
Active joint stiffness variables are presented in Table 2. The coefficient of determination was high for all 3 joints. The linear regression fit ranged from r2 =0.74 to 0.87. Ankle, knee, and hip stiffness longitudinally increased with maturation in both males and females (main effect of year, ankle P = .001, knee P = .043, hip P < .001) (Figure 2). In addition, an interaction between year and maturation level was found at the ankle (P = .05) and hip (P = .006). Post hoc analyses indicated that the pubertal group had longitudinal increases in ankle and hip stiffness (P < .001), while no similar change was present in postpubertal athletes (P > .05). A similar trend (year versus maturation interaction) with knee stiffness was noted (P = .085). When joint moments were normalized to body mass, the maturational group differences in joint stiffness between years were not observed (P > .05).
Table 2. Stiffness Parameters for Ankle, Knee, and Hip Jointsa.
| Joint | Pubertal | Postpubertal | ||
|---|---|---|---|---|
|
|
|
|||
| Female (n = 145) | Male (n = 37) | Female (n = 120) | Male (n = 13) | |
| Ankle | ||||
| Stiffness, N·m/degb,c,d,e | ||||
| Year 1 | 1.03 ± 0.45 | 1.47 ± 0.56 | 1.38 ± 0.49 | 2.01 ± 0.67 |
| Year 2 | 1.19 ± 0.44 | 1.70 ± 0.69 | 1.46 ± 0.51 | 2.05 ± 0.83 |
| Intercept, N·m | ||||
| Year 1 | 36.1 ± 10.3 | 48.1 ± 13.4 | 46.4 ± 10.7 | 63.6 ± 21.0 |
| Year 2 | 41.5 ± 11.2 | 56.6 ± 16.1 | 48.9 ± 11.6 | 71.7 ± 19.1 |
| r2 | ||||
| Year 1 | 0.794 ± 0.183 | 0.839 ± 0.147 | 0.852 ± 0.164 | 0.783 ± 0.178 |
| Year 2 | 0.837 ± 0.145 | 0.788 ± 0.186 | 0.865 ± 0.146 | 0.739 ± 0.296 |
| Knee | ||||
| Stiffness, N·m/degb,c,d | ||||
| Year 1 | 1.40 ± 0.66 | 1.63 ± 0.81 | 1.72 ± 0.72 | 2.31 ± 0.83 |
| Year 2 | 1.52 ± 0.62 | 1.89 ± 0.78 | 1.77 ± 0.68 | 2.30 ± 0.94 |
| Intercept, N·m | ||||
| Year 1 | −27.4 ± 21.4 | −29.4 ± 22.4 | −31.0 ± 24.7 | −42.3 ± 29.7 |
| Year 2 | −29.3 ± 20.7 | −34.0 ± 23.8 | −32.9 ± 22.8 | −47.8 ± 30.5 |
| r2 | ||||
| Year 1 | 0.853 ± 0.121 | 0.864 ± 0.136 | 0.859 ± 0.154 | 0.868 ± 0.127 |
| Year 2 | 0.869 ± 0.110 | 0.871 ± 0.144 | 0.874 ± 0.135 | 0.839 ± 0.155 |
| Hip | ||||
| Stiffness, N·m/degb,c,d,g | ||||
| Year 1 | 1.50 ± 0.44 | 2.42 ± 0.94 | 2.03 ± 0.49 | 3.57 ± 0.60 |
| Year 2 | 1.70 ± 0.49 | 2.70 ± 1.04 | 2.05 ± 0.51 | 3.63 ± 0.81 |
| Intercept, N·m | ||||
| Year 1 | −29.8 ± 12.9 | −34.8 ± 22.4 | −44.9 ± 17.3 | −56.0 ± 22.3 |
| Year 2 | −35.8 ± 15.9 | −37.7 ± 25.2 | −45.5 ± 17.4 | −55.9 ± 35.4 |
| r2 | ||||
| Year 1 | 0.774 ± 0.130 | 0.825 ± 0.103 | 0.758 ± 0.116 | 0.805 ± 0.101 |
| Year 2 | 0.786 ± 0.111 | 0.822 ± 0.099 | 0.779 ± 0.099 | 0.810 ± 0.115 |
Values are given as mean ± standard deviation.
Denotes statistically significant effect of year, P < .05.
Denotes statistically significant effect of sex, P < .05.
Denotes statistically significant effect of maturation, P < .05.
Denotes statistically significant interaction of year and maturation, P < .05.
Denotes statistically significant interaction of year and sex, P < .05.
Denotes statistically significant interaction of sex and maturation, P < .05.
Figure 2.
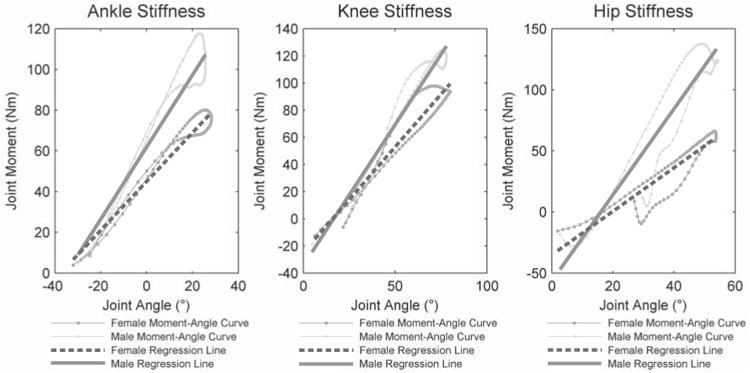
Moment-angle plots (dotted lines) of the ankle, knee, and hip with estimated joint stiffness (solid line) based on the slope of the least squares regression. The regression plots were based on ensemble averages of postpubescent female and male subjects. Ankle equations female: y = 1.2 · x + 45, r2 = 0.95; male: y = 1.8 · x + 62, r2 = 0.89. Knee equations female: y = 1.6 · × − 26, r2 = 0.92; male: y = 2.1 · x − 35, r2 = 0.95. Hip equations female: y = 1.8 · x − 36, r2 = 0.86; male: y = 3.5 · x − 57, r2 = 0.85.
Ankle, knee, and hip kinematic and kinetic variables are presented in Table 3. All subjects combined demonstrated significantly increased peak knee (P = .034) and hip (P = .015) flexion angles from the first to second year of testing. The magnitude of change was small in both male and female subjects (knee: female, 0.7° ± 7.1°; male, 1.9° ± 5.4°; hip: female, 1.9° ± 7.9°; male, 1.7° ± 7.4°). No other sagittal kinematic variables at initial contact or peak were different between testing years (P > .05).
Table 3. Ankle, Knee, and Hip Kinematics and Kineticsa.
| Joint | Pubertal | Postpubertal | ||
|---|---|---|---|---|
|
|
|
|||
| Female (n = 145) | Male (n = 37) | Female (n = 120) | Male (n = 13) | |
| Ankle | ||||
| Angle IC, deg | ||||
| Year 1 | −24.0 ± 6.8 | −24.5 ± 7.4 | −24.9 ± 6.1 | −24.2 ± 4.9 |
| Year 2 | −24.6 ± 6.8 | −25.9 ± 4.6 | −24.9 ± 5.7 | −24.1 ± 4.4 |
| Angle peak, degc | ||||
| Year 1 | 30.3 ± 4.9 | 27.1 ± 5.0 | 29.1 ± 4.8 | 26.8 ± 6.3 |
| Year 2 | 30.1 ± 5.1 | 27.1 ± 4.8 | 29.3 ± 4.6 | 27.4 ± 5.2 |
| Moment peak, N±mb,c,f,g | ||||
| Year 1 | 73.1 ± 20.8 | 95.2 ± 26.5 | 91.1 ± 20.7 | 126.4 ± 23.8 |
| Year 2 | 81.6 ± 20.9 | 110.3 ± 28.0 | 95.0 ± 22.2 | 142.5 ± 27.4 |
| Knee | ||||
| Angle IC, deg | ||||
| Year 1 | 22.9 ± 7.4 | 21.3 ± 7.5 | 22.0 ± 6.8 | 24.3 ± 6.8 |
| Year 2 | 22.6 ± 7.2 | 21.1 ± 6.9 | 21.8 ± 5.9 | 24.4 ± 8.2 |
| Angle peak, degb,c | ||||
| Year 1 | 83.1 ± 8.9 | 78.5 ± 9.5 | 81.2 ± 8.1 | 78.7 ± 9.2 |
| Year 2 | 83.9 ±9.1 | 80.5 ± 10.8 | 81.9 ± 7.7 | 80.3 ± 8.0 |
| Moment peak, N·mb,c,d,e | ||||
| Year 1 | 91.1 ± 24.5 | 101.6 ± 31.0 | 113.8 ± 29.2 | 142.1 ± 28.4 |
| Year 2 | 100.4 ± 25.5 | 122.3 ± 30.0 | 115.5 ± 28.1 | 143.1 ± 33.7 |
| Hip | ||||
| Angle IC, degc | ||||
| Year 1 | 26.9 ±8.1 | 28.5 ± 8.3 | 26.9 ± 8.1 | 29.9 ± 9.3 |
| Year 2 | 27.4 ± 7.1 | 28.2 ± 7.5 | 26.8 ± 6.8 | 31.5 ± 9.3 |
| Angle peak, degb | ||||
| Year 1 | 56.6 ± 9.2 | 54.8 ± 9.6 | 56.1 ± 8.9 | 55.3 ± 9.2 |
| Year 2 | 57.7 ± 8.3 | 55.9 ± 12.2 | 57.3 ± 8.9 | 58.4 ± 8.4 |
| Moment peak, N·mb,c,f,g | ||||
| Year 1 | 71.5 ± 18.8 | 109.6 ± 30.4 | 91.2 ± 22.3 | 151.8 ± 19.7 |
| Year 2 | 80.9 ± 21.0 | 124.5 ± 35.0 | 94.1 ± 23.9 | 165.1 ± 27.1 |
Values are given as mean ± standard deviation. IC, initial contact.
Denotes statistically significant effect of year, P < .05.
Denotes statistically significant effect of sex, P < .05.
Denotes statistically significant effect of maturation, P < .05.
Denotes statistically significant interaction of year and maturation, P < .05.
Denotes statistically significant interaction of year and sex, P < .05.
Denotes statistically significant interaction of sex and maturation, P < .05.
Males showed increased ankle and hip peak moments from the first year of testing to the second compared with females (sex vs year interaction: ankle, P = .001; hip, P = .01) (Table 3). There was no interaction of sex versus year with external knee flexion moment (P > .05). Both males and females demonstrated increased external knee flexion (net quadriceps) moments (main effect of year, P < .001).
Sex and Puberty Group Differences
Figure 2 presents the calculated stiffness comparison of postpubertal males and females. Statistical tests between sexes identified that males had greater active stiffness at the ankle, knee, and hip compared with females (P < .001). However, when joint moments were normalized to body mass, knee stiffness was not different between sexes (total female, 0.029 ± 0.011 N·m/kg·deg; total male, 0.031 ± 0.013 N·m/kg·deg; P = .223). Body mass normalized ankle (total female, 0.023 ± 0.008 N·m/kg·deg; total male, 0.028 ± 0.010 N·m/kg·deg; P < .001) and hip stiffness (total female, 0.033 ± 0.008 N·m/kg·deg; total male, 0.046 ± 0.013 N·m/kg·deg; P < .001) remained greater in males compared with females.
Overall, females landed at initial contact with less hip flexion than males (main effect of sex, P = .035). In addition, females had significantly increased peak ankle dorsiflexion (main effect of sex, P = .001) and knee flexion angle (main effect of sex, P = .001) than males (main effect of sex, P = .001). No interactions or differences in kinematic variables were found among maturational groups (P > .05).
A cross-sectional interaction between sex and maturation was found with body mass both normalized (P = .007) and nonnormalized (P = .001) hip stiffness as postpubertal males exhibited greater hip stiffness than the other groups (Table 2). Peak ankle and hip moments in postpubertal males were greater than postpubertal females (sex versus maturation interaction: ankle, P = .025; hip, P = .001) (Table 3). When normalized to body mass, males had greater ankle and hip moments, while no differences were found in knee moments (Figure 3A). The ratio of peak knee to peak hip external moment was different between males and females (P < .001). Females showed greater external knee flexion (quadriceps driven) moment while males had more relative external hip flexion (gluteus maximus muscle driven) moments (Figure 3B).
Figure 3.
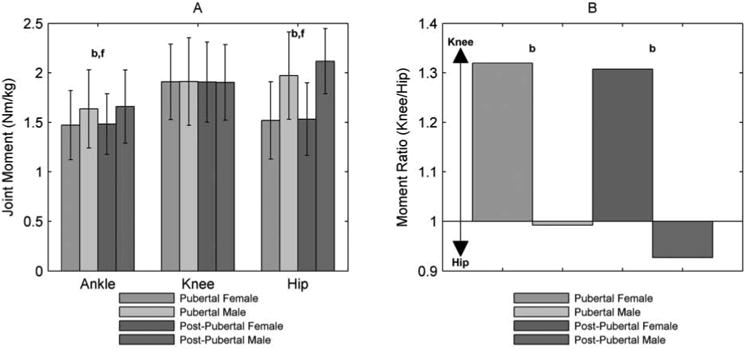
A, mean (standard deviation) normalized lower extremity joint moment. B, peak external knee to peak external hip moment ratio. bDenotes statistically significant effect of sex (P < .05). fDenotes statistically significant interaction of sex and maturation (P < .05).
Discussion
Appropriate levels of active joint stiffness, neither insufficient nor excessive, have been theorized to be a possible regulatory mechanism for stabilization of the joint and control of movements that may place females at higher risk of injury. Joint stiffness calculations involve the resistance of a mechanical stretch by an applied force.32 Knee flexor and extensor muscles are the most direct active knee joint stabilizers that may protect against an injury during dynamic loading conditions.37 Maturing males and females both increased active knee stiffness during the DVJ over the span of a year. Therefore, the present findings did not support the hypothesis that females would not increase knee stiffness during a year of pubertal growth. However, ankle and hip active stiffness was significantly increased from the first year of testing to the second year in males, but not females. Only one previous study was found that investigated active joint stiffness differences between maturational groups. Joint stiffness was increased in older male subjects (18 years old) compared with children (6 years old) during a countermovement vertical jump.29 In addition, Hamstra-Wright et al22 examined leg stiffness during the DVJ in prepubertal subjects and found no sex differences.
The current study findings supported our hypothesis that knee stiffness would be lower in females than males. Similar to the previous work of Padua et al,32 we found that females had significantly reduced stiffness compared with males. When normalized to body mass, however, sex differences in active knee stiffness were no longer significant. This was also similar to findings by Padua et al.32 Changes to active joint stiffness can be accomplished, simplistically, through altering the joint moment magnitude and/or joint angular displacement. Although male and female athletes had similar normalized knee stiffness parameters, the maximum knee flexion angle was significantly greater in females than in males. There are conflicting results in the published literature of greater, equal, and less knee flexion angle occurring in females compared with males during landing.7,15,24,26 Increases in the normalized external net knee flexion moment may be responsible for the normalized stiffness parameters remaining similar in females. A quadriceps-dominant recruitment pattern was supported in females who used this strategy to modulate stiffness parameters compared with males during hopping.32
Although we did not measure muscular activation patterns, a similar quadriceps-dominant pattern could be interpreted based on the relationship of external knee flexor to hip flexor moment. We observed a significantly higher ratio of external knee flexor moment (internal extensor/quadriceps) to external hip flexor moment (internal extensor/gluteus maximus) in females, while males were more balanced. Even when normalized to body mass, postpubertal males had significantly greater external hip flexor moments than females. It is particularly interesting that no sex differences were observed in external knee flexor (net quadriceps) moment. During the DVJ the knee extensors are used to resist the external flexion moment. Internal ankle and hip extensor moments are dominated by biarticular muscles that function as knee flexors. Two scenarios are likely to help interpret the absence of sex differences in knee flexion moment with greater ankle and hip moments in males: (1) females had increased knee extensor force or (2) males had increased knee flexor force. Therefore, even if males had larger overall knee extensor forces compared with females, the net moment could be equal based on cocontraction of knee antagonist muscles.
Adequate antagonist cocontraction (knee flexors) may balance quadriceps activation, compress the joint, and control high knee extension and abduction torques immediately after ground contact.24,33 Muscular cocontraction compresses the joint, partly because of the concavity of the medial tibial plateau, which may protect the ACL against anterior drawer.27 Increased balance in strength and recruitment of the flexor relative to the extensor musculature may protect the ACL.24 If hamstrings recruitment is high, the quadriceps can be activated to a greater extent while still allowing for a net flexor moment, and similar mechanisms apply to activation strategies to protect sex differences that have been identified in torsional loading.43 Wojtys et al43 reported that maximal internal transverse plane rotations of the tibia were greater in females than in males in both the passive and the active muscle state. Females exhibited less muscular protection of the knee ligaments under internal rotation loading than did males.43 Muscular activation patterns during landing have also shown an increased reliance on the quadriceps in female athltes.44 During single-legged landing maneuvers, females increased quadriceps while decreasing gluteus maximus activity, compared with males.44
The greater ankle and hip moments in postpubertal males likely explain the greater ankle and hip stiffness compared with females. Postpubertal males had significantly larger active ankle and hip stiffness compared with the other groups, in both body mass normalized and nonnormalized values. This may indicate that postpubertal males landed with a different neuromuscular strategy to control the landing and push-off phase of DVJ than the other groups. Increased internal hip extensor moments have been shown previously during the DVJ in males compared with females.17 Decker et al13 reported that during a drop landing males used more hip energy absorption compared with females. Females landed at initial contact with decreased hip flexion compared with males. This may play an important role in the mechanical efficiency of the hamstring muscles in relation to the quadriceps muscles.36 For example, the trunk may be positioned over the knee more with increased hip flexion, which has been reported to increase activation of the hamstrings and decrease activation of the quadriceps compared with a posterior trunk position.36,40
Increased stiffness appears to be associated with increased performance.2,29 Vertical jump height increased with increased stiffness in males performing the DVJ.2 However, there is likely an optimum level of stiffness for both performance and injury prevention.5 Decreased stiffness may result in decreased performance, while overly stiff deceleration maneuvers may lead to excessive loading rates and possible injury.5 The relationship between stiffness and performance should be investigated further in female and male athletic populations.
Our measure of active joint stiffness is actually quasi-stiffness, defined by Latash and Zatsiorsky28(p657) as the “… ability of the system to resist externally imposed displacements disregarding the time course of the displacement.” A limitation of this simplistic model is that it ignores multiple components of the multijoint system (ie, viscosity, muscle reflex time delays, degrees of freedom, tendons, bones, and so forth). However, the torsional spring model appeared to be an appropriate representation of active joint stiffness during the DVJ, with high linear correlations of the moment-angle relationship throughout the stance phase. The correlations ranged from r = 0.86 to r = 0.93. These values are similar to those of Stefanyshyn and Nigg,38 who found average ankle stiffness linear correlations of r = 0.86 during running and r = 0.93 for sprinting. During single-legged hopping at different frequencies, Granata et al19 found correlations between vertical displacement and vertical ground-reaction force that ranged between r = 0.92 and r = 0.96. In addition, during drop jumps, ankle stiffness models have been reported with linear correlations of r = 0.88 to r = 0.99 and knee stiffness correlations between r = 0.65 and r = 0.93.2 An additional related limitation of modeling active joint stiffness based on the spring-mass model is the use of external joint moments. Calculation of joint moments through inverse dynamics incorporates the net forces that act about the joint.42 Net joint moments are not indicative of which muscles are active or the magnitude of individual muscle forces generated at any specific point in time. Unfortunately, without sophisticated modeling of muscle forces, or possibly via difficult electromyographic methods, one is unable to fully interpret the isolated net external knee flexion moment. Therefore, cautious interpretation of the joint moment relative to the actual muscle forces is necessary.
Summary and Conclusion
Males and females both showed increased active knee stiffness during the span of a year, while males demonstrated increased ankle and hip active stiffness as well. Males had greater magnitudes of ankle and hip stiffness throughout adolescent growth compared with females. Follow-up studies should incorporate prepubertal athletes into the analyses to identify if sex differences exist before peak height velocity.
When joint stiffness variables were normalized to body mass, there were no longitudinal differences between testing years. This indicates that progressive increases in body mass during adolescence may play a role in active joint stiffness. Despite the longitudinal changes in nonnormalized stiffness observed in females, postpubertal males exhibited greater hip stiffness than postpubertal females. Sex differences in hip joint posture at initial contact (greater flexion in males) and external hip flexion moment (greater flexion magnitude in males) may indicate that males use a different hip strategy during DVJs compared with females. The effect of a hip-focused intervention, and the relationship that active joint stiffness has on altered movement patterns, should be further explored in adolescent females and males.
Supplementary Material
Acknowledgments
We thank the entire Sports Medicine Biodynamics Center at Cincinnati Children's Hospital Medical Center for their dedication and support. The authors acknowledge Boone County, Kentucky, School District, especially School Superintendent Randy Poe, and Mike Blevins, Ed Massey, and Brian Blavatt, for participation in this study. The authors also thank Robert Shapiro, Melody Noland, John Hall, Tim Uhl, and Ton van den Bogert for their valuable advice and recommendations regarding the article.
This work was supported by National Institutes of Health/National Institute of Arthritis and Musculoskeletal and Skin Diseases grants R01-AR049735, R01-AR055563, and R01-AR056259.
Footnotes
One or more authors has declared a potential conflict of interest:
For reprints and permission queries, please visit SAGE's Web site at http://www.sagepub.com/journalsPermissions.nav
References
- 1.Andriacchi TP, Natarajan RN, Hurwitz DE. Musculoskeletal dynamics, locomotion, and clinical applications. In: Mow VC, Hayes WC, editors. Basic Orthopaedic Biomechanics. 2nd. Philadelphia: Lippincott-Raven; 1997. pp. 37–68. [Google Scholar]
- 2.Arampatzis A, Schade F, Walsh M, Bruggemann GP. Influence of leg stiffness and its effect on myodynamic jumping performance. J Electromyogr Kinesiol. 2001;11(5):355–364. doi: 10.1016/s1050-6411(01)00009-8. [DOI] [PubMed] [Google Scholar]
- 3.Arendt E, Dick R. Knee injury patterns among men and women in collegiate basketball and soccer: NCAA data and review of literature. Am J Sports Med. 1995;23(6):694–701. doi: 10.1177/036354659502300611. [DOI] [PubMed] [Google Scholar]
- 4.Bisseling RW, Hof AL. Handling of impact forces in inverse dynamics. J Biomech. 2006;39(13):2438–2444. doi: 10.1016/j.jbiomech.2005.07.021. [DOI] [PubMed] [Google Scholar]
- 5.Butler RJ, Crowell HP, 3rd, Davis IM. Lower extremity stiffness: implications for performance and injury. Clin Biomech. 2003;18(6):511–517. doi: 10.1016/s0268-0033(03)00071-8. [DOI] [PubMed] [Google Scholar]
- 6.Chandy TA, Grana WA. Secondary school athletic injury in boys and girls: a three-year comparison. Phys Sportsmed. 1985;13(3):106–111. [Google Scholar]
- 7.Chappell JD, Yu B, Kirkendall DT, Garrett WE. A comparison of knee kinetics between male and female recreational athletes in stop-jump tasks. Am J Sports Med. 2002;30(2):261–267. doi: 10.1177/03635465020300021901. [DOI] [PubMed] [Google Scholar]
- 8.Cole GK, Nigg BM, Ronsky JL, Yeadon MR. Application of the joint coordinate system to three-dimensional joint attitude and movement representation: a standardization proposal. J Biomech Eng. 1993;115(4A):344–349. doi: 10.1115/1.2895496. [DOI] [PubMed] [Google Scholar]
- 9.Davies PL, Rose JD. Motor skills of typically developing adolescents: awkwardness or improvement? Phys Occup Ther Pediatr. 2000;20(1):19–42. [PubMed] [Google Scholar]
- 10.Davies PS. dissertation. Laramie: University of Wyoming; 1995. Assessment of Cognitive Development in Adolescents by Means of Neuropsychological Tasks. [Google Scholar]
- 11.Davis RB, DeLuca PA. Gait characterization via dynamic joint stiffness. Gait Posture. 1996;4(3):224–231. [Google Scholar]
- 12.de Leva P. Joint center longitudinal positions computed from a selected subset of Chandler's data. J Biomech. 1996;29(9):1231–1233. doi: 10.1016/0021-9290(96)00021-8. [DOI] [PubMed] [Google Scholar]
- 13.Decker MJ, Torry MR, Wyland DJ, Sterett WI, Richard Steadman J. Gender differences in lower extremity kinematics, kinetics and energy absorption during landing. Clin Biomech. 2003;18(7):662–669. doi: 10.1016/s0268-0033(03)00090-1. [DOI] [PubMed] [Google Scholar]
- 14.Deitch JR, Starkey C, Walters SL, Moseley JB. Injury risk in professional basketball players: a comparison of Women's National Basketball Association and National Basketball Association athletes. Am J Sports Med. 2006;34(7):1077–1083. doi: 10.1177/0363546505285383. [DOI] [PubMed] [Google Scholar]
- 15.Fagenbaum R, Darling WG. Jump landing strategies in male and female college athletes and the implications of such strategies for anterior cruciate ligament injury. Am J Sports Med. 2003;31(2):233–240. doi: 10.1177/03635465030310021301. [DOI] [PubMed] [Google Scholar]
- 16.Ford KR, Myer GD, Hewett TE. Valgus knee motion during landing in high school female and male basketball players. Med Sci Sports Exerc. 2003;35(10):1745–1750. doi: 10.1249/01.MSS.0000089346.85744.D9. [DOI] [PubMed] [Google Scholar]
- 17.Ford KR, Myer GD, Smith RL, Byrnes RN, Dopirak SE, Hewett TE. Use of an overhead goal alters vertical jump performance and biomechanics. J Strength Cond Res. 2005;19(2):394–399. doi: 10.1519/15834.1. [DOI] [PubMed] [Google Scholar]
- 18.Ford KR, Myer GD, Smith RL, Vianello RM, Seiwert SL, Hewett TE. A comparison of dynamic coronal plane excursion between matched male and female athletes when performing single leg landings. Clin Biomech. 2006;21(1):33–40. doi: 10.1016/j.clinbiomech.2005.08.010. [DOI] [PubMed] [Google Scholar]
- 19.Granata KP, Padua DA, Wilson SE. Gender differences in active musculoskeletal stiffness. Part II: quantification of leg stiffness during functional hopping tasks. J Electromyogr Kinesiol. 2002;12(2):127–135. doi: 10.1016/s1050-6411(02)00003-2. [DOI] [PubMed] [Google Scholar]
- 20.Granata KP, Wilson SE, Padua D. Gender differences in active musculoskeletal stiffness. Part I: quantification in controlled measurements of knee joint dynamics. J Electromyogr Kinesiol. 2002;12:119–126. doi: 10.1016/s1050-6411(02)00002-0. [DOI] [PubMed] [Google Scholar]
- 21.Griffin LY, Albohm MJ, Arendt EA, et al. Understanding and preventing noncontact anterior cruciate ligament injuries: a review of the Hunt Valley II meeting, January 2005. Am J Sports Med. 2006;34(9):1512–1532. doi: 10.1177/0363546506286866. [DOI] [PubMed] [Google Scholar]
- 22.Hamstra-Wright KL, Swanik CB, Sitler MR, et al. Gender comparisons of dynamic restraint and motor skill in children. Clin J Sport Med. 2006;16(1):56–62. doi: 10.1097/01.jsm.0000179232.10261.65. [DOI] [PubMed] [Google Scholar]
- 23.Hewett TE, Myer GD, Ford KR. Decrease in neuromuscular control about the knee with maturation in female athletes. J Bone Joint Surg Am. 2004;86(8):1601–1608. doi: 10.2106/00004623-200408000-00001. [DOI] [PubMed] [Google Scholar]
- 24.Hewett TE, Stroupe AL, Nance TA, Noyes FR. Plyometric training in female athletes: decreased impact forces and increased hamstring torques. Am J Sports Med. 1996;24(6):765–773. doi: 10.1177/036354659602400611. [DOI] [PubMed] [Google Scholar]
- 25.Hughes G, Watkins J. Lower limb coordination and stiffness during landing from volleyball block jumps. Res Sports Med. 2008;16(2):138–154. doi: 10.1080/15438620802103999. [DOI] [PubMed] [Google Scholar]
- 26.Huston LJ, Vibert B, Ashton-Miller JA, Wojtys EM. Gender differences in knee angle when landing from a drop-jump. Am J Knee Surg. 2001;14(4):215–220. [PubMed] [Google Scholar]
- 27.Imran A, O'Connor JJ. Theoretical estimates of cruciate ligament forces: effects of tibial surface geometry and ligament orientations. Proc Inst Mech Eng [H] 1997;211(6):425–439. doi: 10.1243/0954411981534556. [DOI] [PubMed] [Google Scholar]
- 28.Latash ML, Zatsiorsky VM. Joint stiffness: myth or reality? Human Move Sci. 1993;12(6):653–692. [Google Scholar]
- 29.Li-i W, Der-Chia L, Chenfu H. Age effect on jumping techniques and lower limb stiffness during vertical jump. Res Sports Med. 2004;12(3):1–22. [Google Scholar]
- 30.Malone TR, Hardaker WT, Garrett WE, Feagin JA, Bassett FH. Relationship of gender to anterior cruciate ligament injuries in intercollegiate basketball players. J South Orthop Assoc. 1993;2(1):36–39. [Google Scholar]
- 31.National Collegiate Athletic Association. NCAA injury surveillance system summary. Indianapolis: National Collegiate Athletic Association; 2002. [Google Scholar]
- 32.Padua DA, Carcia CR, Arnold BL, Granata KP. Gender differences in leg stiffness and stiffness recruitment strategy during two-legged hopping. J Mot Behav. 2005;37(2):111–125. doi: 10.3200/JMBR.37.2.111-126. [DOI] [PMC free article] [PubMed] [Google Scholar]
- 33.Palmieri-Smith RM, McLean SG, Ashton-Miller JA, Wojtys EM. Association of quadriceps and hamstrings cocontraction patterns with knee joint loading. J Athl Train. 2009;44(3):256–263. doi: 10.4085/1062-6050-44.3.256. [DOI] [PMC free article] [PubMed] [Google Scholar]
- 34.Quatman CE, Ford KR, Myer GD, Hewett TE. Maturation leads to gender differences in landing force and vertical jump performance: a longitudinal study. Am J Sports Med. 2006;34(5):806–813. doi: 10.1177/0363546505281916. [DOI] [PubMed] [Google Scholar]
- 35.Quatman CE, Ford KR, Myer GD, Paterno MV, Hewett TE. The effects of gender and pubertal status on generalized joint laxity in young athletes. J Sci Med Sport. 2007 Jun 25; doi: 10.1016/j.jsams.2007.05.005. [DOI] [PMC free article] [PubMed] [Google Scholar]
- 36.Shultz SJ. Preventive training programs: changing strength ratios versus positions of muscular efficiency. In: Hewett TE, Shultz SJ, Griffin LY, editors. Understanding and Preventing Noncontact ACL Injuries/American Orthopaedic Society for Sports Medicine. Champaign, IL: Human Kinetics; 2007. pp. 91–101. [Google Scholar]
- 37.Solomonow M, Baratta R, Zhou BH, et al. The synergistic action of the anterior cruciate ligament and thigh muscles in maintaining joint stability. Am J Sports Med. 1987;15(3):207–213. doi: 10.1177/036354658701500302. [DOI] [PubMed] [Google Scholar]
- 38.Stefanyshyn DJ, Nigg BM. Dynamic angular stiffness of the ankle joint during running and sprinting. J Appl Biomech. 1998;14(3):292–299. doi: 10.1123/jab.14.3.292. [DOI] [PubMed] [Google Scholar]
- 39.van den Bogert AJ, de Koning JJ. Proceedings of the IXth Biennial Conference of the Canadian Society for Biomechanics. Vancouver: Simon Fraser University; 1996. On optimal filtering for inverse dynamics analysis. [Google Scholar]
- 40.Wilk KE, Escamilla RF, Fleisig GS, Barrentine SW, Andrews JR, Boyd ML. A comparison of tibiofemoral joint forces and electromyographic activity during open and closed kinetic chain exercises. Am J Sports Med. 1996;24(4):518–527. doi: 10.1177/036354659602400418. [DOI] [PubMed] [Google Scholar]
- 41.Winter DA. Biomechanics and Motor Control of Human Movement. 2nd. New York: John Wiley & Sons; 1990. pp. 91–95. [Google Scholar]
- 42.Winter DA. Biomechanics and Motor Control of Human Movement. 3rd. New York: John Wiley & Sons; 2005. [Google Scholar]
- 43.Wojtys EM, Huston LJ, Schock HJ, Boylan JP, Ashton-Miller JA. Gender differences in muscular protection of the knee in torsion in size-matched athletes. J Bone Joint Surg Am. 2003;85(5):782–789. doi: 10.2106/00004623-200305000-00002. [DOI] [PubMed] [Google Scholar]
- 44.Zazulak BT, Ponce PL, Straub SJ, Medvecky MJ, Avedisian L, Hewett TE. Gender comparison of hip muscle activity during single-leg landing. J Orthop Sports Phys Ther. 2005;35(5):292–299. doi: 10.2519/jospt.2005.35.5.292. [DOI] [PubMed] [Google Scholar]
- 45.Zelisko JA, Noble HB, Porter M. A comparison of men's and women's professional basketball injuries. Am J Sports Med. 1982;10(5):297–299. doi: 10.1177/036354658201000507. [DOI] [PubMed] [Google Scholar]
- 46.Zhang LQ, Wang G. Dynamic and static control of the human knee joint in abduction-adduction. J Biomech. 2001;34(9):1107–1115. doi: 10.1016/s0021-9290(01)00080-x. [DOI] [PubMed] [Google Scholar]
Associated Data
This section collects any data citations, data availability statements, or supplementary materials included in this article.