

Abstract
Objective
To characterize outer retinal structure in Best Vitelliform Macular Dystrophy (BVMD), using spectral domain optical coherence tomography (SD-OCT) and adaptive optics scanning light ophthalmoscopy (AOSLO).
Methods
Four symptomatic members of a family with BVMD with known BEST1 gene mutation were recruited. Thickness of two outer retinal layers corresponding to photoreceptor inner and outer segments were measured using SD-OCT. Photoreceptor mosaic AOSLO images within and around visible lesions were obtained, and cone density was assessed in two subjects.
Results
Each subject was at a different stage of BVMD, with photoreceptor disruption evident by AOSLO at all stages. When comparing SD-OCT and AOSLO images from the same location, AOSLO images allowed for direct assessment of photoreceptor structure. A variable degree of retained photoreceptors was seen within all lesions. The photoreceptor mosaic immediately adjacent to visible lesions appeared contiguous and was of normal density. Fine hyperreflective structures were visualized by AOSLO, and their anatomical orientation and size are consistent with Henle fibers.
Conclusions
AOSLO findings indicate substantial photoreceptor structure persists within active lesions, accounting for good visual acuity in these patients. Despite previous reports of diffuse photoreceptor outer segment abnormalities in BVMD, our data reveal normal photoreceptor structure in areas adjacent to clinical lesions.
Clinical Relevance
This study demonstrates the utility of AOSLO for understanding the spectrum of cellular changes that occur in inherited degenerations such as BVMD. Photoreceptors are often significantly affected at various stages of inherited degenerations, and these changes may not be readily apparent with current clinical imaging instrumentation.
Best Vitelliform Macular Dystrophy (BVMD), also known as Vitelliform Macular Dystrophy type 2 or Best’s Disease (OMIM # 607854; BEST1)is an autosomal dominant form of macular degeneration of variable penetrance characterized by varying accumulation of yellowish vitelliform material in the macula.1,2 Affected individuals also show a reduction in the electrooculogram (EOG) light peak but a normal full-field electroretinogram (ERG).1,3 Mutations in the BEST1 gene on chromosome 11q13 encoding bestrophin-1 cause BVMD.4–6 Bestrophin-1 is an integral membrane protein that has been localized to the basolateral membrane of the retinal pigment epithelium (RPE)7 and is thought to be a Ca+2 sensitive Cl− channel protein or influences the regulation of Ca+2 channels.8
The clinical appearance of BVMD varies by the stage of the disease.2 Initially, retinal fundi may appear normal (previtelliform). Characteristically, there is development of macular fluid- and debris-filled retinal detachments forming a yellow yolk-like or vitelliform lesion or lesions. With time, the vitelliform material may become more heterogenous with various layers (pseudohypopyon) and may appear to dissolve, leaving isolated clumps of material at the edges of the lesion (vitelliruptive). Eventually localized atrophy and fibrosis develops in the location of the vitelliform lesion.2 Despite presence of vitelliform lesion(s), vision is usually good in earlier stages of the disease, visual acuity of 20/40 or better vision being reported in 76% of individuals less than 40 years of age.9 It has been shown that normal acuity can be maintained in individuals having substantial photoreceptor degeneration.10,11 Thus, the good visual acuity in patients with BVMD does not necessarily inform about the degree of photoreceptor degeneration.
Histopathologic findings from BVMD donor eyes are limited but demonstrate abnormal accumulation of lipofuscin granules in the RPE12–15 and photoreceptor degeneration over areas of intact RPE.16,17 Recently a knock-in mouse model of BVMD showed increased accumulation of lipofuscin in the RPE and deposition of subretinal debris composed of unphagocytosed photoreceptor outer segments and lipofuscin granules.18 It is hypothesized that impairment (rather than loss) of RPE to fully degrade phagocytosed outer segments leads to photoreceptor degeneration in BVMD, either alteration of the ionic milieu of the subretinal space due to bestrophin mistargeting or loss of cell-to-cell contact.13,16
Optical coherence tomography (OCT) imaging techniques allow for non-invasive assessment of retinal structure, and numerous studies have utilized this imaging approach to assess outer retinal structure in BVMD.19–23 OCT imaging has shown that the characteristic vitelliform lesions of BVMD are the result of accumulation of material in the subretinal space above the RPE and below the outer segments of the photoreceptors.20,21,24,25 Also, despite bestrophin–1 being localized to the RPE, OCT has shown significant changes to outer retinal structure are evident at various stages of the disease, and it has been suggested that thickening of the reflective layer corresponding to the photoreceptors may be one of the earliest anatomical changes visible by OCT with BVMD.20,21,26 However, examples exist where the resolution of existing OCT technology is not sensitive enough to detect pronounced photoreceptor disruption.27–29 Thus, despite the OCT findings in BVMD, the nature of photoreceptor structure in BVMD remains unclear.
Adaptive optics (AO) imaging systems enable cellular-resolution imaging of the human retina, allowing for direct visualization of cone and rod photoreceptor mosaic.30,31 To better understand photoreceptor structure across the spectrum of BVMD, we used spectral-domain OCT (SD-OCT) and adaptive optics scanning light ophthalmoscopy (AOSLO) to assess retinal structure in four members of the same family who are at various stages of BVMD and have a known BEST1 mutation.
Methods
Four members of a family with a previously identified mutation, p.Arg218Cys (c.652C->T) (University of California Ophthalmic Molecular Diagnostic Lab, La Jolla, CA), in the BEST1 gene reported to be causative mutation in BVMD32 and with clinical findings consistent with BVMD participated (Table 1, eFigure 1). The p.Arg218Cys mutation is predicted to affect the charge of the bestrophin protein, altering its function. Visual acuity was assessed, and a comprehensive eye exam including fundus photography was performed for all four subjects. Each patient was dilated using one drop of phenylephrine (2.5%). Mircoperimerty was performed. Then accommodation was suspended using one drop of tropicamide (1%) for subsequent high-resolution imaging. Axial length was measured using an IOL Master (Carl Zeiss Meditec, Dublin, CA). This prospective study was conducted in accordance with the tenets of the Declaration of Helsinki and with institutional review board approval.
Table 1.
Patient Demographics
| Subject | Age, y | Gender | Mutation in Best1 gene | Type of Lesion* | Visual Acuity** (OD, OS) | Axial Length (OD, OS, mm) | Eye imaged with AOSLO |
|---|---|---|---|---|---|---|---|
| IV-3 | 16 | M | Arg218Cys (c.652C->T) | Early vitelliform | 20/20, 20/20 | 22.57/22.14 | OS |
| IV-2 | 18 | F | Arg218Cys (c.652C->T) | Vitelliform with early vitelliruptive | 20/20, 20/20 | 22.72/22.62 | OS |
| III-5 | 50 | F | Arg218Cys (c.652C->T) | Late vitelliruptive | 20/30, 20/100 | 22.11/21.98 | OD |
| III-4 | 59 | F | Arg218Cys (c.652C->T) | Atrophic | 20/200, 20/50 | 23.14/23.69 | OS |
Same lesion type in both eyes,
Snellen
y-years, OD –right, OS –left, M-male, F- female, mm- millimeters
Macular microperimetry was performed using the Spectral OCT/SLO MP system (OPKO instrumentation) after a brief training to allow for familiarization of the test. A Polar 3 standardized grid composed of 28 points arranged in 3 concentric circles (2.3°, 6.6°, and 11° in diameter from fovea, 4 points in innermost circle, 12 in middle and outer circles) was performed using a Goldman III stimulus, a 200ms duration and a test strategy 4-2. Results were compared to previously published normative data33.
Volumetric images of the macula were obtained using Cirrus HD-OCT (Carl Zeiss Meditec, Dublin, CA). Volumes were nominally 6 mm × 6 mm and consisted of 128 B-scans (512 A-scans/B-scan). Retinal thickness was assessed using the built-in macular analysis software (software version 5.0), which is automatically generated by calculating the difference between the inner limiting membrane (ILM) and RPE boundaries. The software’s “fovea finder” algorithm was used to determine the location of the fovea on the line scanning ophthalmoscope (LSO) image. Additional high-density line scans (1000 A-scans/B-scan, 100 repeated B scans) were acquired through the foveal center in the study eye of each participant using the Bioptigen SD-OCT (Bioptigen, Inc., Research Triangle Park, NC). Line scans were registered and averaged to reduce speckle noise in the image using previously described techniques,34 and were acquired in both the horizontal and vertical direction. All scans shown in the figures are from the Bioptigen device. Numerous naming conventions exist in the literature for the outer hyperreflective layers in SD-OCT scans, so it is important to define the one used here. Shown in Figure 1 is a horizontal line scan from a normal control, and a corresponding longitudinal reflectivity profile (LRP), showing the identity of the bands analyzed.35,36 The innermost band corresponds to the external limiting membrane (ELM), the second band corresponds to the inner segment ellipsoid (ISe),37 the third band corresponds to the outer segment/RPE interface (RPE1), and the fourth band corresponds to the RPE (RPE2). The peak-to-peak distance between the ELM and ISe is taken as the length of the inner segments (IS), while the peak-to-peak distance between the ISe and RPE1 is taken as the length of the outer segments (OS). While these may not correspond precisely to the absolute IS or OS length, we utilized these same definitions in an extensive previously published normative dataset.36 We examined the IS and OS length across the horizontal line scan from each subject, sampling the scan at 0.2mm intervals. We excluded the central BVMD-related lesion from further analysis, similar to a previous report.21 Images of the photoreceptor mosaic were acquired using a previously described AOSLO.30,38 Images were obtained using an Inphenix 775nm superluminescent diode 12nm FWHM bandwidth with either a,1.0 or 1.75 degree square field of view. The fovea and surrounding areas affected by pathology were imaged in each patient. Parafoveal images (~0.65 degrees from fixation) were acquired by instructing the patient to fixate on the corners or edges of the raster, while more eccentric images were acquired using an internal fixation target. Intraframe distortions within the AOSLO retinal images were corrected as previously described.30,39 Registration of frames within a given image sequence was performed using a “strip” registration method, in which the images were registered by dividing the image of interest into strips, aligning each strip to the location in the reference frame that maximizes the normalized cross correlation between them.39 Once all the frames were registered, the 50 frames with the highest normalized cross correlation to the reference frame were averaged, in order to generate a final image with an increased signal to noise ratio (SNR).
Figure 1.
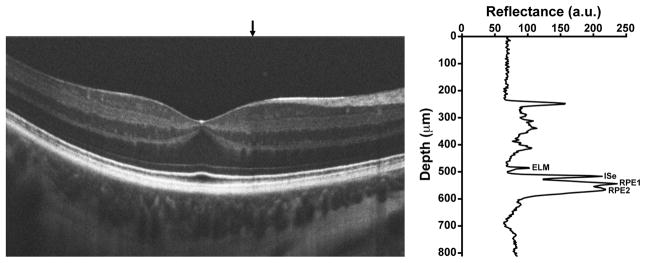
Assignment of outer retinal bands on SD-OCT. Shown is a horizontal line scan through the fovea of a normal subject. The graph on the right is a longitudinal reflectivity profile (LRP) acquired at the location of the vertical black arrow above the SD-OCT scan. ELM=external limiting membrane, ISe=inner segment ellipsoid, RPE1=outer segment/RPE interface, RPE2=RPE.
These registered and averaged AOSLO images were then montaged using Adobe Photoshop (Adobe Systems, Inc., CA). The montage was aligned to the color fundus images and the LSO image from the Cirrus HD-CT, which was exported with the location of the foveal pit marked. Scaling of the images was done based on the expected scale of each image and alignment was done manually utilizing blood vessel patterns. Cone density was assessed using 55μm × 55μm sampling areas adjacent to the visible lesion in two subjects and near the fovea within the active lesion in all four subjects using a previously described semi-automated algorithm.40 The distance between the sampled area and the foveal pit was measured, enabling comparison of density values to previously published normative values.
Results
Four affected subjects from a family with BVMD with known p.Arg218Cys mutation in BEST1 gene participated. (eFigure 1) All family members were found to be at different stages of the disease, summarized in Table 1. The SD-OCT and AOSLO imaging findings were unique to each stage (Figures 2–5).. Macular microperimetry performed within a 6 degree radius of the fovea revealed areas of subnormal individual point sensitivities in regions corresponding to clinical retinal lesions (lower left, Figures 2–5) in all but subject IV-3 with early vitelliform findings. In patient IV-2, decreased point sensitivities were seen both in regions surrounding the vitelliform lesion and overlying the lesion itself.
Figure 2.

Imaging of IV-3, left eye – Early vitelliform findings. Fundus exam revealed a focal area of granularity just temporal to the fovea (upper left). SD-OCT horizonal and vertical scans show normal retinal lamination but focal increased hyper-reflectivity in the area of granularity seen clinically (upper right). Macular microperimetry showed normal point sensitivities in the central 12 degrees (overlay, left lower) Adaptive optics imaging of this location (montage registered lower left, area imaged indicated by arrows on SD-OCT upper right) shows focal photoreceptor mosaic disruption around the area of hyper-reflectivity on OCT with photoreceptor mosaic surrounding this area appearing normal (lower right).
Figure 5.

Imaging of III-4, left eye - Atrophy and Fibrosis. Fundus exam shows central hypopigmentation with focal pigment mottling and trace epiretinal membrane (ERM) (upper left). SD-OCT horizontal and vertical scans show a lamellar hole, trace ERM and loss of the hyperreflective ISe band (upper right). Macular microperimetry revealed subnormal point sensitivities in areas central and temporal to fovea when fibrosis and atrophy are present clinically (overlay, left lower). Adaptive optics imaging of central fovea (montage registered lower left, area imaged indicated by arrows on SD-OCT upper right) reveal patchy areas of retained photoreceptors between areas of significant photoreceptor loss (lower right).
Measurement of IS and OS retinal thickness was performed using the SD-OCT horizontal line scan in all four subjects. Shown in Figure 6 is the IS and OS thickness profile in areas immediately adjacent to clinical visible lesions for all four subjects compared to data from a previously published normative group.41 Thickness values were not calculated over the visible lesion. All 4 subjects were found to have IS and OS thickness values within 2 standard deviations of normative data.
Figure 6.

Assessment of photoreceptor layer thickness in BVMD. Top, plot of inner segments (IS) length as a function of retinal location along the horizontal meridian. Bottom, outer segment (OS) length as a function of retinal location along the horizontal meridian. Black line – normative data from 93 people, average age 25.7 years with standard deviation (stdev) of 8.2 years. Shaded grey area is + 2 stdev. Open squares – subject IV-2, Open circles – subject IV-3, Filled squares – subject III-5, Filled circles – subject III-4. Thickness values were not calculated over visible lesion(s).
We sought to further assess photoreceptor structure in the retinal area adjacent to the BVMD lesions. In two patients having lesions with a clear boundary, we were able to obtain AOSLO montages that were large enough to encompass the entire lesion (Figure 2, eFigure 2). We assessed cone density just nasal to the lesion boundary in both IV-3 and IV-2, and determined that the areas sampled were 1 degree from the foveal center. The cone mosaic appeared contiguous and cone density was 55,900 cones/mm2 in IV-3 and 43, 700 cones/mm2 in IV-2. Both values are within the normal range for this retinal eccentricity.41
In the SD-OCT scans of one of the subjects (IV-2) we noticed significant hyperreflective material in the outer nuclear layer (ONL). This has been previously reported in BVMD,42 and is attributed to the physical deformation of the Henle fiber layer by the underlying vitelliform lesion. Inspection of the SD-OCT volume revealed the strongest signal in the inferior retina, just nasal to the fovea. AOSLO images from this same location focused in the inner retina revealed thin hyperreflective structures running perpendicular to the nerve fiber layer (Figure 7). The anatomical location and orientation is consistent with that of Henle fibers, and the diameter of these structures (average = 2.76 ± 0.32 μm) is consistent with previous histology reports.43
Figure 7.

Visualization of Henle fiber layer in BVMD. Presence of the vitelliform lesion has altered the angle of retina structure, allowing for visualization of Henle fiber layer on SD-OCT (arrows, top). AOSLO imaging at this same location focused at the level of the inner retina revealed thin hyperreflective structures running perpendicular to nerve fiber bundles, consistent with known anatomy of Henle fibers (lower).
Comment
In our study we used SD-OCT and AOSLO to assess outer retinal structure in four members of a single family harboring a previously reported BEST1 mutation (p.Arg218Cys). The phenotypes ranged from early vitelliform changes to a central atrophic area. Disruption of the cone mosaic was evident in the AOSLO images at all stages of BVMD presented here, including the patient with the earliest stage of vitelliform clinical findings (Figure 2), suggesting this is an early finding in patients with BVMD. The degree of this photoreceptor disruption varied by stage of disease, and was often patchy with areas of significant photoreceptor disruption surrounded by areas of a contiguous photoreceptor mosaic, even in the patient with advanced atrophy and fibrosis. (Figure 5) It is important to note that disruption of visualization of cone structure on AOSLO does not necessarily mean the cone cell has been lost. When comparing SD-OCT and AOSLO images from the same location, the AOSLO images allowed for better understanding of the degree of retained photoreceptor structure at that location. This is illustrated in the patient with late vitelliruptive changes (Figure 4). SD-OCT of this individual shows significant disruption of the hyperreflective ISe band in the areas of subretinal nodules, but the AOSLO images reveal islands of contiguous cone mosaic adjacent to areas of significant disruption.
Figure 4.

Imaging of III-5, right eye – Vitelliruptive. Fundus exam reveals an ovoid area of hypopigmentation containing several fibrotic nodules (upper left). SD-OCT horizontal and vertical scans show outer retinal atrophy and several focal deposits of debris in the subretinal space, some separated by trace subretinal fluid. Patchy disruption of the hyperreflective ISe band is evident in some areas (upper right). Macular microperimetry revealed subnormal point sensitivities in all areas of central 6 degrees (overlay, left lower). Adaptive optics imaging of central fovea (montage registered lower left, area imaged indicated by arrows on SD-OCT upper right) reveals significant photoreceptor mosaic disruption overlying these nodules, but relative preservation of the photoreceptor mosaic surrounding these lesions (lower right).
Previous studies have suggested that loss of photoreceptors in BVMD could be widespread and not necessarily confined to the clinically apparent lesions, and support for this comes from the fact that bestrophin, the RPE membrane protein encoded by the BEST1 gene, is found throughout the retina in individuals unaffected by BVMD.17 Kay et al. recently showed increased photoreceptor thickness on SD-OCT in patients with BVMD when compared to normal controls within the macular region.21 Based on their findings, they conclude that the primary anatomical impact is at the photoreceptor level. Certainly, our finding that the photoreceptor mosaic is disrupted in the earliest stage of clinical vitelliform findings would be consistent with this proposed etiology, but our finding of normal IS and OS thickness and normal cone density in retinal areas adjacent to visible lesions argues against a diffuse structural deficit in BVMD. One possible explanation is that the previous study did not correct the lateral scale of their SD-OCT scans for individual differences in axial length, meaning that different extents of retina contributed to the analysis in each retina. Moreover, since the previous analysis averaged the thickness measurements across the scan, it is unclear if the retina was indeed uniformly affected or if a small retinal area was severely abnormal.21 Nevertheless, while our findings do not support diffuse disruption of the cone mosaic outside the lesion, it is possible that these cells may not be functioning normally.
Interestingly, macular microperimetry revealed areas of subnormal point sensitivities in areas surrounding the vitelliform lesion in subject IV-2. Both SD-OCT and AOSLO showed normal outer retinal anatomy within these regions. These reduced point sensitivities may be result of eye movements reducing the specificity of registration to the fundus. However, it may also be possible that functional loss of vision precedes anatomical outer retinal structural loss. High resolution microperimetric assessment using adaptive optics technology has been described.44,45 To better understand and correlate functional vision to photoreceptor mosaic structure pathology, future studies would benefit from AOSLO based microperimetry allowing for functional assessment at resolutions on par to those used to assess retinal structure.
It is becoming appreciated that outer retinal pathology can affect the appearance of the overlying retina on SD-OCT. For example, presence of a vitelliform lesion, large drusen, or pigment epithelial detachment alters the orientation of the fibers of Henle as they traverse the lesion, altering their reflectivity on SD-OCT.46,47 We also observed this effect in one of our subjects (IV-2), however we also observed the presence of fine hyperreflective structures running perpendicular to the nerve fiber bundles in the AOSLO images at the same retinal location (Figure 7). Their anatomical location, orientation, and size are consistent with that of Henle fibers. As seen with SD-OCT, this demonstrates that when imaged with AOSLO, outer retinal disruptions can alter the appearance of the inner retina, and this should be taken into consideration when analyzing such images.
A potential limitation of the current study is that all four subjects have the same genetic mutation in the BEST1 gene. While our data reveal a spectrum of clinical and subclinical findings associated with this particular mutation, it is not possible to extend our findings on the integrity of the cone mosaic to other mutations. Future investigations should include high-resolution imaging of other individuals with different mutations in BEST1 gene to investigate possible genotype-dependent differences in photoreceptor structure.
In summary, we provide evidence from cellular imaging with AOSLO that photoreceptor structure can be retained within active BVMD lesions, even in apparently atrophic lesions. This photoreceptor structure is capable of supporting rather good visual acuity, as visual acuity in the eyes imaged here ranged from 20/20 to 20/50. In addition, our SD-OCT and AOSLO data show normal photoreceptor structure in retinal areas outside the clinically visible lesion, in contrast to previous reports21, but consistent with previous findings with AOSLO.48 This may represent a specific feature of the mutation studied here, or be due to different imaging and measurement procedures. Regardless, our study highlights the utility of AOSLO imaging in directly delineating the degree of retained photoreceptor structure in diseases like BVMD. In particular, combining information from SD-OCT with that from AOSLO gives a complementary view of outer retinal structure and provides a more sensitive approach for measuring photoreceptor structure than either alone.
Supplementary Material
Pedigree of family with Best Vitelliform Macular Dystrophy caused by Arg218Cys (c.652C>T) mutation in BEST1 gene. Individuals marked with “*” were imaged in this study. (will be moved from here…)
Figure 3.

Imaging of IV-2, left eye – Vitelliform lesion with early vitelliruptive changes. Fundus exam reveals single heterogeneous vitellform lesion centered just temporal to fovea (upper left). SD-OCT horizonal and vertical scans show the vitelliform lesion contains fluid and debris within the subretinal space. There is patchy disruption of the hyperreflective ISe band over the lesion (upper right). Macular microperimetry revealed subnormal point sensitivities in areas overlying the vitelliform lesion and immediately surrounding it. (overlay, left lower). Adaptive optics imaging of the vitelliform lesion and area immediately surrounding this (montage registered lower left, area imaged indicated by arrows on SD-OCT upper right) reveals disrupted photoreceptor mosaic over the lesion with normal mosaic seen immediately adjacent to the lesion.
Acknowledgments
This publication was supported by the National Center for Research Resources and the National Center for Advancing Translational Sciences, National Institutes of Health, through Grant Number 8UL1TR000055. Its contents are solely the responsibility of the authors and do not necessarily represent the official views of the NIH. Additional support from the Clinical and Translational Science Institute and the Biotechnology Innovation Center, Medical College of WI, CTSA Grant UL1 RR 031973, the Thomas M. Aaberg Sr. Retina Research Fund, the Gene and Ruth Posner Foundation, the RD and Linda Peters Foundation, Research to Prevent Blindness, and NIH (R01EY017607, P30EY001931, T32EY014537). P. Godara is supported by a research award from the VitreoRetinal Surgery Foundation. J. Carroll and A. Dubra are recipients of Career Development Awards from RPB. A. Dubra holds a Career Award at the Scientific Interface from the Burroughs Wellcome This investigation was conducted in a facility constructed with support from the Research Facilities Improvement Program, grant number C06 RR016511, from the National Center for Research Resources, National Institutes of Health.
The authors would like to acknowledge Phyllis Summerfelt for her technical/administrative assistance in figure preparation. Dr. Stepien had full access to all the data in the study and takes responsibility for the integrity of the data and the accuracy of the data analysis.
Footnotes
Presented in part at the Association for Research in Vision and Ophthalmology annual meeting 2012, Fort Lauderdale, FL, poster session, May 9th, 2012.
References
- 1.Blodi CF, Stone EM. Best’s vitelliform dystrophy. Ophthalmic Paediatr Genet. 1990 Mar;11(1):49–59. [PubMed] [Google Scholar]
- 2.Gass J. Stereoscopic Atlas of Macular Diseases: Diagnosis and Treatment. 4. Vol. 1. St. Louis: Mosby; 1997. Best’s Disease; pp. 304–311. [Google Scholar]
- 3.Cross HE, Bard L. Electro-oculography in Best’s macular dystrophy. Am J Ophthalmol. 1974 Jan;77(1):46–50. doi: 10.1016/0002-9394(74)90603-5. [DOI] [PubMed] [Google Scholar]
- 4.Marquardt A, Stohr H, Passmore LA, Kramer F, Rivera A, Weber BH. Mutations in a novel gene, VMD2, encoding a protein of unknown properties cause juvenile-onset vitelliform macular dystrophy (Best’s disease) Hum Mol Genet. 1998 Sep;7(9):1517–1525. doi: 10.1093/hmg/7.9.1517. [DOI] [PubMed] [Google Scholar]
- 5.Petrukhin K, Koisti MJ, Bakall B, et al. Identification of the gene responsible for Best macular dystrophy. Nat Genet. 1998 Jul;19(3):241–247. doi: 10.1038/915. [DOI] [PubMed] [Google Scholar]
- 6.Stone EM, Nichols BE, Streb LM, Kimura AE, Sheffield VC. Genetic linkage of vitelliform macular degeneration (Best’s disease) to chromosome 11q13. Nat Genet. 1992 Jul;1(4):246–250. doi: 10.1038/ng0792-246. [DOI] [PubMed] [Google Scholar]
- 7.Marmorstein AD, Marmorstein LY, Rayborn M, Wang X, Hollyfield JG, Petrukhin K. Bestrophin, the product of the Best vitelliform macular dystrophy gene (VMD2), localizes to the basolateral plasma membrane of the retinal pigment epithelium. Proc Natl Acad Sci U S A. 2000 Nov 7;97(23):12758–12763. doi: 10.1073/pnas.220402097. [DOI] [PMC free article] [PubMed] [Google Scholar]
- 8.Sun H, Tsunenari T, Yau KW, Nathans J. The vitelliform macular dystrophy protein defines a new family of chloride channels. Proc Natl Acad Sci U S A. 2002 Mar 19;99(6):4008–4013. doi: 10.1073/pnas.052692999. [DOI] [PMC free article] [PubMed] [Google Scholar]
- 9.Fishman GA, Baca W, Alexander KR, Derlacki DJ, Glenn AM, Viana M. Visual acuity in patients with best vitelliform macular dystrophy. Ophthalmology. 1993 Nov;100(11):1665–1670. doi: 10.1016/s0161-6420(93)31420-x. [DOI] [PubMed] [Google Scholar]
- 10.Carroll J, Neitz M, Hofer H, Neitz J, Williams DR. Functional photoreceptor loss revealed with adaptive optics: an alternate cause of color blindness. Proc Natl Acad Sci U S A. 2004 Jun 1;101(22):8461–8466. doi: 10.1073/pnas.0401440101. [DOI] [PMC free article] [PubMed] [Google Scholar]
- 11.Geller AM, Sieving PA. Assessment of foveal cone photoreceptors in Stargardt’s macular dystrophy using a small dot detection task. Vision Res. 1993 Jul;33(11):1509–1524. doi: 10.1016/0042-6989(93)90144-l. [DOI] [PubMed] [Google Scholar]
- 12.Frangieh GT, Green WR, Fine SL. A histopathologic study of Best’s macular dystrophy. Arch Ophthalmol. 1982 Jul;100(7):1115–1121. doi: 10.1001/archopht.1982.01030040093017. [DOI] [PubMed] [Google Scholar]
- 13.Mullins RF, Oh KT, Heffron E, Hageman GS, Stone EM. Late development of vitelliform lesions and flecks in a patient with best disease: clinicopathologic correlation. Arch Ophthalmol. 2005 Nov;123(11):1588–1594. doi: 10.1001/archopht.123.11.1588. [DOI] [PubMed] [Google Scholar]
- 14.O’Gorman S, Flaherty WA, Fishman GA, Berson EL. Histopathologic findings in Best’s vitelliform macular dystrophy. Arch Ophthalmol. 1988 Sep;106(9):1261–1268. doi: 10.1001/archopht.1988.01060140421045. [DOI] [PubMed] [Google Scholar]
- 15.Weingeist TA, Kobrin JL, Watzke RC. Histopathology of Best’s macular dystrophy. Arch Ophthalmol. 1982 Jul;100(7):1108–1114. doi: 10.1001/archopht.1982.01030040086016. [DOI] [PubMed] [Google Scholar]
- 16.Bakall B, Radu RA, Stanton JB, et al. Enhanced accumulation of A2E in individuals homozygous or heterozygous for mutations in BEST1 (VMD2) Exp Eye Res. 2007 Jul;85(1):34–43. doi: 10.1016/j.exer.2007.02.018. [DOI] [PubMed] [Google Scholar]
- 17.Mullins RF, Kuehn MH, Faidley EA, Syed NA, Stone EM. Differential macular and peripheral expression of bestrophin in human eyes and its implication for best disease. Invest Ophthalmol Vis Sci. 2007 Jul;48(7):3372–3380. doi: 10.1167/iovs.06-0868. [DOI] [PubMed] [Google Scholar]
- 18.Zhang Y, Stanton JB, Wu J, et al. Suppression of Ca2+ signaling in a mouse model of Best disease. Hum Mol Genet. 2010 Mar 15;19(6):1108–1118. doi: 10.1093/hmg/ddp583. [DOI] [PMC free article] [PubMed] [Google Scholar]
- 19.Chacon–Camacho OF, Camarillo–Blancarte L, Zenteno JC. OCT findings in young asymptomatic subjects carrying familial BEST1 gene mutations. Ophthalmic Genet. 2011 Mar;32(1):24–30. doi: 10.3109/13816810.2010.524906. [DOI] [PubMed] [Google Scholar]
- 20.Ferrara DC, Costa RA, Tsang S, Calucci D, Jorge R, Freund KB. Multimodal fundus imaging in Best vitelliform macular dystrophy. Graefes Arch Clin Exp Ophthalmol. 2010 Oct;248(10):1377–1386. doi: 10.1007/s00417-010-1381-2. [DOI] [PMC free article] [PubMed] [Google Scholar]
- 21.Kay CN, Abramoff MD, Mullins RF, et al. Three-dimensional distribution of the vitelliform lesion, photoreceptors, and retinal pigment epithelium in the macula of patients with best vitelliform macular dystrophy. Arch Ophthalmol. 2012 Mar;130(3):357–364. doi: 10.1001/archophthalmol.2011.363. doi: 310.1001/archophthalmol.2011.1363. Epub 2011 Nov 1014. [DOI] [PMC free article] [PubMed] [Google Scholar]
- 22.Schatz P, Bitner H, Sander B, et al. Evaluation of macular structure and function by OCT and electrophysiology in patients with vitelliform macular dystrophy due to mutations in BEST1. Invest Ophthalmol Vis Sci. 2010 Sep;51(9):4754–4765. doi: 10.1167/iovs.10-5152. [DOI] [PubMed] [Google Scholar]
- 23.Spaide RF, Noble K, Morgan A, Freund KB. Vitelliform macular dystrophy. Ophthalmology. 2006 Aug;113(8):1392–1400. doi: 10.1016/j.ophtha.2006.03.023. [DOI] [PubMed] [Google Scholar]
- 24.Pianta MJ, Aleman TS, Cideciyan AV, et al. In vivo micropathology of Best macular dystrophy with optical coherence tomography. Exp Eye Res. 2003 Feb;76(2):203–211. doi: 10.1016/s0014-4835(02)00280-4. [DOI] [PubMed] [Google Scholar]
- 25.Querques G, Regenbogen M, Soubrane G, Souied EH. High-resolution spectral domain optical coherence tomography findings in multifocal vitelliform macular dystrophy. Surv Ophthalmol. 2009 Mar-Apr;54(2):311–316. doi: 10.1016/j.survophthal.2008.12.010. [DOI] [PubMed] [Google Scholar]
- 26.Querques G, Zerbib J, Santacroce R, et al. The spectrum of subclinical Best vitelliform macular dystrophy in subjects with mutations in BEST1 gene. Invest Ophthalmol Vis Sci. 2011;52(7):4678–4684. doi: 10.1167/iovs.10-6500. [DOI] [PubMed] [Google Scholar]
- 27.Rha J, Dubis AM, Wagner-Schuman M, et al. Spectral domain optical coherence tomography and adaptive optics: imaging photoreceptor layer morphology to interpret preclinical phenotypes. Adv Exp Med Biol. 2010;664:309–316. doi: 10.1007/978-1-4419-1399-9_35. [DOI] [PMC free article] [PubMed] [Google Scholar]
- 28.Stepien KE, Han DP, Schell J, Godara P, Rha J, Carroll J. Spectral-domain optical coherence tomography and adaptive optics may detect hydroxychloroquine retinal toxicity before symptomatic vision loss. Trans Am Ophthalmol Soc. 2009 Dec;107:28–33. [PMC free article] [PubMed] [Google Scholar]
- 29.Stepien KE, Martinez WM, Dubis AM, Cooper RF, Dubra A, Carroll J. Subclinical photoreceptor disruption in response to severe head trauma. Arch Ophthalmol. 2012 Mar;130(3):400–402. doi: 10.1001/archopthalmol.2011.1490. [DOI] [PMC free article] [PubMed] [Google Scholar]
- 30.Dubra A, Sulai Y, Norris JL, et al. Noninvasive imaging of the human rod photoreceptor mosaic using a confocal adaptive optics scanning ophthalmoscope. Biomed Opt Express. 2011 Jul 1;2(7):1864–1876. doi: 10.1364/BOE.2.001864. [DOI] [PMC free article] [PubMed] [Google Scholar]
- 31.Rossi EA, Chung M, Dubra A, Hunter JJ, Merigan WH, Williams DR. Imaging retinal mosaics in the living eye. Eye (Lond) 2011 Mar;25(3):301–308. doi: 10.1038/eye.2010.221. [DOI] [PMC free article] [PubMed] [Google Scholar]
- 32.Caldwell GM, Kakuk LE, Griesinger IB, et al. Bestrophin gene mutations in patients with Best vitelliform macular dystrophy. Genomics. 1999 May 15;58(1):98–101. doi: 10.1006/geno.1999.5808. [DOI] [PubMed] [Google Scholar]
- 33.Anastasakis A, McAnany JJ, Fishman GA, Seiple WH. Clinical value, normative retinal sensitivity values, and intrasession repeatability using a combined spectral domain optical coherence tomography/scanning laser ophthalmoscope microperimeter. Eye (Lond) 2011 Feb;25(2):245–251. doi: 10.1038/eye.2010.158. doi: 210.1038/eye.2010.1158. Epub 2010 Oct 1029. [DOI] [PMC free article] [PubMed] [Google Scholar]
- 34.Tanna H, Dubis AM, Ayub N, et al. Retinal imaging using commercial broadband optical coherence tomography. Br J Ophthalmol. 2010 Mar;94(3):372–376. doi: 10.1136/bjo.2009.163501. [DOI] [PMC free article] [PubMed] [Google Scholar]
- 35.Huang Y, Cideciyan AV, Papastergiou GI, et al. Relation of optical coherence tomography to microanatomy in normal and rd chickens. Invest Ophthalmol Vis Sci. 1998 Nov;39(12):2405–2416. [PubMed] [Google Scholar]
- 36.McAllister JT, Dubis AM, Tait DM, et al. Arrested development: high-resolution imaging of foveal morphology in albinism. Vision Res. 2010 Apr 7;50(8):810–817. doi: 10.1016/j.visres.2010.02.003. [DOI] [PMC free article] [PubMed] [Google Scholar]
- 37.Spaide RF, Curcio CA. Anatomical correlates to the bands seen in the outer retina by optical coherence tomography: literature review and model. Retina. 2011 Sep;31(8):1609–1619. doi: 10.1097/IAE.0b013e3182247535. [DOI] [PMC free article] [PubMed] [Google Scholar]
- 38.Dubra A, Sulai Y. Reflective afocal broadband adaptive optics scanning ophthalmoscope. Biomed Opt Express. 2011 Jun 1;2(6):1757–1768. doi: 10.1364/BOE.2.001757. [DOI] [PMC free article] [PubMed] [Google Scholar]
- 39.Dubra AHZ. Biomedical Image Registration. Vol. 6204. Heidelberg: Springer; 2010. Registration of 2D images from fast scanning ophthalmic instruments; pp. 60–71. [Google Scholar]
- 40.Garrioch R, Langlo C, Dubis AM, Cooper RF, Dubra A, Carroll J. Repeatability of in vivo parafoveal cone density and spacing measurements. Optom Vis Sci. 2012 May;89(5):632–643. doi: 10.1097/OPX.0b013e3182540562. [DOI] [PMC free article] [PubMed] [Google Scholar]
- 41.Carroll J, Baraas RC, Wagner-Schuman M, et al. Cone photoreceptor mosaic disruption associated with Cys203Arg mutation in the M-cone opsin. Proc Natl Acad Sci U S A. 2009 Dec 8;106(49):20948–20953. doi: 10.1073/pnas.0910128106. [DOI] [PMC free article] [PubMed] [Google Scholar]
- 42.Lujan BJ, Bayabo JKT, Croskrey J, Cooper RF, Dubis AM, Carroll J, Roorda A. Interpretation of SDOCT Photoreceptor Bands Sometimes Depends On How You Look At Them. ARVO Meeting Abstracts. 2012 Mar 26;53:3169. 2012. [Google Scholar]
- 43.Hogan MJ, AJA, Weddell JE. Histology of the Human Eye. Philadelphia: Saunders; 1971. [Google Scholar]
- 44.Makous W, Carroll J, Wolfing JI, Lin J, Christie N, Williams DR. Retinal microscotomas revealed with adaptive-optics microflashes. Invest Ophthalmol Vis Sci. 2006 Sep;47(9):4160–4167. doi: 10.1167/iovs.05-1195. [DOI] [PubMed] [Google Scholar]
- 45.Tuten WS, Tiruveedhula P, Roorda A. Adaptive optics scanning laser ophthalmoscope-based microperimetry. Optom Vis Sci. 2012 May;89(5):563–574. doi: 10.1097/OPX.0b013e3182512b98. doi: 510.1097/OPX.1090b1013e3182512b3182598. [DOI] [PMC free article] [PubMed] [Google Scholar]
- 46.Lujan BJ, Roorda A, Knighton RW, Carroll J. Revealing Henle’s fiber layer using spectral domain optical coherence tomography. Invest Ophthalmol Vis Sci. 2011 Mar;52(3):1486–1492. doi: 10.1167/iovs.10-5946. [DOI] [PMC free article] [PubMed] [Google Scholar]
- 47.Otani T, Yamaguchi Y, Kishi S. Improved visualization of Henle fiber layer by changing the measurement beam angle on optical coherence tomography. Retina. 2011 Mar;31(3):497–501. doi: 10.1097/IAE.0b013e3181ed8dae. [DOI] [PubMed] [Google Scholar]
- 48.Duncan JL, Sundquist SM, Solovyev A, et al. Cone Structure in Patients With BEST1 Mutations. ARVO Meeting Abstracts. 2010 Apr 11;51(5):4328. 2010. [Google Scholar]
Associated Data
This section collects any data citations, data availability statements, or supplementary materials included in this article.
Supplementary Materials
Pedigree of family with Best Vitelliform Macular Dystrophy caused by Arg218Cys (c.652C>T) mutation in BEST1 gene. Individuals marked with “*” were imaged in this study. (will be moved from here…)