Abstract
Reduced expression of the INDY (I'm not dead yet) tricarboxylate carrier increased the life span in different species by mechanisms akin to caloric restriction. Mammalian INDY homolog (mIndy, SLC13A5) gene expression seems to be regulated by hormonal and/or nutritional factors. The underlying mechanisms are still unknown. The current study revealed that mIndy expression and [14C]-citrate uptake was induced by physiological concentrations of glucagon via a cAMP-dependent and cAMP-responsive element–binding protein (CREB)–dependent mechanism in primary rat hepatocytes. The promoter sequence of mIndy located upstream of the most frequent transcription start site was determined by 5′-rapid amplification of cDNA ends. In silico analysis identified a CREB-binding site within this promoter fragment of mIndy. Functional relevance for the CREB-binding site was demonstrated with reporter gene constructs that were induced by CREB activation when under the control of a fragment of a wild-type promoter, whereas promoter activity was lost after site-directed mutagenesis of the CREB-binding site. Moreover, CREB binding to this promoter element was confirmed by chromatin immunoprecipitation in rat liver. In vivo studies revealed that mIndy was induced in livers of fasted as well as in high-fat-diet–streptozotocin diabetic rats, in which CREB is constitutively activated. mIndy induction was completely prevented when CREB was depleted in these rats by antisense oligonucleotides. Together, these data suggest that mIndy is a CREB-dependent glucagon target gene that is induced in fasting and in type 2 diabetes. Increased mIndy expression might contribute to the metabolic consequences of diabetes in the liver.
Introduction
Reduced expression of the INDY (I’m not dead yet) gene regulates life span by mechanisms that share important similarities with caloric restriction—the most reliable intervention to prolong life span over a wide range of species (1–3)—in Drosophila melanogaster (4) and Caenorhabditis elegans (5). For example, INDY-reduced long-lived flies show decreased whole-body fat stores and expression of insulin-like proteins (6). The INDY gene product is a cation-independent, electroneutral tricarboxylate carrier (7–9) able to transport citrate across the plasma membrane as its preferred substrate and is mainly expressed in organs involved in energy homeostasis in flies (10).
In mammals, the gene product of the mammalian Indy (mIndy, SLC13A5) homolog, the sodium-coupled citrate transporter (NaCT) INDY, shares the highest sequence and functional similarity with D melanogaster INDY (8), and mIndy is predominantly expressed on the plasma membrane of hepatocytes (9,11,12). We recently showed that deleting mIndy in mice also mimics important aspects of caloric restriction (13), without reducing caloric intake, and protects from high-fat diet (HFD)– and aging-induced adiposity and insulin resistance. Therefore, upstream modulators of mIndy expression hold the intriguing potential to modify mammalian metabolic regulation by controlling di-/tricarboxylate uptake into hepatocytes (14); however, no such modulators have been identified.
Limited recent evidence suggests that mIndy is regulated on the transcriptional level through changes in hormonal and/or nutritional status, such as with lipid gavaging or long-term fasting (6,13,15). Moreover, previous studies have demonstrated that the hormone glucagon markedly contributes to the uptake of citrate from the plasma into the liver (16). It is thus plausible to hypothesize that glucagon is a hormonal regulator of mIndy transcription and/or activity, increasing the uptake of citrate by the liver and thereby affecting hepatic intermediary metabolism.
Research Design and Methods
Animal Experiments
For fasting studies, animals were fed ad libitum on standard rodent chow leading up to the experiment. The night before the start of the experiment, food was removed in one group but was left in the control group. In the morning, rats were killed and livers were taken and kept snap-frozen in liquid nitrogen until analysis. For citrate uptake experiments, 10 µCi of [14C]-citrate was injected intraperitoneally 1 h before rats were killed. Uptake of citrate was normalized to protein. For the type 2 diabetic (T2D) rat model, rats were then given a 175 mg/kg dose of nicotinamide by intraperitoneal injection; after 15 min, rats were then dosed with 65 mg/kg of streptozotocin (STZ) (17).
Rats were given 4 days of a recovery period and randomized for blood glucose values before the first cAMP-responsive element–binding protein (CREB) or control antisense oligonucleotides (ASO) injection. Rats with overt diabetes (defined by a glucose value greater than 200 mg/dL) were excluded from the study. Body weight and food consumption were monitored weekly. The food consumed consisted of an HFD (26% carbohydrate, 59% fat, 15% protein calories), in which the major constitute is safflower oil (17), to mimic most closely the situation in a T2D patient. CREB ASO or control ASO was injected at 75 mg/kg semiweekly for 4 weeks. Liver tissue was harvested after an overnight fast and immediately snap-frozen after the animals were killed with a deep isoflurane narcosis. All procedures were approved by the Yale University School of Medicine Institutional Animal Care and Use Committee, the animal care and use committee of an accredited Pfizer vendor, or the Landesamt für Umwelt, Gesundheit und Verbraucherschutz (LUGV) Brandenburg.
Hepatocyte Preparation and Culture
Rat hepatocytes were isolated from healthy male Wistar rats as described previously (18). Hepatocytes were snap-frozen for subsequent RNA preparation or luciferase assays or were used to determine [14C]-citrate uptake.
Real-time RT-PCR
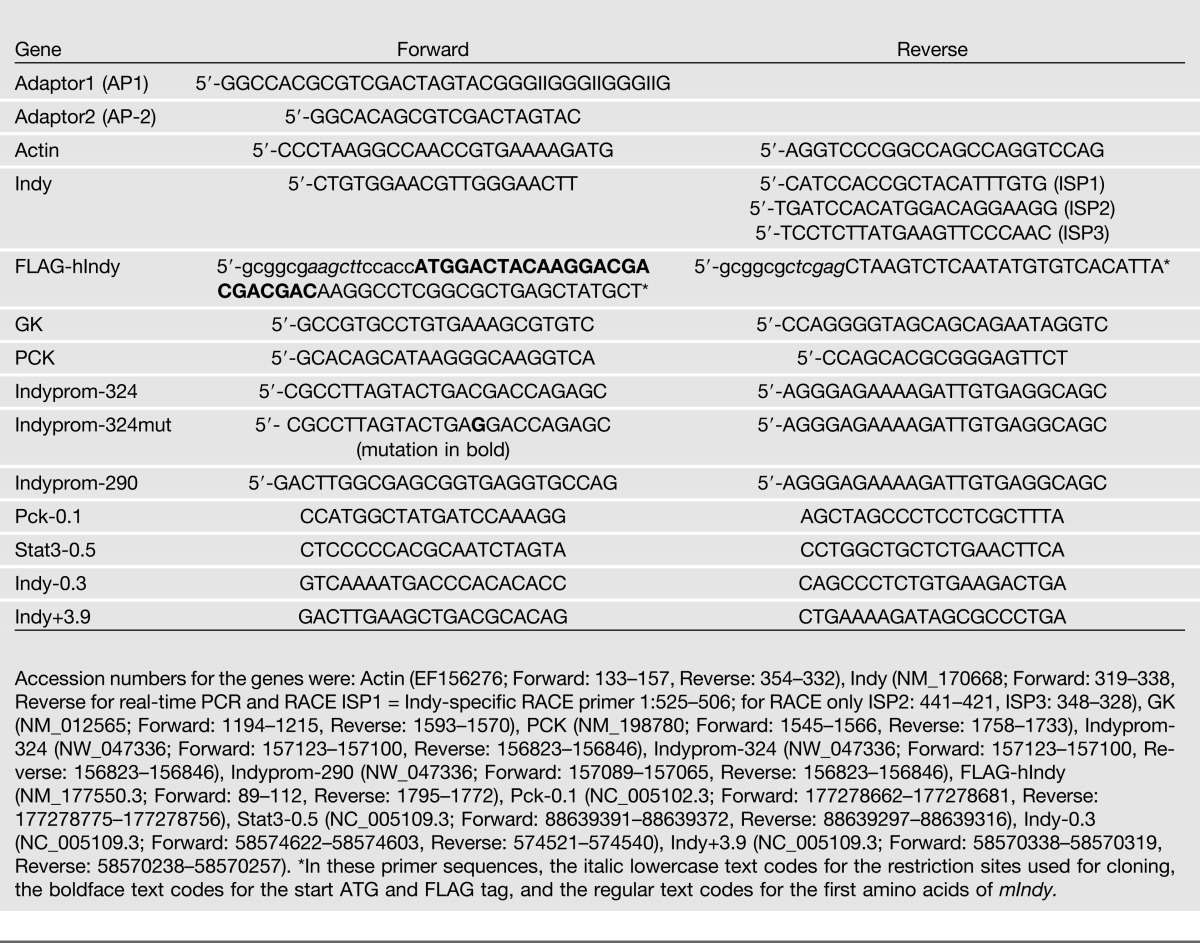
Total RNA was isolated from rat hepatocytes, and 1–5 µg total RNA was reverse-transcribed into cDNA. Real-time PCR was carried out using the oligonucleotides used are listed in Table 1. The expression level was calculated as an n-fold induction of the gene of interest (int) in treated versus control cells with actin (act) as a reference gene according to the formula: fold induction = 2(c-t)int/2(c-t)act.
Table 1.
Oligonucleotide primers
Western Blot
Immunoblots were performed as described (19).
Determination of [14C]-Citrate Uptake in Rat Hepatocytes and Gluconeogenesis From Citrate
Hepatocytes were treated with 0 or 10 nmol/L glucagon for 8 h, as described above. At the end of the stimulation period, they were washed twice with uptake buffer (25 mmol/L HEPES/NaOH [pH 7.5], 140 mmol/L NaCl, 5 mmol/L KCl, 1.8 mmol/L CaCl2, 0.8 mmol/L MgSO4, and 5 mmol/L glucose) and then incubated at room temperature in the same buffer containing 16 μmol/L [14C]-citrate for 15 min. Nonspecific transport and nonspecific binding were determined in the presence of a 1,000-fold excess of unlabeled citrate. Cells were washed twice with ice-cold uptake buffer, and cell-associated radioactivity was released by lysing cells in 0.3 mol/L NaOH (400 µL) in 1% (w/v) SDS and counted.
To determine gluconeogenesis, 1 µCi/mL [14C]-citrate was added to the culture, which was continued for 2 h in presence or absence of glucagon. Glucose in cell culture supernatants was separated from citrate by anion exchange chromatography on Dowex formiate.
Identification of Transcription Initiation Sites by 5′-Rapid Amplification of cDNA Ends
Total RNAs from two different rats was used for 5′-rapid amplification of cDNA ends (RACE) using the 5′-RACE system 2.0 (Life Technologies, Eggenstein, Germany), as described previously (20).
Generation of the Rat mIndy Promoter Constructs
Fragments containing 290 or 324 bp of the putative mIndy promoter were generated from rat genomic DNA by PCR using the primers listed in Table 1. Fragments were cloned in the right orientation into pGL3-basic (Promega, Mannheim, Germany). A mutation in the potential CRE-site in the 324 bp mIndy promotor fragment was introduced by PCR-based site-directed mutagenesis using the primers listed in Table 1.
Hepatocyte Transfection and Luciferase Reporter Gene Assay
Reporter gene assays with transfected primary rat hepatocyte were performed as described previously (21).
Chromatin Immunoprecipitation
Small pieces of fresh liver tissue from three rats underwent cross-linking in 1% formaldehyde for 15 min, followed by quenching with 1/20 volume of 2.5 mol/L glycine solution, and one wash with 1× PBS. Nuclear extracts were prepared by homogenizing in 20 mmol/L HEPES, 0.25 mol/L sucrose, 3 mmol/L MgCl2, 0.2% NP-40, 3 mmol/L β-mercaptoethanol; complete protease inhibitor tablet from Roche, Mannheim, Germany. Chromatin fragmentation was performed by sonication 50 mmol/L HEPES, 1% SDS, and 10 mmol/L EDTA, using a Bioruptor (Diagenode, Seraing, Belgium) for 20 cycles of 30 s at the highest level. Proteins were immunoprecipitated in 50 mmol/L HEPES/NaOH at pH 7.5, 155 mmol/L NaCl, 1.1% Triton X-100, 0.11% Na-deoxycholate, and complete protease inhibitor tablet, using an anti-CREB antibody (sc-186 Lot# F0412; Santa Cruz Biotechnologies). Crosslinking was reversed overnight at 65°C and DNA isolated using phenol/chloroform/isoamyl alcohol. For chromatin immunoprecipitation (ChIP) quantitative (q)PCR, enrichment was measured using SYBR Green PCR Mastermix (Roche) and the ABI 7300 instrument (Applied Biosystems, Life Technologies). Analysis of ChIP samples and the corresponding inputs was performed by the standard curve method and normalization to a nontarget control region of the insulin gene. Primer sequences used for qPCR analyses are given in Table 1.
Generation of a FLAG-Tagged Human mIndy Overexpressing HepG2 Cell Line
The cDNA coding for FLAG-tagged human mIndy was amplified from human hepatocyte cDNA and cloned into the pcDNA3. Clonal HepG2 cells stably expressing human Indy were generated by single-cell cloning and selected with 500 units/mL G-418. To determine lipid synthesis in these cells, they were cultured with 10 nmol/L insulin and 100 μmol/L [14C]-citrate for 8 h. Radiolabeled sterols and fatty acids were extracted by basic and acid hexane extraction, respectively.
Statistical Analysis
A two-tailed Student t test was used to test differences between two groups. One-way ANOVA analysis was performed for multiple comparisons. Values are presented as mean ± SE. P < 0.05 was considered statistically significant.
Results
Induction of mIndy mRNA by Fasting-Related Stimuli in Rat Hepatocytes
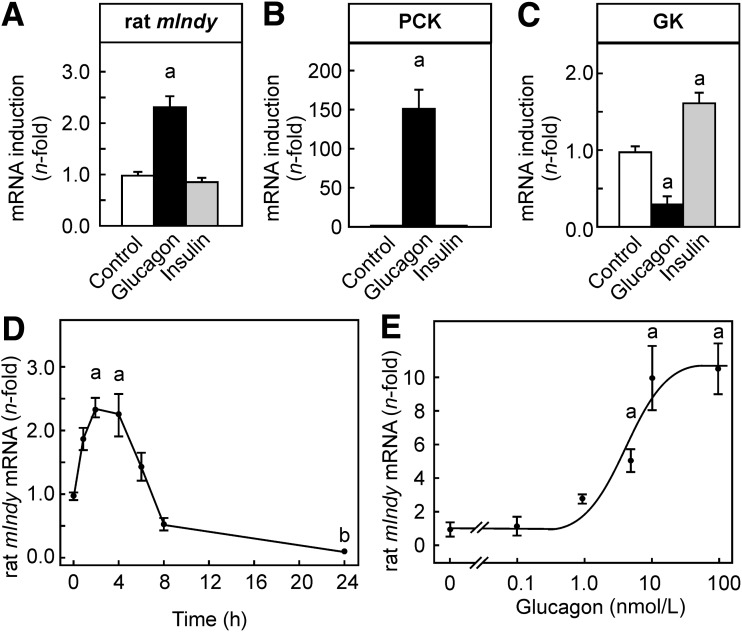
Cultured hepatocytes were stimulated with 10 nmol/L glucagon or 10 nmol/L insulin as a negative control. Hepatocytes were harvested after 2 h. Although stimulation with insulin neither induced nor repressed mIndy mRNA in hepatocytes, glucagon induced mIndy mRNA about 2.5-fold (Fig. 1A). Phosphoenolpyruvate-carboxykinase (PCK) mRNA, which served as a positive control, was also not affected by insulin but was strongly induced by glucagon (Fig. 1B). At the same time, glucokinase, as a prototypical gene that is induced in response to insulin, was induced about twofold (Fig. 1C). However, due to the culture conditions chosen, the induction of glucokinase was comparatively small. To exclude that the lack of insulin-dependent regulation of mIndy expression was attributable to the culture conditions that might obscure smaller insulin effects, the experiment was repeated under conditions that allowed for a much larger induction of glucokinase by insulin (i.e., hepatocytes were starved for insulin for 5.5 h before stimulation with 10 nmol/L insulin). Although glucokinase was strongly induced by insulin under these conditions (33.5- ± 8.1-fold, P < 0.01), insulin still did not affect mIndy expression (0.9- ± 0.2-fold, data not shown).
Figure 1.
Induction of mIndy mRNA by glucagon. Primary rat hepatocytes were isolated and cultured as described in research design and methods. After 16 h of culture, medium was changed, and 10 nmol/L insulin or 10 nmol/L (or the concentration indicated) glucagon were added, as indicated. After 2 h (A–C), 4 h (E), or the time indicated (D), hepatocytes were harvested. The mRNA content of the mIndy (A, D, and E), PCK mRNA as prototypic glucagon-induced gene (B), and glucokinase (GK) mRNA as a prototypic insulin-induced gene (C) was determined by RT-qPCR as described in research design and methods with β-actin as the reference gene. All values were normalized to the mean expression of the respective gene in control cells of the same experiment. Data shown are means ± SEM of the number of determinations indicated obtained in the number of independent experiments and cell preparations given in parentheses: A–C: control n = 51 (12), glucagon n = 42 (12), insulin n = 36 (12); D: 0 h: n = 47 (12) and 2 h: n = 50 (12), all other time points n ≥ 17 (6); E: n = 50 (12) except 5 nmol/L, n = 15 (5). Statistics: one-way ANOVA with post hoc test or Student t test for unpaired samples, as appropriate. a: significantly higher than control, P < 0.05; b: significantly lower than control, P < 0.05.
Induction of rat mIndy mRNA by glucagon was time- and dose-dependent. With 10 nmol/L glucagon, mIndy mRNA was slightly induced as early as 1 h after the stimulus was added (Fig. 1D). The induction was maximal between 2 and 4 h and then gradually declined. Notably, the response was biphasic, with a reduction of mIndy mRNA below the starting level after 8 and 24 h of glucagon stimulation.
Expression of mIndy mRNA was induced by glucagon in the physiological concentration range between 1 and 10 nmol/L, and induction reached a maximum between and 10 nmol/L (Fig. 1E) and had a tendency to decline toward 100 nmol/L. The half-maximal effective concentration of the response to glucagon was ∼2 nmol/L. This dose-response curve closely paralleled the dose-response curve for the prototypic fasting-induced gene PCK in the same experiments (not shown).
Functional Relevance of the Rat mIndy mRNA Induction
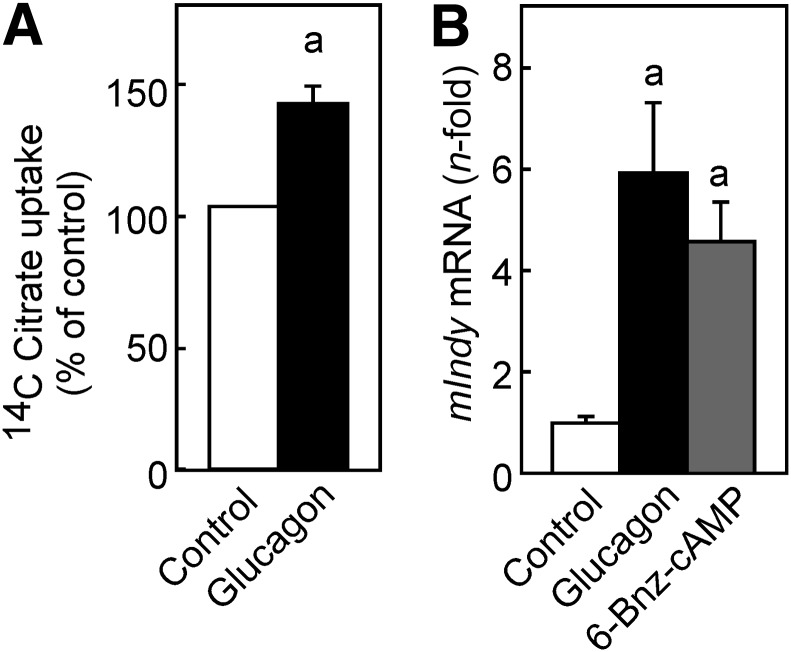
mIndy codes for the di-/tricarboxylate carrier mIndy (NaCT). The preferred substrate of this carrier is citrate. To further elucidate the functional relevance of the mIndy induction by glucagon, [14C]-citrate uptake was determined in control and glucagon-stimulated rat hepatocytes. At a concentration of 16 μmol/L citrate, which is close to the reported Km value for the rat transporter, citrate uptake was increased about 1.5-fold by a prior induction with glucagon for 8 h (Fig. 2A). If hepatocytes were stimulated with glucagon for shorter periods (i.e., 4 h), no significant induction of transport activity was observed (data not shown). This is in accordance with previous observations concerning the induction of mRNA and activity of the prototypic glucagon target gene PCK. The mRNA induction reached a maximum after 2 h and then declined rapidly, whereas the activity lagged behind and remained elevated (22).
Figure 2.
Functional relevance and mechanism of mIndy induction. Hepatocytes were isolated and cultured as detailed in the legend to Fig. 1. A: Hepatocytes were treated with 10 nmol/L glucagon for 8 h, washed with uptake assay buffer, and then incubated at room temperature in the same buffer containing 16 μmol/L [14C]-citrate for 15 min. Unspecific transport/binding was determined in the presence of 16 mmol/L unlabeled citrate. Cellular [14C]-citrate content was determined after 15 min, as detailed in research design and methods. Values are given as percentage of specific [14C]-citrate uptake of untreated control cells. Data shown are means ± SEM of 4 independent experiments performed in triplicate. Statistics: Student t test for unpaired samples. a: significantly higher than control, P < 0.05. B: Hepatocytes were treated with glucagon or the cAMP analog 6-Bnz-cAMP, and mIndy mRNA was quantified as detailed in the legend to Fig. 1. All values were normalized to the mean expression of the mIndy gene in control cells of the same experiment. Data shown are means ± SEM of 21 determinations in 7 independent experiments and cell preparations (control and glucagon) or 15 determinations in 5 independent experiments and cell preparations (6-Bnz-cAMP). Statistics: Student t test for unpaired samples. a: significantly higher than control, P < 0.05.
Rat mIndy Induction by Glucagon Was cAMP-Dependent
The principal signaling cascade downstream of the glucagon receptor is a Gs-dependent activation of adenylate cyclase and a subsequent activation of PKA due to increased cAMP concentrations. Therefore, whether PKA-activating agents could mimic the glucagon effect in elevating mIndy mRNA was tested next. In accordance with expectations, the PKA-activator 6-Bnz-cAMP significantly increased the rat mIndy mRNA although to a somewhat lesser extent than 10 nmol/L glucagon, which served as positive control (Fig. 2B).
Characterization of the mIndy Promoter
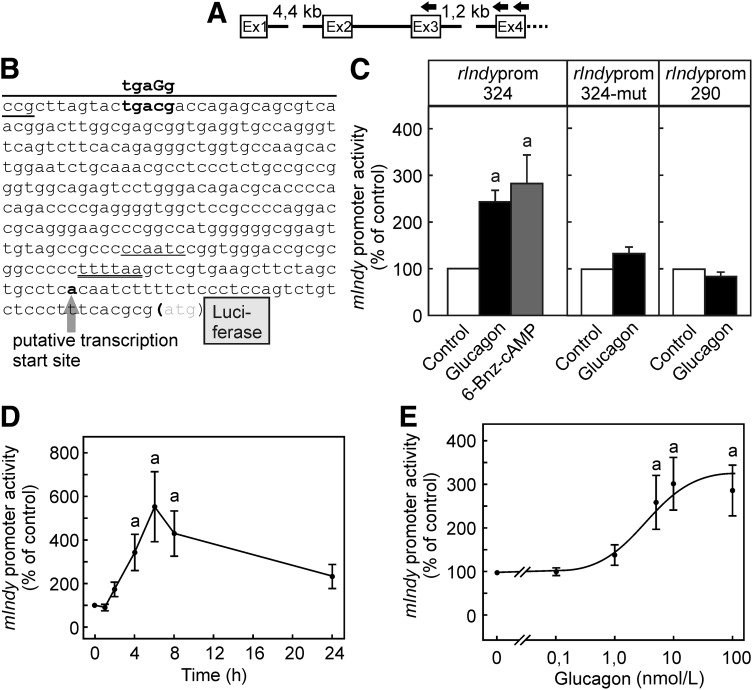
5′-RACE experiments were performed to identify the transcription start site with gene-specific primers for reverse transcription in exon 4 and nested PCR primers that were located in the fourth and third exon (Fig. 3A). A possible transcription start site that is located ∼16 nucleotides upstream of the 5′-end of the published mRNA (39 bp upstream of the start ATG) was found in five of seven clones that contained sequences continuing into the first exon (Fig. 3B). One clone each was found that terminated at the published 5′-end (23 bp upstream of the start ATG) and one that ended ∼110 bp upstream. The region upstream of the most frequent start point contains a putative CAAT-box motif. The region upstream of the most frequent start point was tentatively assigned as a promoter region. A reporter gene construct was generated by cloning a stretch of 324 bp upstream of the start ATG of the rat mIndy gene, including the putative transcription start site, in front of luciferase in the vector pGL3-basic (Fig. 3B). The reporter gene expression under the control of this rat mIndy promoter fragment in rat hepatocytes was significantly activated by glucagon and the PKA activator 6-Bnz-cAMP (Fig. 3C).
Figure 3.
Characterization of the rat mIndy promoter. A: The putative start site and upstream promoter region of the rat mIndy gene were determined by 5′-RACE using gene-specific primers in the fourth and third exon. B: The most frequent transcription start site (bold) was located 39 bp upstream of the start ATG, upstream of this site were a putative TATA-box (double underlined) and a putative CAAT-box (underlined). A reporter gene construct was generated by cloning the 324 bp (rat mIndyprom-324) upstream of the start ATG in front of a luciferase reporter. A putative CREB-binding site (bold) was mutated within the core consensus sequence (rat mIndyprom-324mut) or was deleted by truncation of the 5′ end (over-lined, rat mIndyprom-290). C: Primary cultures of rat hepatocytes were transiently transfected immediately after seeding with 1 μg of a plasmid containing the 324-bp wild-type promoter fragment of the rat mIndy gene (left panel) or the mutated (middle panel) or truncated (right panel) promoter fragment. After 16 h, cells were treated with glucagon as indicated. Firefly luciferase activity was measured in the cell lysate as detailed in research design and methods. D: Time dependence: Incubation with 10 nmol/L glucagon for the times indicated. Values are given as percentage of the luciferase activity of untreated controls at 0 min. E: Dose dependence: Hepatocytes were treated for 4 h with the glucagon concentrations indicated. Data are shown as means ± SEM of 5 (C) or 4 (D and E) independent experiments performed in triplicate. Statistics: Student t test for unpaired samples. a: significantly higher than control, P < 0.05.
Identification of a Promoter Element Mediating Rat mIndy mRNA Transcription
Reporter gene activity was enhanced by glucagon in a time- and dose-dependent manner (Fig. 3D and E). The dose-response curve of the induction of the reporter gene activity closely reflected the dose-response curve for the induction of the endogenous rat mIndy mRNA. Similar to what was observed with the endogenous mRNA, reporter gene activity increased rapidly after the addition of glucagon. In contrast with the endogenous mRNA, after reaching a maximum at 4 h, luciferase reporter gene activity did not rapidly decline after but remained elevated over the subsequent 20 h.
A nuclear target of PKA-dependent regulation of promoter activity is the protein CREB. This transcription factor binds to a cis-acting element called cAMP-responsive element (CRE). In silico analysis of the 324 bp rat mIndy promoter fragment revealed a potential CRE close to the 5′-end (Fig. 3B). Therefore, a second construct was generated that was shortened by 34 nucleotides and hence was missing the CRE. In contrast to the full-length construct, no glucagon-dependent induction of the reporter gene activity was observed in hepatocytes transfected with the truncated construct (Fig. 3C, last panel). Truncation, in addition to removing the CRE, might have resulted in a loss of other functionally important sequence elements in the promoter. Therefore, an additional reporter gene construct was generated that retained the full length of the original active 324 bp construct in which, however, the CRE was functionally inactivated by a C to G mutation within the core consensus site (Fig. 3B). Similar to what was observed with the truncated construct, mutation of the CRE core sequence largely abolished the glucagon-dependent induction of the reporter gene under control of the mutated rat mIndy promoter (Fig. 3C, middle panel).
CREB-ChIP in Rat Liver
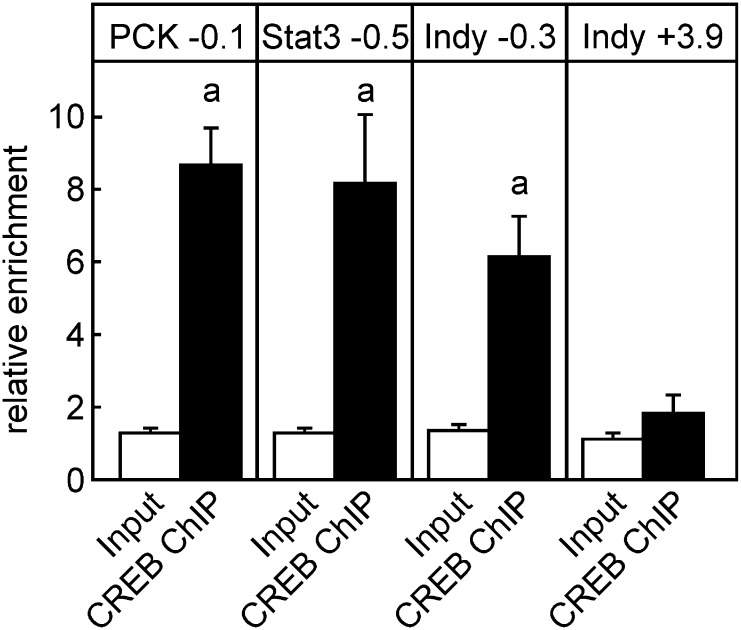
To elucidate the interaction between CREB as a transcriptional regulator and its putative target gene mIndy in vivo, we used ChIP in rat livers. Known binding sites of CREB near the PCK and signal transducer and activator of transcription-3 (Stat3) genes served as positive controls (23), whereas a region downstream of the putative CREB-binding site within the mIndy gene served as negative control. We found that CREB occupied the mIndy promoter at the proposed site nearly as strongly as it did near the PCK and Stat3 gene (Fig. 4). No enrichment was observed in the control region of mIndy.
Figure 4.
Determination of CREB binding to the rat mIndy by ChIP. ChIP was performed with tissue homogenates from rat livers as described in research design and methods. Known CREB-binding sites in the PCK and STAT genes served as positive controls (23), and a region downstream of the putative CREB-binding site within the mIndy promoter served as negative control. a: significantly enriched compared with input, P < 0.05.
Significance of CREB-Induced mIndy Expression in Fasting In Vivo
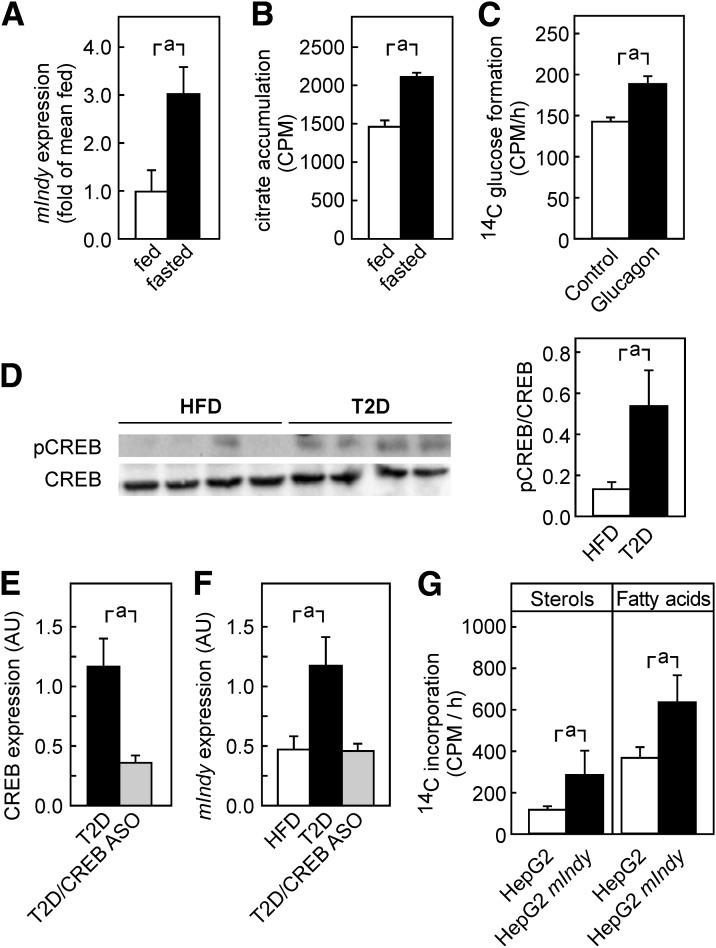
Glucagon is the major hormone controlling hepatic gluconeogenesis and, thus, hepatic glucose output through the induction of CREB during an initial phase of fasting (24, 25). Therefore, hepatic mIndy expression was assessed after an overnight fast in rats. In this setting, mIndy expression was induced threefold (Fig. 5A). To establish a functional effect, citrate uptake was determined in fed versus fasted rats after an intraperitoneal injection of [14C]-citrate. Overnight-fasted rats integrated about 30% more citrate into the liver than fed rats (Fig. 5B). Cytoplasmic citrate can be converted by ATP-citrate lyase to acetyl-CoA and oxaloacetate, the latter opening into gluconeogenesis. Thus, we studied whether glucagon treatment in primary rat hepatocytes increased the incorporation of [14C]-labeled citrate into glucose. Interestingly, glucagon significantly enhanced the formation of glucose from citrate (Fig. 5C).
Figure 5.
CREB-dependent mIndy induction in a rat model of T2D. A: mIndy expression was determined in fed or overnight-fasted rats. B: Citrate uptake in the livers of overnight-fasted rats was increased when injected with [14C]-citrate intraperitoneally. C: Glucagon enhanced glucose generation from citrate in primary rat hepatocytes. D: Rats were kept on an HFD. In addition, one group was injected with STZ (T2D). In this setting, the p-CREB-to-CREB ratio was increased in T2D rats. E: T2D rats were treated with CREB-ASO or control-ASO. CREB expression and mIndy expression were determined by RT-qPCR. In the T2D model, PCK was reduced CREB-ASO–treated rats by 30 ± 3% (P < 0.05, data not shown). F: CREB-phosphorylation was enhanced in livers of T2D diabetic rats compared with the HFD-fed controls. G: Overexpression of INDY in HepG2 cells leads to an increase in citrate-induced lipid and sterol synthesis. a: P < 0.05, Student test for two group comparisons, one-way ANOVA for multiple comparisons.
Significance of CREB-Induced mIndy Expression in a Rat Model of T2D In Vivo
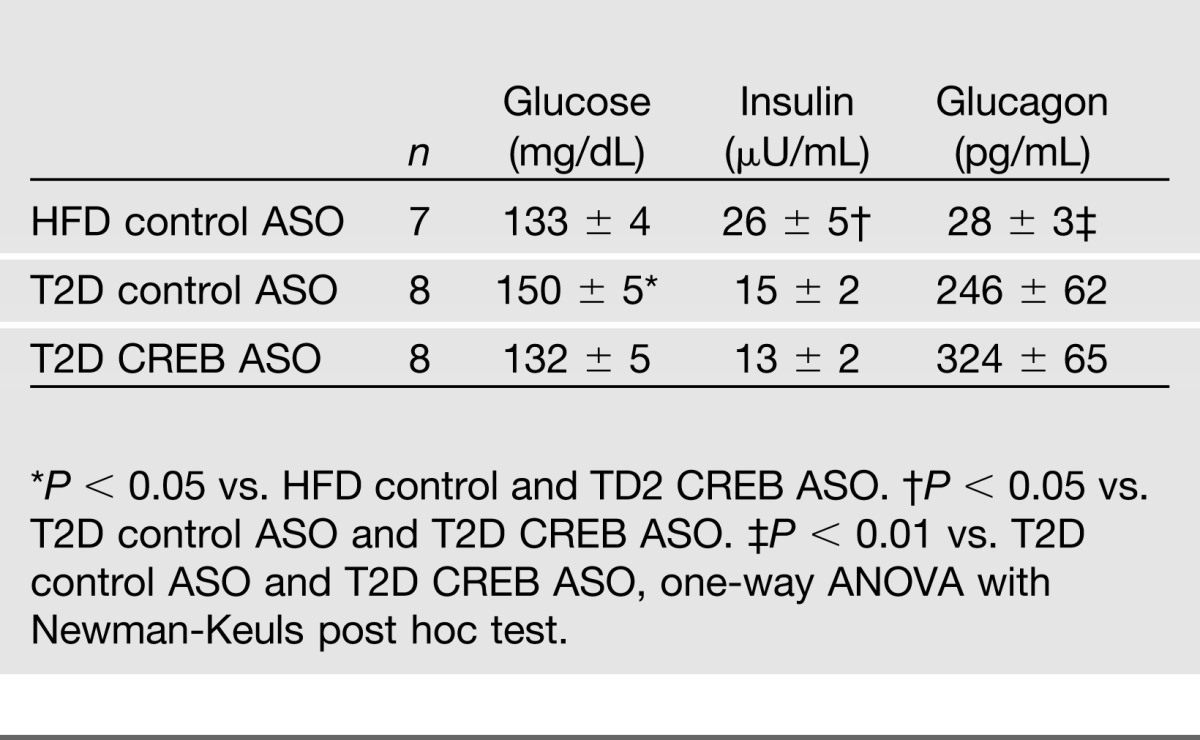
CREB is constitutively activated in insulin-deficient diabetes. To establish the pathophysiological significance of our findings, an animal model of STZ-induced, HFD-fed diabetes was used, mimicking most closely the situation in T2D patients, who are characterized not only by a relative lack of insulin but also by hyperglucagonemia and subsequent activation of CREB (26). These rats were compared with rats fed a pure HFD, without STZ treatment and STZ-treated, HFD-fed rats in which CREB was depleted by CREB-ASO. Biochemical serum parameters of mice are given in Table 2. The T2D rat model with control ASO and the T2D rat model with CREB-ASO both developed marked hyperglucagonemia. In accordance with the assumption that CREB is constitutively activated in T2D, the phospho-CREB-to-CREB ratio was significantly elevated in STZ-treated versus HFD controls (Fig. 5D). CREB-ASO reduced CREB protein expression by 50% compared with control-ASO (P < 0.01, data not shown), and CREB mRNA expression was reduced by 74 ± 3% compared with the T2D rat model treated with control-ASO (P < 0.01; Fig. 5E). In this setting, PCK was reduced by 30 ± 3% (P < 0.05) in the CREB-ASO–treated rats (data not shown). mIndy expression was induced by the treatment of STZ compared with the solely HFD-fed rats with control-ASO. This induction was completely prevented by the depletion of CREB (Fig. 5F). Thus, deficiency of CREB was able to prevent the induction of mIndy-induced by hyperglucagonemia. To further test the consequences of increased mIndy expression for hepatic lipid metabolism, an mIndy-overexpressing HepG2 cell line was generated. mIndy expression was fourfold higher in this cell line than in untransfected HepG2 cells. Fatty acid and sterol synthesis in this setting was induced approximately twofold in the mIndy-overexpressing cells (Fig. 5G)
Table 2.
Biochemical serum parameters of rats
Discussion
Mechanism of Glucagon-Dependent Induction of mIndy
Our study is the first to identify glucagon as a transcriptional regulator of the rat mIndy gene and to describe a promoter sequence of mIndy that is located upstream of the most frequent transcription start site, which was determined by 5′-RACE (Fig. 3). Evidence is provided for rat mIndy being a CREB-dependent glucagon target gene, because treatment of primary cultured rat hepatocytes with glucagon (Fig. 1) induced mIndy mRNA, which codes for the plasma membrane citrate transporter mIndy (NaCT). As a consequence, citrate uptake into glucagon-stimulated rat hepatocytes was increased (Fig. 2A). The induction of mIndy was cAMP-dependent, as shown by the mIndy induction in response to the cell-permeable cAMP analog 6-Bnz-cAMP (Fig. 2B). cAMP activated PKA, which can in turn phosphorylate and activate the transcription factor CREB. In accordance with the assumption that CREB phosphorylation and direct activation of the rat mIndy promoter was the mechanism underlying the induction of mIndy mRNA, a cAMP-responsive element consensus sequence was identified by in silico analysis of the rat mIndy promoter 5′ upstream of the putative transcription start site (Fig. 3B). A reporter gene construct containing this site was activated by glucagon or 6-Bnz-cAMP (Fig. 3C), whereas truncation as well as site-directed mutagenesis of the consensus sequence of this site resulted in an almost complete elimination of the glucagon-dependent promoter activation (Fig. 3C). Finally, ChIP studies showed a strong occupation of this mIndy promoter site by CREB, pinpointing CREB as the transcription factor that mediates the induction of mIndy by glucagon.
Comparable with the induction of the prototypic glucagon target gene in hepatocytes, the gluconeogenic key enzyme PCK, mIndy mRNA levels were elevated only transiently, with a maximum between 2 and 4 h, despite the continued presence of glucagon in our cell culture assays. After prolonged stimulation with glucagon, mIndy mRNA levels decreased below starting levels (Fig. 1D). This might be due to rapid degradation of glucagon by hepatocytes in culture (27,28). One alternative possible explanation might be a pattern that is known from PCK activation by glucagon: Glucagon not only induces mRNA of PCK but also activates its degradation. Possibly, a similar mechanism mediates the effect on mIndy mRNA (29).
Physiological Significance of CREB-Mediated Glucagon-Induced mIndy Expression
Glucagon is the major hormone controlling hepatic gluconeogenesis, and thus, hepatic glucose output through the induction of CREB during an initial phase of fasting (24,25). We show that mIndy expression was induced after an overnight fast in rats. Accordingly, our data show that the uptake of citrate into the liver was increased in fasted rats, suggesting that the induction of mIndy leads to an increased uptake of citrate into the liver. Citrate can be converted into oxaloacetate as a carbon source for gluconeogenesis. Accordingly, our data show that glucagon increased uptake of citrate and the incorporation of citrate into glucose in primary rat hepatocytes in vitro. Previous studies have shown that the knockout of Indy in mice reduced hepatic glucose production. Taken together, these data suggest that glucagon-induced mIndy expression may contribute to the regulation of gluconeogenesis in the fasted liver by supplying carbon sources as building blocks for the generation of glucose.
We have previously shown that mIndy expression was reduced in 36-h starved mice. This seemingly discrepant finding might be explained by the fact that glucagon effects on gluconeogenesis are attenuated during late fasting (25), when the CREB-regulated transcription coactivator 2 (CRTC2, TORC2) is downregulated after an initial activation. This explanation is supported by our data showing that glucagon induced mIndy initially, followed by a decrease in expression in primary hepatocytes. Clearly, more studies are needed to decipher the time course and mechanism of this finding.
Pathophysiological Significance of the CREB-Mediated Glucagon-Induced mIndy Induction
To test if our findings also have pathophysiological implications, we studied a rat model of T2D with or without knockdown of CREB by ASOs. The model was chosen because T2D is characterized not only by an absolute or relative lack of insulin but also by failure to repress glucagon secretion. In this setting, CREB has been shown to be constitutively activated (26). In line with the hypothesis, CREB-ASO resulted in reduced CREB expression, PCK expression, and reduced mIndy mRNA levels by more than 50% compared with the control-ASO–treated diabetic rats. Our present and previous data (12,13) show that increased expression of mIndy enhances the uptake of citrate into the cytoplasm, whereas reducing mIndy expression reduced cellular import of citrate. Citrate is a central metabolite, in both cytosolic and in mitochondrial metabolism, by connecting carbohydrate catabolism and lipogenesis. Citrate is the main carbon source of fatty acid and cholesterol synthesis and acts as an allosteric activator of acetyl-CoA carboxylase. Moreover, cytosolic citrate furnishes NADPH generation via malic enzyme for lipogenesis (30). Overexpression of mIndy in HepG2 cells resulted in an increase in intracellular fatty acid and sterol synthesis. In line with this, enhancing the activity of citrate transport by Indy in HepG2 cells has been shown to enhance citrate-induced lipid synthesis (14). It is tempting to speculate that in conditions with increased CREB activity, such as in T2D, increased mIndy expression could contribute to ectopic lipid accumulation and aggravate nonalcoholic fatty liver disease, which is associated with T2D (31). The increase in glucagon-induced hepatic glucose production from citrate, as observed in our studies, might further contribute to this association. In line with this notion, knockdown of CREB (17) in rats as well as mIndy in mice (13) has been shown to reduce diet-induced hepatic lipid accumulation and hepatic glucose production. Reducing mIndy activity in the setting of T2D might therefore be an interesting target to control excessive hepatic lipid accumulation and hepatic glucose production.
In summary, we have shown that mIndy is a CREB-dependent target gene of glucagon in rats. Our work describes a proximal promoter sequence of mIndy that is located upstream of the most frequent transcription start site, which was determined by 5′-RACE. Induction of mIndy was observed in an early phase of fasting and in a rat model of T2D. In these conditions, mIndy might be involved in the control of hepatic glucose and lipid metabolism. Reducing mIndy activity in the setting of T2D might therefore be an interesting target to control excessive hepatic lipid accumulation and hepatic glucose production.
Article Information
Acknowledgments. The authors thank ISIS Pharmaceuticals for kindly providing the CREB-ASO and Patrick Schmerler (Institute of Pharmacology, Charité University Medicine Berlin) for providing rat liver tissue for ChIP studies. The contribution of Lucretia Hernandez-Valenciano, who performed part of the initial screening experiments and helped to construct a reporter gene vector as part of her bachelor's thesis, is gratefully acknowledged.
Funding. This work was funded in part by project grants from the German Research Foundation (Emmy Noether grant SCHU 2546/1-1) and the Einstein Foundation Berlin (grant A-2010-83) to M.S.; the U.S. Public Health Service (R01-DK-40936, R24-DK-085638, P30-DK-45735) to G.I.S; and the German Diabetes Association, the German Research Foundation (DFG, BI1292/4-1), and the Fritz-Thyssen Stiftung (Az 10.12.2.140) to A.L.B.
Duality of Interest. No potential conflicts of interest relevant to this article were reported.
Author Contributions. F.N.-R. researched data and supervised most of the research work. S.L., M.K., J.H., R.J.P., D.M.E., D.P., D.M.W., S.B., C.v.L., and A.T. researched data. A.P.-N.-R. generated the HepG2-mIndy cell line. G.P.P. and A.L.B. researched data, supervised most of the research work, planned the study, and wrote the manuscript. M.S. researched data and reviewed the manuscript. A.F.H.P and G.I.S. reviewed the manuscript. A.L.B. is the guarantor of this work and, as such, had full access to all the data in the study and takes responsibility for the integrity of the data and the accuracy of the data analysis.
References
- 1.Helfand SL, Inouye SK. Rejuvenating views of the ageing process. Nat Rev Genet 2002;3:149–153 [DOI] [PubMed] [Google Scholar]
- 2.López-Lluch G, Irusta PM, Navas P, de Cabo R. Mitochondrial biogenesis and healthy aging. Exp Gerontol 2008;43:813–819 [DOI] [PMC free article] [PubMed] [Google Scholar]
- 3.Fontana L, Partridge L, Longo VD. Extending healthy life span—from yeast to humans. Science 2010;328:321–326 [DOI] [PMC free article] [PubMed] [Google Scholar]
- 4.Rogina B, Reenan RA, Nilsen SP, Helfand SL. Extended life-span conferred by cotransporter gene mutations in Drosophila. Science 2000;290:2137–2140 [DOI] [PubMed] [Google Scholar]
- 5.Fei YJ, Liu JC, Inoue K, et al. Relevance of NAC-2, an Na+-coupled citrate transporter, to life span, body size and fat content in Caenorhabditis elegans. Biochem J 2004;379:191–198 [DOI] [PMC free article] [PubMed] [Google Scholar]
- 6.Wang PY, Neretti N, Whitaker R, et al. Long-lived Indy and calorie restriction interact to extend life span. Proc Natl Acad Sci U S A 2009;106:9262–9267 [DOI] [PMC free article] [PubMed] [Google Scholar]
- 7.Mancusso R, Gregorio GG, Liu Q, Wang DN. Structure and mechanism of a bacterial sodium-dependent dicarboxylate transporter. Nature 2012;491:622–626 [DOI] [PMC free article] [PubMed] [Google Scholar]
- 8.Inoue K, Fei YJ, Huang W, Zhuang L, Chen Z, Ganapathy V. Functional identity of Drosophila melanogaster Indy as a cation-independent, electroneutral transporter for tricarboxylic acid-cycle intermediates. Biochem J 2002;367:313–319 [DOI] [PMC free article] [PubMed] [Google Scholar]
- 9.Knauf F, Mohebbi N, Teichert C, et al. The life-extending gene Indy encodes an exchanger for Krebs-cycle intermediates. Biochem J 2006;397:25–29 [DOI] [PMC free article] [PubMed] [Google Scholar]
- 10.Knauf F, Rogina B, Jiang Z, Aronson PS, Helfand SL. Functional characterization and immunolocalization of the transporter encoded by the life-extending gene Indy. Proc Natl Acad Sci U S A 2002;99:14315–14319 [DOI] [PMC free article] [PubMed] [Google Scholar]
- 11.Inoue K, Zhuang L, Ganapathy V. Human Na+ -coupled citrate transporter: primary structure, genomic organization, and transport function. Biochem Biophys Res Commun 2002;299:465–471 [DOI] [PubMed] [Google Scholar]
- 12.Gopal E, Miyauchi S, Martin PM, et al. Expression and functional features of NaCT, a sodium-coupled citrate transporter, in human and rat livers and cell lines. Am J Physiol Gastrointest Liver Physiol 2007;292:G402–G408 [DOI] [PubMed] [Google Scholar]
- 13.Birkenfeld AL, Lee HY, Guebre-Egziabher F, et al. Deletion of the mammalian INDY homolog mimics aspects of dietary restriction and protects against adiposity and insulin resistance in mice. Cell Metab 2011;14:184–195 [DOI] [PMC free article] [PubMed] [Google Scholar]
- 14.Inoue K, Zhuang L, Maddox DM, Smith SB, Ganapathy V. Human sodium-coupled citrate transporter, the orthologue of Drosophila Indy, as a novel target for lithium action. Biochem J 2003;374:21–26 [DOI] [PMC free article] [PubMed] [Google Scholar]
- 15.Martinez-Beamonte R, Navarro MA, Guillen N, et al. Postprandial transcriptome associated with virgin olive oil intake in rat liver. Front Biosci (Elite Ed) 2011;3:11–21 [DOI] [PubMed] [Google Scholar]
- 16.Henneman DH, Shoemaker WC. Effect of glucagon and epinephrine on regional metabolism of glucose, pyruvate, lactate, and citrate in normal conscious dogs. Endocrinology 1961;68:889–898 [DOI] [PubMed] [Google Scholar]
- 17.Erion DM, Ignatova ID, Yonemitsu S, et al. Prevention of hepatic steatosis and hepatic insulin resistance by knockdown of cAMP response element-binding protein. Cell Metab 2009;10:499–506 [DOI] [PMC free article] [PubMed] [Google Scholar]
- 18.Püschel GP, Kirchner C, Schröder A, Jungermann K. Glycogenolytic and antiglycogenolytic prostaglandin E2 actions in rat hepatocytes are mediated via different signalling pathways. Eur J Biochem 1993;218:1083–1089 [DOI] [PubMed] [Google Scholar]
- 19.Birkenfeld AL, Lee HY, Majumdar S, et al. Influence of the hepatic eukaryotic initiation factor 2alpha (eIF2alpha) endoplasmic reticulum (ER) stress response pathway on insulin-mediated ER stress and hepatic and peripheral glucose metabolism. J Biol Chem 2011;286:36163–36170 [DOI] [PMC free article] [PubMed] [Google Scholar]
- 20.Neuschäfer-Rube F, Möller U, Püschel GP. Structure of the 5′-flanking region of the rat prostaglandin F(2alpha) receptor gene and its transcriptional control functions in hepatocytes. Biochem Biophys Res Commun 2000;278:278–285 [DOI] [PubMed] [Google Scholar]
- 21.Wieneke N, Hirsch-Ernst KI, Kuna M, Kersten S, Püschel GP. PPARalpha-dependent induction of the energy homeostasis-regulating nuclear receptor NR1i3 (CAR) in rat hepatocytes: potential role in starvation adaptation. FEBS Lett 2007;581:5617–5626 [DOI] [PubMed] [Google Scholar]
- 22.Püschel GP, Christ B. Inhibition by PGE2 of glucagon-induced increase in phosphoenolpyruvate carboxykinase mRNA and acceleration of mRNA degradation in cultured rat hepatocytes. FEBS Lett 1994;351:353–356 [DOI] [PubMed] [Google Scholar]
- 23.Martianov I, Choukrallah MA, Krebs A, et al. Cell-specific occupancy of an extended repertoire of CREM and CREB binding loci in male germ cells. BMC Genomics 2010;11:530. [DOI] [PMC free article] [PubMed] [Google Scholar]
- 24.Herzig S, Long F, Jhala US, et al. CREB regulates hepatic gluconeogenesis through the coactivator PGC-1. Nature 2001;413:179–183 [DOI] [PubMed] [Google Scholar]
- 25.Liu Y, Dentin R, Chen D, et al. A fasting inducible switch modulates gluconeogenesis via activator/coactivator exchange. Nature 2008;456:269–273 [DOI] [PMC free article] [PubMed] [Google Scholar]
- 26.Dentin R, Liu Y, Koo SH, et al. Insulin modulates gluconeogenesis by inhibition of the coactivator TORC2. Nature 2007;449:366–369 [DOI] [PubMed] [Google Scholar]
- 27.Shankar TP, Drake S, Solomon SS. Insulin resistance and delayed clearance of peptide hormones in cirrhotic rat liver. Am J Physiol 1987;252:E772–E777 [DOI] [PubMed] [Google Scholar]
- 28.Authier F, Desbuquois B. Degradation of glucagon in isolated liver endosomes. ATP-dependence and partial characterization of degradation products. Biochem J 1991;280:211–218 [DOI] [PMC free article] [PubMed] [Google Scholar]
- 29.Christ B, Nath A, Jungermann K. Mechanism of the inhibition by insulin of the glucagon-dependent activation of the phosphoenolpyruvate carboxykinase gene in rat hepatocyte cultures. Action on gene transcription, mRNA level and -stability as well as hysteresis effect. Biol Chem Hoppe Seyler 1990;371:395–402 [DOI] [PubMed] [Google Scholar]
- 30.Wakil SJ, Abu-Elheiga LA. Fatty acid metabolism: target for metabolic syndrome. J Lipid Res 2009;50(Suppl.):S138–S143 [DOI] [PMC free article] [PubMed] [Google Scholar]
- 31.Birkenfeld AL, Shulman GI. Non alcoholic fatty liver disease, hepatic insulin resistance and type 2 diabetes. Hepatology 8 August 2013. [Epub ahead of print] [DOI] [PMC free article] [PubMed] [Google Scholar]


